Beyond natural numbers: negative number representation in parietal cortex
- 1 Stanford University School of Education, Stanford University, Stanford, CA, USA
- 2 Department of Psychiatry and Behavioral Sciences, Stanford University, Stanford, CA, USA
- 3 Symbolic Systems Program, Stanford University, Stanford, CA, USA
- 4 Department of Neurology and Neurological Sciences, Stanford University, Stanford, CA, USA
- 5 Program in Neuroscience, Stanford University, Stanford, CA, USA
Unlike natural numbers, negative numbers do not have natural physical referents. How does the brain represent such abstract mathematical concepts? Two competing hypotheses regarding representational systems for negative numbers are a rule-based model, in which symbolic rules are applied to negative numbers to translate them into positive numbers when assessing magnitudes, and an expanded magnitude model, in which negative numbers have a distinct magnitude representation. Using an event-related functional magnetic resonance imaging design, we examined brain responses in 22 adults while they performed magnitude comparisons of negative and positive numbers that were quantitatively near (difference <4) or far apart (difference >6). Reaction times (RTs) for negative numbers were slower than positive numbers, and both showed a distance effect whereby near pairs took longer to compare. A network of parietal, frontal, and occipital regions were differentially engaged by negative numbers. Specifically, compared to positive numbers, negative number processing resulted in greater activation bilaterally in intraparietal sulcus (IPS), middle frontal gyrus, and inferior lateral occipital cortex. Representational similarity analysis revealed that neural responses in the IPS were more differentiated among positive numbers than among negative numbers, and greater differentiation among negative numbers was associated with faster RTs. Our findings indicate that despite negative numbers engaging the IPS more strongly, the underlying neural representation are less distinct than that of positive numbers. We discuss our findings in the context of the two theoretical models of negative number processing and demonstrate how multivariate approaches can provide novel insights into abstract number representation.
Introduction
How are abstract mathematical concepts represented in the brain? Negative integers are among the earliest abstract concepts encountered in mathematics curricula. Unlike positive numbers, negative numbers have no obvious perceptual referents, and therefore, children can struggle when learning about them (Liebeck, 1990; Moreno and Mayer, 1999). Nevertheless, most adults can work with negative numbers, making them an ideal test case for investigating the representation of relatively well-developed abstract mathematical concepts. In the past 50 years, researchers have uncovered many behavioral, cognitive, and neural properties associated with positive numbers; much less is known about the representation of negative numbers.
A standard paradigm for investigating mental representations of positive numbers has participants quickly select which of two numbers is quantitatively larger or smaller (Moyer and Landauer, 1967). A consistent finding is that participants are slower to decide among near distance pairs (2 vs. 4) than far distance pairs (2 vs. 9). This distance effect is thought to reflect an analog magnitude representation for positive numbers that follows Weber’s law (Dehaene, 2003). Research on negative integers has also shown similar distance effects. For example, Tzelgov et al. (2009) manipulated distance as a continuous variable (from 1 to 8) and found parallel linear slopes for positive and negative numbers, but longer overall reaction times (RTs) for negative numbers. Varma and Schwartz (2011) compared near distance pairs (distance of 2 or 3) and far distance pairs (distance of 7 or 8), and found parallel distance effects for negative and positive numbers, with increased overall RT for negatives. Consistently, participants are slower for negative than positive numbers, even when polarity is marked by font color instead of a sign (Tzelgov et al., 2009) and when sign and number are presented sequentially (Ganor-Stern et al., 2010).
Two general accounts of negative number processing have been proposed in the behavioral literature (Varma and Schwartz, 2011). Each provides a different account to explain the findings that negative numbers show a distance effect and take longer to compare than positive numbers. The first proposes that participants reason about negative numbers by applying abstract rules on top of an existing magnitude representation of positive integers (Fischer and Rottman, 2005; Shaki and Petrusic, 2005; Ganor-Stern and Tzelgov, 2008; Tzelgov et al., 2009). In this rule-based model, negative numbers are first transformed into positive numbers for magnitude comparison, and individuals do not represent negative number magnitudes in their own right. The application of rules explains why the negative numbers take longer to compare than the positives. Supporting the rule-based account, Fischer and Rottman (2005) found that when judging whether a number was above or below zero, participants’ RTs were affected by the absolute magnitude of the number for positives, but not for negatives. This suggests that for negatives, participants were only considering polarity, while for positives they considered magnitude. Additionally, Ganor-Stern and Tzelgov (2008) and Tzelgov et al. (2009) explored the semantic congruence effect with positive and negative numbers. In this effect, participants are faster to make “lesser” magnitude judgments for small numbers and “greater” judgments for large numbers. The authors found a semantic congruence effect for positive comparisons but not for negative comparisons. Fischer and Rottman (2005) looked at the SNARC effect, in which participants are faster to make parity judgments with their left hands for small numbers and with their right hand for large numbers. They found a traditional SNARC effect for positive numbers, but an inverse SNARC effect for negative numbers. Participants were faster to use their left hands to make parity judgment responses for large negatives (e.g., −1), and faster to use their right hand to respond to small negatives (e.g., −9). This finding suggests that participants may strip the sign from the negative number and make judgments about the resulting positive numbers. These results are consistent with the proposal that participants use rules to process negative numbers.
The second, expanded magnitude, model proposes that negative numbers are represented as magnitudes in their own right (Fischer, 2003; Varma and Schwartz, 2011). In this model, “−3” is encoded as a magnitude distinct from “3.” However, because most individuals have considerably less experience with negative numbers, the representations for negative numbers may be less-refined than those of positive numbers. By this account, negative numbers take longer to compare than positives because they have less resolution (Varma and Schwartz, 2011). Supporting an expanded magnitude model, Fischer (2003) found that when adults compared two negative numbers, they were faster when the digit magnitudes followed the canonical order of the number line (e.g., −9, −4), than when ordered by absolute value (e.g., −4, −9). In contrast to Tzelgov and colleagues (Ganor-Stern and Tzelgov, 2008; Tzelgov et al., 2009), Varma and Schwartz (2011) found a polarity-dependent semantic congruence effect. For positives, participants were faster to judge the greater number, and for negatives, they were faster to judge the lesser number. This suggests negatives are considered small in comparison to positive numbers. Additionally, for mixed magnitude comparisons which involved a positive and a negative number, Varma and Schwartz (2011) and Krajcsi and Igacs (2010) found an inverse distance effect, with faster RTs for near comparisons, suggesting that people are reasoning about magnitude and not only focusing on polarity in mixed comparisons (but see Tzelgov et al., 2009 for studies which failed to find distance effects for mixed comparisons).
In sum, the behavioral research has been inconclusive with respect to the representation of negative numbers, with several studies supporting each of the leading models. One explanation of this inconsistency is that adults have multiple ways of interacting with negative numbers dependent on the task at hand (Ganor-Stern et al., 2010; Varma and Schwartz, 2011). For example, Shaki and Petrusic (2005) found an inverse SNARC effect when positive and negative comparisons were presented in separate blocks, consistent with a rule-based account. However, they found a standard SNARC effect, consistent with an extended magnitude account, when positive and negative comparisons were intermixed. When negative trials are presented in a block, participants may adopt a rule-based strategy, knowing it will work efficiently for all trials. In contrast, intermixing negative and positive trials may lead participants to consider magnitude for each trial, because they cannot rely on a single rule across trials.
The current study explores the neural correlates of negative number processing in the context of a symbolic magnitude comparison task where positive and negative trials are intermixed. The intraparietal sulcus (IPS) within the dorsal aspects of the posterior parietal cortex has been implicated in numerical processing of positive numbers. IPS activation has also been found more generally for tasks requiring spatial attention and serialization (Majerus et al., 2007; Egner et al., 2008) and there is some controversy about the specificity of the IPS for numerical magnitude processing (Shuman and Kanwisher, 2004; Ansari et al., 2005; Cohen Kadosh et al., 2008b). Among the strongest evidence for its role in numerical processing is that IPS responses are consistently modulated by numerical distance between positive numbers. In symbolic number comparison tasks, where spatial attention demands are held constant, functional magnetic resonance imaging (fMRI) and ERP studies have demonstrated that activation in the IPS is modulated by distance between the numbers, with near pairs eliciting greater IPS activity than far pairs (Pinel et al., 2001; Gobel et al., 2004; Ansari et al., 2005; Kaufmann et al., 2005). This “neural distance effect” is also found in the IPS when non-symbolic numerosity is manipulated (Piazza et al., 2004; Ansari and Dhital, 2006; Kaufmann et al., 2008; Cantlon et al., 2009) and when comparing perceptual features, such as the physical size and luminance of symbols (Pinel et al., 2004; Cohen Kadosh et al., 2005, 2007, 2008a; Kaufmann et al., 2005).
Very little is currently known about “neural distance effects” for negative numbers in the IPS and or other brain areas like the prefrontal cortex, which is sensitive to task difficulty and rule-based processing. To our knowledge no previous neuroimaging study has explicitly manipulated numerical distance on comparisons with negative numbers. Based on the positive integer literature, we expect negative number processing to rely on the IPS. An important question is whether negative number processing engages this area differentially from the positive numbers. One imaging study to date has examined the representation and processing of negative numbers. Chassy and Grodd(in press) used a block fMRI design to investigate neural activity evoked by four increasingly abstract comparison tasks. In separate blocks, participants compared the size of disks, the number of dots, positive integers, and negative integers. Dots and positives ranged from 1 to 9, and negatives ranged from −1 to −9. Specific distance comparisons were randomly selected from all possible combinations. A conjunction analysis revealed that all four comparison tasks activated the bilateral IPS. The authors found greater activity for negative, vs. positive, number comparisons in the superior orbital gyrus. Surprisingly, there was no differential activation of the IPS or any other subdivision of the lateral parietal and prefrontal cortices for negative over positive numbers. Notably, the authors did not examine numerical distance effects.
In the current study, we used event-related fMRI to investigate the processing and representation of negative and positive numbers. A factorial design crossed number type (positive vs. negative vs. mixed) and distance (near vs. far). A univariate analysis explored the neural correlates of number type and distance, and we discuss the results in relation to the two competing models of integer representation. A complication in interpreting the results of signal level differences between negative and positive comparisons is that negative comparisons take longer than positives, and signal level differences could be due to longer processing time. Thus, it is critical to address the extent to which activation differences reflect neural responses specific to negative number processing, as opposed to general task difficulty.
We complemented traditional univariate analyses of signal change with a representational similarity analysis (RSA), a multi-voxel approach for examining stimulus-related brain responses (Kriegeskorte et al., 2008). RSA assesses the voxel-wise correlation between the activation patterns of two task conditions within an ROI. Because RSA is based on correlation of spatial activity patterns, it is independent of overall activation differences between conditions. This allows us to examine number representations independent of the effect of RT on signal level. Here, we examine the similarity of spatial activity patterns for near and far comparisons within positive and negative trials. If negative numbers have a less-refined representation of magnitude, there should be higher similarity between near and far problems for negative, compared to positive numbers. In this view, the negative numbers do not have an equally well-developed differentiation of small and large magnitudes, leading to greater overlap in their representations. In contrast, if negative number comparison relies on the magnitude representation of positive numbers, the rule hypothesis would predict that the similarity between near and far comparisons should be the same across negatives and positives. RSA provides a complementary, multivariate measure of neural distance effects, instantiated as representational distinctiveness between near and far trials.
To further investigate number representation in the IPS in an anatomically unbiased manner, we used cyto-architectonically defined maps to quantify both the overall level of activity (Wu et al., 2009; Chassy and Grodd, in press; Rosenberg-Lee et al., 2011) and RSA (Ashkenazi et al., in press). Observer independent cyto-architectonic mapping methods have revealed three distinct subdivisions of the IPS in each hemisphere. In the anterior to posterior direction they are hIP2, hIP1 (Choi et al., 2006), and hIP3 (Scheperjans et al., 2008). Together, the univariate and multivariate approaches allowed us to probe differential neural responses and representations to negative numbers in greater depth than has been possible.
Materials and Methods
Participants
Twenty-two right-handed individuals (16 females), mean age 24.2 (SD 6.8), participated in the study. Three additional participants were excluded due to technical problems during data collection (two participants), or failure to complete the study (one participant). Participants were drawn from a paid subjects pool, and were compensated for their participation. All participants provided written informed consent in compliance with Stanford University’s Human Research Protection Program.
Task Design and Stimuli
The study design was modeled on behavioral research by Varma and Schwartz (2011). Two single-digit integers were displayed on a screen. Participants indicated the greater (or lesser) of the two numbers by pressing a button on a button box. The greater/lesser task demand alternated between blocks, with the order counterbalanced across participants. Problems were of three types (intermixed within runs): In positive comparison problems, both numbers were positive (e.g., 6, 8). In negative comparisons, both were negative (e.g., −6, −8). In mixed comparisons, one number was positive and the other negative (e.g., −6, 2). Distance was also manipulated, such that half of the problems of each type were near comparisons and half were far comparisons. In near comparisons, the difference between the numbers was two or three (e.g., 7, 9). In far comparisons, the difference was seven or eight (e.g., 2, 9). All problems are presented in Table 1.
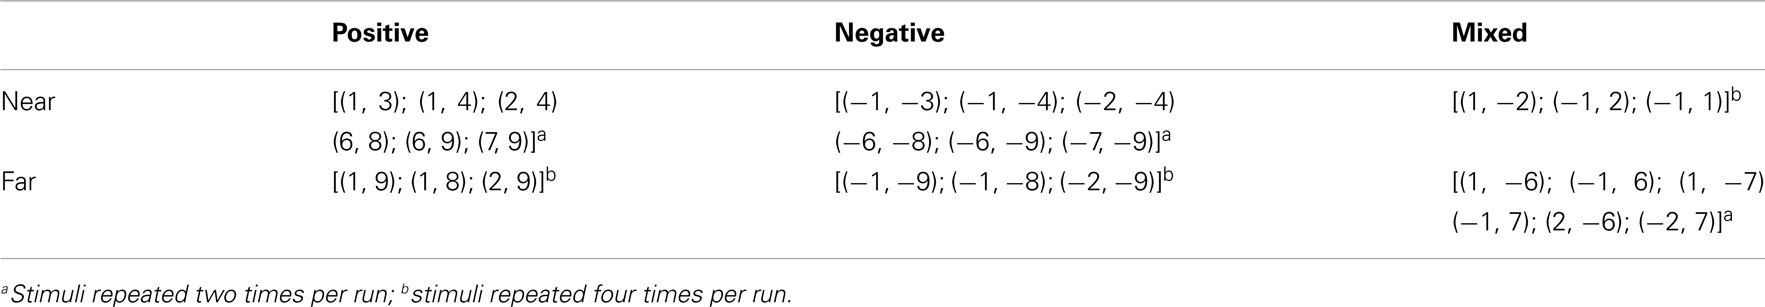
Table 1. Experimental stimuli for each number type and distance.
Stimuli were presented in four runs using a fast event-related design. There were 72 trials in each run, yielding 288 total trials (48 per condition). Within each run, participants saw an equal number of trials from all six conditions, presented in a random order. Left/right configuration of the digits (e.g., 2, 7 vs. 7, 2) was counterbalanced within each run. For the far trials, each problem was repeated twice within a run, in each configuration, because there are fewer possible problems of distance seven or eight among the single digits.
Stimuli were displayed using E-prime presentation software (Psychological Software Tools, Pittsburgh, PA, USA), and were projected onto a screen at the head of the scanner bore. Participants viewed the screen through a mirror directly in their line of vision. The two digits were presented in green on a black background, equidistant from the center of the screen. Participants held a button box in their right hand and indicated which number was greater (or lesser) by pressing their index finger to choose the number on the left, and their middle finger to choose the number on the right. Before each stimulus was presented, participants saw a blank screen, jittered between 0.5 and 5.5 s, in 100 ms increments. Participants then saw a center fixation cross for 500 ms, followed by the stimulus, which was present for 1500 ms (see Figure 1).
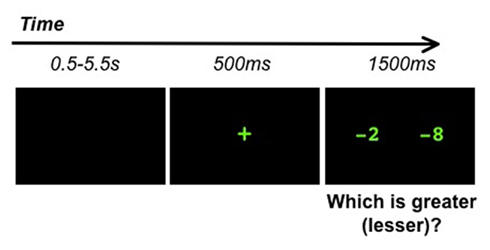
Figure 1. Task timing. Each trial began with a variable fixation period (0.5–5.5 s), followed by a fixation cross (500 ms) and presentation of two numbers for magnitude comparison (1500 ms).
Prior to entering the scanner, participants completed a brief 20 problem training session. At the beginning of each run in the scanner, two short instruction screens reminded the participants of the task and informed them whether they were making a greater or lesser judgment for the run. Participants then completed two unrecorded practice trials. Data collection began after the practice trials and lasted 5 min and 38 s. Thus, the time between the instructions and the first trial was approximately 20 s, including 14 s for signal equilibration and the initial jitter period.
fMRI Data Acquisition
Images were acquired on a 3-T GE Signa scanner using a standard GE 8-channel head coil (software Lx 8.3). Head movement was minimized during scanning with small cushions fit between the head and the coil. A total of 30 axial slices (4.0 mm thickness, 0.5 mm spacing) parallel to the AC–PC line and covering the whole brain were imaged using a T2* weighted gradient echo spiral in/out pulse sequence (TR = 2000 ms, TE = 30 ms, flip angle = 80°; Glover and Lai, 1998). The field of view was 20 cm, and the matrix size was 64 × 64, providing an in-plane spatial resolution of 3.125 mm. To reduce blurring and signal loss arising from field inhomogeneities, an automated high-order shimming method based on spiral acquisitions was used before acquiring functional MRI scans (Kim et al., 2002).
fMRI Data Analysis
Preprocessing
The first seven volumes were discarded to allow for signal equilibration effects. A linear shim correction was applied separately for each slice during reconstruction using a magnetic field map acquired automatically by the pulse sequence at the beginning of the scan (Glover and Lai, 1998). Functional MRI data were then analyzed using SPM8 software (http://www.fil.ion.ucl.ac.uk/spm).
Images were realigned to the first scan to correct for motion and slice acquisition timing. Images were spatially normalized to standard MNI space using the echo-planar imaging template provided with SPM8, resampled every 2 mm using trilinear sinc interpolation, and smoothed with a 6-mm full-width half-maximum Gaussian kernel to decrease spatial noise prior to statistical analysis. Translational movement in millimeters (x, y, z) and rotational motion in degrees (pitch, roll, yaw) was calculated based on the SPM8 parameters for motion correction of the functional images in each subject. No participant had movement greater than ±3 mm translation or ±3° of rotation.
Univariate individual and group analysis
Statistical analysis was performed on individual and group data using the general linear model implemented in SPM8. Task-related regressors were modeled as boxcar functions corresponding to each condition. There were six regressors (three number types × two distances) for the correct trials, with one additional regressor for all incorrect trials. Additionally, the six movement parameters generated from the realignment procedure were included as regressors of no interest. Regressors of interest were convolved with a hemodynamic response function and a time derivative to account for voxel-wise latency differences in hemodynamic response. Low-frequency drifts at each voxel were removed using a high-pass filter (0.5 cycles/min) and serial correlations were accounted for by modeling the fMRI time series as a first degree autoregressive process (Friston et al., 1997).
Group analysis was performed using a random-effects model that incorporated a two-stage hierarchical procedure (Holmes and Friston, 1998). Group level activation was determined using individual subject contrast images and a second-level random-effects analysis. At the group level, one sample t-tests were computed using the following individual level paired-sample t-tests (1) Number Type (positive vs. negative); (2) Distance (Near vs. Far); and (3) the interaction of Number type and Distance. After gray matter masking, significant activation clusters were determined using a height threshold of p < 0.001, and an extent threshold of 30 voxels was determined using Monte Carlo simulations and a family wise error (FWE) correction for multiple comparisons at p < 0.05 (Forman et al., 1995; Ward, 2000).
In each iteration of the Monte Carlo procedure, a 3-D image with the same resolution and dimensions as the fMRI scan was randomly generated and smoothed with a 6-mm FWHM Gaussian kernel for consistency with the inclusive mask used to report the results of the general linear model analysis. A gray matter mask was then applied to this image. The maximum cluster size at a given height threshold was recorded for each iteration, and 10,000 iterations were performed. At a height threshold of p < 0.001, less than 5% of the iterations had a maximum cluster size greater than 30 voxels.
Functionally defined regions of interest were compared to cyto-architectonic maps of parietal cortex, using the Anatomy Toolbox in SPM8 (Eickhoff et al., 2005). This toolbox computes three statistics to characterize the overlap between functional and structural regions: (1) the number of voxels in the functional cluster which overlap with a structural ROI, (2) the percentage of the functional cluster that overlaps with the structural ROI, and (3) the percentage of the structural ROI that overlaps with the functional ROI. These measures are needed to fully characterize clusters of differing size.
Region of interest analyses
Two sets of ROIs were identified: (1) Functional ROIs were constructed using 10 mm spheres centered at the peaks of significant activation in the paired-sample t-tests. (2) Unbiased anatomical ROIs were created based on cyto-architectonically distinct subdivisions of the IPS (Eickhoff et al., 2005). Three distinct subdivisions of the IPS have been identified: hIP2 on the anterior lateral bank, hIP1 which is anterior and lateral compared to hIP2 (Choi et al., 2006), and hIP3 which is posterior to both regions (Scheperjans et al., 2008). These subdivisions have previously been used to map activation in arithmetic tasks (Wu et al., 2009; Rosenberg-Lee et al., 2011). For each ROI, average beta scores for the contrasts of negative number comparisons vs. rest and positive number comparisons vs. rest were entered into a repeated measures ANOVA. As a control analysis, an ANCOVA model with RT differences (Negative RT–Positive RT) as a between-subjects covariate was used to investigate whether activation differences between negative and positive number processing arose from RT differences.
Representational similarity analysis
Representational similarity analysis (RSA) considers the voxel-wise similarity between the activation patterns of task conditions within an ROI (Kriegeskorte et al., 2008). Using the individual t-maps employed in the univariate group analyses, we computed Pearson correlations between the near and far problems for positive trials and again separately for negative trials. This correlation represents the spatial similarity in activation patterns between the two conditions, independent of overall activation level. The individual r-values were transformed to a normal distribution using Fisher’s r-to-z transformation: zi,j = 0.5 × ln((1 + ri,j)/(1 − ri,j)). RSA correlations were computed in each functional and anatomical ROI.
Results
Behavioral
Accuracy
Across all cells of the design, average accuracy was above 90%. Accuracy data were analyzed using a three Number Type (positive, negative, mixed) × 2 Distance (near, far) repeated measures ANOVA. There was a main effect of number type [F(2,42) = 20.0, p < 0.001]. There was no main effect of distance [F(1,21) = 1.5, p = 0.230], and a marginal number type by distance interaction [F(2,42) = 2.9, p = 0.065]. Post hoc comparisons using the Tukey HSD test at the p < 0.05 level revealed that participants were significantly more accurate on mixed comparisons than positive comparisons, which were more accurate than negative comparisons (see Figure A1 in Appendix). Post hoc investigation of the number type by distance interaction for negative and positive trials showed that for far comparisons, there were no accuracy differences between negative and positive trials [t(21) = −0.84, p = 0.410]. However, negative near comparisons were significantly less accurate than positive near comparisons [t(21) = −3.6, p = 0.002, see Figure 2].
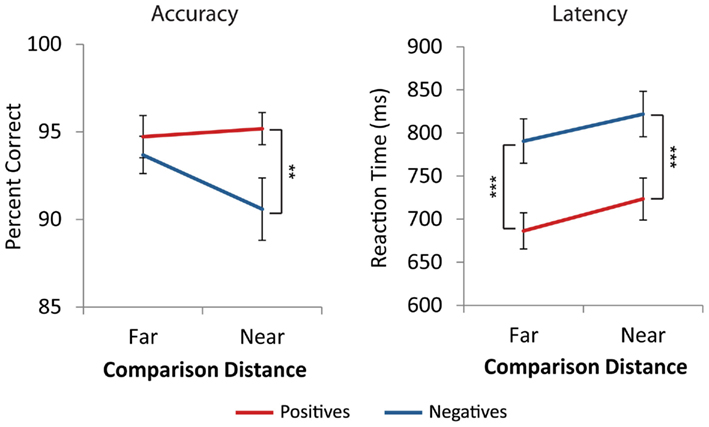
Figure 2. Behavioral performance. Participants were less accurate on near comparisons with negative numbers than positive numbers (**p < 0.01), but did not differ on far comparisons. Participants were slower on negative problems than positive problems for both near and far comparisons (***p < 0.001). Error bars represent ±1 SE.
Response time
For each participant, the mean RT and SD on correct trials were computed for each number type and distance. RTs more than 2.5 SD from the individual mean were removed. A three Number Type (positive, negative, mixed) × 2 Distance (near, far) repeated measures ANOVA revealed a significant main effect of number type, [F(2,42) = 180.0, p < 0.001], a main effect of distance, [F(1,21) = 37.7, p < 0.001], and a number type by distance interaction, [F(2,42) = 9.8, p < 0.001]. Post hoc analysis using the Tukey HSD test at the p < 0.05 level revealed that negative comparisons were significantly slower than positive comparisons, which were slower than mixed comparisons. The effect of distance was significantly different for mixed comparisons than for positive and negative comparisons [F(1,21) = 22.9, p < 0.001], which did not differ from each other [F(1,21) = 0.36, p = 0.556, see Figure A1 in Appendix]. t-Tests confirmed that there were distance effects, i.e., near comparisons were slower than far comparisons, for positive [t(21) = 5.4, p < 0.001] and negative comparisons [t(21) = 4.2, p < 0.001] but not the mixed comparisons [t(21) = 0.1, p = 0.890, see Figure A1 in Appendix]. Additionally, for both near and far comparisons negative trials were significantly slower than positive trials [t(21) = 13.3, p < 0.001, t(21) = 12.2, p < 0.001, see Figure 2].
Brain Imaging: Whole Brain Univariate Analysis
Mixed trials are not considered further in the main text because they failed to show the classic indicator of magnitude processing, differential RTs for near and far comparisons. These trials may have been solved with the strategy of identifying a negative sign to find the smaller number without considering magnitude. Here we focus on pure negative and positive comparisons, which did show robust distance effects. GLM results comparing mixed vs. positive and negative trials are presented in the Appendix (Table A1 in Appendix).
Negative numbers elicit greater fMRI signal than positive numbers in distributed cortical regions
Compared to positive numbers, negative numbers elicited greater activity in the bilateral middle frontal gyrus (MFG), pre-supplementary motor area (Figure 3A), and bilateral inferior occipital cortex and the lingual gyrus (Figure 3B). Three clusters in the left IPS and one in the right IPS also had greater activity for negative over positive numbers (Figure 4). The IPS regions tended to overlap with hIP1 and hIP3 subdivisions of the parietal cortex (Table A2 in Appendix). Only the posterior cingulate cortex showed greater activity for positive numbers relative to negative numbers, but this difference arose from greater deactivation to negative numbers (Figure 4). Table 2 provides further details about all functional clusters that showed differences between negative and positive numbers.
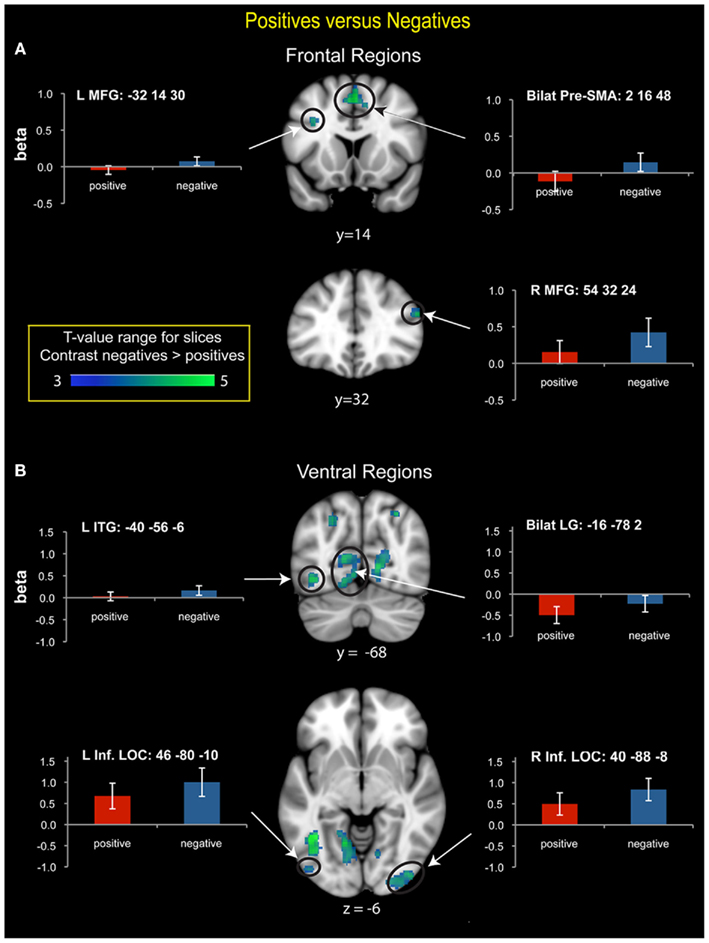
Figure 3. Brain regions that showed significant differences in activation between positive and negative numbers. (A) Frontal regions. Negative numbers had greater prefrontal cortex activation bilaterally in the middle frontal gyrus (MFG) and the pre-supplementary motor area (SMA). In the right MFG, beta value plots reveal activation above baseline for negative numbers, but not for positive numbers. (B) Ventral visual regions. Greater activation for negative numbers was detected in the bilateral lingual gyrus (LG), which was driven by greater deactivation for positive numbers. In the bilateral inferior lateral occipital cortex (LOC) there was strong activation above baseline for both number types, with greater activation for negative numbers. In the left inferior temporal gyrus (ITG), activation was greater for negative numbers, though it did not differ from baseline for either number type.
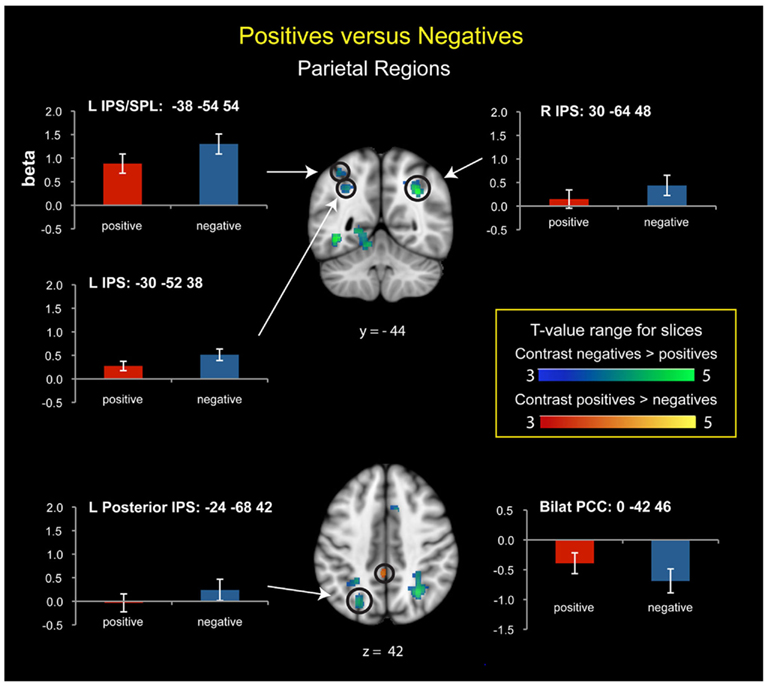
Figure 4. Posterior parietal cortex regions that showed significant activation differences between positive and negative numbers. In the anterior left intraparietal sulcus (IPS) and superior parietal lobule (SPL), there was strong activation for both number types, with greater activation for negative numbers. In the posterior left IPS, there was stronger activation for negative than positive numbers, though neither differed from baseline. In the right IPS, there was significant activation for negative numbers; positive numbers did not differ from baseline. The posterior cingulate cortex (PCC) showed greater deactivation to negative compared to positive numbers.
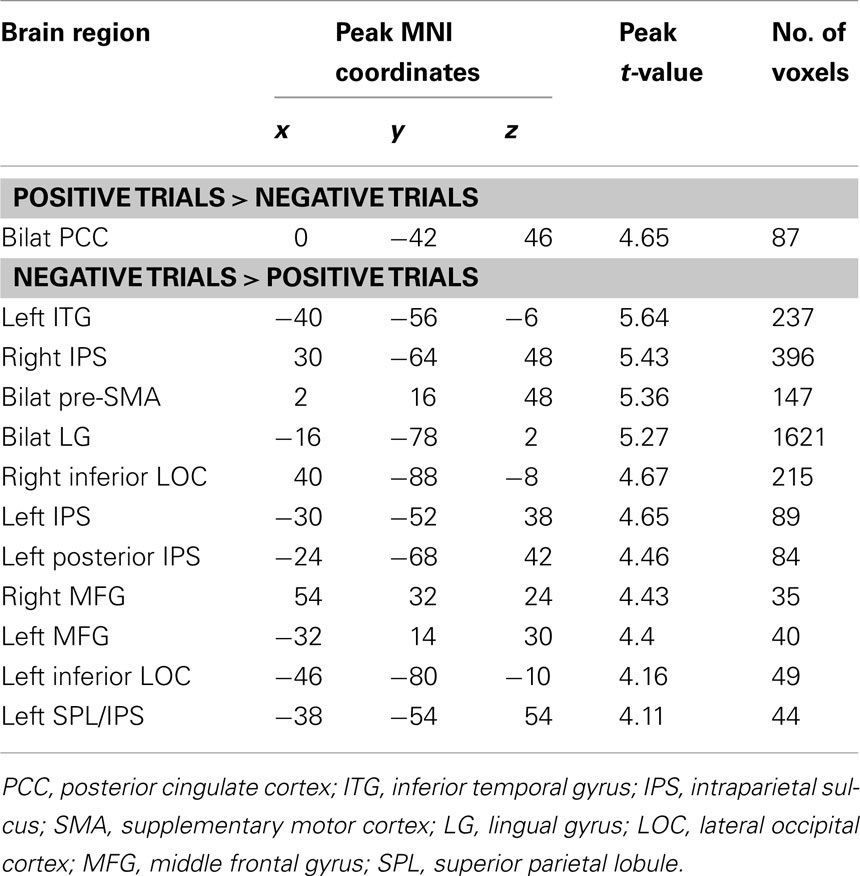
Table 2. Brain areas that showed differences in activation to negative and positive numbers.
Because RTs are longer for negative than positive trials, greater activity for negative numbers could be driven by task difficulty. To test this possibility, in each brain region that showed differences between negative and positive numbers (Table 2) we conducted a repeated measures ANCOVA with the difference in RT between negative and positive as a covariate. None of the differences between negative and positive numbers remained significant in any of the ROIs (p > 0.196). There were no significant interactions between RT difference and number type in any ROI (ps > 0.130).
Near trials elicit greater fMRI activity than far trials in premotor and somatosensory cortex
Collapsing across negative and positive numbers, near trials showed increased activation over far trials in the left premotor cortex and bilateral somatosensory cortex (SC) extending posteriorly into the superior parietal lobe (SPL; Table 3). In the left premotor cortex, differences reflect greater activation for near, compared to far, trials, with both trial types showing activation above baseline. In the bilateral SC/SPL, there was greater activation for near, compared to far, trials, but neither differed from baseline.
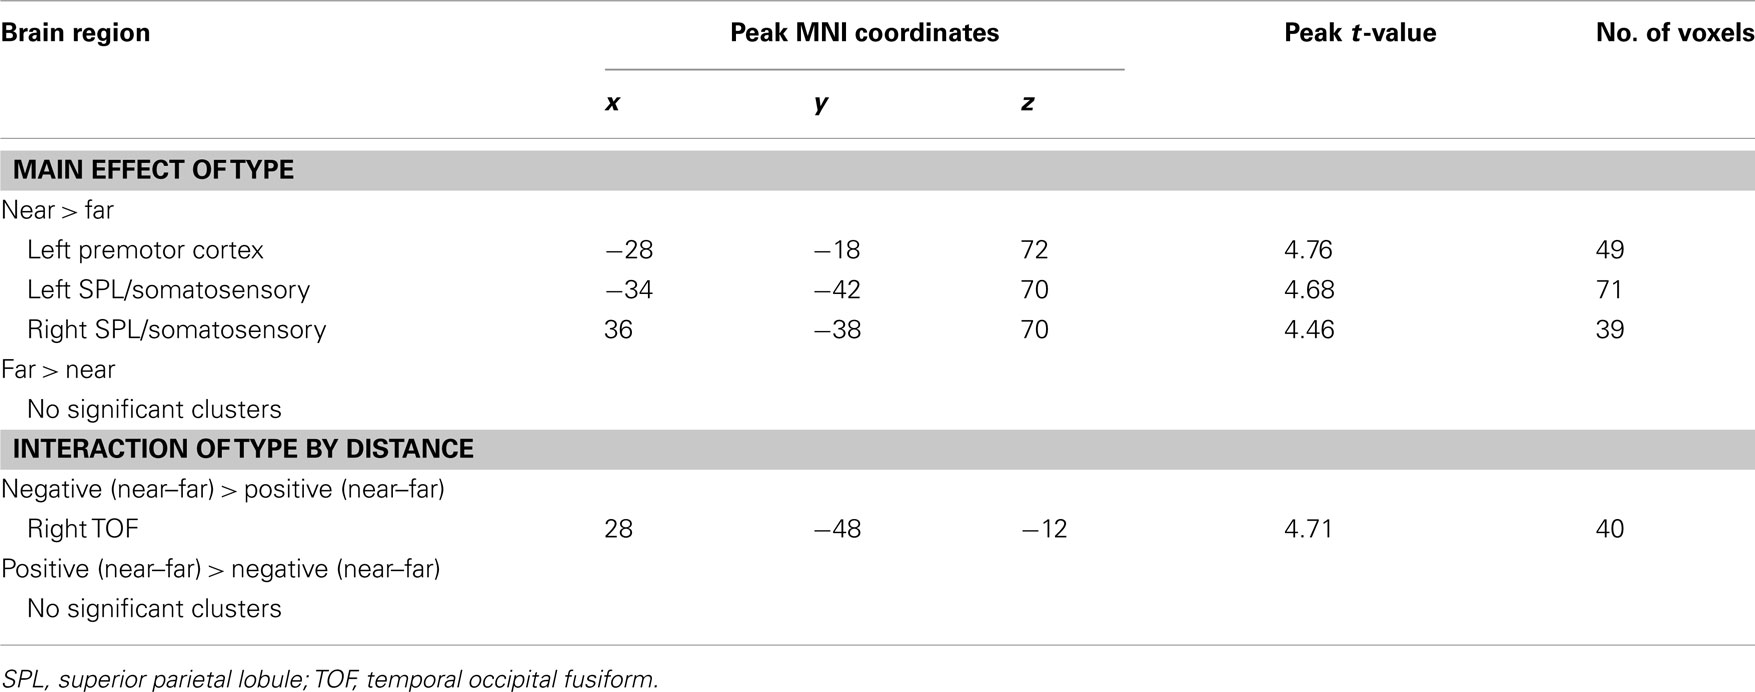
Table 3. Brain areas that showed an effect of distance and an interaction of number type by distance.
Number type interacts with distance in right temporal–occipital fusiform cortex
For the interaction between number type and distance, only the right temporal–occipital fusiform cortex (TOF) was statistically significant, but this effect was driven by differential levels of deactivation rather than greater activation during number comparison (Figure 5).
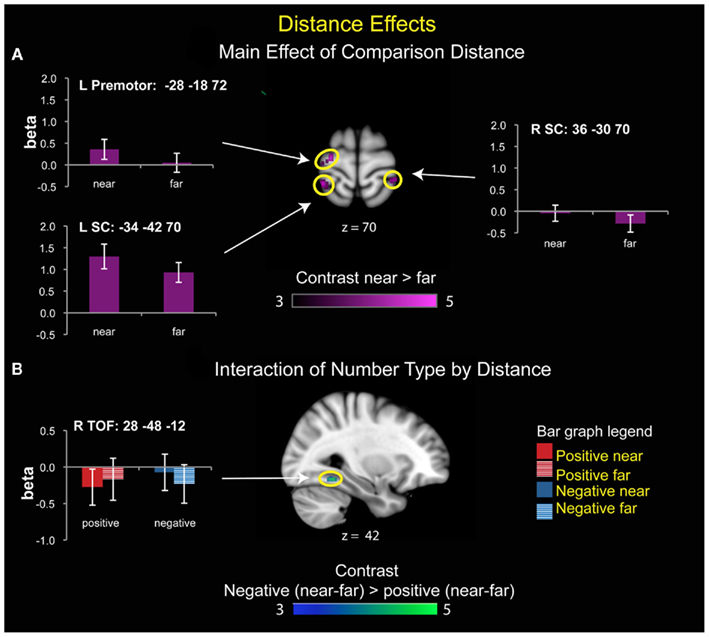
Figure 5. Brain areas that showed significant effects of distance. (A) Main effect of distance. Left premotor cortex and bilateral somatosensory cortex (SC) showed greater activity for near than far comparisons. (B) Number type by distance interaction. There was a significant interaction of distance with number type in the right temporal–occipital fusiform cortex (TOF), reflecting greater deactivation for near than far comparisons for positive numbers, and greater deactivation for far than near comparisons for the negative numbers.
Brain Imaging: ROI Analyses
Left IPS regions of interest show marginally significant effects of distance for negative numbers
We examined differential responses in six anatomically defined IPS subdivisions (left and right hIP1, hIP2, hIP3) derived from previous cyto-architectonic mapping studies (Choi et al., 2006; Scheperjans et al., 2008). A four-way repeated measures ANOVA was conducted using activation level measures based on beta parameter estimates, with number type, distance, ROI, and hemisphere as within-subjects factors. There was a significant main effect of number type [F(1,21) = 11.4, p = 0.003], with negative numbers showing greater activation than positive numbers. There was no main effect of distance, ROI, or hemisphere. However there was a significant number type by distance by hemisphere interaction [F(1,21) = 5.6, p = 0.028]. Combining the IPS sub-regions, post hoc analysis revealed that for negative numbers, the left IPS showed a marginally significant distance effect [t(21) = 2.0, p = 0.059], but the right did not. There were no significant distance effects for positive numbers in either left or right IPS. In the four-way ANOVA there were no other significant interactions with distance (all ps > 0.37) (Figure 6).
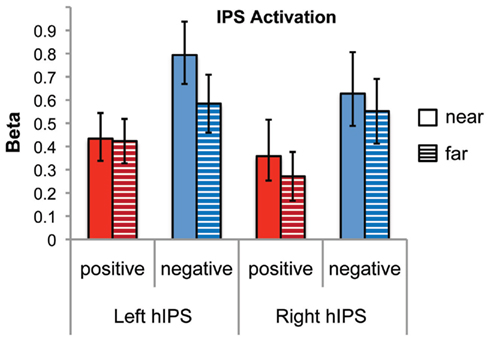
Figure 6. Distance effects in cyto-architectonic maps of the intraparietal sulcus (IPS). There was significant activation for both number types and both distances in the left and the right IPS (combining hIP1, hIP2, and hIP3). There was a significant number type by distance by hemisphere interaction (p = 0.028). The left IPS showed a marginally significant effect of distance for negative numbers (p = 0.059) but not for positive numbers. Neither number type showed a distance effect in the right IPS.
Brain Imaging: Representational Similarity Analysis
IPS has distinct distance representations for positive and negative numbers
We used RSA to examine similarity of IPS response patterns to near and far trials. RSA between these two trial types was computed separately for positive and negative numbers.
Functionally derived ROIs. We first examined RSA in four functional ROIs defined as 10mm spheres around activation peaks of the IPS regions that showed greater activation to negative vs. positive numbers. The left IPS ROI centered at (−30, −52, 38) showed a greater near–far similarity for negative numbers than for positive numbers [t(21) = 3.2, p = 0.004]. This effect was still significant at p < 0.05, after applying a Bonferroni correction for multiple comparisons over the four parietal ROIs (Figure 7A). Furthermore, in this region, within negative numbers, individual differences in representational similarity was correlated with RTs (r = 0.458, p = 0.032), such that more distinct representations were associated with faster RTs (Figure 7B).
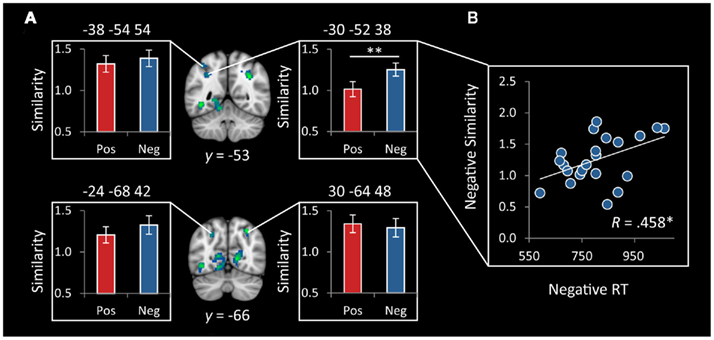
Figure 7. Representational similarity in functionally defined IPS ROIs. (A) Representational similarity between near and far trials was greater for negative, compared to positive, numbers in the left IPS, centered at (−30, −52, 38; **p = 0.004). There were no differences in the three other functionally defined IPS ROIs. (B) Representational similarity in the functional cluster centered at (−30, −52, 38) was correlated with reaction time (RT) on negative numbers (*p = 0.032), such that more distinct representations were associated with faster reaction times. ROIs were 10mm spheres generated around peaks of differential IPS response to negative vs. positive numbers.
Cyto-architectonically defined ROIs. Additional analyses were conducted using the six (three in each hemisphere) cyto-architectonically defined IPS ROIs described in the previous section. A repeated measures ANOVA with number type (negative, positive), ROI (hIP1, hIP2, hIP3), and hemisphere (L, R) as within participant factors revealed a significant effect of ROI [F(2,42) = 3.42, p = 0.042]. There was no main effect of number type or hemisphere, but there was a marginal number type by ROI interaction [F(2,42) = 3.12, p = 0.054]. To further explore this marginally significant interaction, we used a post hoc ANOVA to examine differences between number types separately for each ROI. The F-tests revealed that representational similarity was greater within negative than positive numbers in hIP1 [F(1,21) = 5.6, p = 0.027], but did not differ in hIP2 and hIP3 (ps > 0.26). Furthermore, in the left hIP1, representational similarity within negative numbers was again correlated with RTs (r = 0.508, p = 0.016), such that the more dissimilar the representation of near and far negative trials, the faster the RT (Figure 8), although this effect was not significant when using a Bonferroni correction to control for six comparisons. No such association was found between RT and representational similarity in the IPS for positive comparisons in either the functional or cyto-architectonic ROIs (all ps > 0.57).
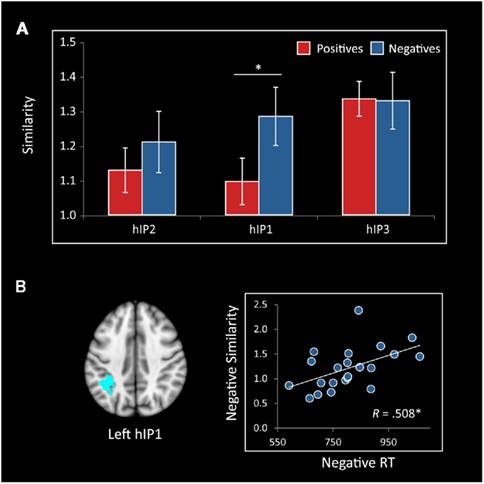
Figure 8. Representational similarity in cyto-architectonically defined subdivisions of the IPS. (A) Representational similarity between near and far trials was greater for negative numbers than positive numbers bilaterally in hIP1 (*p = 0.027). Differences in hIP2 and hIP3 were not statistically significant (ps > 0.2). (B) Representational similarity in the left hIP1 between near and far trials was correlated with reaction time (RT) on negative numbers (*p = 0.016), such that more distinct representations were associated with faster reaction times.
Discussion
While a large body of neuroscience research has addressed the representation of positive numbers, much less is known about the negative numbers. In this study, we examined neural responses and representations of negative integers using traditional univariate analyses and a novel multivariate analysis of representational similarity. To our knowledge, this is first brain imaging study to use a distance manipulation to investigate the representation of negative numbers. Compared to positives, negative number comparisons elicited greater activation in several parietal, frontal, and occipital regions, including bilateral IPS, bilateral MFG, and bilateral LOC. Univariate analyses failed to reveal strong neural distance effects in the IPS, but the multivariate RSA revealed a less differentiated representation for negative, compared to positive, numbers. Furthermore, neural representations were associated with individual differences in performance such that individuals with more distinct neural representations of negative magnitudes performed faster.
The IPS is crucial to positive number processing, and in the following sections, we focus on the role of the IPS in negative number processing, first in terms of overall signal levels and then in terms of multi-voxel representations. Next, we consider the potential role of the prefrontal cortex in the rule-based processing of negative numbers. Finally, we discuss our findings in the context of the previous behavioral research on negative numbers and demonstrate how multivariate approaches can provide novel insights into abstract number representation.
IPS Response to Negative and Positive Integer Comparison
Both positive and negative numbers elicited robust bilateral activity in the IPS. For negative numbers compared to positive numbers, whole brain analyses revealed greater activity in a distributed set of regions within the IPS, specifically three clusters in the left IPS and one cluster in the right (Figure 4). In contrast to these findings, the only other study of negative number processing to date (Chassy and Grodd, in press) found bilateral IPS activation for negative numbers, compared to fixation baseline, but not when activation to negative and positive numbers were directly compared. In cyto-architectonic ROIs (Choi et al., 2006; Scheperjans et al., 2008), we found significant activation for negative, compared to positive, numbers in all three IPS subdivisions bilaterally (Figure 6). The bilateral IPS is consistently activated in studies of symbolic and non-symbolic natural number processing (see Arsalidou and Taylor, 2011, for a review), and our results extend previous findings on positive number comparisons (Pinel et al., 2001; Ansari et al., 2005; Kaufmann et al., 2005) to negative numbers.
Negative numbers took longer to process, suggesting that task difficulty may drive differences in activation to negative and positive numbers. Indeed, after covarying out RT, we found no differences between negative and positive numbers, highlighting the difficulty of disentangling general task difficulty effects from polarity-specific processing. Similar findings likely apply in the domain of positive number comparisons, where near distance comparisons are known to have longer RT and elicit greater activation in the IPS compared to far number comparisons. Few studies have considered whether these effects are independent of RT differences (Gobel et al., 2004; Ansari et al., 2005; Kaufmann et al., 2005). Further studies are needed to examine the relation between IPS activation and RT in both number types, for example by matching RT on specific sets of trials. RSA, which is independent of overall signal level differences, provides a complementary approach to this problem, as discussed below.
Strong Behavioral and Weak Voxel-Wise Neural Distance Effects for Positive and Negative Numbers
Behavioral distance effects are thought to reflect an analog magnitude representation of positive numbers (Moyer and Landauer, 1967) and neural distance effects in the IPS have led to the suggestion that it is the locus of such a representation (Dehaene, 2003). In the current study we found distance effects in RT for both negative and positive numbers. Negative number comparisons also displayed a distance effect in accuracy, with near trials being significantly less accurate than far trials. Given these behavioral effects, we expected greater activity for near than far trials. Instead, whole brain univariate analyses did not show a significant effect of distance in the IPS, nor did we find a significant interaction between number type and distance. Cyto-architectonically defined ROIs showed a marginal effect of distance in the left IPS for negative problems, driven by strong activity for negative near trials. Taken together, these findings suggest that despite strong behavioral distance effects for positive and negative numbers, voxel-wise neural distance effects can be weak. Intermixing negative, positive, and mixed problems within each run may have increased transient responses from switching between problem types, which also drives IPS activity (Pessoa et al., 2009), making it difficult to detect the more subtle differences between near and far trials.
Weak Representation of Negative Numbers in IPS
In contrast to univariate analysis, RSA revealed differences between neural representations of near and far comparisons across the two number types. Neural responses in the IPS were less differentiated for negative than positive numbers. Specifically, there was greater similarity between the multi-voxel activity patterns for near and far negative number pairs than near and far positive pairs. That is, there were smaller neural representational distance effects for negative numbers than for positive numbers. Critically, increased representational differentiation between near and far negative numbers was associated with faster response times across subjects, consistent with a broader claim that greater differentiation in neural representation facilitates comparative processes. We suggest that greater experience with positive numbers leads to more distinct representations compared to negative numbers (Rosenberg-Lee et al., 2009). This view of a protracted refinement of IPS activity with experience is consistent with developmental research showing that children activate the IPS less than adults, but the differences are greater for symbolic number comparisons (Ansari et al., 2005) than for non-symbolic comparison (Ansari and Dhital, 2006).
Representational similarity analysis in both the functional and structural ROI implicated a mid-anterior region of the IPS, the hIP1, as a common locus of less differentiated representations for negative numbers. Resting state fMRI and diffusion tensor imaging analyses have shown that relative to the posterior-most IPS region hIP3, hIP1 has greater functional and structural connectivity with lateral prefrontal cortex, while hIP3 is more strongly connected to ventral visual areas (Uddin et al., 2010). Uddin et al. (2010) propose that hIP3 may transform incoming sensory information into quantity representations, whereas hIP1 “may support more complex aspects of numerical and mathematical information processing via their interconnections with fronto-parietal circuits” (Uddin et al., 2010, p. 2644). In light of these functional dissociations, the greater visual similarity between negative stimuli (i.e., the minus sign), might have suggested hIP3 as a likely area for RSA differences. Instead, the differences were in hIP1, suggesting that the representational difference between negative and positive numbers may reflect more abstract mathematical concepts.
PFC Differences and Task Difficulty
In contrast to the IPS, the prefrontal cortex was robustly engaged only for the more demanding task of negative number comparison. The left and right MFG also showed greater activation for negative, compared to positive, numbers. However, we did not find greater prefrontal cortex activation over baseline for positive numbers. While lateral prefrontal cortex activity is often reported for arithmetic tasks, previous studies of number processing have not consistently found activation in this area (Arsalidou and Taylor, 2011). Additional analyses using RT as a covariate in an ANCOVA model suggested that prefrontal activation could be related to task difficulty. More targeted experimental designs are needed to directly investigate this possibility.
Connecting fMRI Results to Behavioral Research on Negative Numbers
Consistent with previous findings on integer comparison, we found that negative and positive number comparisons showed parallel distance effect slopes, but negatives took longer than positives. While prior behavioral studies have not reported accuracy differences (Tzelgov et al., 2009; Varma and Schwartz, 2011), the current study found that negative near problems were less accurate than positive near problems.
Based on extant behavioral literature, two theoretical models have been proposed for negative number processing. The rule-based processing model proposes that individuals reason about negative integers by applying abstract rules on top of magnitude representations for positive numbers (Fischer and Rottman, 2005; Shaki and Petrusic, 2005; Tzelgov et al., 2009). For example, when judging which of two negative integers is greater (−9 vs. −1), they may strip the negative signs and invert the comparison predicate (greater → lesser), and subsequently rely on a positive mental number line to compare the absolute magnitudes (9 vs. 1). In this model, negative magnitudes are not represented uniquely, but are transformed into positive numbers for magnitude comparison.
The expanded magnitude model proposes that negative numbers (and zero) also have magnitude representations (Fischer, 2003; Varma and Schwartz, 2011). In this case, negative number representations play a direct role in magnitude comparison, as opposed to being translated into positive numbers. This implies that negative number magnitudes should have a separate neural representation distinct from positive numbers. Because adults have less experience with negative numbers than positive numbers, the neural representation of negative numbers may be less-refined than that of positive numbers. Furthermore, according to Varma and Schwartz (2011) the representation of negative magnitudes is organized as a reflection of the positives to instantiate the additional structure of the additive inverse (X + −X = 0).
The signal level differences found by univariate analyses in our study are consistent with either a rule-based or an expanded magnitude representation of negative numbers. Bilateral MFG activation could reflect rule processing, such as stripping the negative sign and inverting the comparison, or it could reflect general task difficulty. Conversely, greater bilateral IPS activation for negative numbers could reflect more effortful processing for negative over positive numbers, due to a less robust representation for negative numbers. Or, it could result from longer RTs and therefore longer time spent processing number. The signal level differences between negative and positive numbers help identify regions associated with negative and positive number representation, but do not differentiate the two models of number representation. This is because greater activation may be due to unspecified task difficulty. Consistent with this interpretation, controlling for RT removed the differences between negative and positive numbers in both frontal and parietal regions.
Representational similarity analysis provides a way to examine patterns of activation independent of overall signal level. RSA in both functionally and cyto-architectonically defined ROIs showed that in sub-regions of the IPS, representations of near and far positive numbers were more differentiated than near and far negative numbers. If the differentiation of far and near in negatives is functionally important, then we should predict an effect on behavior. This is what we found – a greater degree of differentiation among negative numbers was correlated with faster RTs. These findings point to a unique, but less well-developed, magnitude representation for negative numbers.
Alternate explanations are possible. For example, the application of rules might produce more noise in the positive magnitude representations when used for negative trials, resulting in decreased differentiation. However, if this were the case, prefrontal cortex activation for the application of a constant rule for negatives should not have diminished when covarying out RT (although caution should be taken when interpreting null results).
Our preferred interpretation, based on the RSA, is that an expanded magnitude hypothesis provides a parsimonious model of negative number representations for the current task. Future research manipulating instruction, such as by specifically asking participants to apply a rule-based strategy, could provide stronger causal evidence for this claim.
Conclusion
The field of cognitive neuroscience has focused considerable attention on how the natural numbers are represented in adults. During formal education, students are exposed to increasingly abstract quantitative relations, and mastery of these concepts forms a foundation for higher mathematics such as algebra and calculus. Yet little is known about how the brain enables and organizes abstract quantitative concepts. Examining negative numbers provides a first step toward a fuller understanding of the neural basis of these processes. The multivariate analysis technique used here reveals for the first time that negative numbers appear less well differentiated than positive numbers in the IPS, and that greater differentiation within negative number problems is associated with faster RT on negative problems. These findings support the proposal that people develop facility with negative numbers by creating a new representation that incorporates magnitude properties while remaining distinct from the natural numbers. Beyond the domain of negative numbers, our findings may reflect a general property of neural representation: that experience leads to greater differentiation between stimuli, even for abstract concepts.
Conflict of Interest Statement
The authors declare that the research was conducted in the absence of any commercial or financial relationships that could be construed as a potential conflict of interest.
Acknowledgments
We thank Dr. Sashank Varma for assistance with experimental design and Dr. Sarit Ashkenazi for useful discussions. This work was supported by the National Institutes of Health (HD047520 and HD045914); and the National Science Foundation (BCS/DRL 0449927 and DRL 0814768). Any opinions, findings, and conclusions or recommendations expressed in this material are those of the authors and do not necessarily reflect the views of the granting agencies.
References
Ansari, D., and Dhital, B. (2006). Age-related changes in the activation of the intraparietal sulcus during nonsymbolic magnitude processing: an event-related functional magnetic resonance imaging study. J. Cogn. Neurosci. 18, 1820–1828.
Ansari, D., Garcia, N., Lucas, E., Hamon, K., and Dhital, B. (2005). Neural correlates of symbolic number processing in children and adults. Neuroreport 16, 1769–1773.
Arsalidou, M., and Taylor, M. J. (2011). Is 2 + 2 = 4? Meta-analyses of brain areas needed for numbers and calculations. Neuroimage 54, 2382–2393.
Ashkenazi, S., Rosenberg-Lee, M., Tenison, C. T., and Menon, V. (in press). Weak task-related modulation and stimulus representations during arithmetic problem solving in children with developmental dyscalculia. Dev. Cogn. Neurosci. doi: 10.1016/j.dcn.2011.09.006
Cantlon, J. F., Libertus, M. E., Pinel, P., Dehaene, S., Brannon, E. M., and Pelphrey, K. A. (2009). The neural development of an abstract concept of number. J. Cogn. Neurosci. 21, 2217–2229.
Chassy, P., and Grodd, W. (in press). Comparison of quantities: core and format-dependent regions as revealed by fMRI. Cereb. Cortex. doi: 10.1093/cercor/bhr219
Choi, H. J., Zilles, K., Mohlberg, H., Schleicher, A., Fink, G. R., Armstrong, E., and Amunts, K. (2006). Cytoarchitectonic identification and probabilistic mapping of two distinct areas within the anterior ventral bank of the human intraparietal sulcus. J. Comp. Neurol. 495, 53–69.
Cohen Kadosh, R., Cohen Kadosh, K., and Henik, A. (2008a). When brightness counts: the neuronal correlate of numerical-luminance interference. Cereb. Cortex 18, 337–343.
Cohen Kadosh, R., Lammertyn, J., and Izard, V. (2008b). Are numbers special? An overview of chronometric, neuroimaging, developmental and comparative studies of magnitude representation. Prog. Neurobiol. 84, 132–147.
Cohen Kadosh, R., Cohen Kadosh, K., Linden, D. E., Gevers, W., Berger, A., and Henik, A. (2007). The brain locus of interaction between number and size: a combined functional magnetic resonance imaging and event-related potential study. J. Cogn. Neurosci. 19, 957–970.
Cohen Kadosh, R., Henik, A., Rubinsten, O., Mohr, H., Dori, H., van de Ven, V., Zorzi, M., Hendler, T., Goebel, R., and Linden, D. E. (2005). Are numbers special? The comparison systems of the human brain investigated by fMRI. Neuropsychologia 43, 1238–1248.
Dehaene, S. (2003). The neural basis of the Weber-Fechner law: a logarithmic mental number line. Trends Cogn. Sci. (Regul. Ed.) 7, 145–147.
Egner, T., Monti, J. M., Trittschuh, E. H., Wieneke, C. A., Hirsch, J., and Mesulam, M. M. (2008). Neural integration of top-down spatial and feature-based information in visual search. J. Neurosci. 28, 6141–6151.
Eickhoff, S. B., Stephan, K. E., Mohlberg, H., Grefkes, C., Fink, G. R., Amunts, K., and Zilles, K. (2005). A new SPM toolbox for combining probabilistic cytoarchitectonic maps and functional imaging data. Neuroimage 25, 1325–1335.
Fischer, M. H., and Rottman, J. (2005). Do negative numbers have a place on the mental number line? Psychol. Sci. Brain Number 47, 22–32.
Forman, S. D., Cohen, J. D., Fitzgerald, M., Eddy, W. F., Mintun, M. A., and Noll, D. C. (1995). Improved assessment of significant activation in functional magnetic resonance imaging (fMRI): use of a cluster-size threshold. Magn. Reson. Med. 33, 636–647.
Friston, K., Buechel, C., Fink, G., Morris, J., Rolls, E., and Dolan, R. (1997). Psychophysiological and modulatory interactions in neuroimaging. Neuroimage 6, 218–229.
Ganor-Stern, D., Pinhas, M., Kallai, A., and Tzelgov, J. (2010). Holistic representation of negative numbers is formed when needed for the task. Q. J. Exp. Psychol. 63, 1969–1981.
Ganor-Stern, D., and Tzelgov, J. (2008). Negative numbers are generated in the mind. Exp. Psychol. 55, 157–163.
Glover, G. H., and Lai, S. (1998). Self-navigated spiral fMRI: interleaved versus single-shot. Magn. Reson. Med. 39, 361–368.
Gobel, S. M., Johansen-Berg, H., Behrens, T., and Rushworth, M. F. (2004). Response-selection-related parietal activation during number comparison. J. Cogn. Neurosci. 16, 1536–1551.
Holmes, A. P., and Friston, K. J. (1998). Generalisability, random effects and population inference. Neuroimage 7, S754.
Kaufmann, L., Koppelstaetter, F., Delazer, M., Siedentopf, C., Rhomberg, P., Golaszewski, S., Felber, S., and Ischebeck, A. (2005). Neural correlates of distance and congruity effects in a numerical Stroop task: an event-related fMRI study. Neuroimage 25, 888–898.
Kaufmann, L., Vogel, S. E., Wood, G., Kremser, C., Schocke, M., Zimmerhackl, L. B., and Koten, J. W. (2008). A developmental fMRI study of nonsymbolic numerical and spatial processing. Cortex 44, 376–385.
Kim, D. H., Adalsteinsson, E., Glover, G. H., and Spielman, D. M. (2002). Regularized higher-order in vivo shimming. Magn. Reson. Med. 48, 715–722.
Krajcsi, A., and Igacs, J. (2010). Processing negative numbers by transforming negatives to positive range and by sign shortcut. Eur. J. Cogn. Psychol. 22, 1021–1038.
Kriegeskorte, N., Mur, M., and Bandettini, P. (2008). Representational similarity analysis – connecting the branches of systems neuroscience. Front. Syst. Neurosci. 2:4. doi:10.3389/neuro.06.004.2008
Liebeck, P. (1990). Scores and forfeits, and intuitive model for integers. Educ. Stud. Math. 21, 221.
Majerus, S., Bastin, C., Poncelet, M., Van der Linden, M., Salmon, E., Collette, F., and Maquet, P. (2007). Short-term memory and the left intraparietal sulcus: focus of attention? Further evidence from a face short-term memory paradigm. Neuroimage 35, 353–367.
Moreno, R., and Mayer, R. E. (1999). Multimedia-supported metaphors for meaning making in mathematics. Cogn. Instr. 17, 215–248.
Moyer, R. S., and Landauer, T. K. (1967). Time required for judgements of numerical inequality. Nature 215, 1519–1520.
Pessoa, L., Rossi, A., Japee, S., Desimone, R., and Ungerleider, L. G. (2009). Attentional control during the transient updating of cue information. Brain Res. Cogn. Brain Res. 1247, 149–158.
Piazza, M., Izard, V., Pinel, P., Le Bihan, D., and Dehaene, S. (2004). Tuning curves for approximate numerosity in the human intraparietal sulcus. Neuron 44, 547–555.
Pinel, P., Dehaene, S., Riviere, D., and LeBihan, D. (2001). Modulation of parietal activation by semantic distance in a number comparison task. Neuroimage 14, 1013–1026.
Pinel, P., Piazza, M., Le Bihan, D., and Dehaene, S. (2004). Distributed and overlapping cerebral representations of number, size, and luminance during comparative judgments. Neuron 41, 983–993.
Rosenberg-Lee, M., Chang, T. T., Young, C. B., Wu, S., and Menon, V. (2011). Functional dissociations between four basic arithmetic operations in the human posterior parietal cortex: a cytoarchitectonic mapping study. Neuropsychologia 49, 2592–2608.
Rosenberg-Lee, M., Tsang, J. M., and Menon, V. (2009). Symbolic, numeric, and magnitude representations in the parietal cortex. Behav. Brain Sci. 32, 350–351.
Scheperjans, F., Hermann, K., Eickhoff, S. B., Amunts, K., Schleicher, A., and Zilles, K. (2008). Observer-independent cytoarchitectonic mapping of the human superior parietal cortex. Cereb. Cortex 18, 846–867.
Shaki, S., and Petrusic, W. M. (2005). On the mental representation of negative numbers: context-dependent SNARC effects with comparative judgments. Psychon. Bull. Rev. 12, 931–937.
Shuman, M., and Kanwisher, N. (2004). Numerical magnitude in the human parietal lobe; tests of representational generality and domain specificity. Neuron 44, 557–569.
Tzelgov, J., Ganor-Stern, D., and Maymon-Schreiber, K. (2009). The representation of negative numbers: exploring the effects of mode of processing and notation. Q. J. Exp. Psychol. 62, 605–624.
Uddin, L. Q., Supekar, K., Amin, H., Rykhlevskaia, E., Nguyen, D. A., Greicius, M. D., and Menon, V. (2010). Dissociable connectivity within human angular gyrus and intraparietal sulcus: evidence from functional and structural connectivity. Cereb. Cortex 20, 2636–2646.
Varma, S., and Schwartz, D. L. (2011). The mental representation of integers: an abstract-to-concrete shift in the understanding of mathematical concepts. Cognition 121, 363–385.
Ward, B. D. (2000). Simultaneous Inference for fMRI Data. AFNI 3dDeconvolve Documentation. Medical College of Wisconsin, Milwaukee, WI.
Wu, S. S., Chang, T. T., Majid, A., Caspers, S., Eickhoff, S. B., and Menon, V. (2009). Functional heterogeneity of inferior parietal cortex during mathematical cognition assessed with cytoarchitectonic probability maps. Cereb. Cortex 19, 2930–2945.
Appendix
Whole Brain Results for Mixed Comparisons
As shown in Table A1, there were few differences between mixed and positive trials. The caudate, right precentral gyrus, and right cerebellum were more active for positive over mixed trials, and there were no significant clusters that were more active for mixed over positive trials. There were also no clusters that were more active for mixed over negative trials, though several regions that were more active for negative over mixed trials. These included bilateral cerebellum, bilateral intraparietal sulcus (IPS), bilateral superior parietal lobe (SPL), bilateral middle frontal gyrus (MFG), bilateral pre-supplementary motor area (SMA), the left precentral gyrus, left premotor cortex, left caudate, and the right frontal operculum cortex. Several regions more active for negative trials than mixed trials also showed greater activity in the contrast of negatives over positives, including bilateral MFG, bilateral IPS, and bilateral pre-SMA.
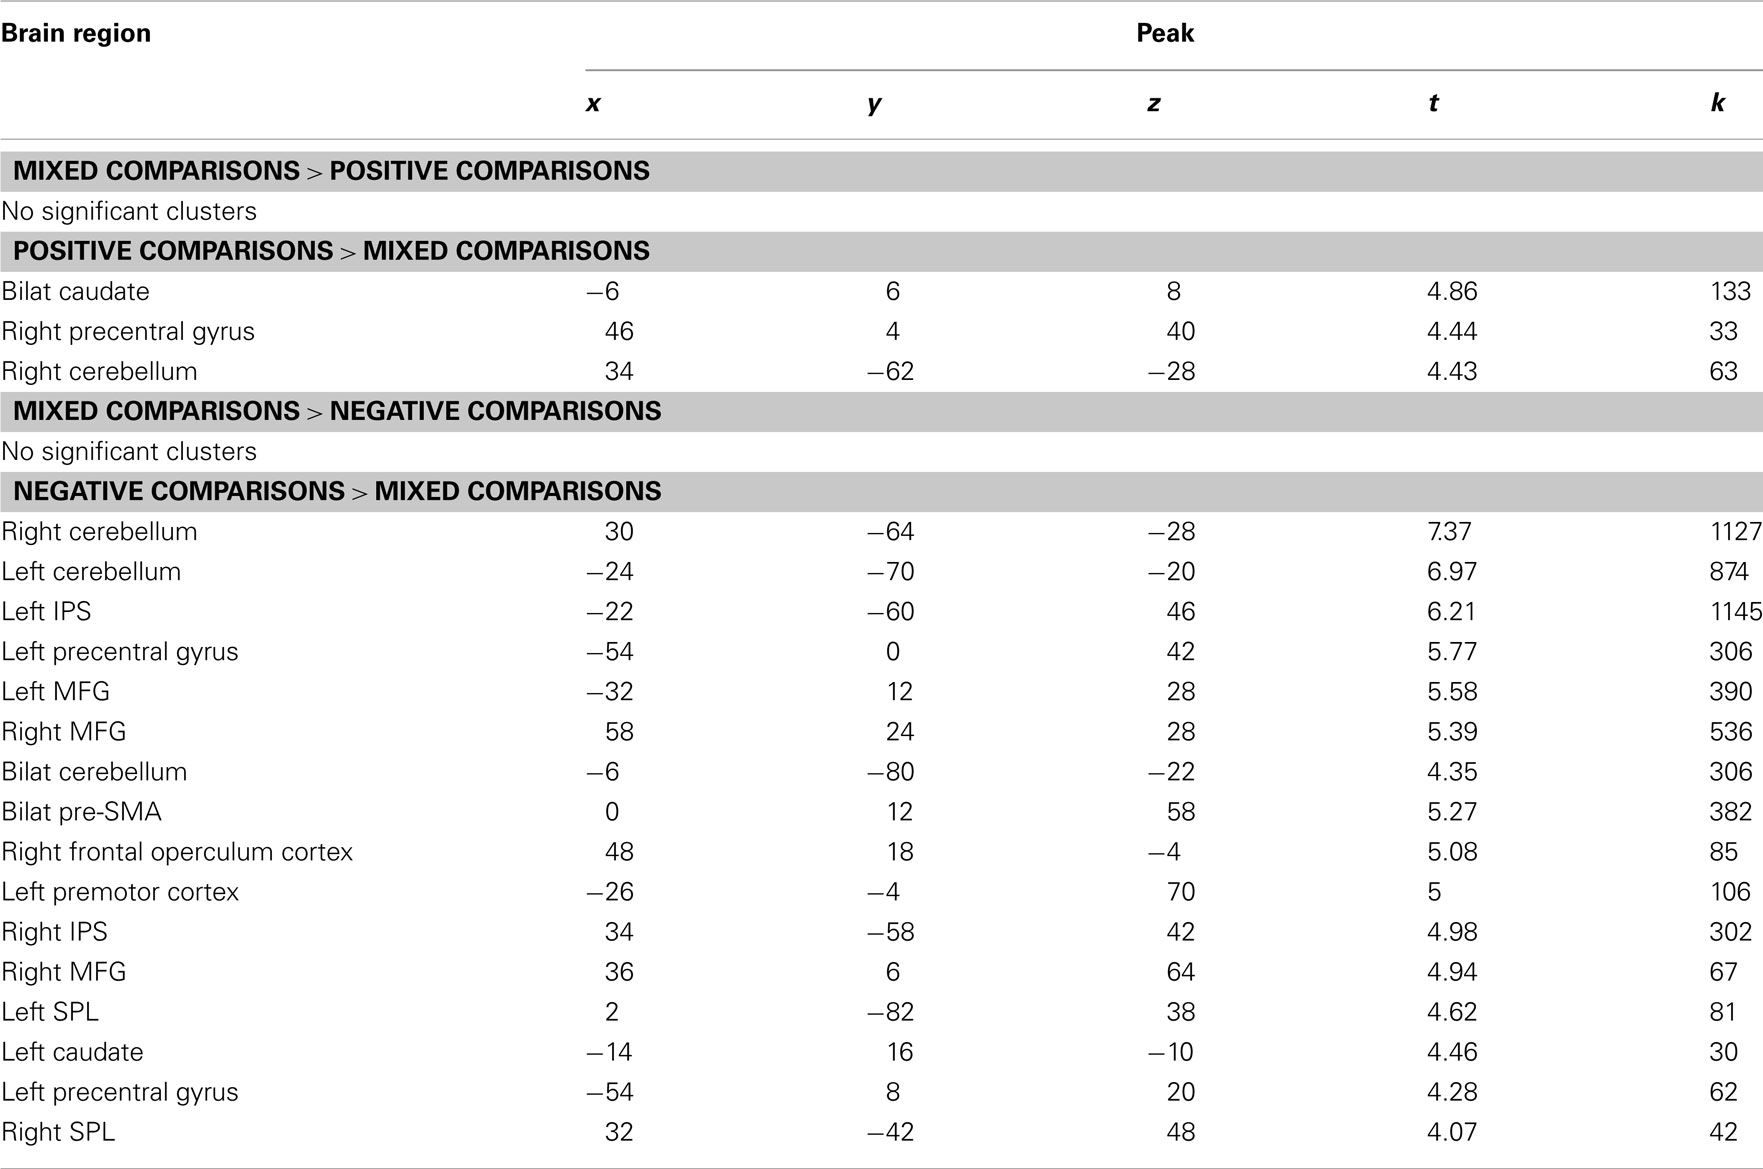
Table A1. Activation differences between mixed comparisons and positive and negative comparisons.
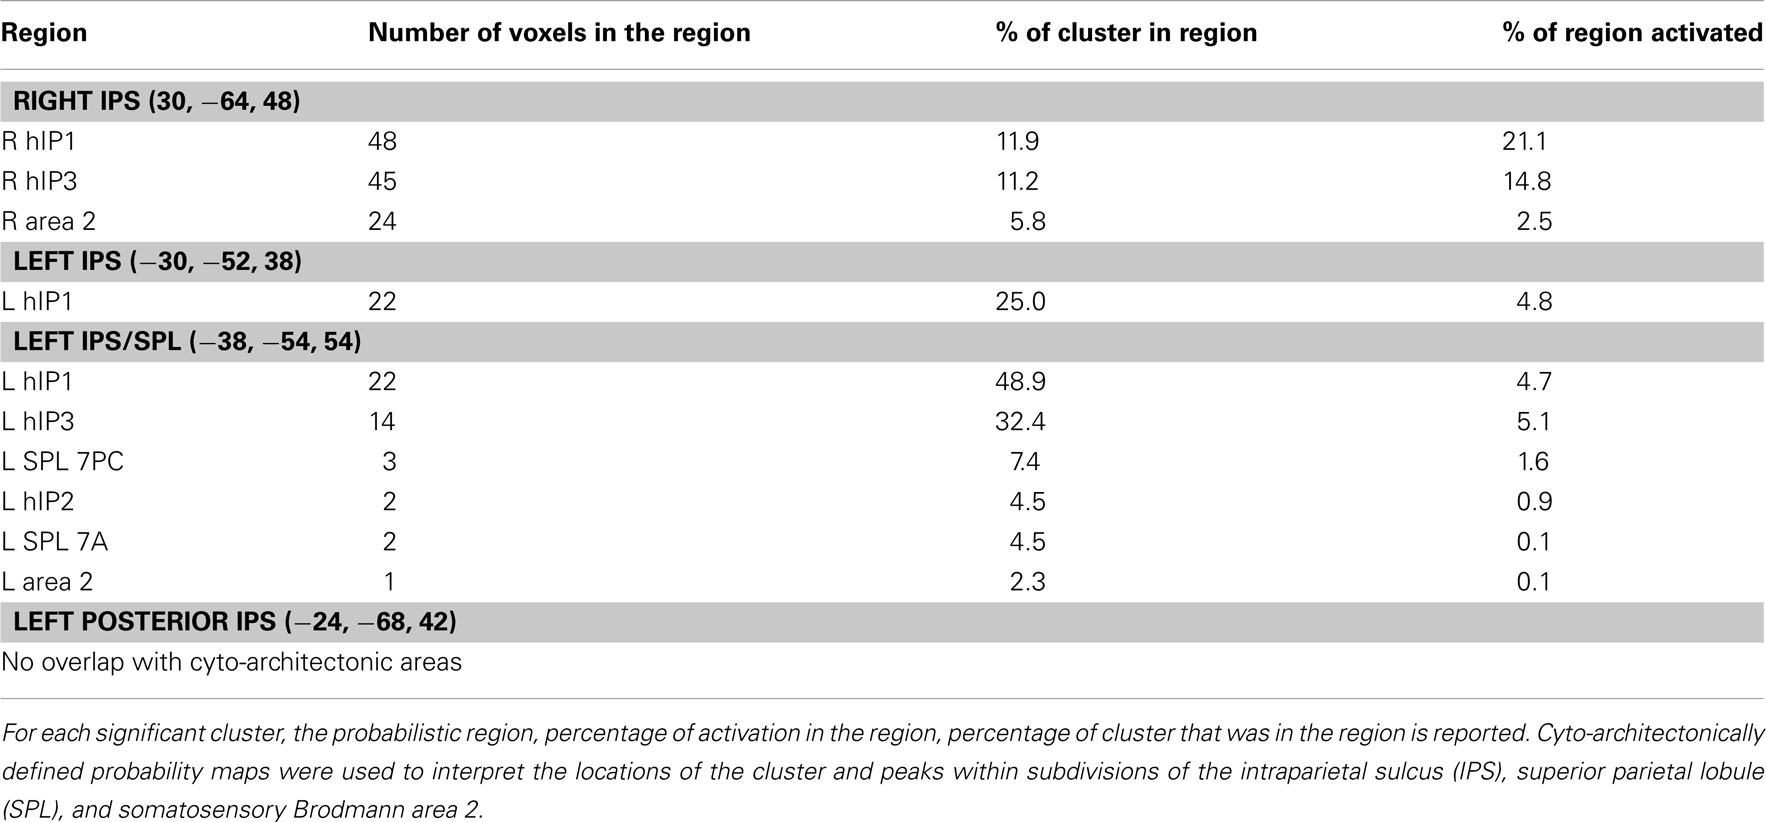
Table A2. Parietal cortex regions that showed significantly greater activation for negative than positive problems and their relationship to cyto-architectonic maps of the parietal cortex.
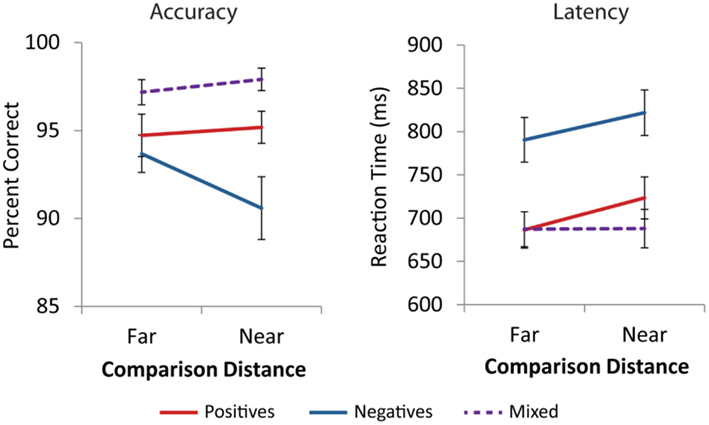
Figure A1. Behavioral performance. Participants were significantly faster and more accurate on mixed comparisons than positive and negative comparisons (p < 0.001). Mixed comparisons did not display distance effects in accuracy (p = 0.304) or reaction time (p = 0.890). Error bars represent ±1 SE.
Keywords: number cognition, symbolic number comparisons, distance effect, integers, negative numbers, intraparietal sulcus, prefrontal cortex, representational similarity
Citation: Blair KP, Rosenberg-Lee M, Tsang JM, Schwartz DL and Menon V (2012) Beyond natural numbers: negative number representation in parietal cortex. Front. Hum. Neurosci. 6:7. doi: 10.3389/fnhum.2012.00007
Received: 01 October 2011; Accepted: 18 January 2012;
Published online: 10 February 2012.
Edited by:
Seppe Santens, Ghent University, BelgiumReviewed by:
Lars Nyberg, Umeå University, SwedenRoland Grabner, Swiss Federal Institute of Technology Zurich, Switzerland
Samuel Shaki, Ariel University Center, Israel
Copyright: © 2012 Blair, Rosenberg-Lee, Tsang, Schwartz and Menon. This is an open-access article distributed under the terms of the Creative Commons Attribution Non Commercial License, which permits non-commercial use, distribution, and reproduction in other forums, provided the original authors and source are credited.
*Correspondence: Kristen P. Blair, Stanford University School of Education, Wallenberg Hall, Building 160, 450 Serra Mall, Stanford, CA 94305, USA. e-mail: kpilner@stanford.edu; Miriam Rosenberg-Lee and Vinod Menon, Department of Psychiatry and Behavioral Sciences, 401 Quarry Rd., Stanford University School of Medicine, Stanford, CA 94305-5179, USA. e-mail: miriamrl@stanford.edu; menon@stanford.edu
† Kristen P. Blair and Miriam Rosenberg-Lee have contributed equally to this work.