An ICA with reference approach in identification of genetic variation and associated brain networks
- 1The Mind Research Network, Albuquerque, NM, USA
- 2Department of Radiology, Harvard Medical School, Boston, MA, USA
- 3Department of Neurosciences, University of New Mexico School of Medicine, Albuquerque, NM, USA
- 4Department of Psychiatry and Human Behavior, University of California, Irvine, CA, USA
- 5Veterans Affairs Medical Center, San Francisco, CA, USA
- 6Department of Electrical and Computer Engineering, University of New Mexico, Albuquerque, NM, USA
To address the statistical challenges associated with genome-wide association studies, we present an independent component analysis (ICA) with reference approach to target a specific genetic variation and associated brain networks. First, a small set of single nucleotide polymorphisms (SNPs) are empirically chosen to reflect a feature of interest and these SNPs are used as a reference when applying ICA to a full genomic SNP array. After extracting the genetic component maximally representing the characteristics of the reference, we test its association with brain networks in functional magnetic resonance imaging (fMRI) data. The method was evaluated on both real and simulated datasets. Simulation demonstrates that ICA with reference can extract a specific genetic factor, even when the variance accounted for by such a factor is so small that a regular ICA fails. Our real data application from 48 schizophrenia patients (SZs) and 40 healthy controls (HCs) include 300K SNPs and fMRI images in an auditory oddball task. Using SNPs with allelic frequency difference in two groups as a reference, we extracted a genetic component that maximally differentiates patients from controls (p < 4 × 10⁻¹⁷), and discovered a brain functional network that was significantly associated with this genetic component (p < 1 × 10⁻⁴). The regions in the functional network mainly locate in the thalamus, anterior and posterior cingulate gyri. The contributing SNPs in the genetic factor mainly fall into two clusters centered at chromosome 7q21 and chromosome 5q35. The findings from the schizophrenia application are in concordance with previous knowledge about brain regions and gene function. All together, the results suggest that the ICA with reference can be particularly useful to explore the whole genome to find a specific factor of interest and further study its effect on brain.
Introduction
Considerable research suggests that complex genetic factors contribute to the etiology of mental diseases including Alzheimer's, Parkinson's and schizophrenia (Serretti et al., 2007; Allen et al., 2008; Simon-Sanchez et al., 2009). For instance, schizophrenia is highly heritable, with heritability of 0.6–0.8 (Rao et al., 1981) and the concordance between identical twins is about 50% (Cannon et al., 1998), suggesting roles for both genetic and environmental influences. Linkage studies on family samples and association studies on population samples both identify multiple genetic variants associated with the disease (Hovatta et al., 1998; Levinson et al., 2000; Fan et al., 2006; Purcell et al., 2009). One way to test the genetic risk is to perform a focused study on a selection of specific genes or chromosome loci, which are hypothesized to relate to the disorder-based on a priori knowledge of the molecular and cellular functions. While useful, this approach may overlook genetic elements that have not yet been studied but may actually play an important role in a given disorder. This limitation, combined with the known genetic complexity of many diseases, provides strong motivation for performing a broad genome-wide association study (GWAS) on a large number of single nucleotide polymorphisms (SNPs).
GWAS methods enable the study of genes that have not been studied or that have been understudied for a particular disease (Hirschhorn and Daly, 2005) and thus, hold considerable potential for identifying genes associated with complex genetic illnesses (Hindorff et al., 2009). Unfortunately, GWAS is not without its own shortcomings. The main challenge is a statistical power limitation, which is further exacerbated if only a limited number of subjects are available. To balance a small sample size and a large volume of SNP data, a set-based approach has been proposed that, instead of testing the association of each genetic marker one by one, tests the overall effect of multiple markers grouped by genes (Liu et al., 2010) in hope of a larger effect size and increased statistical power. Similar is a factor-based GWAS approach, where a factor comprises multiple markers carrying a related pattern.
Among many factorization methods, independent component analysis (ICA), multiple regression, and partial least squares have been applied in GWAS. For example, ICA or parallel ICA (Liu et al., 2008) has been implemented to identify genetic factors and associated phenotypic factors (Lee and Batzoglou, 2003; Dawy et al., 2005; Liu et al., 2009). A genetic factor is a weighted combination of multiple loci statistically associated, while different alleles contribute with different effect size to a phenotype. The number of independent factors extracted and analyzed is remarkably smaller than the number of genetic markers, which serves as a high-dimension reduction function. Recently, Vounou and colleagues proposed a sparse reduced-rank multiple regression to discover genetic associations with neuroimaging phenotypes, wherein the reduced-rank regression was employed to tackle the dimension reduction and a sparsity control was used to select highly predictive genetic markers (Vounou et al., 2010). These methods all have shown an ability to extract factors accounting for major variance from genetic data. Yet, in some cases, particularly with up to a million loci, researchers are still facing challenges in extracting factors of specific interest that may not carry a large amount of variance in the genome. In this paper we present a procedure to extract a maximally independent genetic factor of a particular interest by using ICA with reference, where ICA is constrained with a user-defined reference. We then are able to investigate the relationship of this particular genetic factor with brain function by using functional networks extracted from functional magnetic resonance imaging (fMRI) as phenotypes.
Using brain function measured by fMRI data has become popular recently as an intermediate phenotype for genetic studies of mental illnesses. For complex genetic mental disorders such as schizophrenia, structural and functional alterations in the brain have been observed consistently including major deficits in dorsolateral prefrontal cortex (Weinberger et al., 1986; Potkin et al., 2009), superior temporal lobe (Calhoun et al., 2008; Sun et al., 2009), etc. Meanwhile, multiple alleles, genes, and their interactions (Prata et al., 2009; Meda et al., 2010) have shown to modulate the risk to schizophrenia (current reports are available at the schizophrenia forum gene list at http://www.schizophreniaforum.org/). All the brain abnormalities together with the genetic complexities make schizophrenia a good target of our proposed reference ICA approach with brain functional phenotypes.
In this study, we test our method on both simulated and real datasets for association between fMRI and SNPs. The real data were obtained through the Functional Biomedical Informatics Research Network (FBIRN), a multi-site study sponsored by the NCCR/NIH which included the development of multi-center fMRI techniques with schizophrenia-related fMRI data collection, and genetic sample collection (Friedman et al., 2008; Potkin and Ford, 2009). The fMRI data were collected from subjects as they performed four sessions of a two-tone auditory oddball task. This task was selected given that previous studies have consistently linked schizophrenia with deficits in both strength and extent of activation during auditory target detection tasks (Kiehl and Liddle, 2001; Li et al., 2002).
Methods and Simulation
Overview of Data Analysis Approach
We propose a multistep approach to identify a specific (e.g., disease-related) genetic variation and the associated brain networks using a guided version of ICA. A flowchart of our approach is shown in Figure 1. The starting point is to find reference markers that present prominent feature of interest. The reference markers can be derived from prior knowledge about genes' function or data pattern. Once identified, these markers (called a reference) are used to guide the ICA process to extract an independent component maximally representing reference's characteristics from a much large array. This process is known as ICA with reference. While extracting the independent component, ICA also outputs a set of subject-specific loading coefficients, which describe the presence of the identified component across subjects. We then extract brain functional networks from fMRI images using a regular ICA, where each fMRI component identified presents a brain network. Finally, we correlate the loading coefficients of the resulting fMRI components to the loading coefficients of the SNP component to identify linked SNP/fMRI component pairs and their relationship.
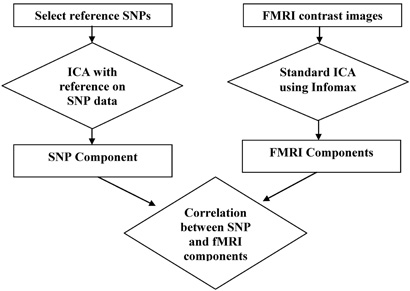
Figure 1. The flowchart of the proposed method.
Reference Generation
As mentioned above, a reference can be generated in many ways, such as from a particular feature in the genetic data, or from a hypothesized pathway or a cluster of prior loci. For the purposes of this study we assume that the true susceptible loci show prominent differences in allelic frequency between patients and controls, and a majority of them are operating together. Based on this assumption, we identify the SNPs showing group differences using a two-sample t-test p < 0.0001 (uncorrected for multiple tests, empirically chosen for conveying the pattern of interest, and, at the same time, not introducing irrelevant data) as the reference. This reference selection is not meant to claim these SNPs are significant at a GWAS level, but to identify a pattern of interest. The location of the reference SNPs provides a set of weights to guide the ICA with reference to find the best SNP factor associated with the disease in the sample.
ICA with reference on SNPs
ICA is a generic technique that extracts a set of underlying components or factors from a set of random variables or observations. The components themselves are assumed to be mutually independent and linearly mixed into observations. Explicitly, if we consider n component signals s = [s1, s2, … sn]T and assume they are linearly mixed together to produce m observations, the generative model can be written as x = As, where A is the mixing matrix. Elements of A are often referred to as mixing or loading coefficients. ICA attempts either to estimate the mixing matrix A, or find its pseudo-inverse W referred to as the de-mixing matrix; so that the elements of y = Wx are a good representation of s, the component signals. The estimation and optimization of W is based upon the assumption of mutual independence between the component signals.
ICA with reference is based on one ICA algorithm, the FastICA algorithm (Hyvirinen and Oja, 1999; Bingham and Hyvarinen, 2000), where the negative entropy is used to measure mutual independence in a formula as max: J(y) ∼ [E{G(y)} − E{G(φ)}]2. φ is a standardized Gaussian variable and G(·) is a non-quadratic contrast function. While optimizing J(y), the Kuhn–Tucker conditions can be used along with the notation y = wTx and the constraint ||w||2 = 1 to yield an update on the rows of W, such that wk = E[xG′(wTk−1x)] − E[G″(wTk−1x)]wk−1. If a function G′(u) = u3 is chosen, the update becomes wk = E[x(wTk−1x)2] − 3wk−1. Inspired by this form of the update, it is possible to impose an additional constraint which incorporates prior information about the components (Barros and Cichocki, 1998; Lin et al., 2007). Such a method has previously been applied to fMRI data (Lin et al., 2010) and is implemented within the GIFT toolbox (http://icatb.sourceforge.net). If the components are also known to be sparse, i.e., only have activity of interest in a small section of all variables, which is true for most genetic factors in the genome, then that information can also be incorporated into the previous update on w by considering wk = E[x|wTk−1x − r|p sign (wTkx − r)] − 3wk−1, where r is a reference signal containing source activity information, and |·|p is a p-norm based closeness measure. This update is no longer maximizing just the independence, but finding the maximally independent source which is close in the |·|p sense to the reference. Strictly speaking the update no longer produces maximally independent sources; however, it is often reasonable to relax the independence assumption when there is sufficient prior information about the component structure (Barros and Cichocki, 2001).
Using the reference identified in Section “Reference Generation,” we apply the ICA with reference to the large SNP data to determine the component with the closest distance to the reference. In detail, the input to the ICA with reference includes an M-by-P SNP matrix, where M is the number of samples and P is the number of SNP loci in a range of 10,000–300,000 in this study. The SNP data are coded as 0, 1, or 2, indicating the load of minor alleles. A reference is also provided that is a 1-by-P vector consisting of 0 s and 1 s with 1 denoting reference loci. The identified SNP component by the ICA with reference represents a maximally independent genetic factor comprising multiple SNPs, of which each has its specific contribution, and may come from different genes or even different chromosomes, but carries covaried distribution across subjects to be classified into one genetic factor. Since this factor is derived using a reference with different allelic frequency between groups, we expect it to differentiate patients from controls, which can be verified through a two-sample t-test. Here the purpose of the t-test is not for significance of group difference (which is biased due to the reference), but for verification of the property of the desired component. For interpretation of our results, we normalize the contribution weights of the component (using z-transform) and select only the top 0.05% SNPs in the contribution distribution (including positive and negative). This conservative cut-off (similar to α = 0.0005) provides us with a subset of SNPs which contribute the most to the component. To further analyzing the inter-relation among the top SNPs, we perform cross-correlation tests on the genotypes of these SNPs across subjects and linkage disequilibrium (LD) test. The D′ (normalized LD) values between pairs of SNPs were calculated by the PLINK tool (http://pngu.mgh.harvard.edu/∼purcell/plink/).
ICA on fMRI
Since brain function is the phenotype of this study, we extracted independent brain networks from fMRI images using a regular (blind) ICA, the infomax algorithm (Bell and Sejnowski, 1995). Infomax requires estimating the number of independent components first. To determine this number, we performed both the modified minimum descriptive length algorithm (Li et al., 2007) and the Akaike information criteria test (Akaike, 1974) and used the rounded average of their results. After fMRI component extraction, we correlated the subject-specific loading coefficients of the fMRI components with those from the SNP component. With 0.05 Bonferroni multiple comparison correction, we identified the significantly correlated SNP-fMRI components, which suggest that the genetic factor has influence on brain function of the identified brain network.
Permutation Test
To validate our findings on the association between the genetic factor and fMRI networks, we conducted a 10,000-permutation test, by permuting schizophrenia patient (SZ) or healthy control labels of the SNP data and repeating steps 2.2–2.4. Thus, we generated randomly references for the SNP data in each permutation, and extracted a SNP factor and tested its correlation with the fMRI components accordingly. With the 10,000 permutations, we are able to build a distribution of null hypothesis about the correction between the genetic factor and brain networks and examine the significance of the true correction.
Simulation Test on the ICA with Reference
A simulation was designed to validate the capability of ICA with reference to extract factors of interest, in particular for genomic SNP data. We used the simulation tool in PLINK (http://pngu.mgh.harvard.edu/∼purcell/plink/) to generate a set of 200 subjects and 10,000 SNPs of genotype data with minor allele frequencies (MAF) ranging from 0.01 to 0.5. Although the ICA with reference method is designed to extract any factor of interest, such as a factor of a particular pathway, we simulated a simple case in terms of easy evaluation, which is to extract factors discriminating patients from control groups. We selected six sets of SNPs, each with 10–100 loci, as causal loci for six types of diseases, respectively (these causal SNP loci are not in LD with max correlation < 0.25), and superimposed correlations into these causal loci and diagnostic phenotypes (six sets of diagnoses, each with half patients and half healthy controls). The superimposed correlation between individual causal locus and diagnosis ranged from 0.20 to 0.50, resulting in effect sizes of 0.04–0.25 (percentage of variance explained). It can be seen that some causal loci have very low effect size, even lower than averaged random loci of 0.08. The reference is the location of a handful of SNPs that comprise different proportions of simulated true causal loci and false causal loci. We compared the performance of the reference ICA with that from a regular Infomax ICA. We tested whether the right factor is extracted and the factor's effect size under different configurations of the reference accuracy (the fraction of true causal loci in the reference), and reference length (the number of reference loci relative to the number of all causal loci in the simulation data). Because the targeted factors are the ones discriminating patients from controls, we can further evaluate the sensitivity, specificity, and area under ROC curve (AUC), after thresholding the contribution weight of factors to pick the top contributing loci. To increase the validity of all tests, results presented here were obtained after averaging the six diseases conditions.
Application in Schizophrenia
Subjects
Subjects used in the real data application were part of FBIRN Phase II study (Kim et al., 2009; Potkin et al., 2009), recruited from seven universities (Duke/University of North Carolina, University of Iowa, Massachusetts General Hospital, University of California–Irvine, University of California–Los Angeles, University of Minnesota and University of New Mexico). All participants provide written informed consent approved by local institutional review board. SZ group met criteria for schizophrenia or schizoaffective disorder-based on the Diagnostic and Statistical Manual of Mental Disorders, Fourth Edition. Healthy controls (HC) were free of a personal or family (first-degree relatives) history of major axis I psychiatric illness. See the detail in (Kim et al., 2009; Potkin et al., 2009). Out of 186 available subjects, 90 subjects had both genetic and fMRI data from an auditory oddball task. Two subjects were further removed because of problematic fMRI data (motion rotation > 1.4°, translation > 4.5 mm). Thus, 40 HC subjects and 48 SZ patients were analyzed in the following application. The patients and controls were similar in handedness, age, race, and parental education level, but the patients had significantly lower IQs and fewer years of education than the HC subjects. See Table 1 for a comprehensive presentation of subject demographic data.
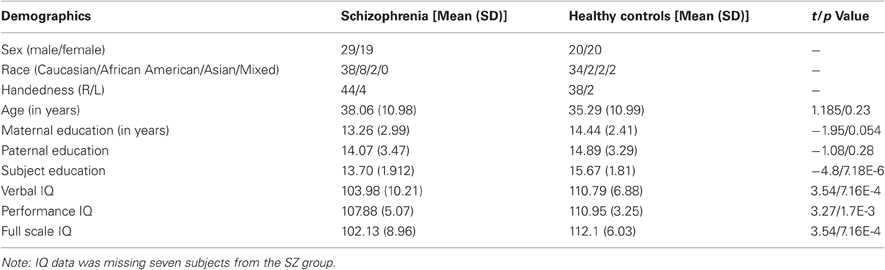
Table 1. Subject demographic information and IQ measurements.
fMRI Task and Configuration
fMRI images were collected during an auditory oddball task, which consisted of a series of frequent standard (1000 Hz, 95%) or target (1200 Hz, 5%) 100 ms duration tones presented every 500 ms. Subjects were instructed to press a button with their right hand as quickly as possible whenever a target tone was presented. See Kim et al. (2009) for more detailed information about the design of the experiment and the data collection procedures.
Based on performance during preliminary studies, the FBIRN consortium matched their pulse sequence parameters to the greatest extent possible across all sites. The parameters were as follows: slice thickness = 4 mm, field of view = 22 cm, flip angle = 90°, voxel dimensions = 3.43 × 3.43 × 4 mm, number of slices = 27, matrix = 64 × 64, repetition time = 2 s, and echo time = 30 ms (3T)/40 ms (1.5T). The fMRI data were analyzed using statistical parametric mapping software version 5 (SPM5) (http://www.fil.ion.ucl.ac.uk/spm/software/spm5/). fMRI images were motion corrected using INRIalign image realignment, slice-timing corrected, spatially normalized to Montreal Neurological Imaging (MNI) space and then spatially smoothed using a 9 × 9 × 9 mm full width at half maximum Gaussian kernel. The general linear model was applied to get the response maps for the target tone and standard tone, and the target tone minus standard tone contrast image was extracted for each subject. An additional mask was applied to remove voxels from CSF and regions outside the brain. These contrast images were then used to identify independent brain networks as intermediate phenotypes.
Genotyping and Preprocessing
DNA samples from 186 subjects were genotyped at 308,330 SNP loci in autosomes using Illumina HumanHap300 BeadChip arrays. The SNP arrays were preprocessed using PLINK V1.07 (http://pngu.mgh.harvard.edu/purcell/plink/). A total of six subjects and 6,509 SNP loci were removed because fewer than 90% of their markers were genotyped correctly. No subject failed the heterozygosity outlier test or the test for second-degree and closer relatedness. The Hardy–Weinberg Equilibrium test in controls eliminated 11 SNP loci with a cut-off p < 10−6. Missing genotypes were replaced with the genotypes of the SNPs in the highest LD > 0.8, if available. Otherwise the SNP loci (28,809 SNP loci) were removed. A minor allele frequency of 0.01 was used and resulted in 272,808 SNP loci. These SNPs were coded as 0, 1, 2, indicating the number of minor alleles based on an additive model. Though a three dimensional orthogonal coding (Hardoon et al., 2009) can handle all three models: additive model, dominant, and recessive model, the number of data variables will be increased by a factor of three. In this study we choose the additive model as the most general, and do not want to increase the already large number of data variables. An eigenvalue based approach (Price et al., 2006) was applied to remove population structure effect. Two population stratification components were removed due to significant correlation with race information. Afterward, a Quantile-Quantile plot shows no clear population stratification indication with λ = 1.005.
Results
Simulation Results
Simulated data are 10,000 SNPs' genotypes coded as 0, 1, and 2 from 200 subjects. Six types of disease conditions were built in with each involving 10–100 causal loci and affecting half of subjects. The targeted factors in this simulation are those related to each disease. Our simulation results show that, in most cases (five out of six disease conditions in some simulation runs, and six out of six in others), regular ICA is unable to extract the superimposed disease-related genetic factors due to the small variance accounted for by such factors. Instead, it extracts other factors embedded in the genomic data with large within-sample variances. In contrast, the ICA with reference can extract the right factors under most conditions except when the reference accuracy is really low. With a reference with low accuracy, as indicated by asterisks in Table 2, the ICA with reference functions like the regular ICA and produces the same outputs as the regular ICA.
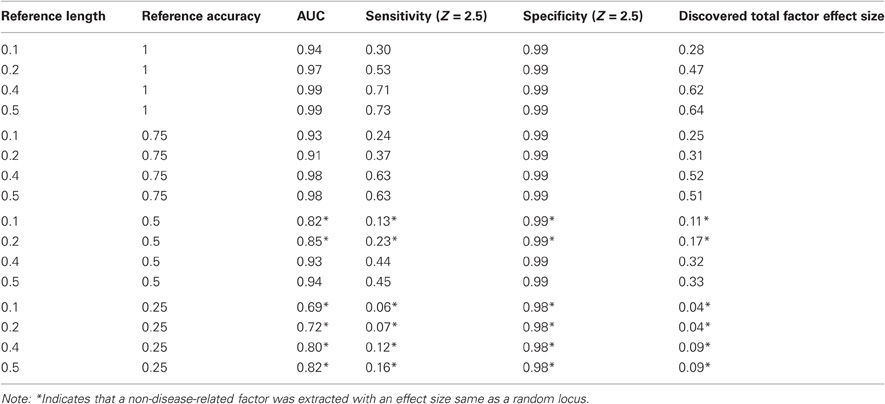
Table 2. Simulation results using 200 subjects and 10,000 SNPs.
When we have the right factors extracted, we calculated the sensitivity, specificity, and AUC to provide more information about the accuracy of the factors. The sensitivity and specificity to identify causal loci are functions of the Z-score threshold that measures the contribution of each locus to the genetic factor, compared with the ground truth about causal loci. Since the regular ICA cannot extract the right factors in general, the sensitivity and specificity were low and not presented, but similar as the results from the reference ICA under special configurations. In the ICA with reference results, we presented in Table 2 the sensitivity and specificity for the z-score of 2.5 as a typical example, the AUC and the total factor effect size along with different reference configurations. The results in Table 2 are the averaged results from six disease conditions. When the reference accuracy is above 0.5, or the reference accuracy is 0.5 and the reference length is above 0.2, the right components were extracted with increased sensitivity of detecting the true causal loci compared with known true causal loci in the reference. But, as shown in Table 2, when the reference accuracy is only 0.25 or the reference length is 10–20% with 50% true causal loci, the reference ICA fails to extract the disease-related factors, functions just like the regular ICA, and extracts factors with the effect size and sensitivity in the range of random loci. Results measured by AUC, sensitivity, and factor effect size are in agreement with each other. We also conducted a simulation with 90 subjects and 230,000 SNPs, a similar scenario to the real data application. The results are very similar to Table 2 (not shown). Therefore, we assume that in the real data application at least 25% of the reference markers are true causal loci (or tagging loci) for phenotypes of interest.
Results from the Application in Schizophrenia
In the real application of 88 subjects' SNP genotypes from 272,808 loci, only 25 SNP loci showed a difference between the HC and SZ groups at an uncorrected p-value less than 1 × 10⁻⁴. The location of these 25 SNPs (rs7570354, rs11711733, rs152442, rs10953026, rs2279834, rs1039898, rs10511304, rs2173096, rs511411, rs382321, rs3731920, rs955411, rs4105175, rs17826681, rs1017528, rs1391927, rs7341022, rs1468708, rs9314788, rs1124941, rs2172557, rs6596651, rs2286696, rs1284108, rs1419005) was used as the reference for our ICA with reference analysis on the entire SNP dataset (88-by-272,808 matrix). The extracted SNP component, as we expected, differentiates SZ patients from controls with much lower loadings in patients (p-value of 4.10 × 10⁻¹⁷. This p value is not meant for unbiased significance, but for verification of the desired property of the genetic factor. The significance of this factor's association with brain function is the targeted test). This SNP component was not confounded by gender and handedness, tested by ANOVA. After normalizing the contribution weights in the identified SNP component using a z-transform, we selected the top 26 SNPs that contribute most, which lie in the top 0.05% of all SNPs contribution distribution in the component (SNPs with a |Z|-score greater than 4.68; the contribution weight can be positive or negative). These SNPs, their corresponding genes, chromosome position, and MAF in patients and controls are shown in Table 3. All these loci exhibit different MAF between patients and controls (p value ranging from 2.74 × 10⁻⁶ ∼ 0.04), with some minor alleles more frequent in patients and some in controls.
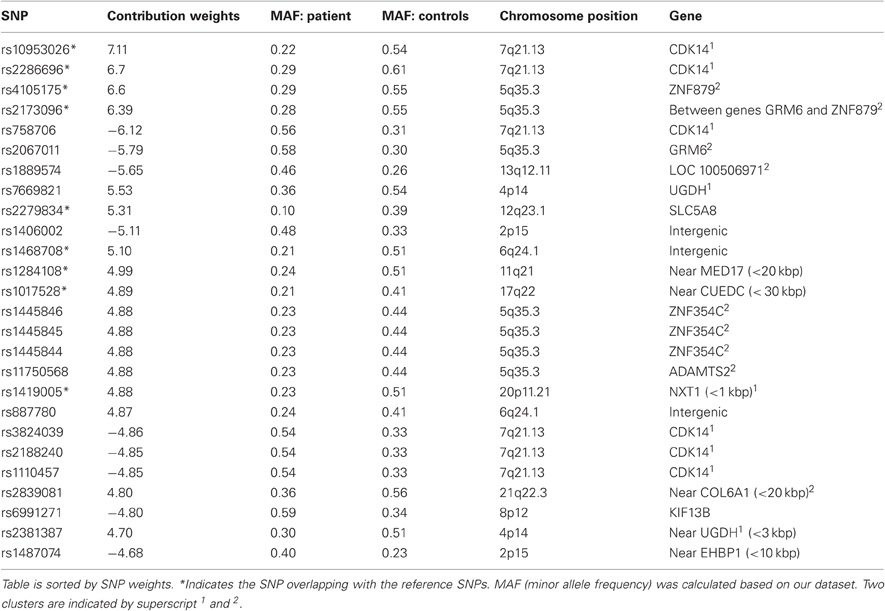
Table 3. Top component SNPs by weights and associated genes.
To investigate the possible inter-SNP-relationship, we performed cross-correlation tests on the genotypes of 26 contributing SNPs across subjects. Figure 2 presents all correlations stronger than 0.35 (P < 0.001), which forms two big clusters. One is centered at chromosome 7q21 region including rs10953026, rs2286696, rs758706, rs3824039, rs2188240, rs1110457, rs7669821, rs2381387, and rs1419005, mainly involving gene CDK14, NXT1, and UGDH. The other cluster is centered at chromosome 5q35 region including rs4105175, rs2173096, rs2067011, rs1445846, rs1445845, rs1445844, and rs11750568, mainly involving gene GRM6 and ZNF354C. No linear correlation exists between these two clusters. The LD tests among the identified 26 SNPs using 180 subjects' data show consistent pattern with the correlation map. The 6 SNPs at 7q21 region are in high LD with D′ of 0.76 ∼ 1, and the 7 SNPs at 5q35 region are also in LD with D′ of 0.74 ∼ 1. The two SNPs at 2p15 are in LD with D′ as 0.93, so are the two SNPs at 4p14 with D′ as 1.
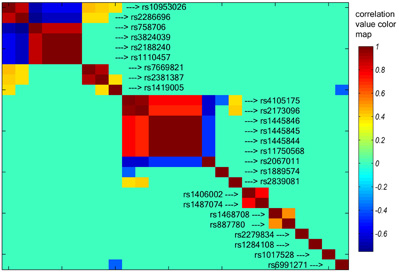
Figure 2. Cross-correlation among the top 26 SNP loci. All correlations stronger than 0.35 were plotted (p < 0.001). Two big clusters were identified; one is centered at chromosome 7q21, including rs10953026 and rs2188240. The other is centered at chromosome 5q35 including rs4105175 and rs1445846. See text for the detail list of SNPs.
Infomax ICA was performed on the fMRI contrast images to extract functional brain networks. Based upon the dimensionality estimation, we identified five spatially independent fMRI components. Of the five fMRI components, a single component was identified to be significantly correlated with the SNP component (shown in Figure 3), with a correlation of 0.39 (p < 0.0001, passing Bonferroni correction for multiple comparisons). The loading coefficients of the linked fMRI and SNP components are plotted in Figure 4, where the positive correlation indicates that activity in the network shown in Figure 3 increased as the presence of SNP component increased, with 15% of brain activity variance explained by the SNP component. The post-hoc ANOVA tests did not detect any main effect from gender, data collection site, or handedness for this fMRI component. Yet, this fMRI component shows a significant difference between the SZ and HC groups (p < 0.0001) on the loading coefficients, which is in accordance with the hypothesis that the genetic risk factor to SZ alters the brain function that also differentiates patients. Permutation results show that the correlation of 0.39 between the genetic factor and brain network has a 0.02 false positive rate among 10,000 random runs.
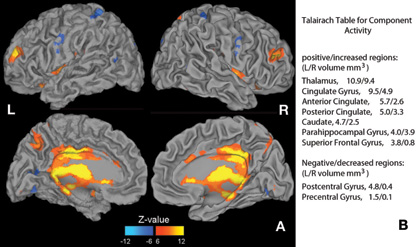
Figure 3. The fMRI component linked to the SNP component.(A) Activation map with |z| value > 6 while responding to target vs. standard stimuli in the auditory oddball task. Red to yellow color indicates positive activation regions, while blue indicates deactivation regions. (B) A list of regions and volumes with |z| value > 6. The activation regions mainly include thalamus, anterior cingulate and posterior cingulate gyri and deactivation regions are mainly in left pre- and post-central gyri. Note that the pre- and post-central gyri are mainly positively activated during the task, and the deactivation in this component is only fraction of activation that covaries with positive activation in thalamus, cingulate gyrus, etc.
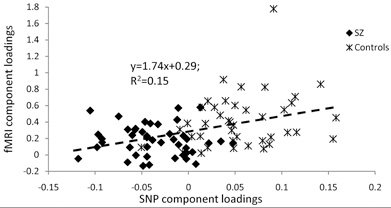
Figure 4. The loading coefficients of the linked SNP and fMRI components. The X and Y axis are the loadings for SNP and fMRI components, respectively. The positive trend shows the positive correlation (r = 0.39, R2 = 0.15) between these linked components. Healthy controls demonstrates strong positive presence of the SNP component and higher activation in the fMRI component, while schizophrenia patients carry negative presence of the SNP component (opposite combination of minor alleles in the SNPs), and lower activation in the fMRI component.
Discussion
ICA with reference is designed for the extraction of component corresponding to a particular interest. Our goal in this study is not to develop a better classification/discrimination method such as linear discriminant analysis, yet to extract factors of any interest, in particular when the variance carried by such factors is small. In the simulation we only compared the ICA with reference method with a regular ICA method to improve or extend the ICA application to large genetic data.
The simulation results demonstrate that the reference does help to extract the factor of interest, even when the variance accounted for by the factor is very small and regular ICA failed to identify it. It is necessary to point out that the accuracy of the reference is far more critical to the success of the method than the number of loci in the reference. Table 2 shows that AUC is highest when the reference accuracy is maximized. With the same accuracy, the length of the reference also has an impact on sensitivity and factor effect size. Not surprisingly, the simulation shows that when the reference is irrelevant to the disease, i.e., many false loci are added, reference ICA extracts a factor either totally unrelated to the disease (In Table 2* notes sensitivity and factor effect size close to that from a random individual locus), or with reduced sensitivity and factor effect size. For instance, using only 10% of fully accurate loci produced a higher sensitivity/factor effect size than using 50% of loci of which only half are accurate, equaling to 25% accurate loci. The factor effect size measures the overall effect from multiple small-effect causal loci, calculated by the loadings of the factor and expected to be higher than that from each individual causal locus. The simulation clearly shows that when the right component is extracted, the factor's effect size (>0.25) is much higher than individual causal locus (0.04–0.25). We are aware that the identification of false positive loci implies that there is certainly room for improvement of the method. Most importantly, the simulation results indicate that even for an imperfect reference (allowing for a maximum of 75% of the reference markers to be incorrect), our method can extract the factor of interest with increased sensitivity, compared to both regular ICA results and known true reference.
For our real data application to a schizophrenia study, we used SNPs that show group differences as the reference for ICA with reference on the entire genetic data set. Even though we are uncertain that all the reference SNPs are the true SZ susceptibility SNPs (or their tagging SNPs), we assume that the true susceptibility loci show prominent differences between patients and controls, and a majority of them are operating together. In the simulation, we proved that as long as 25% of reference loci are true loci or in LD with true loci, then our method can extract the genetic factor with increased sensitivity. Although in the real application we do not know whether 25% of reference SNPs are true SZ susceptibility loci or in LD with true loci (given only 88 samples are used, the fact of 25% of reference SNPs being true SZ susceptible becomes more questionable), this limitation does not affect the method ability to extract a genetic factor differentiating SZ patients from controls in our sample. As a result, 26 SNPs were identified contributing to a genetic component/factor showing significant differentiating power on SZ. Among them, 9 loci overlapped with those from the reference, reflecting the guidance by the reference. The dissimilarities between the identified SNPs in the component and the reference reflect the presence of other SNPs that co-vary with the identified SNPs, but do not show the most significant group difference. Two big clusters found in the 26 SNPs imply that the SNPs may be from different chromosome locations, two major related genetic functions are involved, and the involved SNPs/genes interact together in contributing to the factor that differentiates patients from controls. Essentially, our method serves as a targeted way to extract information embedded in the genome. This approach has many potential applications such as the extraction of a certain pathway-related component from the whole genome.
To study brain functional networks via ICA is a well-established approach (Calhoun et al., 2001; Calhoun and Adali, 2006). Of the five fMRI components extracted in this application, one was significantly correlated with the genetic component, not confounded by gender, collection sites, and handedness (the medication may affect the brain function since all patients except one are under stable doses of psychotropic medication, which is the limitation of this application). The permutation test confirmed this association is within a 0.02 false positive control. The positive correlation between the SNP and fMRI components suggests that the overall effect of this genetic factor is related to a higher activation in regions of this fMRI component. Since each SNP in the genetic factor contributes differently to the factor, some minor alleles such as one in rs10953026 positively relate to increased activation of the fMRI component, and some minor alleles such as one in rs2067011 relate to decreased activation of the brain network. These differences of SNP contribution also reflect their allelic frequency in SZ patients and controls, i.e., MAF of some SNPs is higher in patients, and of others is higher in controls. The identified functional component was mostly notably contained in the cingulate gyrus (anterior cingulate and posterior cingulate) and the thalamus, where SZ patients showed a lower level of activity while responding to target sounds than HCs. The cingulate gyrus, particularly anterior cingulate, is also one of the most studied regions for SZ, where functional and anatomical alterations have been reported in numerous strands of investigations, reviewed by Adams and David (2007) and Fornito et al. (2009), respectively. The thalamus plays a key role in information relay; a defect in connecting the thalamus with frontal cortex and cerebellum could easily explain a wide range of schizophrenia related symptoms. As neuropathology and imaging studies suggested, patients with schizophrenia may have abnormalities in this circuitry (Andreasen, 1997; Shenton et al., 2001; Watis et al., 2008). Our result linking the genetic factor that differentiates SZ patients from controls to the functional differences in these regions is in accordance with the previous knowledge and further increases our confidence on the method.
We were also encouraged by the fact that some of the genes listed in Table 3 have a direct link to brain function. As presented in the results, these genes are centered at two big clusters, around CDK14 (7q21) and GRM6 (5q35). CDK14 encodes the cdc2-related protein kinase, PFTAIRE, that is expressed in post-mitotic neuronal cells both in the brain and the embryo (Lazzaro et al., 1997). While not itself a risk gene for schizophrenia, it plays a role in the Wnt signaling pathway (Davidson and Niehrs, 2010), which has been implicated in the pathogenesis of schizophrenia [for review, see (Freyberg et al., 2010). GRM6 (metabotropic glutamate receptor 6), though expressed in brain (Allan brain atlas gene expression), has not been studied for the mental illness yet and is predominantly associated with visual deficits (O'Connor et al., 2006). Furthermore, it is a member of the mGlu group III receptors, of which GRM7 and GRM8 have been implicated in schizophrenia in Japanese populations, e.g., (Takaki et al., 2004; Shibata et al., 2009)], and subgroups of the mGlu receptors are promising therapeutic targets for schizophrenia (Wieronska and Pilc, 2009). The simultaneous implication of mGlu receptors and the activations within a network containing the thalamus is intriguing, given the glutamate receptor alterations in the thalamus in schizophrenia (Cronenwett and Csernansky, 2010), but these results must be considered highly preliminary and we only see it as an encouraging fact to promote the method.
Overall, this study is primarily a method study with a preliminary application to GWAS. Based on our results on simulation and real data application, we believe that the ICA with reference approach enables a flexible but focused way to identify the genetic factor of interest. Compared to a full, blind source separation analysis of all SNP data, it is more robust in terms of extracting the “right” component. When the ICA with reference on SNP data is analyzed in conjunction with brain images as an intermediate phenotype, it provides an effective way to analyze the relation between genetic factors and brain networks. In this study, we used markers with certain levels of allelic frequency difference as a reference; it makes the extracted genetic factor biased toward patients vs. controls difference and thus inflates the significance of the t-test on SZ vs. HC difference, but it does not affect the association test on brain functional network. In fact, we have used SNPs in gene DRD2 as a reference and extracted a genetic factor centered at DRD2 function (results not shown). Yet, this genetic factor did not relate to any brain function in our image data collected in the auditory oddball task, which provides evidence that the association of a specific genetic factor with brain function is not biased. With such a small sample size, we are aware that the result on real data is limited by identification power. Nevertheless, the simulation and real data application show consistently the capability of ICA with reference to extract genetic factors of interest. In conclusion, we propose an approach that provides a particularly useful way to investigate regions of brain activity associated with specific genetic variation. It can be applied to the identification of certain (gene-specific, pathway-specific, etc.) genetic factors from a large genomic array, and the study of specific genetic effect on brain function. We also provide an example of such application that demonstrates the ability to extract genetic factors, analyze inter-SNP relation, identify associated brain network and suggest the genetic (minor allelic) effect on brain. We hope to see the adoption of our method in the future GWAS researches.
Conflict of Interest Statement
The authors declare that the research was conducted in the absence of any commercial or financial relationships that could be construed as a potential conflict of interest.
Acknowledgments
We would like to acknowledge the efforts of all parties responsible for designing and implementing the experiment, collecting the data, and facilitating the brain imaging that made this study possible. We would also like to acknowledge the FBIRN study (Steven Potkin, PI) and all those researchers involved in its origin, design, and realization (NCRR grant U24-RR021992). We acknowledge the help and support of Mita Mancini and Yann Legros from Illumina, as well as Cristina Barlassina, Chiara Dal Fiume, Alessandro Orro and Federica Torri (University of Milan) for performing the HumanHap 300 Bead Array procedures on the FBIRN samples. Lastly, we need to acknowledge NCRR P20RR021938, NIH grants R01EB005846, and DOE award DR-FG02–08ER64581 for making this research possible.
References
Adams, R., and David, A. S. (2007). Patterns of anterior cingulate activation in schizophrenia: a selective review. Neuropsychiatr. Dis. Treat. 3, 87–101.
Akaike, H. (1974). A new look at the statistical model identification. IEEE Trans. Automat. Contr. 19, 716–723.
Allen, N. C., Bagade, S., McQueen, M. B., Ioannidis, J. P., Kavvoura, F. K., Khoury, M. J., Tanzi, R. E., and Bertram, L. (2008). Systematic meta-analyses and field synopsis of genetic association studies in schizophrenia: the SzGene database. Nat. Genet. 40, 827–834.
Barros, A., and Cichocki, A. (2001). Extraction of specific signals with temporal structure. Neural Comput. 13, 1995–2003.
Barros, A. K., and Cichocki, A. (1998). “A fixed-point algorithm for independent component analysis which uses a priori information,” in Neural Networks. Proceedings. Vth Brazilian Symposium, (Belo Horizonte, Brazil), 39–42.
Bell, A. J., and Sejnowski, T. J. (1995). An information-maximization approach to blind separation and blind deconvolution. Neural Comput. 7, 1129–1159.
Bingham, E., and Hyvarinen, A. (2000). A fast fixed-point algorithm for independent component analysis of complex valued signals. Int. J. Neural Syst. 10, 1–8.
Calhoun, V. D., and Adali, T. (2006). Unmixing fMRI with independent component analysis. IEEE Eng. Med. Biol. Mag. 25, 79–90.
Calhoun, V. D., Adali, T., McQinty, V. B., Pekar, J. J., Watson, T. D., and Pearlson, G. D. (2001). fMRI activation in a visual-perception task: network of areas detected using the general linear model and independent components analysis. Neuroimage 14, 1080–1088.
Calhoun, V. D., Maciejewski, P. K., Pearlson, G. D., and Kiehl, K. A. (2008). Temporal lobe and “default” hemodynamic brain modes discriminate between schizophrenia and bipolar disorder. Hum. Brain Mapp. 29, 1265–1275.
Cannon, T. D., Kaprio, J., Lonnqvist, J., Huttunen, M., and Koskenvuo, M. (1998). The genetic epidemiology of schizophrenia in a Finnish twin cohort. A population-based modeling study. Arch. Gen. Psychiatry 55, 67–74.
Cronenwett, W. J., and Csernansky, J. (2010). Thalamic pathology in schizophrenia. Curr. Top. Behav. Neurosci. 4, 509–528.
Davidson, G., and Niehrs, C. (2010). Emerging links between CDK cell cycle regulators and Wnt signaling. Trends Cell Biol. 20, 453–460.
Dawy, Z., Sarkis, M., Hagenauer, J., and Mueller, J. (2005). “A novel gene mapping algorithm based on independent component analysis,” in Acoustics, Speech, and Signal Processing. Proceedings. (ICASSP '05). IEEE International Conference on: IEEE International Conference on Acoustics, Speech, and Signal Processings, (Philadelphia, PA, USA), 381–384.
Fan, J. B., Ma, J., Li, X. W., Zhang, C. S., Sun, W. W., He, G., Gu, N. F., Feng, G. Y., St Clair, D., and He, L. (2006). Population-based and family-based association studies of an (AC)n dinucleotide repeat in alpha-7 nicotinic receptor subunit gene and schizophrenia. Schizophr. Res. 84, 222–227.
Fornito, A., Yucel, M., Dean, B., Wood, S. J., and Pantelis, C. (2009). Anatomical abnormalities of the anterior cingulate cortex in schizophrenia: bridging the gap between neuroimaging and neuropathology. Schizophr. Bull. 35, 973–993.
Freyberg, Z., Ferrando, S. J., and Javitch, J. A. (2010). Roles of the Akt/GSK-3 and Wnt signaling pathways in schizophrenia and antipsychotic drug action. Am. J. Psychiatry 167, 388–396.
Friedman, L., Stern, H., Brown, G. G., Mathalon, D. H., Turner, J., Glover, G. H., Gollub, R. L., Lauriello, J., Lim, K. O., Cannon, T., Greve, D. N., Bockholt, H. J., Belger, A., Mueller, B., Doty, M. J., He, J., Wells, W., Smyth, P., Pieper, S., Kim, S., Kubicki, M., Vangel, M., and Potkin, S. G. (2008). Test-retest and between-site reliability in a multicenter fMRI study. Hum. Brain Mapp. 29, 958–972.
Hardoon, D. R., Ettinger, U., Mourao-Miranda, J., Antonova, E., Collier, D., Kumari, V., Williams, S. C., and Brammer, M. (2009). Correlation-based multivariate analysis of genetic influence on brain volume. Neurosci. Lett. 450, 281–286.
Hindorff, L. A., Sethupathy, P., Junkins, H. A., Ramos, E. M., Mehta, J. P., Collins, F. S., and Manolio, T. A. (2009). Potential etiologic and functional implications of genome-wide association loci for human diseases and traits. Proc. Natl. Acad. Sci. U.S.A. 106, 9362–9367.
Hirschhorn, J. N., and Daly, M. J. (2005). Genome-wide association studies for common diseases and complex traits. Nat. Rev. Genet. 6, 95–108.
Hovatta, I., Lichtermann, D., Juvonen, H., Suvisaari, J., Terwilliger, J. D., Arajarvi, R., Kokko-Sahin, M. L., Ekelund, J., Lonnqvist, J., and Peltonen, L. (1998). Linkage analysis of putative schizophrenia gene candidate regions on chromosomes 3p, 5q, 6p, 8p, 20p and 22q in a population-based sampled Finnish family set. Mol. Psychiatry 3, 452–457.
Hyvirinen, A., and Oja, E. (1999). A fast fixed-point algorithm for independent component analysis. Neural Comput. 9, 1483–1492.
Kiehl, K. A., and Liddle, P. F. (2001). An event-related functional magnetic resonance imaging study of an auditory oddball task in schizophrenia. Schizophr. Res. 48, 159–171.
Kim, D. I., Mathalon, D. H., Ford, J. M., Mannell, M., Turner, J. A., Brown, G. G., Belger, A., Gollub, R., Lauriello, J., Wible, C., O'Leary, D., Lim, K., Toga, A., Potkin, S. G., Birn, F., and Calhoun, V. D. (2009). Auditory oddball deficits in schizophrenia: an independent component analysis of the fMRI multisite function BIRN study. Schizophr. Bull. 35, 67–81.
Lazzaro, M. A., Albert, P. R., and Julien, J. P. (1997). A novel cdc2-related protein kinase expressed in the nervous system. J. Neurochem. 69, 348–364.
Lee, S. I., and Batzoglou, S. (2003). Application of independent component analysis to microarrays. Genome Biol. 4, R76.
Levinson, D. F., Holmans, P., Straub, R. E., Owen, M. J., Wildenauer, D. B., Gejman, P. V., Pulver, A. E., Laurent, C., Kendler, K. S., Walsh, D., Norton, N., Williams, N. M., Schwab, S. G., Lerer, B., Mowry, B. J., Sanders, A. R., Antonarakis, S. E., Blouin, J. L., Deleuze, J. F., and Mallet, J. (2000). Multicenter linkage study of schizophrenia candidate regions on chromosomes 5q, 6q, 10p, and 13q: schizophrenia linkage collaborative group III. Am. J. Hum. Genet. 67, 652–663.
Li, C. S., Chen, M. C., Yang, Y. Y., and Tsay, P. K. (2002). Altered performance of schizophrenia patients in an auditory detection and discrimination task: exploring the “self-monitoring” model of hallucination. Schizophr. Res. 55, 115–128.
Li, Y. O., Adali, T., and Calhoun, V. D. (2007). Estimating the number of independent components for functional magnetic resonance imaging data. Hum. Brain Mapp. 28, 1251–1266.
Lin, Q. H., Zheng, Y.-R., Yin, F., Liang, H., and Calhoun, V. D. (2007). A fast algorithm for one-unit ICA-R. Inf. Sci. 177, 1265–1275.
Lin, Q. H., Liu, J., Zheng, Y. R., Liang, H., and Calhoun, V. D. (2010). Semiblind spatial ICA of fMRI using spatial constraints. Hum. Brain Mapp. 31, 1076–1088.
Liu, J., Demirci, O., and Calhoun, V. D. (2008). A parallel independent component analysis approach to investigate genomic influence on brain function. IEEE Signal Process. Lett. 15, 413.
Liu, J., Kiehl, K. A., Pearlson, G., Perrone-Bizzozero, N. I., Eichele, T., and Calhoun, V. D. (2009). Genetic determinants of target and novelty-related event-related potentials in the auditory oddball response. Neuroimage 46, 809–816.
Liu, J. Z., McRae, A. F., Nyholt, D. R., Medland, S. E., Wray, N. R., Brown, K. M., Hayward, N. K., Montgomery, G. W., Visscher, P. M., Martin, N. G., and Macgregor, S. (2010). A versatile gene-based test for genome-wide association studies. Am. J. Hum. Genet. 87, 139–145.
Meda, S. A., Jagannathan, K., Gelernter, J., Calhoun, V. D., Liu, J., Stevens, M. C., and Pearlson, G. D. (2010). A pilot multivariate parallel ICA study to investigate differential linkage between neural networks and genetic profiles in schizophrenia. Neuroimage 53, 1007–1015.
O'Connor, E., Allen, L. E., Bradshaw, K., Boylan, J., Moore, A. T., and Trump, D. (2006). Congenital stationary night blindness associated with mutations in GRM6 encoding glutamate receptor MGluR6. Br. J. Ophthalmol. 90, 653–654.
Potkin, S. G., and Ford, J. M. (2009). Widespread cortical dysfunction in schizophrenia: the FBIRN imaging consortium. Schizophr. Bull. 35, 15–18.
Potkin, S. G., Turner, J. A., Brown, G. G., McCarthy, G., Greve, D. N., Glover, G. H., Manoach, D. S., Belger, A., Diaz, M., Wible, C. G., Ford, J. M., Mathalon, D. H., Gollub, R., Lauriello, J., O'Lleary, D., Van Erp, T. G., Toga, A. W., Preda, A., and Lim, K. O. (2009). Working memory and DLPFC inefficiency in schizophrenia: the FBIRN study. Schizophr. Bull. 35, 19–31.
Prata, D. P., Mechelli, A., Fu, C. H., Picchioni, M., Toulopoulou, T., Bramon, E., Walshe, M., Murray, R. M., Collier, D. A., and McGuire, P. (2009). Epistasis between the DAT 3′ UTR VNTR and the COMT Val158Met SNP on cortical function in healthy subjects and patients with schizophrenia. Proc. Natl. Acad. Sci. U.S.A. 106, 13600–13605.
Price, A. L., Patterson, N. J., Plenge, R. M., Weinblatt, M. E., Shadick, N. A., and Reich, D. (2006). Principal components analysis corrects for stratification in genome-wide association studies. Nat. Genet. 38, 904–909.
Purcell, S. M., Wray, N. R., Stone, J. L., Visscher, P. M., O'Donovan, M. C., Sullivan, P. F., and Sklar, P. (2009). Common polygenic variation contributes to risk of schizophrenia and bipolar disorder. Nature 460, 748–752.
Rao, D. C., Morton, N. E. Gottesman, II., and Lew, R. (1981). Path analysis of qualitative data on pairs of relatives: application to schizophrenia. Hum. Hered. 31, 325–333.
Serretti, A., Olgiati, P., and De Ronchi, D. (2007). Genetics of Alzheimer's disease. A rapidly evolving field. J. Alzheimers Dis. 12, 73–92.
Shenton, M. E., Dickey, C. C., Frumin, M., and McCarley, R. W. (2001). A review of MRI findings in schizophrenia. Schizophr. Res. 49, 1–52.
Shibata, H., Tani, A., Chikuhara, T., Kikuta, R., Sakai, M., Ninomiya, H., Tashiro, N., Iwata, N., Ozaki, N., and Fukumaki, Y. (2009). Association study of polymorphisms in the group III metabotropic glutamate receptor genes, GRM4 and GRM7, with schizophrenia. Psychiatry Res. 167, 88–96.
Simon-Sanchez, J., Schulte, C., Bras, J. M., Sharma, M., Gibbs, J. R., Berg, D., Paisan-Ruiz, C., Lichtner, P., Scholz, S. W., Hernandez, D. G., Kruger, R., Federoff, M., Klein, C., Goate, A., Perlmutter, J., Bonin, M., Nalls, M. A., Illig, T., Gieger, C., Houlden, H., Steffens, M., Okun, M. S., Racette, B. A., Cookson, M. R., Foote, K. D., Fernandez, H. H., Traynor, B. J., Schreiber, S., Arepalli, S., Zonozi, R., Gwinn, K. Van Der Brug, M., Lopez, G., Chanock, S. J., Schatzkin, A., Park, Y., Hollenbeck, A., Gao, J., Huang, X., Wood, N. W., Lorenz, D., Deuschl, G., Chen, H., Riess, O., Hardy, J. A., Singleton, A. B., and Gasser, T. (2009). Genome-wide association study reveals genetic risk underlying Parkinson's disease. Nat. Genet. 41, 1308–1312.
Sun, J., Maller, J. J., Guo, L., and Fitzgerald, P. B. (2009). Superior temporal gyrus volume change in schizophrenia: a review on region of interest volumetric studies. Brain Res. Rev. 61, 14–32.
Takaki, H., Kikuta, R., Shibata, H., Ninomiya, H., Tashiro, N., and Fukumaki, Y. (2004). Positive associations of polymorphisms in the metabotropic glutamate receptor type 8 gene (GRM8) with schizophrenia. Am. J. Med. Genet. B Neuropsychiatr. Genet. 128B, 6–14.
Vounou, M., Nichols, T. E., and Montana, G. (2010). Discovering genetic associations with high-dimensional neuroimaging phenotypes: a sparse reduced-rank regression approach. Neuroimage 53, 1147–1159.
Watis, L., Chen, S. H., Chua, H. C., Chong, S. A., and Sim, K. (2008). Glutamatergic abnormalities of the thalamus in schizophrenia: a systematic review. J. Neural Transm. 115, 493–511.
Weinberger, D. R., Berman, K. F., and Zec, R. F. (1986). Physiologic dysfunction of dorsolateral prefrontal cortex in schizophrenia. I. Regional cerebral blood flow evidence. Arch. Gen. Psychiatry 43, 114–124.
Keywords: independent component analysis with reference, genome-wide association study, brain network, schizophrenia, single nucleotide polymorphisms, functional magnetic resonance imaging
Citation: Liu J, Ghassemi MM, Michael AM, Boutte D, Wells W, Perrone-Bizzozero N, Macciardi F, Mathalon DH, Ford JM, Potkin SG, Turner JA and Calhoun VD (2012) An ICA with reference approach in identification of genetic variation and associated brain networks. Front. Hum. Neurosci. 6:21. doi: 10.3389/fnhum.2012.00021
Received: 05 November 2011; Accepted: 04 February 2012;
Published online: 22 February 2012.
Edited by:
Kenneth Hugdahl, University of Bergen, NorwayReviewed by:
Tamer Demiralp, Istanbul University, TurkeyHenrik Walter, Charite Universitätsmedizin, Germany
Copyright: © 2012 Liu, Ghassemi, Michael, Boutte, Wells, Perrone-Bizzozero, Macciardi, Mathalon, Ford, Potkin, Turner and Calhoun. This is an open-access article distributed under the terms of the Creative Commons Attribution Non Commercial License, which permits non-commercial use, distribution, and reproduction in other forums, provided the original authors and source are credited.
*Correspondence: Jingyu Liu, The Mind Research Network, 1101 Yale Boulevard, Albuquerque, NM 87131, USA. e-mail: jliu@mrn.org