Time course of information processing in visual and haptic object classification
- 1 School of Psychology, University of Aberdeen, Aberdeen, UK
- 2 School of Psychology, University of Liverpool, Liverpool, UK
- 3 Institut für Psychologie, Universität Leipzig, Leipzig, Germany
Vision identifies objects rapidly and efficiently. In contrast, object recognition by touch is much slower. Furthermore, haptics usually serially accumulates information from different parts of objects, whereas vision typically processes object information in parallel. Is haptic object identification slower simply due to sequential information acquisition and the resulting memory load or due to more fundamental processing differences between the senses? To compare the time course of visual and haptic object recognition, we slowed visual processing using a novel, restricted viewing technique. In an electroencephalographic (EEG) experiment, participants discriminated familiar, nameable from unfamiliar, unnamable objects both visually and haptically. Analyses focused on the evoked and total fronto-central theta-band (5–7 Hz; a marker of working memory) and the occipital upper alpha-band (10–12 Hz; a marker of perceptual processing) locked to the onset of classification. Decreases in total upper alpha-band activity for haptic identification of objects indicate a likely processing role of multisensory extrastriate areas. Long-latency modulations of alpha-band activity differentiated between familiar and unfamiliar objects in haptics but not in vision. In contrast, theta-band activity showed a general increase over time for the slowed-down visual recognition task only. We conclude that haptic object recognition relies on common representations with vision but also that there are fundamental differences between the senses that do not merely arise from differences in their speed of processing.
Introduction
Visual and haptic object recognition display several striking similarities. Behavioral evidence indicates that recognition in both modalities can be affected by comparable changes in stimulus input such as changes in orientation (Newell et al., 2001; Lacey et al., 2007; Craddock and Lawson, 2008) or size (Craddock and Lawson, 2009b). Furthermore, a multitude of studies have shown overlap of the neural structures involved in visual and haptic object recognition, with the lateral occipital complex (LOC; e.g., Deibert et al., 1999; Amedi et al., 2001, 2002; James et al., 2002, 2007; Sathian and Lacey, 2007; Miquee et al., 2008; Tal and Amedi, 2009) and the intraparietal sulcus (Zhang et al., 2004; Stilla and Sathian, 2008) particularly involved. This has led to the development of a multisensory model of object recognition (Lacey et al., 2009) in which a modality-independent representation underpins visual and haptic object recognition. Nevertheless, there are a number of key differences between the two modalities that make comparisons between them problematic, and, as yet, the time course of haptic identification of objects in representational areas of the brain is not understood.
Vision acquires information through multiple parallel channels that provide information on luminance, color, motion, depth, and other features from encountered scenes. These channels contribute to fast and accurate detection and identification of objects in the environment. Visually presented objects typically take around 1 s to name (e.g., Martinovic et al., 2008; Craddock and Lawson, 2009b), while neural activity differentiates between objects even earlier. For example, in an intracranial field potential study, Liu et al. (2009) have shown that it is possible to decode if an object belonged to one of five categories after approximately 100 ms. In macaques, optimal object classification performance on the basis of activity of inferotemporal (IT) neurons is reached around 125 ms after stimulus onset (Hung et al., 2005). Sugase et al. (1999) have shown that finer discrimination processing of item identity requires further time, taking about 50 ms longer.
In contrast to vision, haptics involves serial and discrete acquisition of information from different parts of objects (Lederman and Klatzky, 1987; Lakatos and Marks, 1999). Haptically presented objects usually require several seconds of exploration before being correctly named (e.g., Craddock and Lawson, 2008, 2009a). The slowness of haptic object recognition may stem from fundamental processing differences, but, alternatively, may be a by-product of the slow, sequential acquisition of information through touch and the resulting load on working memory. Grunwald et al. (1999) investigated neural activity during the retention period between the initial presentation and recall of novel haptic objects and during the actual haptic exploration of these objects (Grunwald et al., 2001) by measuring theta-band activity – slow frequency oscillatory activity (5–7 Hz) which can be observed in the human electroencephalogram (EEG) and has been associated with semantic retrieval (temporal sites; e.g., Bastiaansen et al., 2008), episodic retrieval (fronto-central sites; for a review see Nyhus and Curran, 2010) and working memory processing (fronto-central sites; e.g., Gevins et al., 1997). They found a correlation between the exploration time of novel objects and levels of central, parietal and parieto-temporal theta power, in line with the prediction that working memory integrates stimuli during haptic exploration.
Alpha-band oscillations (8–12 Hz), which can be seen clearly in spontaneous EEG during periods with no visual inputs (e.g., eyes closed), have long been considered to reflect cortical “idling” (Berger, 1929; Adrian, 1947), but have more recently been related to active inhibition of the visual cortex during ongoing cortical processing (Jensen and Mazaheri, 2010). Prior to Jensen’s influential work on the alpha-band and gating by inhibition, Klimesch and colleagues associated alpha-band oscillations with several cognitive processes. Early work associated upper alpha-band (10–12 Hz) desynchronization with searching of long-term memory and retrieval of semantic information (Klimesch, 1999), while more recent evidence suggests a broader role for upper alpha-band activity (Klimesch et al., 2007). When participants must withhold or control a response to a stimulus, there is an event-related increase and subsequent decrease in alpha-band synchrony. The initial increase in synchrony is interpreted as inhibitory suppression of perceptual areas exerted by top-down processes; the subsequent decrease reflects the gradual release of these areas from inhibition. This pattern is typically observed during complex cortical processes.
Klimesch and colleagues have extensively studied modulations of upper alpha-band oscillations during the retention of information in visual working memory (for a review, see Freunberger et al., 2011). Sauseng et al. (2009) have shown that alpha-band amplitude during the retention period systematically increases with load and strongly correlates with individual working memory capacity. Schack et al. (2005) found that alpha-band at right occipital sites coupled in phase with frontal theta-band activity during the retention period. This is further evidence of an integrative, large-scale network that inhibits irrelevant visual processes and is marked by alpha-band amplitude increases. This inhibition prevents the visual processes from interfering with working memory maintenance, which in turn is marked by theta-band amplitude increases.
These EEG measures also correlate with evidence from fMRI: Scheeringa et al. (2009) looked at patterns of theta and alpha-band activity and blood oxygen level dependent (BOLD) response during the retention period in a visual working memory task. Increases in alpha-band power at posterior right sites were functionally related to BOLD decreases in primary visual cortex and the posterior part of the middle temporal gyrus, while frontal theta power increases correlated with the medial prefrontal cortex, posterior cingulate and left angular gyrus. Thus, examination of oscillations in the EEG signal during ongoing haptic object recognition may reflect differences observed in previous fMRI comparisons of visual and haptic object recognition. In fMRI, studies of the networks involved in haptic object recognition have already suggested that different networks participate in the processing of familiar and unfamiliar objects. Specifically, for familiar objects visual imagery may be involved, since the degree of overlap and magnitude of activation in some areas of the LOC is higher than during haptic recognition of unfamiliar objects (Lacey et al., 2010). Effective connectivity analyses suggest that there is greater use of top-down mechanisms during haptic exploration of familiar objects, while LOC activity during exploration of unfamiliar objects is largely driven by bottom-up inputs (Deshpande et al., 2010).
An EEG study attempting to examine differences in the time course of visual and haptic object recognition encounters several difficulties. The main problem lies in their vastly different speeds of processing and in their overall levels of EEG activity. In order to be able to directly compare the neural markers of haptic and visual object recognition it is helpful to slow down visual processing to levels comparable to haptics. We developed a novel, restricted viewing technique to slow visual processing (Craddock et al., 2011; for a similar technique in face recognition, see Dopjans et al., 2012). This technique was then employed in an EEG experiment in which participants discriminated familiar, nameable (e.g., a hammer or a cup) from unfamiliar, unnamable objects both visually and haptically. Analyses focused on early (0–500 ms) evoked and long-latency (500–2500 ms) total activity in two bands: theta-band (5–7 Hz; a marker of working memory) and upper alpha-band (10–12 Hz; a marker of complex perceptual processing) locked to the stimulus onset. First, we predicted that there would be increases in total theta-band activity with time in both modalities, indicating an increasing working memory load as exploration continued (Grunwald et al., 1999). Second, we predicted that there would be decreases in alpha-band activity above occipital cortices in both vision and haptics; such decreases have been associated with complex perceptual processing (Klimesch et al., 2007). We also predicted that there would be differences between familiar and unfamiliar objects in total upper alpha-band activity in haptics but not in vision, indicating the operation of distinct perceptual processes in line with recent fMRI findings on haptic object recognition (Lacey et al., 2010).
Materials and Methods
Participants
Nineteen healthy participants with normal or corrected-to-normal vision received a small honorarium for participating in the study. Three participants were removed from the sample as technical problems occurred during the recording, leaving 16 participants (7 female, 2 left-handed, mean age 26, range 20–45 years). Individual written informed consent was obtained and the study was approved by the ethics committee of the School of Psychology at the University of Liverpool.
Stimuli and Procedure
A set of 50 familiar and 50 unfamiliar objects was used. The names of the familiar objects are given in the Appendix and photographs of all the objects are provided in the Supplementary Material. Unfamiliar objects were created by disassembling familiar objects until they were deemed to be unrecognizable or by gluing together several parts from different objects or by using rarely encountered objects such as specialist climbing tools. Examples of the objects can be seen in Figure 1. Each object was glued to a 20-cm2 ceramic tile and these real objects were presented on haptic trials. In order to create the visual stimulus set, each object was photographed along the approximate line-of-sight of a seated viewer, all with the same background and environmental context. The photographs were scaled such that the objects subtended approximately the same visual angle when presented on the touch-screen monitor as they would do when seen in real life from the same viewing distance. A blurred version of the photograph with the objects obscured using a black occluder was then overlaid on the image (see Figures 1 and 2).
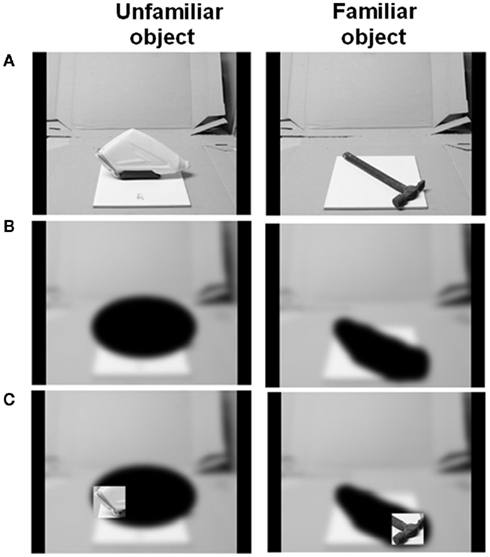
Figure 1. The process of generating stimulus images for the visual object recognition task. (A) Initial photograph of object against a standard background. (B) Photograph is blurred and the object occluded with black ellipses. (C) A square aperture revealing original photograph (no blur or occlusion) is guided across the image by the participant’s finger movements.
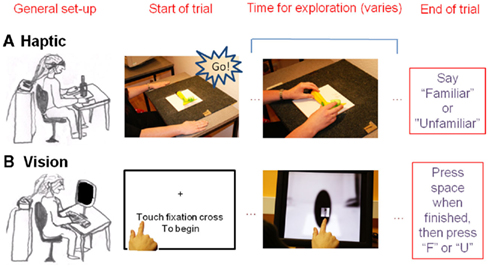
Figure 2. Trial outlook in the (A) haptic and (B) visual object identification tasks.
The experiment consisted of a visual block and a haptic block, each presenting 25 familiar and 25 unfamiliar items. Six different items were given as a practice before each block. The order of blocks was counterbalanced across participants. The task was to identify the object as familiar (nameable) or unfamiliar (unnamable). Allocation of objects to visual and haptic blocks was balanced across participants so that each object was presented visually and haptically equally often. In both blocks, participants were instructed not to make head movements or abrupt body movements that could disrupt the EEG electrode setup. They were also instructed to relax and to refrain from frowning or grinding their teeth during the EEG recording.
In the haptic task, participants were blindfolded and placed their hands on mats left and right of the centrally placed object (see Figure 2). Each object was presented in the same orientation to all participants. The trial began with the first experimenter saying “go.” This signaled the participant to move his hands toward the object and the second experimenter to send the trial onset trigger signal for the EEG recording. When the participant had recognized the object, they said “familiar” or “unfamiliar.” This signal led the second experimenter to send a trigger that marked the end of the trial.
In the visual task the trial began when the participants touched the fixation cross on a 15′′ touch-screen monitor (ELO Touchsystems, USA) set to a resolution of 1024 × 768 pixels. This initiated both the presentation of the stimulus image and the EEG start trigger. The index finger of the participant’s dominant hand controlled the position of a square aperture. This appeared just above their finger and so was initially centered near the fixation cross. Participants moved their finger over the monitor to view the object through the aperture (see Figure 2). They pressed the “space” key with their other hand as soon as they had made their familiarity decision, then typed “f” or “u” for familiar and unfamiliar objects respectively. The time taken to perform the haptic task is approximately 5 s (Craddock and Lawson, 2008). The size of the aperture was therefore chosen to produce a visual recognition time of approximately 5 s based on the results of a study using the restricted aperture viewing technique reported by Craddock et al. (2011).
EEG Recording and Data Pre-Processing
Electroencephalogram was recorded continuously from 64 locations using active Ag–AgCl electrodes (BioSemi Active-Two amplifier system; Biosemi, Amsterdam, The Netherlands) placed in an elastic cap. In this system the “ground” electrodes used in most EEG amplifiers are replaced by two additional active electrodes, positioned near to the electrode POz of the international 10–20 system (Jasper, 1958). These are common mode sense (CMS), which acts as a recording reference, and driven right leg (DRL), which serves as ground (Metting Van Rijn et al., 1990, 1991), see Figure 3.
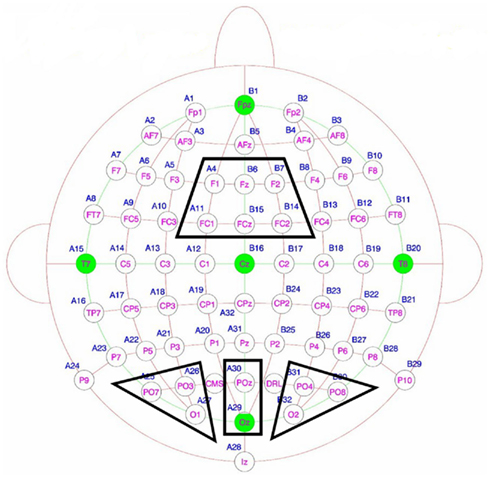
Figure 3. Electrode sites of interest: the fronto-central, left occipital, central occipital and right occipital clusters. The two active electrodes are shown in yellow: CMS is the Common Mode Sense electrode which acts as a recording reference and DRL is the Driven Right Leg electrode which serves as a ground.
Horizontal and vertical electrooculograms were recorded in order to correct for blinks and significant eye movements. Electrodes placed on the earlobes served as references for the initial importing of data into the analysis software. The EEG signal was sampled at a rate of 256 Hz and was segmented into onset-locked epochs. Onset-locked epochs started 1000 ms prior and lasted 3000 ms following stimulus onset. EEG data pre-processing was performed using the EEGlab toolbox (Delorme and Makeig, 2004), followed by time–frequency analysis using independent Matlab scripts (The Mathworks, Inc, Natick, MA, USA). Trials with gross artifacts were identified by visual inspection and removed as were trials with incorrect responses. The data was then average-referenced and a 40-Hz low-pass filter was applied.
Further artifact correction was performed using the independent component analysis (ICA) incorporated in the ADJUST plug-in for EEGlab (Mognon et al., 2010). ICA was performed on shorter trials lasting 1000 ms prior and 1000 ms following stimulus onset. ADJUST identifies artifactual ICA components through statistical properties characteristic of eye movements, blinks or noisy electrodes. Shorter trials were used for ICA as the procedure does not converge onto a solution as effectively for trials that are several seconds in length. The obtained ICA weights from these short trials were then used to remove artifactual components from the full trial data by copying the ICA decomposition to the 4-s trial epochs. Following this step, the FASTER (Fully Automated Statistical Thresholding for EEG artifact Rejection) plug-in for EEGlab (Nolan et al., 2010) was used to detect and interpolate contaminated channels and perform a further rejection of trials with excessive artifacts. An average of 21 out of the 25 trials per condition remained for the final analysis.
Due to the relatively small number of trials, we also assessed signal-to-noise ratio (SNR) using the approach proposed by Koenig and Melie-Garcia (2010). This approach assesses SNR using permutation tests on global field power (GFP). GFP is equivalent to the SD of the electrode values at each time point and can thus be taken as an indicator of signal quality. We assessed the time-points of stable, satisfactory SNR for every condition in each participant. In most participants, the SNR for every condition had stabilized before stimulus onset and in the vast majority of cases1 it had stabilized by 250 ms after stimulus onset.
Analysis of Evoked and Total Spectral Changes
Spectral changes in oscillatory activity were analyzed using the Morlet wavelet approach (Bertrand and Pantev, 1994), which offers a good compromise between time and frequency resolution (Tallon-Baudry and Bertrand, 1999). This method provides a time-varying estimate of signal magnitude in each frequency band producing a time-by-frequency (TF) representation. In order to achieve good time and frequency resolution in the lower-frequency range (5–12 Hz), the wavelet family in this study was defined by a constant m = f0/σf = 10, with f0 ranging from 0.25 to 25 Hz in 0.25 Hz steps. These wavelets had a frequency-dependent duration with longer windows at lower frequencies, which is optimal for successfully convolving slower oscillatory signals (e.g., at 5 Hz there are five oscillations per second). Subsequently, this was collapsed to form 1 Hz-wide wavelets. Time-varying energy in a given frequency band was calculated for each epoch by taking the absolute value of the convolution of the signal with the wavelet. Evoked and total (both evoked and induced) frequency activity were analyzed separately.
Electrode clusters for statistical analysis were identified on the basis of previous findings (left, right, and central occipital for upper alpha and fronto-central for theta-band, as reviewed by Klimesch, 1999; Klimesch et al., 2007; see Figure 3). These were confirmed by an overview of grand-mean topographical plots. To depict the topographical distributions of activity, maps of oscillatory responses in the selected frequency windows were calculated by means of spherical spline interpolations (Perrin et al., 1988) for all conditions. After the convolution of the signal with the wavelets, topographical evolution of activity within the theta and alpha-bands was visually examined using 500 ms windows from 500 ms before stimulus onset to 2500 ms after stimulus onset. The choice of such relatively long visualization windows was due to the low temporal resolution of wavelets. Although the averaging of trials and participants leads to an increase in SNR and thus in statistical power, the wavelet size is still a limitation when assessing exact temporal properties of EEG activity. Smearing of the baseline due to the convolution of the signal with the wavelets is also often visible in plots of lower-frequency data.
Baseline activity (from −500 to 0 ms) was subtracted prior to statistical comparisons. Evoked activity was analyzed only in the early window (0–500 ms). Both the visual and haptic tasks involved exploratory movements that would likely diverge after the initial exploratory period. Thus, evoked activity would be more pronounced than the induced components in this relatively early window only. Evoked theta-band activity was analyzed using a two-way repeated measures ANOVA with the factors familiarity and modality, while evoked upper alpha-band activity was analyzed with a three-way repeated measures ANOVA with the factors modality, familiarity, and electrode site.
Total activity was analyzed in time windows of 500 ms spanning from 500 to 2500 ms. Total theta-band activity at fronto-central sites was analyzed using a three-way repeated measures ANOVA with the factors modality (visual or haptic), object familiarity (familiar or unfamiliar) and time window (500–1000, 1000–1500, 1500–2000, 2000–2500 ms), while total upper alpha-band activity was analyzed using a four-way repeated measures ANOVA with the factors modality (visual or haptic), object familiarity (familiar or unfamiliar), time window (500–1000, 1000–1500, 1500–2000, 2000–2500 ms) and electrode site (right, left, occipital). Greenhouse-Geisser correction was used where necessary. Repeated-measures ANOVA, Tukey’s HSD, and Bonferroni-corrected paired t-tests were used for post-hoc testing.
Results
Behavioral Data
Response times and percentage errors were analyzed using a repeated measures ANOVA with the factors modality (visual or haptic) and object familiarity (familiar or unfamiliar). Only response times on correct trials were included in the analysis.
There was a main effect of response modality for errors [F(1,15) = 18.557, p = 0.001,  ] but not for RTs [F(1,15) = 0.730, p = 0.4,
  ]. Responses on visual trials (7288 ms; 17% errors) were of similar speed but less accurate than responses on haptic trials (7774 ms; 9%). There was a main effect for familiarity for both RTs [F(1,15) = 54.338, p < 0.001,
  ] and errors [F(1,15) = 43.504, p < 0.001,
  ]. Responses were both faster and more accurate to familiar objects (5429 ms; 6%) than to unfamiliar objects (9633 ms; 20%).
There was also an interaction between modality and object familiarity for RTs [F(1,15) = 8.505, p = 0.01,  ] and errors [F(1,15) = 24.887, p < 0.001,
  ], see Figure 4. Post hoc Tukey’s HSD tests showed that familiar objects were recognized with similar speed and accuracy in both vision (5629 ms, 6% errors) and haptics (5228 ms, 6%). However, RTs increased more for unfamiliar objects in haptics (10319 ms) than in vision (8946 ms), while errors were higher in vision (27%) than in haptics (12%).
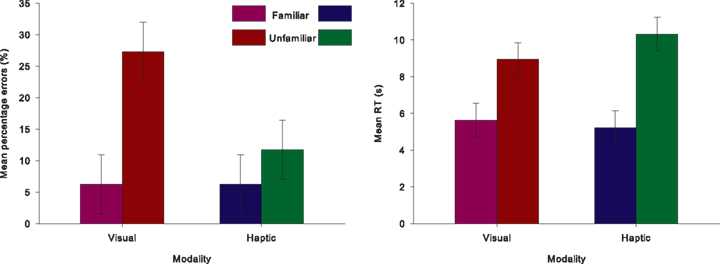
Figure 4. Behavioral data. Percentage of errors and reaction times for correctly identified objects are shown, with error bars indicating within-participant confidence intervals based on the MSE of the interaction between modality and object familiarity (Jarmasz and Hollands, 2009).
Total Activity
Figures 5 and 6 show topographical plots of total theta-band (5–7 Hz) and upper alpha-band (10–12 Hz) activity respectively. Figure 7 shows the time courses of activity in these bands.
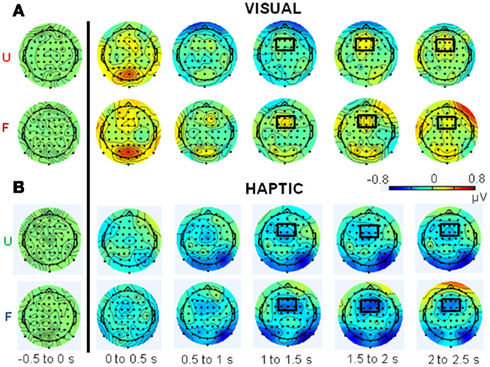
Figure 5. Topographical plots of total theta-band (5–7 Hz) activity for the (A) visual and (B) haptic object recognition tasks. Plots are displayed in 500 ms time segments, from −500 to 2500 ms, with the black line indicating stimulus onset. “U” stands for unfamiliar and “F” for familiar objects. Note: same scale for vision and haptics.
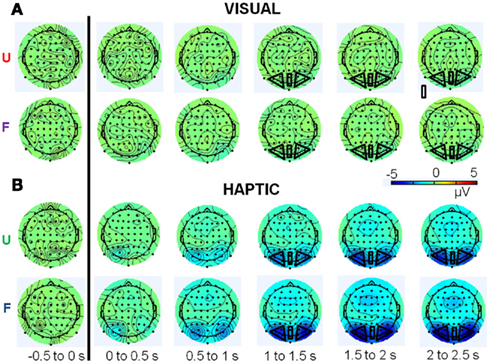
Figure 6. Topographical plots of total upper alpha-band (10–12 Hz) activity for the (A) visual and (B) haptic object recognition tasks. Plots are displayed in 500 ms time segments, from −500 to 2500 ms, with the black line indicating stimulus onset. “U” stands for unfamiliar and “F” for familiar objects. Note: same scale for vision and haptics.
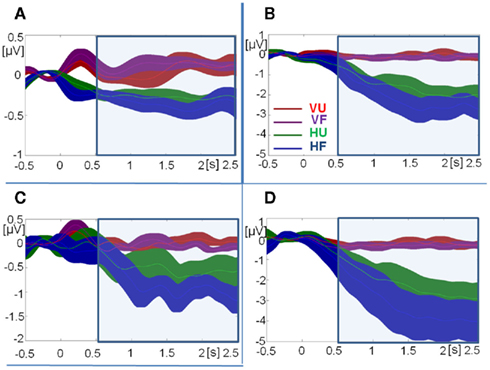
Figure 7. Time courses of grand-mean total activity. (A) Theta-band activity at fronto-central sites. (B) Upper alpha-band activity at central occipital sites. (C) Upper alpha-band activity at left occipital sites. (D) Upper alpha-band activity at right occipital sites. Note: different scales for theta-band (A) and upper alpha-band activity (B–D). Error bars indicate SE of the mean at every time-sample. VU, visual unfamiliar; VF, visual familiar; HU, haptic unfamiliar; HF, haptic familiar. The blue square indicates the analysis window.
Total theta-band activity was analyzed at fronto-central sites across four time windows (0.5–1, 1–1.5, 1.5–2, and 2–2.5 s). Overall, theta-band activity was higher in visual than in haptic object recognition [F(1,15) = 18.71, p < 0.001,  ]. There was also an interaction between modality and time [F(3,45) = 4.85, p < 0.05,
  ]. However, post hoc Tukey’s HSD tests reflected only the main effect of modality, with no significant change in theta amplitude between any two time windows in either modality. Other effects and interactions were not significant (p > 0.1).
In the upper alpha-band, the focus of analysis was on activity at occipital sites. There was a main effect of time window [F(3,45) = 13.43, p < 0.001,  ], consistent with our prediction that alpha amplitude would decrease over time. There was also an overall difference between the visual and haptic modalities [F(1,15) = 10.92, p < 0.005,
  ], with strong desynchronization in haptics, and a main effect of electrode site [F(2,30) = 4.42, p < 0.05,
  ], which was driven by a tendency for higher activity at left sites compared to central sites [left vs. central, t(15) = −2.35, p = 0.1; all other ps > 0.1]. There was no main effect of familiarity [F(1,15) = 3.17, p = 0.1,
  ].
].
Importantly, there was a three-way interaction between modality, familiarity, and time window [F(3,45) = 3.97, p < 0.05,  ]. Since this interaction appeared to reflect diverging activity patterns between vision and haptics (see Figure 6), we examined this interaction using separate repeated measures ANOVAs on the effects of familiarity and time window in each modality. There were no significant main effects or interactions in vision (all ps > 0.1); thus, alpha-band amplitude in the visual condition did not decrease over time and did not differ between familiar and unfamiliar objects. However, in haptics there was both a main effect of time [F(3,45) = 14.14, p < 0.01] and an interaction between time and familiarity [F(3,45) = 5.03, p < 0.01], but no main effect of familiarity (p > 0.1). Tukey’s HSD tests on the interaction showed that this was due to a steeper and deeper decline in amplitudes in the familiar condition than in the unfamiliar condition. Alpha amplitude did not differ between familiar and unfamiliar objects in the 500- to 1000-ms window. However, while it decreased in the 1000- to 1500-ms time window in both conditions, it also began to diverge according to familiarity: there was a greater amplitude decrease in the familiar condition. The difference between the familiar and unfamiliar conditions was maintained throughout the following time windows, as amplitudes declined further in the 1500- to 2000-ms window before stabilizing in the 2000- to 2500-ms window.
Although there were significant two-way interactions between modality and time window [F(3,45) = 13.48, p < 0.001,  ] and familiarity and time window [F(3,45) = 4.47, p < 0.05, ], the drivers of these interactions are better described by the three-way interaction above, and thus they are not analyzed further.
There was also a significant interaction between electrode site and modality [F(2,30) = 4.22, p < 0.05,  ]. However, post hoc t-tests could not clarify this interaction.
Evoked Activity
Figures 8 and 9 show topographical plots and line plots of evoked theta-band (5–7 Hz) and upper alpha-band (10–12 Hz) activity respectively. The focus of analysis was on the early time window 0–500 ms after stimulus onset2.
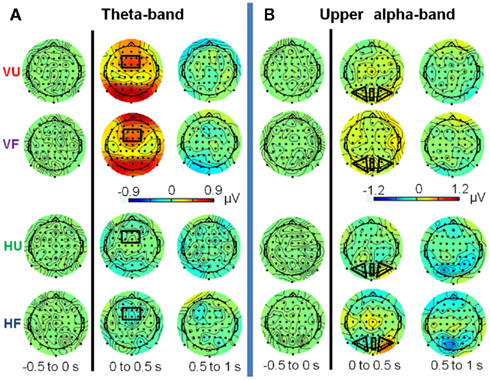
Figure 8. Topographical plots of evoked theta-band [(A); 5–7 Hz] and upper alpha-band [(B); 10–12 Hz] activity for the visual and haptic object recognition tasks. Plots are displayed in 500 ms time segments, from −500 to 1000 ms, with the black line indicating stimulus onset. VU, visual unfamiliar; VF, visual familiar; HU, haptic unfamiliar; HF, haptic familiar. Note: different scales for the bands.
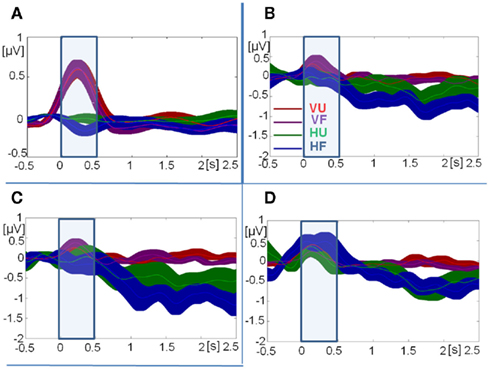
Figure 9. Time courses of grand-mean evoked activity. (A) Theta-band activity at fronto-central sites. (B) Upper alpha-band activity at central occipital sites. (C) Upper alpha-band activity at left occipital sites. (D) Upper alpha-band activity at right occipital sites. Note: different scales for theta-band (A) and upper alpha-band activity (B–D). Error bars indicate SE of the mean at every time-sample. VU, visual unfamiliar; VF, visual familiar; HU, haptic unfamiliar; HF, haptic familiar. The blue square indicates the analysis window.
Theta-band activity at fronto-central sites differed by modality [F(1,15) = 39.70, p < 0.001] but not by object familiarity [F(1,15) = 1.66, n.s.]. There was no interaction between these two factors [F(1,15) = 1.56, n.s.].
Upper alpha-band activity did not show any significant differences on any of the three factors: modality [F(1,15) = 1.99, n.s.], familiarity [F(1,15) = 0.56, n.s.] or electrode cluster [F(2,30) = 2.42, n.s.]. None of the interactions were significant, although there was a trend for a three-way interaction [F(2,30) = 3.73, p = 0.06]. Post hoc tests were not able to indicate a source for this potential interaction, as they were all insignificant.
Discussion
The study examined the time course of neural activity characteristic of haptic object recognition and compared it with the time course of slowed-down visual object recognition. Our main interest was on differential patterns of theta and alpha-band activity when recognizing familiar as opposed to unfamiliar objects in haptics and in vision. We observed long-latency changes in total upper alpha-band activity at occipital sites that differed over time between familiar and unfamiliar objects when presented haptically but not when presented visually. We also observed higher theta-band activity in vision but not in haptics at fronto-central sites.
Theoretically, the most interesting finding concerns the likely involvement of perceptual occipital cortices relatively early in haptic object recognition. Total occipital upper alpha-band activity stayed around baseline levels in vision but decreased relative to baseline in haptics. This suggests that occipital cortices are involved in the recognition of objects for both vision and haptics. However, this interpretation is complicated by a lack of alpha-band desynchronization relative to baseline in our visual task. The lack of desynchronization may have been a by-product of the task, due to the enforced stage-by-stage dynamics of vision which was used to artificially slow down the recognition.
An initial increase and subsequent decrease in alpha-band amplitude is characteristic of complex perceptual processing (Klimesch et al., 2007). The initial increase in evoked upper alpha-band activity is thought to reflect a phase-resetting of alpha-band activity to prepare the visual cortex for efficient processing of new information. This could be achieved by inhibiting ongoing patterns of alpha-band activity, a process that is reported to be linked with an evoked amplitude increase after stimulus presentation (Min et al., 2007). However, due to the different timing of finger movements across trials, this evoked increase/decrease pattern would have translated into induced activity, with every finger movement triggering a new visual onset and thus a rapid increase and subsequent decrease in visual alpha-activity. These increases and decreases would therefore largely cancel each other out in grand-mean total activity. Nevertheless, by comparing the patterns observed in haptic upper alpha-band activity with previous findings of visual upper alpha-band activity, we conclude that occipital cortices are involved early in haptic processing. This is consistent with models of object recognition in which vision and haptics share common object representations that are encoded in shape-specific extrastriate regions such as LOC (e.g., Amedi et al., 2001; Amedi et al., 2002; Zhang et al., 2004; Stilla and Sathian, 2008; Lacey et al., 2009).
A prominent finding concerned the large differences in activity between vision and haptics. The setup for the two conditions was necessarily different: participants were blindfolded and moving both arms in response to an auditory cue as opposed to starting by pressing the finger of the dominant hand on the screen, followed by coordinated eye and hand movements over the screen. This complicates drawing any conclusions from modality differences, as they could be confounded by performance differences between tasks. In contrast differences between modalities that involve differences between responses to familiar and unfamiliar objects, and their respective time courses are more interpretable.
There were differences between vision and haptics in the evolution of occipital total upper alpha-band activity when discriminating familiar, nameable objects from unfamiliar, unnamable objects. Total upper alpha-band desynchronization kept increasing in haptics, in particular for familiar objects. This increase, shown to be dominant between 1000 and 2000 ms after stimulus onset is consistent with greater involvement of visual cortices for familiar objects. This is consistent with the fMRI studies described in the introduction, which suggested that the networks involved in haptic recognition of familiar objects show greater overlap with visual object recognition and have stronger top-down input than those involved in haptic recognition of unfamiliar objects (Deshpande et al., 2010; Lacey et al., 2010). Thus, greater desynchronization for haptically explored familiar objects may be due to larger top-down inputs, which impact in particular on measures of total alpha-band activity.
In total theta-band activity at fronto-central sites, the general pattern of activity across time also differed between the modalities. While activity had increased relative to baseline in vision, in haptics theta-band activity remained steady below baseline in the period between 500 and 2500 ms after stimulus onset. Grunwald et al. (1999, 2001) observed increasing theta-band power during the maintenance period of a haptic memory task and during active haptic exploration, and suggested that working memory was necessary to maintain representations of individual object parts. However, participants in Grunwald’s study explored sunken reliefs more akin to two-dimensional line drawings than the real, three-dimensional objects here, and were required to reproduce those relief patterns after exploration. This may have required a higher working memory load than that needed here, where participants could explore objects normally and only had to try to identify them. Under normal exploration conditions, haptics may integrate information from sequential explorations in a more efficient manner than when many of the normal sources of information such as depth cues (Lawson and Bracken, 2011) are removed. The absence of familiarity effects indicates that the theta-band activity reflects task demands rather than stimulus identity differences.
Rapid representational processes may have been better reflected by gamma-band activity, which has been extensively studied in object representation (for recent reviews see Tallon-Baudry, 2009; Martinovic and Busch, 2011; Rieder et al., 2011), or in the phase–phase or phase–amplitude coupling between low and high frequency activity (Canolty and Knight, 2010). However, the focus of this study was solely on theta (5–7) Hz and upper alpha-band (10–12 Hz) activity. These lower-frequency bands are less affected by muscular artifacts in the EEG which result from the participant’s preparation and execution of movements. Such activity still occurs in the alpha and beta bands and presents itself around central left and right sites (the so-called mu rhythm; Pineda, 2005). However, it is not likely that the occipital alpha-band modulations observed in this study were due to the mu rhythm. Visual occipital alpha-band activity generally has sources in the calcarine sulci and parieto-occipital areas whereas mu rhythms are seen at fronto-central sites, most often lateralized above the central electrodes C3 and C4, and have sources in the Rolandic fissure (for a review see Niedermeyer, 1997).
Although alpha-band can be modulated by low-level stimulus features (e.g., spatial frequency in vision, see Fründ et al., 2007) it is not clear if low-level features of haptic objects could cause the modulation that we observed. Surface properties such as texture, size or hardness play an important role in recognizing real objects (for a discussion, see Lawson and Bracken, 2011), but the familiar and unfamiliar stimuli used here were approximately matched for materials and shapes. There is considerable evidence that parieto-occipital alpha-band oscillations affect perception (Romei et al., 2010) and that they are influenced by early top-down inputs (Sauseng et al., 2005; Thut et al., 2006). Thus the differences between the evolution of activity for familiar and unfamiliar objects that appear between 1000 and 2000 ms after stimulus onset may be related to a differential interface of bottom-up and top-down processes in the two networks recently identified by fMRI studies (Deshpande et al., 2010).
Taken together, the observed modulations of theta and alpha-band activity suggest a dominant role for perceptual rather than working memory processes when trying to haptically recognize objects. It may imply that any working memory resources used during haptic recognition are different to those used during slowed-down visual recognition or haptic exploration of complex two-dimensional objects (Grunwald et al., 2001). Additionally, in our behavioral data, there were no between modality differences in performance for familiar objects, but participants were slower and less accurate for haptically explored unfamiliar objects than for visually explored unfamiliar objects.
Ours is the first EEG study to directly compare visual and haptic object recognition. We have found clear evidence of the involvement of occipital cortices in haptic object recognition. We found that in the period between 1000 and 2000 ms after stimulus onset the occipital cortices are more active in familiar than in unfamiliar haptic object recognition. Our results provide some indication of the time course of activations in the occipital cortices, complementing the findings of recent fMRI studies on the involvement of multisensory extrastriate areas in haptic object recognition (Deshpande et al., 2010; Lacey et al., 2010), and are thus both consistent with and extend the prevailing view that visual and haptic object recognition share similar resources and neural substrates.
Conflict of Interest Statement
The authors declare that the research was conducted in the absence of any commercial or financial relationships that could be construed as a potential conflict of interest.
Acknowledgments
We would like to thank Nicola Williams for help with data acquisition. The scripts for data analysis used wavelet analysis routines written by Thomas Gruber, to whom we are also grateful for advice on correct parameters for the time–frequency analyses. Research was supported by a British Academy small grant.
Supplementary Material
The Supplementary Material for this article can be found online at http://www.frontiersin.org/Human_Neuroscience/10.3389/ fnhum.2012.00049/abstract
Footnotes
- ^In three participants, visual unfamiliar conditions suffered from intermittent noisiness even after 250 ms.
- ^Note that participants need around 500 ms to start touching the object, whereas the process of moving the finger into the object area may have been faster in the visual condition. This may have influenced the time course of activations, in particular in these early time windows.
References
Amedi, A., Jacobson, G., Hendler, T., Malach, R., and Zohary, E. (2002). Convergence of visual and tactile shape processing in the human lateral occipital complex. Cereb. Cortex 12, 1202–1212.
Amedi, A., Malach, R., Hendler, T., Peled, S., and Zohary, E. (2001). Visuo-haptic object-related activation in the ventral visual pathway. Nat. Neurosci. 4, 324–330.
Bastiaansen, M. C. M., Oostenveld, R., Jensen, O., and Hagoort, P. (2008). I see what you mean: theta power increases are involved in the retrieval of lexical semantic information. Brain Lang. 106, 15–28.
Berger, H. (1929). Über das elektrenkephalogramm des menschen. Arch. Psychiatr. Nervenkr. 87, 527–570.
Bertrand, O., and Pantev, C. (1994). “Stimulus frequency dependence of the transient oscillatory auditory evoked response (40 Hz) studied by electric and magnetic recordings in human,” in Oscillatory Event-Related Brain Dynamics, eds C. Pantev, T. Elbert, and B. Lütkenhöner (New York: Plenum Press), 231–242.
Canolty, R. T., and Knight, R. T. (2010). The functional role of cross-frequency coupling. Trends Cogn. Sci. (Regul. Ed.) 14, 506–515.
Craddock, M., and Lawson, R. (2008). Repetition priming and the haptic recognition of familiar and unfamiliar objects. Percept. Psychophys. 70, 1350–1365.
Craddock, M., and Lawson, R. (2009a). Do left and right matter for haptic recognition of familiar objects? Perception 38, 1355–1376.
Craddock, M., and Lawson, R. (2009b). The effects of size changes on haptic object recognition. Atten. Percept. Psychophys. 71, 910–923.
Craddock, M., Lawson, R., and Martinovic, J. (2011). An advantage for active versus passive aperture viewing in visual object recognition. Perception 40, 1154–1163.
Deibert, E., Kraut, M., Kremen, S., and Hart, J. (1999). Neural pathways in tactile object recognition. Neurology 52, 1413–1417.
Delorme, A., and Makeig, S. (2004). EEGLAB: an open source toolbox for analysis of single-trial EEG dynamics including independent component analysis. J. Neurosci. Methods 134, 9–21.
Deshpande, G., Hu, X. P., Lacey, S., Stilla, R., and Sathian, K. (2010). Object familiarity modulates effective connectivity during haptic shape perception. Neuroimage 49, 1991–2000.
Dopjans, L., Bülthoff, H. H., and Wallraven, C. (2012). Serial exploration of faces: comparing vision and touch. J. Vis. 12(1), 1–14. doi:10.1167/12.1.6
Freunberger, R., Werkle-Bergner, M., Griesmayr, B., Lindenberger, U., and Klimesch, W. (2011). Brain oscillatory correlates of working memory constraints. Brain Res. 1375, 93–102.
Fründ, I., Busch, N. A., Korner, U., Schadow, J., and Herrmann, C. S. (2007). EEG oscillations in the gamma and alpha range respond differently to spatial frequency. Vision Res. 47, 2086–2098.
Gevins, A., Smith, M. E., Mcevoy, L., and Yu, D. (1997). High-resolution EEG mapping of cortical activation related to working memory: effects of task difficulty, type of processing, and practice. Cereb. Cortex 7, 374–385.
Grunwald, M., Weiss, T., Krause, W., Beyer, L., Rost, R., Gutberlet, I., and Gertz, H. J. (1999). Power of theta waves in the EEG of human subjects increases during recall of haptic information. Neurosci. Lett. 260, 189–192.
Grunwald, M., Weiss, T., Krause, W., Beyer, L., Rost, R., Gutberlet, I., and Gertz, H. J. (2001). Theta power in the EEG of humans during ongoing processing in a haptic object recognition task. Cogn. Brain Res. 11, 33–37.
Hung, C. P., Kreiman, G., Poggio, T., and Dicarlo, J. J. (2005). Fast readout of object identity from macaque inferior temporal cortex. Science 310, 863–866.
James, T. W., Humphrey, G. K., Gati, J. S., Menon, R. S., and Goodale, M. A. (2002). Differential effects of viewpoint on object-driven activation in dorsal and ventral streams. Neuron 35, 793–801.
James, T. W., Kim, S., and Fisher, J. S. (2007). The neural basis of haptic object processing. Can. J. Exp. Psychol. 61, 219–229.
Jasper, H. H. (1958). The 10-20 electrode system of the International Federation. Electroencephalogr. Clin. Neurophysiol. 10, 370–375.
Jarmasz, J., and Hollands, J. G. (2009). Confidence intervals in repeated-measures designs. Can. J. Exp. Psychol. 63, 124–138.
Jensen, O., and Mazaheri, A. (2010). Shaping functional architecture by oscillatory alpha activity: gating by inhibition. Front. Hum. Neurosci. 4:186. doi:10.3389/fnhum.2010.00186
Klimesch, W. (1999). EEG alpha and theta oscillations reflect cognitive and memory performance: a review and analysis. Brain Res. Rev. 29, 169–195.
Klimesch, W., Sauseng, P., and Hanslmayr, S. (2007). EEG alpha oscillations: the inhibition-timing hypothesis. Brain Res. Rev. 53, 63–88.
Koenig, T., and Melie-Garcia, L. (2010). A method to determine the presence of averaged event-related fields using randomization tests. Brain Topogr. 23, 233–242.
Lacey, S., Flueckiger, P., Stilla, R., Lava, M., and Sathian, K. (2010). Object familiarity modulates the relationship between visual object imagery and haptic shape perception. Neuroimage 49, 1977–1990.
Lacey, S., Peters, A., and Sathian, K. (2007). Cross-modal object recognition is viewpoint-independent. PLoS ONE 2, e890. doi:10.1371/journal.pone.0000890
Lacey, S., Tal, N., Amedi, A., and Sathian, K. (2009). A putative model of multisensory object representation. Brain Topogr. 21, 269–274.
Lakatos, S., and Marks, L. E. (1999). Haptic form perception: relative salience of local and global features. Percept. Psychophys. 61, 895–908.
Lawson, R., and Bracken, S. (2011). Haptic object recognition: how important are depth cues and plane orientation? Perception 40, 576–597.
Lederman, S. J., and Klatzky, R. L. (1987). Hand movements – a window into haptic object recognition. Cogn. Psychol. 19, 342–368.
Liu, H. S., Agam, Y., Madsen, J. R., and Kreiman, G. (2009). Timing, timing, timing: fast decoding of object information from intracranial field potentials in human visual cortex. Neuron 62, 281–290.
Martinovic, J., and Busch, N. A. (2011). High frequency oscillations as a correlate of visual perception. Int. J. Psychophysiol. 79, 32–38.
Martinovic, J., Gruber, T., Hantsch, A., and Müller, M. M. (2008). Induced gamma-band activity is related to the time point of object identification. Brain Res. 1198, 93–106.
Metting Van Rijn, A. C., Peper, A., and Grimbergen, C. A. (1990). High quality recording of bioelectric events: I: interference reduction, theory and practice. Med. Biol. Eng. Comput. 28, 389–397.
Metting Van Rijn, A. C., Peper, A., and Grimbergen, C. A. (1991). High quality recording of bioelectric events. II: a low noise low-power multichannel amplifier design. Med. Biol. Eng. Comput. 29, 433–440.
Min, B. K., Busch, N. A., Debener, S., Kranczioch, C., Hanslmayr, S., Engel, A. K., and Herrmann, C. S. (2007). The best of both worlds: phase-reset of human EEG alpha activity and additive power contribute to ERP generation. Int. J. Psychophysiol. 65, 58–68.
Miquee, A., Xerri, C., Rainville, C., Anton, J. L., Nazarian, B., Roth, M., and Zennou-Azogui, Y. (2008). Neuronal substrates of haptic shape encoding and matching: a functional magnetic resonance imaging study. Neuroscience 152, 29–39.
Mognon, A., Jovicich, J., Bruzzone, L., and Buiatti, M. (2010). ADJUST: an automatic EEG artifact detector based on the joint use of spatial and temporal features. Psychophysiology 48, 229–240.
Newell, F. N., Ernst, M. O., Tjan, B. S., and Bulthoff, H. H. (2001). Viewpoint dependence in visual and haptic object recognition. Psychol. Sci. 12, 37–42.
Niedermeyer, E. (1997). Alpha rhythms as physiological and abnormal phenomena. Int. J. Psychophysiol. 26, 31–49.
Nolan, H., Whelan, R., and Reilly, R. B. (2010). FASTER: fully automated statistical thresholding for EEG artifact rejection. J. Neurosci. Methods 192, 152–162.
Nyhus, E., and Curran, T. (2010). Functional role of gamma and theta oscillations in episodic memory. Neurosci. Biobehav. Rev. 34, 1023–1035.
Perrin, F., Pernier, J., Bertrand, O., and Echallier, J. F. (1988). Spherical splines for scalp potential and current source density mapping. Electroencephalogr. Clin. Neurophysiol. 72, 184–187.
Pineda, J. A. (2005). The functional significance of mu rhythms: translating “seeing” and “hearing” into “doing.” Brain Res. Rev. 50, 57–68.
Rieder, M. K., Rahm, B., Williams, J. D., and Kaiser, J. (2011). Human gamma-band activity and behavior. Int. J. Psychophysiol. 79, 39–48.
Romei, V., Gross, J., and Thut, G. (2010). On the role of prestimulus alpha rhythms over occipito-parietal areas in visual input regulation: correlation or causation? J. Neurosci. 30, 8692–8697.
Sathian, K., and Lacey, S. (2007). “Cross-modal involvement of visual cortex in tactile perception,” in Spatial Processing in Navigation, Imagery and Perception, eds F. Mast and L. Jäncke (New York: Springer), 119–134.
Sauseng, P., Klimesch, W., Heise, K. F., Gruber, W. R., Holz, E., Karim, A. A., Glennon, M., Gerloff, C., Birbaumer, N., and Hummel, F. C. (2009). Brain oscillatory substrates of visual short-term memory capacity. Curr. Biol. 19, 1846–1852.
Sauseng, P., Klimesch, W., Stadler, W., Schabus, M., Doppelmayr, M., Hanslmayr, S., Gruber, W. R., and Birbaumer, N. (2005). A shift of visual spatial attention is selectively associated with human EEG alpha activity. Eur. J. Neurosci. 22, 2917–2926.
Schack, B., Klimesch, W., and Sauseng, P. (2005). Phase synchronization between theta and upper alpha oscillations in a working memory task. Int. J. Psychophysiol. 57, 105–114.
Scheeringa, R., Petersson, K. M., Oostenveld, R., Norris, D. G., Hagoort, P., and Bastiaansen, M. C. M. (2009). Trial-by-trial coupling between EEG and BOLD identifies networks related to alpha and theta EEG power increases during working memory maintenance. Neuroimage 44, 1224–1238.
Stilla, R., and Sathian, K. (2008). Selective visuo-haptic processing of shape and texture. Hum. Brain Mapp. 29, 1123–1138.
Sugase, Y., Yamane, S., Ueno, S., and Kawano, K. (1999). Global and fine information coded by single neurons in the temporal visual cortex. Nature 400, 869–873.
Tal, N., and Amedi, A. (2009). Multisensory visual-tactile object related network in humans: insights gained using a novel crossmodal adaptation approach. Exp. Brain Res. 198, 165–182.
Tallon-Baudry, C. (2009). The roles of gamma-band oscillatory synchrony in human visual cognition. Front. Biosci. 14, 321–332.
Tallon-Baudry, C., and Bertrand, O. (1999). Oscillatory gamma activity in humans and its role in object representation. Trends Cogn. Sci. (Regul. Ed.) 3, 151–162.
Thut, G., Nietzel, A., Brandt, S. A., and Pascual-Leone, A. (2006). Alpha-band electroencephalographic activity over occipital cortex indexes visuospatial attention bias and predicts visual target detection. J. Neurosci. 26, 9494–9502.
Zhang, M., Weisser, V. D., Stilla, R., Prather, S. C., and Sathian, K. (2004). Multisensory cortical processing of object shape and its relation to mental imagery. Cogn. Affect. Behav. Neurosci. 4, 251–259.
Appendix
Keywords: vision, haptics, object classification, EEG, alpha-band activity, theta-band activity
Citation: Martinovic J, Lawson R and Craddock M (2012) Time course of information processing in visual and haptic object classification. Front. Hum. Neurosci. 6:49. doi: 10.3389/fnhum.2012.00049
Received: 24 November 2011; Accepted: 24 February 2012;
Published online: 23 March 2012.
Edited by:
Hans-Jochen Heinze, University of Magdeburg, GermanyReviewed by:
Christoph S. Herrmann, Carl von Ossietzky University, GermanyJochen Kaiser, Johann Wolfgang Goethe University, Germany
Copyright: © 2012 Martinovic, Lawson and Craddock. This is an open-access article distributed under the terms of the Creative Commons Attribution Non Commercial License, which permits non-commercial use, distribution, and reproduction in other forums, provided the original authors and source are credited.
*Correspondence: Matt Craddock, Institut für Psychologie, Universität Leipzig, Seeburgstraße 14-20, 04103 Leipzig, Germany. e-mail: matt.craddock@uni-leipzig.de