Malleability of the approximate number system: effects of feedback and training
- 1 Center for Cognitive Neuroscience, Levine Science Research Center, Duke University, Durham, NC, USA
- 2 Department of Neurobiology, Duke University, Durham, NC, USA
- 3 Department of Psychology and Neuroscience, Duke University, Durham, NC, USA
Prior research demonstrates that animals and humans share an approximate number system (ANS), characterized by ratio dependence and that the precision of this system increases substantially over human development. The goal of the present research was to investigate the malleability of the ANS (as measured by Weber fraction) in adult subjects in response to feedback and to explore the relationship between ANS acuity and acuity on another magnitude comparison task. We tested each of 20 subjects over six 1-h sessions. The main findings were that (a) Weber fractions rapidly decreased when trial-by-trial feedback was introduced in the second session and remained stable over continued training, (b) Weber fractions remained steady when trial-by-trial feedback was removed in session 6, (c)Weber fractions from the number comparison task were positively correlated with Weber fractions from a line length comparison task, (d) improvement in Weber fractions in response to feedback for the number task did not transfer to the line length task, (e) finally, the precision of the ANS was positively correlated with math, but not verbal, standardized aptitude scores. Potential neural correlates of the perceptual information and decision processes are considered, and predictions regarding the neural correlates of ANS malleability are discussed.
Introduction
Mathematics is a uniquely human domain because it requires symbolic manipulation and an explicit understanding of the operations that allow calculation. However, in addition to a symbolic number capacity, adult humans also have an approximate number sense that allows us to estimate quantity without the use of symbols or language. Unlike precise symbolic representations of individual numbers, the approximate number system (ANS) encodes numerosities in a fuzzy fashion. A confluence of evidence suggests that the ANS emerges early in infancy and is shared by non-human animals (for reviews, see Dehaene, 1997; Feigenson et al., 2004). One basic feature of the ANS is that it follows Weber’s law; the discriminability of two numerosities varies as a function of the ratio between them.
During the course of normal human development the ANS becomes more precise. Convergent evidence from multiple behavioral procedures demonstrates that while 6-month-old human infants require a 1:2 ratio to discriminate large numerosities, by 9-month they are able to discriminate a 2:3 ratio (e.g., Lipton and Spelke, 2004; Libertus and Brannon, 2010). Furthermore, cross-sectional studies that model Weber fraction (w) with explicit choice tasks indicate that the acuity of the ANS continues to increase from age 3 into adolescence (Halberda and Feigenson, 2008; see Piazza and Izard, 2009 for meta-analysis). At each age, however, and into adulthood there exists a large amount of inter-individual variability in w. Not surprisingly, an easy numerical discrimination for one person may be difficult for another.
One dominant theory is that the ANS serves as a foundation for symbolic mathematics (e.g., Dehaene, 1997; Wynn, 1998). Psychophysical markers such as the symbolic distance effect indicate that mathematical symbols are mapped onto analog magnitudes (Moyer and Landauer, 1967). Brain-imaging data indicate that symbolic calculations often activate the same brain areas involved in approximate estimation implying that the ANS is recruited during calculation (Fias et al., 2003; Venkatraman et al., 2005; Holloway et al., 2010). Only recently, however, has evidence emerged that individual differences in w are correlated with symbolic mathematical abilities (Halberda et al., 2008; Gilmore et al., 2010; Lyons and Beilock, 2011). These studies show that children and adults with higher ANS acuity (i.e., lower w) perform better in basic arithmetic and on standardized math tests. Furthermore, ANS acuity in preschoolers with no formal mathematics training correlates with later symbolic math performance, implying that ANS acuity may play a causal role in the development of higher math skills (Mazzocco et al., 2011b). Other evidence for the relationship between symbolic mathematics and number sense comes from atypically developing children. Developmental dyscalculia is a specific learning deficit in mathematics, and there is evidence that some dyscalculic children have severely impaired ANS acuity (Piazza et al., 2010; Mazzocco et al., 2011a). In addition, attempts to improve mathematical performance in dyscalculics that have centered on strengthening the connection between symbolic number representations and non-verbal numerosity representations (arrays of dots) have met with some success (Wilson et al., 2006b; Kucian et al., 2011).
The fact that symbolic math ability and the ANS are correlated throughout childhood raises the exciting possibility that honing the ANS could have lasting effects on symbolic mathematics. If so, even before children learn the meaning of number words interventions that increase ANS acuity may produce increases in math aptitude. The idea that ANS acuity might serve a foundational role in developing mathematical achievement, however, cannot be addressed without a better characterization of the ANS. For example, how reliable are measures of ANS acuity and can ANS acuity be improved with extended training?
Another important question is how the ANS relates to the perception and discrimination of other magnitudes. Walsh (2003) proposed a theory of magnitude (ATOM), which asserts that time, space, and number are all processed by a common analog magnitude system that depends on common parietal brain systems (see also Meck and Church, 1983; Cantlon et al., 2009). A prediction of ATOM is that individual variability in the ANS should be systematically related to precision in other magnitude judgments (e.g., temporal or size-based). A large literature addresses these questions in humans and animals using interference paradigms, transfer of learning tasks, and neuroimaging methods (for reviews, see Hubbard et al., 2005; Bueti and Walsh, 2009). Positive evidence from any of these sources could reflect a strong version of ATOM whereby two or more magnitudes are represented by a single common neural currency or a weaker version where different magnitudes share some common cognitive algorithms such as a comparison process (Cantlon et al., 2009).
We explored the malleability of ANS acuity by testing whether a simple training procedure in which we provided extended training over six sessions would improve ANS acuity. We also tested a prediction of ATOM by looking for correlations in Weber fractions derived from the numerosity comparison and those derived from a similar line length comparison task. In addition, our training paradigm allowed us to test a prediction of the strong version of ATOM by assessing whether improvements in the acuity of the ANS would transfer to line length comparison. We reasoned that if number and line length were represented using the same underlying representation (strong hypothesis), that any improvement in the number task would lead to an improvement in the line length task. If, however, we saw an improvement in ANS precision that did not transfer to the line length comparison we could conclude that the representations were not entirely overlapping, and more specifically the magnitude representations did not overlap on the level at which improvement occurred.
Materials and Methods
Participants
Participants were 20 adults (mean = 21.18 years, range 18.19–30.15 years) recruited from the Duke University community. Eleven of the 20 participants were female. One additional participant was excluded because she did not receive feedback during the second session due to experimenter error. All participants gave written informed consent in accordance with a Duke IRB approved protocol.
Design
Each participant completed six sessions within 2 weeks. On session 1, participants performed the numerosity comparison task and the line length comparison task and did not receive any trial-by-trial feedback. On sessions 2–5, participants performed only the numerosity task and received trial-by-trial feedback. On session 6, participants performed the numerosity and line length tasks without trial-by-trial feedback. Each of the six sessions of the numerosity task contained six 108 trial blocks for a total of 648 trials per session. The two line length sessions each contained two 108 trial blocks for a total of 216 trials per session. In the final session participants self-reported their verbal and math SAT or GRE scores and these scores were later confirmed for 15/20 participants.
To motivate the participants to stay engaged in the task they were compensated based on performance. Each participant earned 0.0125 USD per correct answer in the numerosity task and 0.0375 USD per correct answer in the line length task. These performance bonuses were added to a baseline rate of 7.50 USD for sessions 1 and 6 and 5 USD for sessions 2–5. To motivate participants to complete the study they were given an additional 50 USD for completing all six sessions within a 2-week period.
Tasks
The Numerosity Comparison Task
On each trial participants were presented with an array of intermixed black and white dots on a gray background for 200 ms. Half the participants were instructed to indicate whether there were more black dots or white dots, and the other half were instructed to indicate whether there were fewer black dots or white dots. Participants responded by pressing a black or white button on the keyboard, and the side of the response keys was counterbalanced across subjects. Although the stimuli were presented for only 200 ms, participants were allowed as long as they needed to respond and were encouraged to take their time and to be as accurate as possible. In the feedback sessions, a green or red screen lasting 1500 ms indicated a correct or incorrect choice respectively. The feedback screen was followed by a gray preparatory screen (1500 ms). In the no-feedback sessions, any response resulted in a blue screen (1500 ms) followed by a gray preparatory screen (1500 ms). Participants were given a break between each 108 trial block and were also allowed to pause the experiment at any time.
The Line Length Comparison Task
The structure was similar to the numerosity task, however, subjects were presented with a white and a black horizontal line and were required to indicate which was longer (or for half the subjects which was shorter) by pressing a black or white key. The line length comparison task was never administered with feedback, and it was only completed on sessions 1 and 6.
Stimuli and Apparatus
Each numerical stimulus consisted of an array of intermixed white and black dots (Figure 1). We tested six ratios of dots: 1:2, 2:3, 3:4, 5:6, 7:8, and 11:12. Absolute numerosity was roughly equated across the ratios, and the total number of dots within an array varied from 20 to 75. To ensure that subjects used numerosity and not surface area to complete the task on 1/3 of trials the total surface area of the array with fewer dots was smaller than the total surface area of the more numerous dots, on 1/3 of trials area was equal, and on 1/3 total surface area of the fewer dots was larger than the surface area of the more numerous dots. Similarly, to prevent subjects from using the size of the individual dots, on 1/3 of trials the average dot size of the fewer dots was smaller than the average dot size of the more numerous dots, and on 2/3 of trials the more numerous dots were smaller. The dots were drawn within a circle with a radius of 300 pixels.

FIGURE 1. Example stimuli from the numerical (left) and line length (right) tasks. The numerical stimulus has 33 white dots and 36 black dots and is an example of an 11:12 ratio. The black line in the line length stimulus is smaller than the white line by a factor of 11:12.
The line stimuli consisted of one black and one white horizontal bar positioned at a constant vertical position (counterbalanced for which color was on top), but jittered horizontally from trial to trial (Figure 1). The same six ratios were used for line lengths and numerosities. The length of the bars varied from 64 to 384 pixels.
All stimuli were generated offline using custom MATLAB (MathWorks) scripts, and were presented using Psychophysics Toolbox Version 3 for MATLAB. Stimuli were presented and data collected on either a Dell Inspiron 530S or a Dell Optiplex 330. Participants made their response on a standard keyboard. Small stickers were used to denote the “black” and “white” response keys.
Modeling
For the purpose of modeling we assumed a linear internal representation of number with scalar variability following Pica et al. (2004) and Halberda et al. (2008). The error rate in our task is given by
Where n1 is the numerosity of the larger set, n2 is the numerosity of the smaller set, w is the measure of variance in the internal representation, and erfc is the complementary error function. We generated global estimates of w for each participant as well as session by session estimates of w for each participant by fitting this model to our data (Pica et al., 2004). Figure 2 shows one participant’s accuracy across different ratios and the model fit.
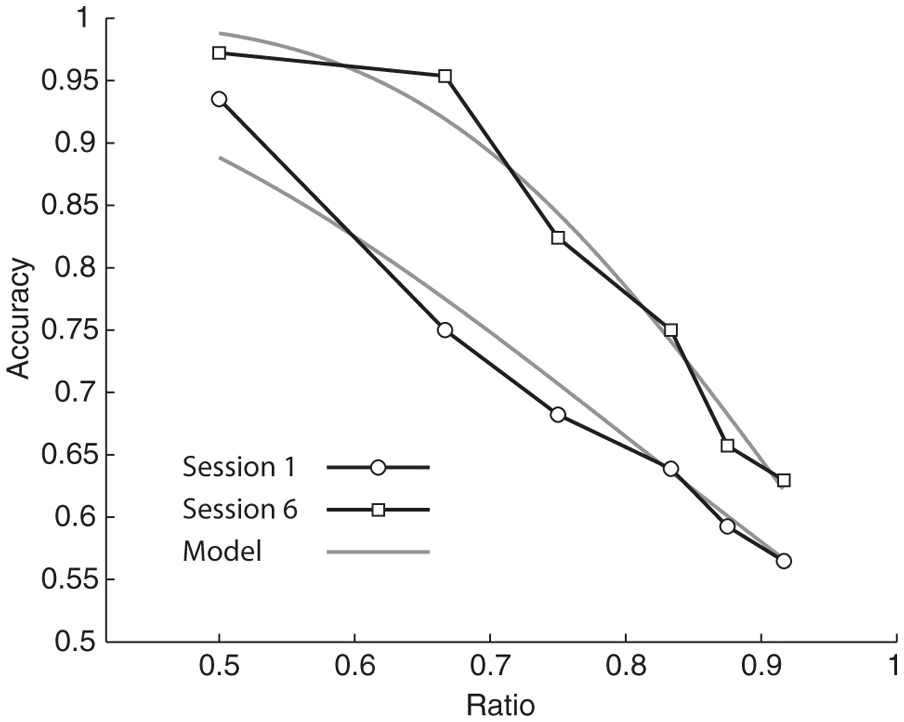
FIGURE 2. Data collected from a single participant showing improvement in number acuity between session 1 (circles) and session 6 (squares). Gray lines show model predictions for the best fit w for session 1 (w = 0.37) and session 6 (w = 0.20).The improvement in w was typical of our sample.
Surface Area Effect Index
As described above we controlled for surface area by using three randomly intermixed trial types. To assess the role of surface area on performance we calculated a surface area effect index by taking the absolute value of the difference between the accuracy on the trials where the smaller number of dots had fewer pixels (congruent) and the accuracy on the trials where the smaller number of dots had more pixels (incongruent). We also calculated a non-rectified surface area effect index by computing the difference between congruent and incongruent trials, but not taking the absolute value. This measure allowed us to assess whether the population as a whole had a bias toward congruent or incongruent trials before and after training.
Treatment of Outliers
Three of our participants (1, 5, and 16) returned w scores that were greater than 3 standard deviations above the mean (1.49, 1.23, and 1.36 respectively) for one of the six number sessions. On the other five sessions, these subjects’ w values were within the same range as the other participants. We included these participants in our main analyses, but also reran the statistics excluding these three subjects to confirm the robustness of our findings. Unless otherwise noted, all tests reported as significant were also significant without outliers at p < 0.05, and tests reported as non-significant were also not significant without outliers at p > 0.1.
Results
There was strong ratio dependence in accuracy (b = -0.77, p ≪ 0.0001)1 and response time (b = 0.53, p ≪ 0.0001) for the numerosity comparison task. The mean w for the sample was 0.33 with a standard deviation of 0.15. Within session reliability was computed by correlating split-halves of our six blocks and correcting for test length using the Spearman-Brown formula. Reliability was good, ranging from 0.83 to 0.94 over the six sessions. Our multi-session training procedure allowed us to further examine test-retest reliability across the 6 days of the study. Figure 3 shows the strong positive correlation between w scores computed from the first session and last session.
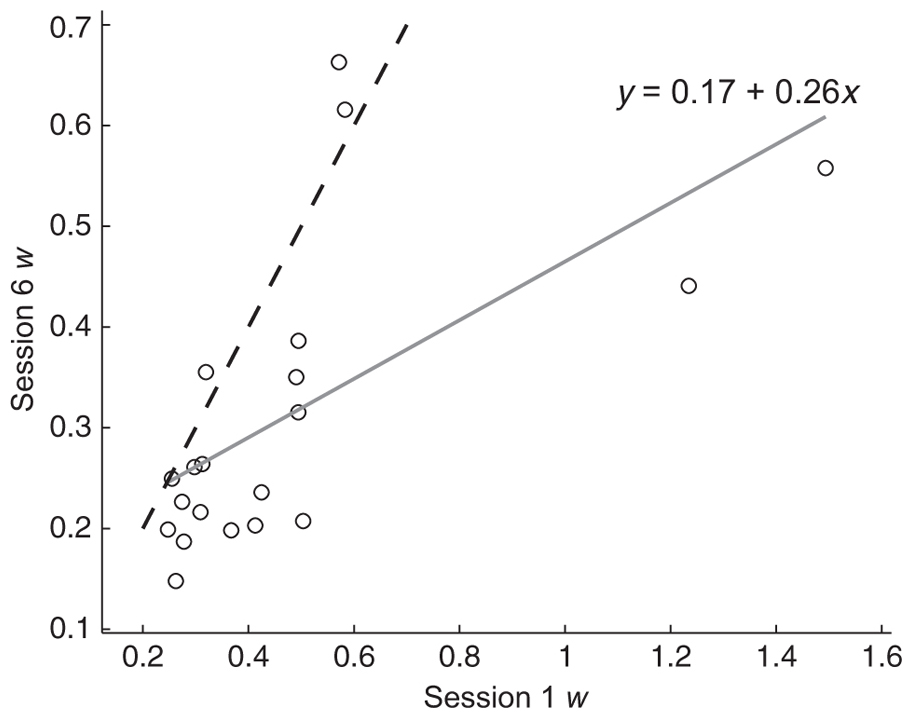
FIGURE 3. Numerosity w scores calculated from session 6 plotted against numerosity w scores calculated from session 1. The dashed line shows equality. Participants below the equality line showed improvement in ANS acuity between sessions 1 and 6.The solid gray line is the best fit to the data and the equation shows the intercept and slope (r2 = 0.40, p < 0.005).
To determine if w scores improved (decreased) with training we calculated w scores for each participant for each session. We then fit a logarithmic regression model to individual w scores with regressors for session number and participant (Figure 4A). The model accurately predicted w scores (R2 = 0.72, p ≪ 0.0001), and we found that w scores improved with training (b = -0.047, p < 0.005). However, the improvement in w scores occurred within the second session (the first session with feedback) and remained stable during the rest of training. Session 1 w scores were significantly higher than session 2 w scores (paired t-test, p < 0.005) and were also higher than session 6 w scores (paired t-test, p < 0.01). A logarithmic regression model applied to the session 2 through session 6 data showed no effect of session on w (b = 0.008, p = 0.65) demonstrating that the improvement in w was accomplished within the first session of trial-by-trial feedback and did not continue with extended training. Figure 2 shows the accuracy data and model fit of a single participant for sessions 1 and 6. The improvement in w was typical of our sample.
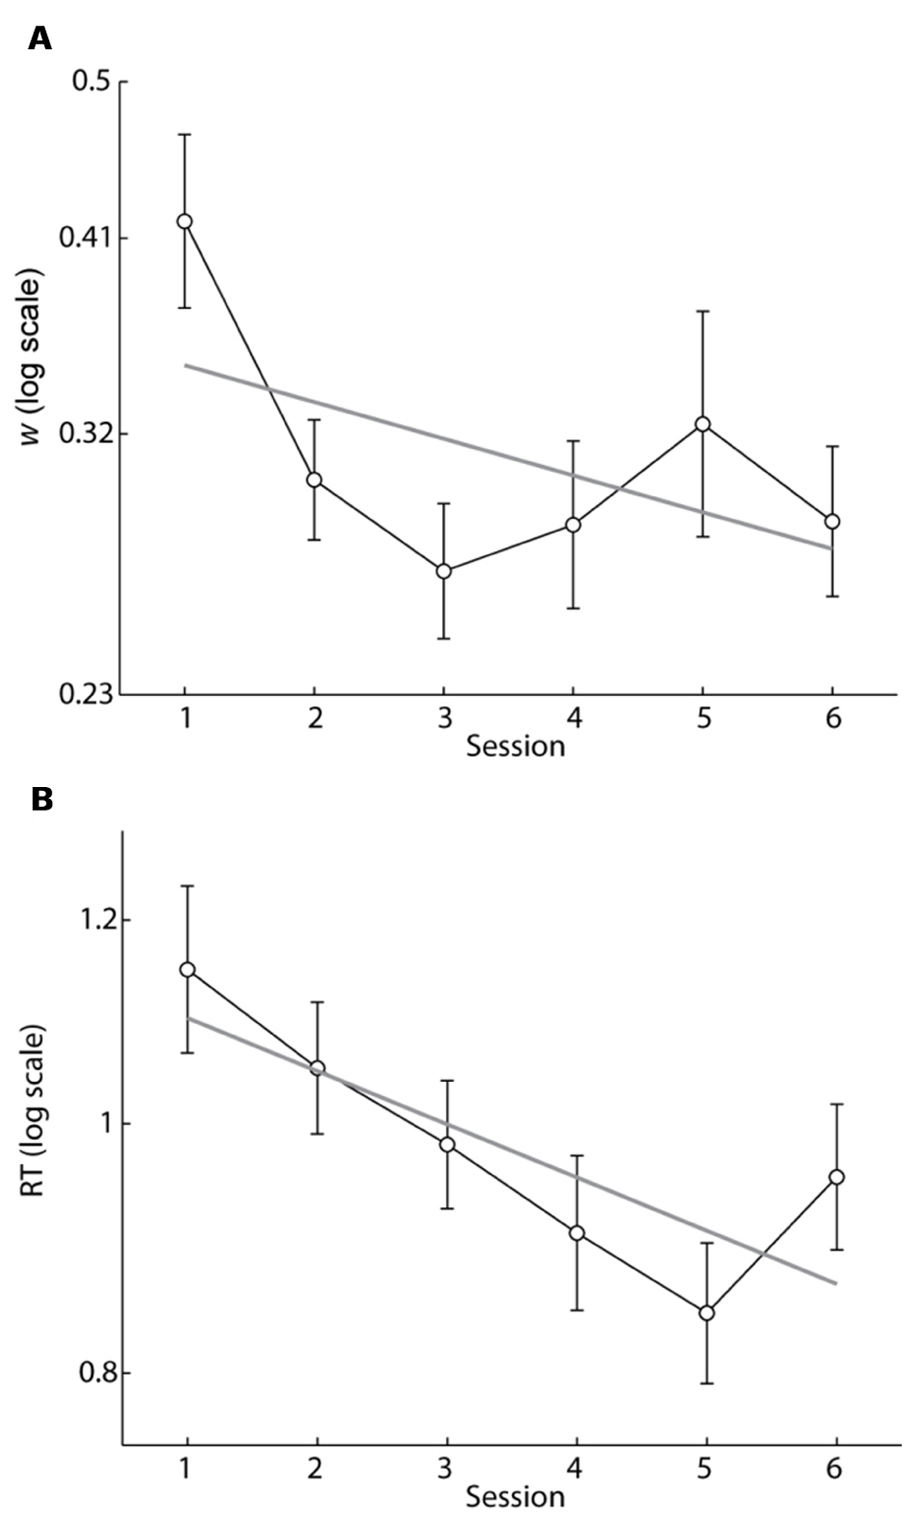
FIGURE 4. (A) Mean w scores as a function of session number. Gray line is the best fit regression line to log(w) (b =-0.047, p < 0.005) accounting for repeated measures. Note the rapid decrease in w between sessions 1 and 2 where trial-by-trial feedback was introduced. Acuity did not improve further after session 2, but was sustained after feedback was removed on session 6. (B) Mean of the median RT for correct responses as a function of session number. Gray line is the best fit regression line to log(RT) (b =-0.048, p ≪ 0.0001) accounting for repeated measures. RT continued to decrease with further training. Error bars indicate SEMs.
To determine if response time decreased with training we fit a logarithmic regression model with regressors for session number and participant to the median correct RT calculated for each subject for each session (Figure 4B). The model accurately predicted RT (R2 = 0.83, p ≪ 0.0001), and RT decreased with training (b = -0.048, p ≪ 0.0001). Unlike w, however, RT continued to decrease from session 2 to 6 (b = -0.035, p < 0.0001). RT rebounded slightly on session 6 when feedback was removed. Nevertheless RT during session 6 was significantly lower than on session 1 indicating that the improvement was retained in the absence of feedback (paired t-test, p < 0.005).
To measure the effect of cumulative surface area on participants’ numerical estimation over training a surface area effect index was calculated by taking the absolute value of the difference between the accuracy on trials where the smaller number of dots had fewer pixels (congruent trials) and the accuracy on trials where the smaller number of dots had more pixels (incongruent trials). A linear regression accounting for repeated measures was then fit to the surface area index (R2 = 0.49, p ≪ 0.0001). The surface area effect index significantly decreased over sessions (b = -0.02, p < 0.005; Figure 5), indicating that at least part of the improvement in the numerosity task was due to a decrease in reliance on surface area as a cue for number. There was, however, variability across participants in the degree to which surface area affected numerosity judgments and also in the direction of this influence. During the first session most participants performed better on area congruent than on area incongruent trials. The mean non-rectified surface area effect index was significantly positive (mean = 0.24, SD = 0.27; t-test, p < 0.001), indicating higher accuracy on congruent trials. However, by the last session participants performed equally well on both types of trials (mean = -0.07, SD = 0.22; t-test, p = 0.17). Surprisingly, when outliers were removed from this analysis the non-rectified surface area index was slightly negative indicating that subjects performed better on incongruent trials by the last session (mean = -0.09, SD = 0.16; t-test,p < 0.05).
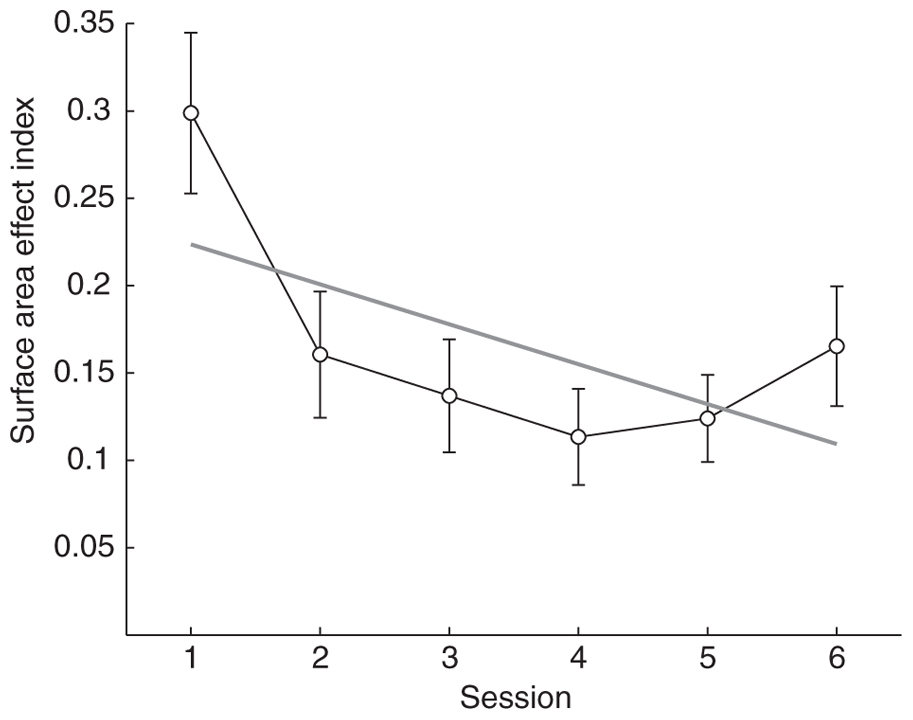
FIGURE 5. Mean surface area effect index as a function of session number. The effect of surface area on accuracy decreased rapidly with the introduction of trial-by-trial feedback, plateaued after session 2, but remained low after feedback was removed on session 6. Gray line indicates the linear best fit accounting for repeated measures. Error bars indicate SEMs.
On a third of trials the cumulative surface area of the white dots and the black dots was equal. We looked at accuracy on this subset of trials in order to ascertain whether the improvement in w we observed was due solely to the decrease in bias caused by surface area, or whether other factors might also be contributing to improvement. We found that accuracy on area equal trials was well fit by a linear regression (R2 = 0.67; p ≪ 0.0001) and trended toward a significant positive slope (b = 0.0043; p < 0.1; without outliers p < 0.05). Closer examination of the data showed that the effect was not linear over sessions, but that all the improvement occurred between sessions 1 and 2. We ran a two-way ANOVA with factors for session and participant to confirm the effect of session on equal area accuracy [F(5,95) = 4.81; p < 0.001]. In post hoc (-tests we found that accuracy on area equal trials increased between sessions 1 and 6 (paired t-test, p < 0.005) and between sessions 1 and 2 (paired t-test, p < 0.001), but not between sessions 2 and 6 (paired t-test, p = 0.80). The rapid increase in accuracy between sessions 1 and 2 demonstrates a comparable time course to our findings for w and for the surface area effect index.
Overall, line length w scores (mean = 0.07, SD = 0.02) were much lower than number w scores (mean = 0.33, SD = 0.15) indicating that the line length task was easier. Despite having different absolute ranges, w for line length and numerosity were positively correlated on session 1 (Figure 6A), r2 = 0.44, p < 0.005) and on session 6 (r2 = 0.38, p < 0.005) consistent with a weak version of ATOM. Line length comparison tests were only given on the first and last session and subjects were never given trial-by-trial feedback on this task. Thus, any improvement from session 1 to session 6 on the line length task could be attributed to training on the number task and would thus reflect transfer across magnitudes as predicted by a strong version of ATOM. However, a comparison of w scores from the first session and the last session yielded no evidence of improvement in line length acuity (one-tailed paired t-test: p = 0.283). We examined the relationship between change in acuity on the numerosity task and change in acuity on the line length task in individual participants, but found no correlation (Figure 6B), r2 = 0.00, p = 0.99) indicating that subjects who improved on the number task were no more or less likely to have improved on the line length task.
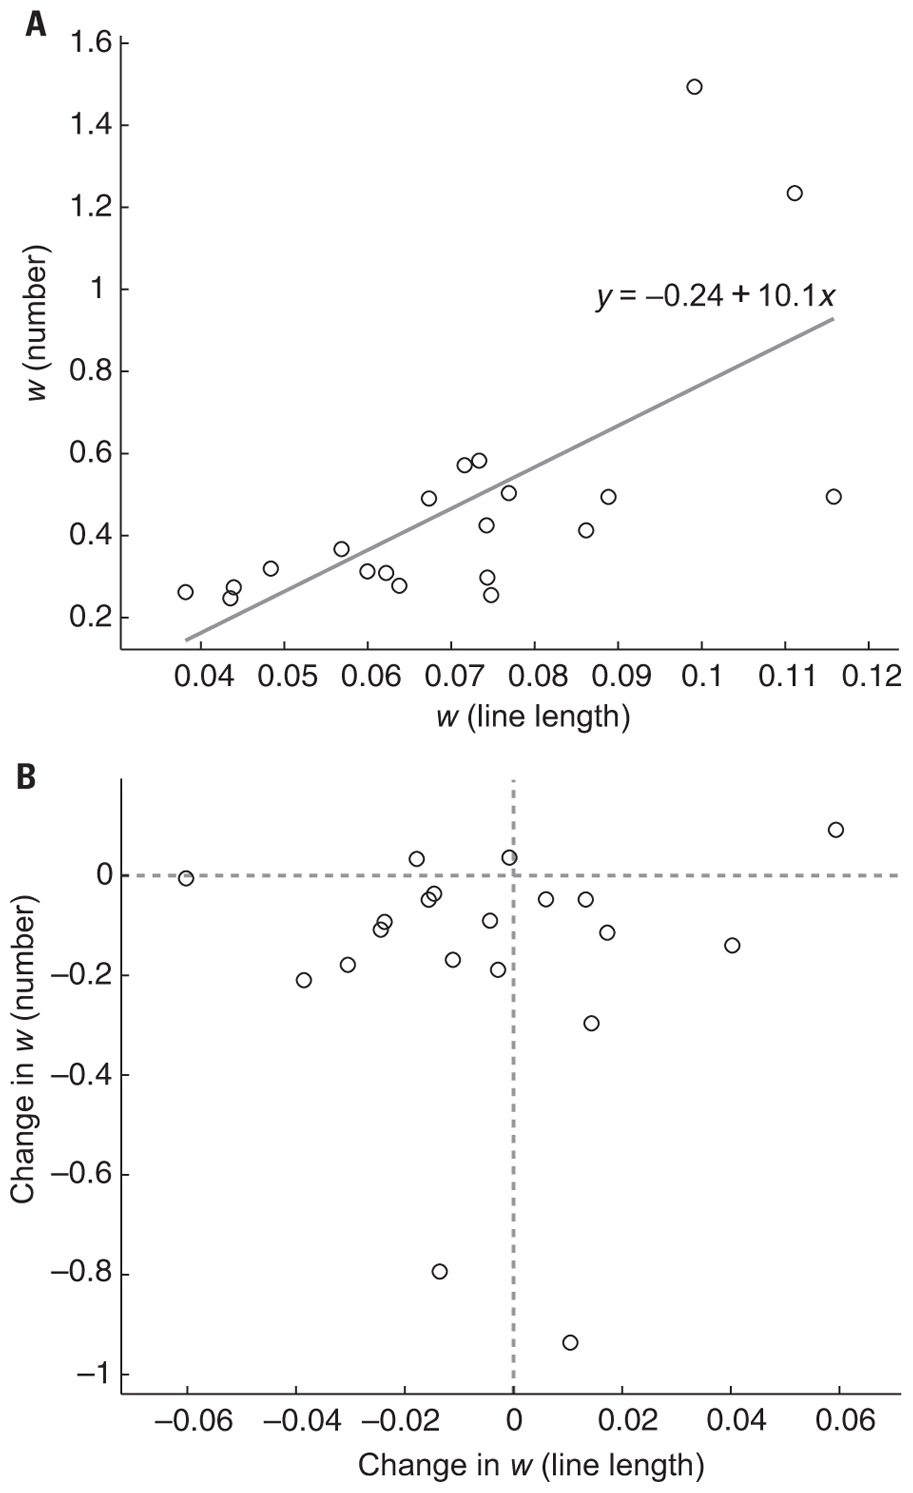
FIGURE 6. (A) Numerosity w scores were positively correlated with line length w scores on session 1 (r2 = 0.44, p < 0.005) and session 6 (r2 = 0.38, p < 0.005, data not shown). Gray line is the best fit to the data and the equation shows the intercept and slope. (B) Change from session 1 to session 6 in numerosity w scores plotted against the change in line length w scores over the same period. Numerosity w scores were not correlated with any improvement in line length w scores (r2 = 0.00, p = 0.99). Note that most participants (17/20) had a negative change in ANS w indicating an improvement. Change in line length w, however, was evenly distributed around 0 indicating no improvement in line length acuity in the population. Data points to the left of the vertical dotted line indicate an increase in line length comparison acuity whereas data points to the right indicate a decrease in line length comparison acuity from session 1 to session 6. Data points below the horizontal dotted line indicate an increase in numerosity comparison acuity whereas data points above indicate a decrease in numerosity comparison acuity from session 1 to session 6.
Accuracy on the line length task was very high on both the first and last sessions (mean correct = 93.6% and 93.9% respectively), which may have created a ceiling effect that obscured any improvement on the line length task from session 1 to session 6. We addressed this concern by assessing change in accuracy on only the most difficult 11:12 ratio line length comparison (mean accuracy 80.1%, SD = 10.6% and 84.6%, SD = 10.4% during sessions 1 and 6 respectively). Consistent with the original analysis, we found no evidence of improvement in accuracy on this subset of trials between sessions 1 and 6 (one-tailed paired t-test: p = 0.12). This confirms that number training caused no detectable improvement in line length acuity. Furthermore, there was no correlation between improvement in w scores for the number task and change in accuracy on these most difficult line length comparisons (r2 = 0.01, p = 0.68).
Previous reports have demonstrated that standardized math scores correlate with numerical acuity in children (Halberda et al., 2008; Gilmore et al., 2010; Mazzocco et al., 2011b). One recent study also showed a positive correlation between w and mental arithmetic in adults however the relationship was mediated by ordinal symbol knowledge (Lyons and Beilock, 2011). Consistent with these reports we found a negative correlation between SAT/GRE score and w (Figure 7A, r2 = 0.28, p < 0.02) and no correlation between verbal SAT/GRE score and w (Figure 7B, r2 = 0.08, p = 0.23). This negative correlation did not hold when the three participants with single-session outlier data were excluded (without outliers: r2 = 0.04, p = 0.47). However, when w was recalculated for these three subjects excluding the single session for which each subject exhibited an outlier w score the negative correlation was significant with math SAT/GRE scores (r2 = 0.27, p < 0.05), but not verbal scores (r2 = 0.08, p = 0.22).
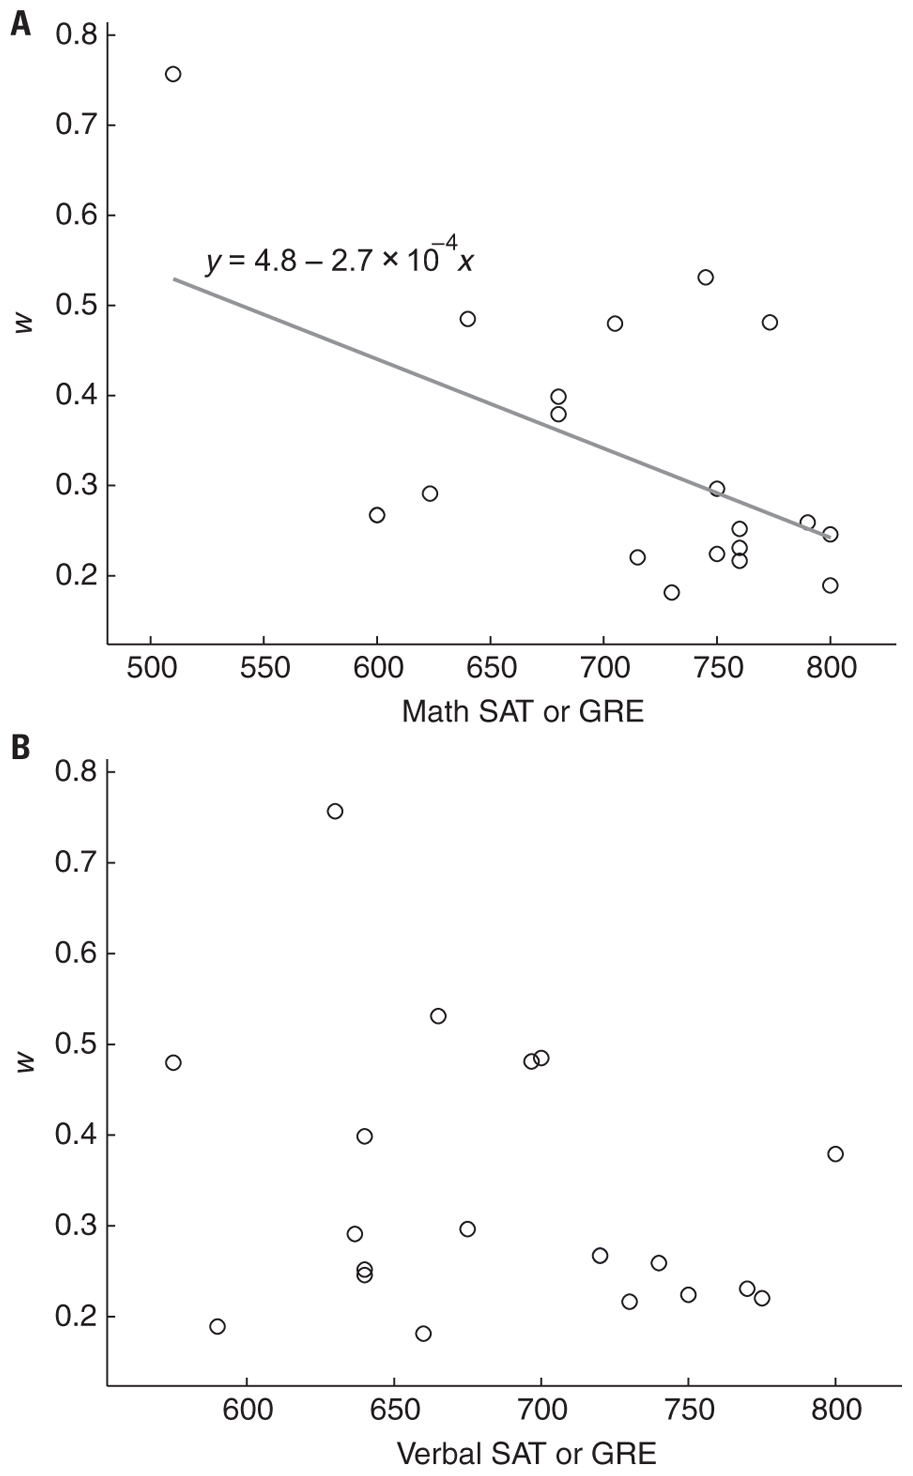
FIGURE 7. (A) Standardized mathematics test scores (GRE or SAT) were negatively correlated with w (r2 = 0.28, p < 0.02). Gray line is the best fit to the data and the equation shows the intercept and slope. (B) Verbal scores were not significantly correlated with w (r2 = 0.08, p = 0.23).
Discussion
Malleability of ANS Acuity
The primary question our research addressed was the malleability of the Weber fraction in response to extended training. We found rapid improvement in ANS acuity with the introduction of trial-by-trial feedback and this improved performance was maintained in a final session when feedback was omitted. Very little improvement in ANS acuity occurred after the first session in which trial-by-trial feedback was introduced (second actual session) suggesting that ANS acuity may plateau and then be insensitive to extended training. Response time, however, continued to decrease with further training on the task. It remains possible that the four sessions of training with feedback that we provided was not sufficient and that additional training would have reduced the Weber fraction further even in these participants. It is also possible that extended training with feedback in children who have not yet reached asymptotic performance in ANS acuity would be more effective and we plan to pursue this in future research.
Why was the introduction of trial-by-trial feedback so powerful in reducing the Weber fraction? One caveat is that our study did not include a control group that did not get feedback. Therefore it is possible that initial practice, and not trial-by-trial feedback was the main factor in reducing w in the first session of the number task. Future studies should explore this possibility. Another possibility is that feedback allowed subjects to decrease reliance on total stimulus surface area. The effect of surface area and numerosity congruency was strong in the majority of subjects before trial-by-trial feedback was introduced. Thus subjects tended to view arrays with larger total surface area as more numerous. With training, however, the effect of surface area decreased, and by the final session participants no longer showed a surface area bias. The decrease in the congruence effect, however, cannot fully explain the observed decrease in w. On trials where the surface area of the two arrays was equal, we still observed an increase in accuracy after feedback was introduced, and, like the effect seen in w, this improvement in accuracy persisted after feedback was removed.
Decreasing reliance on total surface area as a mechanism for improving ANS acuity is consistent with theories of perceptual learning. Goldstone (1998) identified attentional weighting and differentiation as potential mechanisms for perceptual learning. Changes in attentional weighting can allow participants to focus on crucial information like numerosity while ignoring irrelevant stimulus features like surface area. Differentiation allows previously indistinguishable aspects of stimuli to be perceived as distinct and has been shown to apply to different perceptual dimensions of the same stimulus. For example, according to the Munsell color system colors vary along three orthogonal dimensions: chroma, value, and hue. Burns and Shepp (1988) found that trained subjects were significantly better at differentiating value and chroma than untrained subjects. Similarly, subjects trained to categorize color based on chroma but not value increased their acuity in discriminating different chroma (Goldstone, 1994). These results suggest that our participants may be learning to differentiate the related dimensions of numerosity and surface area allowing them to ignore the extraneous surface area cues and to selectively improve number acuity.
Prior studies have examined the relationship between surface area and perceived numerosity in adults and come to different conclusions. Consistent with our findings, Hurewitz et al. (2006), found that congruence between surface area and number improved accuracy whereas incongruence caused a decrement in performance. Tokita and Ishiguchi (2010), however, found the opposite effect, that larger items were perceived as less numerous. Barth (2008) failed to find any effect of surface area congruence in an ordinal numerosity task. As Tokita and Ishiguchi (2010) demonstrated and we confirm here, trial-by-trial feedback rapidly diminishes or abolishes surface area bias. It remains an open question, however, exactly what stimulus or presentation factors determine the direction or existence of surface area bias effects in naïve subjects. One potentially important difference between our study and the Tokita and Ishiguchi (2010) study was that we presented dot arrays simultaneously and spatially overlapped whereas Tokita used sequential presentation.
It is interesting to note that studies with children suggest that the ability to separate dimensions improves with age (Smith and Evans, 1989; see Goldstone, 1998 for review). Thus children may be more susceptible to the surface area numerosity congruence effect than adults, and this effect may diminish with development and increasing acuity of the ANS. A large literature addresses the effect of surface area on number judgments across development. However, there is no consensus on how these interactions change with experience (e.g., Piaget, 1965; Mix et al.,2002; Cantlon et al., 2010).
The ANS and Other Magnitude Systems
A second question our study addressed was the relationship between ANS acuity and the precision of line length comparisons. We found that performance on a line length task was positively correlated with performance on the ANS task. The introduction of feedback on the numerosity task, however, improved acuity for the numerosity task but did not generalize to the line length discrimination.
Walsh’s (Walsh, 2003; Bueti and Walsh, 2009) theory of magnitude (ATOM) asserts that dimensions such as time, number, and space are processed by a common analog magnitude system and depend on a common set of parietal brain systems. The association between the spatial and numerical dimensions has been particularly well established (for review, see Hubbard et al., 2005). Many studies have demonstrated interference between numerical and spatial information, the SNARC effect being the most well-known (Dehaene et al.,1993). Parietal lesions causing hemi-spatial neglect often cause congruent neglect in the mental number line, implicating common parietal circuits in both spatial and numerical cognition (Zorzi et al., 2002; Cappelletti et al., 2007). Disruption of normal parietal function with rTMS causes deficits in comparing line lengths and numerosities (Dormal et al., 2011). Brain imaging studies have also implicated overlapping areas of the parietal cortex in both length and numerical comparison tasks (Fias et al., 2003; Dormal and Pesenti, 2009).
Our finding that line length acuity correlated with ANS is consistent with the theory that spatial and numerical comparisons depend on shared cognitive mechanisms. However, the improvement that emerged from the introduction of trial-by-trial feedback did not transfer to the line length task. This finding is consistent with a weaker version of ATOM in which magnitude comparisons share some common basis but at least in adulthood are differentiated. One possible explanation of this partial differentiation is that a single common comparator system is utilized in all judgments of relative magnitude regardless of dimension, but that each magnitude is represented by a dimension specific subsystem. Thus, although number and line length are represented along distinct mental continua, comparisons of two numbers or line lengths are mediated by a single common comparator. Under this framework, the correlation between ANS acuity and line length acuity is explained by the resolution of a common comparator. In contrast, trial-by-trial feedback in the numerosity comparison task results in improvements that are specific to numerosity representations (e.g., increasing precision of the underlying representations or narrowing in of attention to the numerosity dimension as opposed to surface area). Future work might be able to disentangle the effects specific to a mental magnitude comparison and the precision of representations of a specific mental magnitude by, for example, comparing the accuracy of a numerosity estimation task (how many dots?) and a numerosity comparison task, like the one we used. If the underlying representation of number narrows due to training, then it should to transfer across different number tasks.
An important caveat is that our control task had some significant limitations. One limitation was that we were only able to test one non-numerical magnitude judgment (i.e., line length), and we did not assess a non-magnitude perceptual judgment. This prevented us from determining whether the correlation between the number and line length Weber fractions was due to global cognitive influences such as attention or fatigue, or alternatively arose from common magnitude processing mechanisms. Furthermore, we equated the ratios for the numerical and line length stimuli and this meant that the line length stimuli were significantly easier to discriminate than the numerical stimuli. One reason for this apparent disparity in difficulty may be that to solve the numerical task participants had to ignore total surface area which was carefully controlled, whereas in the line length task there was no competing dimension. However, when we analyzed the most difficult line length trials we found to improvement in accuracy indicating that the lack of transfer was not due to a ceiling effect in the line length task. Future studies should include additional control tasks and match difficulty and stimulus complexity to make firmer conclusions about the import of the positive correlation we observed between ANS and line length judgments.
Relationship between the ANS and Symbolic Math
A third question our findings address is the relationship between ANS acuity and symbolic mathematics. Recent work has demonstrated that ANS acuity is positively correlated with a variety of mathematical abilities in children and adults (Halberda et al., 2008; Gilmore et al., 2010; Lyons and Beilock, 2011; Mazzocco et al., 2011a, b). These studies suggest the ANS may serve as a developmental building block upon which symbols are mapped and that precision in ANS representations facilitates symbolic mathematics (e.g., Dehaene, 1997; Wynn, 1998; Gilmore et al., 2007; Verguts and Fias, 2008; Mundy and Gilmore, 2009). A great deal of work is still needed to probe the dynamics of this relationship and to specify the mechanisms by which ANS acuity might scaffold symbolic mathematics. Consistent with these prior recent studies, our sample of adult participants exhibited a positive correlation between ANS acuity and standardized math scores but not verbal scores. Future work should explore the functional relationship between the ANS and mathematics by assessing whether improving ANS acuity, perhaps earlier in development, bestows any benefits for symbolic mathematics (e.g., Wilson et al., 2006a, b; Kucian et al., 2011).
There are several possible explanations for why we did not find a more robust relationship between standardized mathematics scores and w. We had to combine SAT scores with GRE scores, since a few of our participants had not taken the SAT. Although the tests are similar and graded on the same scale (200–800 points), combining GREs and SATs certainly added noise to the measure. In addition, our sample did not contain much variance in math scores, and may have suffered from a ceiling effect. Only one participant had a math score below 600, whereas fully half our sample scored 750 or above. Thus future studies should recruit larger samples from a more heterogeneous population.
Absolute Value and Reliability of w
Global w scores for our sample fell between 0.18 and 0.76 with a mean of 0.33 and a standard deviation of 0.15. This is higher than most previous estimates for young adults, which cluster below 0.2 (for review and meta-analysis, see Piazza and Izard, 2009) but was similar to the range of 0.22–1.5 measured by Gilmore et al. (2011) in their non-symbolic comparison task. The disparate ranges in these three studies are surprising given the similarity of the estimation tasks.
One possible reason we observed higher w is that we did not control the dot density of our stimuli. Our two stimuli were generated within a single circle 300 pixels in radius. As a result the total extent of each stimulus was equal, but the density of the stimulus was negatively correlated with numerosity. Previous research has demonstrated that loosely spaced dots appear greater in number than densely packed dots (Krueger, 1972; Ginsburg, 1976). If the density of each set of dots was viewed independently (e.g., adding black dots did not increase the perceived density of the white dots) then this effect may have inflated estimates of our less numerous stimuli, which would have appeared less densely packed and therefore more numerous thus impairing discriminability. Lower accuracy would have increased our estimate of w. This effect may have been especially pronounced in our stimuli because they had a relatively large degree of visual crowding. Further research into the specific effects relative density and other low level stimulus features on ANS acuity may help clarify differences in average w in different experiments.
We also measured the reliability of w scores by comparing split-halves of individual session data. Single session reliability estimates were high and similar to estimates obtained in previous reports (Maloney et al., 2010; Gilmore et al., 2011). Note that one other report obtained low estimates of split-half reliability, however they used the distance effect rather than w as a measure of ANS acuity (Sasanguie et al., 2011). Our repeated testing design allowed us to assess reliability in w across six sessions over a 2-week period. Despite the reduction in w from session 1 to session 6 there was strong positive correlation in these scores demonstrating test–retest reliability over a 2-week period. These data thus provide evidence of both stable and malleable components of ANS acuity.
Potential Single Neuron Correlates
Single cells in the monkey brain appear to encode quantity. The firing rate of cells in or near the intraparietal sulcus in macaque monkeys are systematically correlated with the numerosity of dot arrays (Nieder and Miller, 2004; Roitman et al., 2007), the numerosity of sequential actions (Tanji et al., 2002) or sequentially presented stimuli (Nieder et al., 2006), and line length (Tudusciuc and Nieder, 2007). Prefrontal cortical cells also encode numerosity (Nieder et al., 2002) and more abstract magnitudes such as symbol numerosity mappings (Diester and Nieder, 2007), and ordinal rules (Bongard and Nieder, 2010).
There are several different ways in which we can imagine single cell number coding systems to yield improved performance as a result of training. Neurons found in the IPS and PFC are tuned to individual numerosities. Tuned number neurons fire maximally for a particular numerosity and decrease firing in response more distant numerosities. One possibility is that the behavioral improvements we observed as a result of trial-by-trial feedback are achieved by sharpening the tuning curves of these neurons. As a result they would fire less for neighboring numerosities and be more selective for their preferred numerosity after training. Alternatively, training and feedback may recruit more individual neurons to the representation of number. This could improve the precision of the population code without affecting the width of the tuning curves of individual number selective neurons.
Other neurons in lateral intraparietal area (LIP) have been shown to encode numerosity monotonically, with separate populations either increasing or decreasing firing rate with the observed numerosity (Roitman et al., 2007). Monotonic numerosity neurons have been hypothesized to play the role of numerosity accumulators in several models of numerical cognition (Meck and Church, 1983; Dehaene and Changeux, 1993; Verguts and Fias, 2004). The accumulation layer in these models plays an intermediary role between perception of the stimulus and the final tuned representations of individual numerosities. Improved performance as a result of training might emerge from a sharpening of these accumulator-like neurons in LIP. After training, a given difference in numerosity would generate a greater increase (or decrease) in the firing rate in LIP neurons. An increase in the steepness of these monotonic functions could increase discriminability between numerosities and in turn lead to sharper tuning functions in downstream areas, including other areas in the IPS and in prefrontal cortex. Pearson et al. (2010) demonstrated that LIP like monotonic functions are in principle sufficient for completing a numerosity bisection task. This raises the possibility that different numerosity representations may be generated idiosyncratically in response to particular task demands, and training and education may play an important role in determining which types of number representations become realized in the brain.
Tudusciuc and Nieder (2007) found both line length and numerosity neurons in macaque intraparietal cortex. However, they did not find neurons representing magnitude abstractly along a common mental magnitude line. Line length and numerosity were represented in separate neuronal populations. A small percentage of neurons represented both line length and numerosity, but these neurons were tuned to different line length and numerosity magnitudes: a neuron that coded for a short line length was equally likely to code for a small or a large numerosity. Thus, in monkeys it seems that line length and numerosity magnitudes do not share a common encoding scheme on the single neuron level in IPS. If one of the mechanisms of acuity improvement outlined above selectively acted on the numerosity neurons in the IPS but not the line length neurons, this could explain the failure of acuity improvement to transfer from one magnitude dimension to another.
Conclusion
Our study addressed the malleability of the ANS and the relationship between the ANS and other judgments. We found that ANS acuity showed rapid improvement with the introduction of trial-by-trial feedback but that it was otherwise relatively impervious to extended training in adults. The improvement in w in response to feedback was at least partially due to a decrease in reliance on surface area as a cue for numerosity, although other factors also influenced improvement. Acuity in a line length discrimination was positively correlated with ANS acuity, however, improvement in the ANS in response to feedback did not transfer to improvement in this spatial magnitude discrimination, providing further evidence that magnitude judgments may have both shared and distinct components. Finally, even in our relatively small sample of 20 subjects, acuity of the ANS was positively correlated with standardized tests of mathematical but not verbal proficiency. These findings raise important questions about the malleability of the ANS over the lifespan and the relationship between the ANS and uniquely human mathematical abilities.
Conflict of Interest Statement
The authors declare that the research was conducted in the absence of any commercial or financial relationships that could be construed as a potential conflict of interest.
Footnotes
- ^There was no difference in w scores for subjects instructed to indicate the greater versus the fewer number of dots (t-test, p = 0.62) thus all analyses are collapsed across these two groups.
Acknowledgments
We are grateful to Carrie Sweet, Mel Khaw, and Anna Barker for help with data collection, and all the members of the Brannon Lab for feedback on analyses and presentation of the data. This research was supported by a research award from the Ruth K. Broad Biomedical Research Foundation to Nicholas K. DeWind, a James McDonnell fellowship to E. M. Brannon and RO1 HD059108 to E. M. Brannon.
References
Barth, H. (2008). Judgements of discrete and continuous quantity: an illusory Stroop effect. Cognition 109, 251–266.
Bongard, S., and Nieder, A. (2010). Basic mathematical rules are encoded by primate prefrontal cortex neurons. Proc. Natl. Acad. Sci. U.S.A. 107, 2277–2282.
Bueti, D., and Walsh, V. (2009). The parietal cortex and the representation of time, space, number and other magnitudes. Philos. Trans. R. Soc. Lond. B Biol. Sci. 364, 1831–1840.
Burns, B., and Shepp, B. E. (1988). Dimensional interactions and the structure of psychological space – the representation of hue, saturation, and brightness. Percept. Psychophys. 43, 494–507.
Cantlon, J. F., Platt, M. L., and Brannon, E. M. (2009). Beyond the number domain. Trends Cogn. Sci. 13, 83–91.
Cantlon, J. F., Safford, K. E., and Brannon, E. M. (2010). Spontaneous analog number representations in 3-year-old children. Dev. Sci. 13, 289–297.
Cappelletti, M., Barth, H., Fregni, F., Spelke, E. S., and Pascual-Leone, A. (2007). rTMS over the intraparietal sulcus disrupts numerosity processing. Exp. Brain Res. 179, 631–642.
Dehaene, S. (1997). The Number Sense: How the Mind Creates Mathematics. New York: Oxford University Press.
Dehaene, S., Bossini, S., and Giraux, P. (1993). The mental representation of parity and number magnitude. J. Exp. Psychol. Gen. 122, 371–396.
Dehaene, S., and Changeux, J. P. (1993). Development of elementary numerical abilities – a neuronal model. J. Cogn. Neurosci. 5, 390–407.
Diester, I., and Nieder, A. (2007). Semantic associations between signs and numerical categories in the prefrontal cortex. PLoS Biol. 5, e294. doi: 10.1371/journal.pbio. 0050294
Dormal, V., Dormal, G., Joassin, F., and Pesenti, M. (2011). A common right fronto-parietal network for numerosity and duration processing: an fMRI study. Hum. Brain Mapp. doi: 10.1002/hbm.21300 [Epub ahead of print].
Dormal, V., and Pesenti, M. (2009). Common and specific contributions of the intraparietal sulci to numerosity and length processing. Hum. Brain Mapp. 30, 2466–2476.
Feigenson, L., Dehaene, S., and Spelke, E. (2004). Core systems of number. Trends Cogn. Sci. 8, 307–314.
Fias, W., Lammertyn, J., Reynvoet, B., Dupont, P., and Orban, G. A. (2003). Parietal representation of symbolic and nonsymbolic magnitude. J. Cogn. Neurosci. 15, 47–56.
Gilmore, C. K., Attridge, N., and Inglis, M. (2011). Measuring the approximate number system. Q. J. Exp. Psychol. (Colchester) 64, 2099–2109.
Gilmore, C. K., McCarthy, S. E., and Spelke, E. S. (2007). Symbolic arithmetic knowledge without instruction. Nature 447, 589–591.
Gilmore, C. K., McCarthy, S. E., and Spelke, E. S. (2010). Non-symbolic arithmetic abilities and mathematics achievement in the first year of formal schooling. Cognition 115, 394–406.
Ginsburg, N. (1976). Effect of item arrangement on perceived numerosity: randomness vs regularity. Percept. Mot. Skills 43, 663–668.
Goldstone, R. (1994). Influences of categorization on perceptual discrimination. J. Exp. Psychol. Gen. 123, 178–200.
Halberda, J., and Feigenson, L. (2008). Developmental change in the acuity of the “Number Sense”: the Approximate Number System in 3-, 4-, 5-, and 6-year-olds and adults. Dev. Psychol. 44, 1457–1465.
Halberda, J., Mazzocco, M. M., and Feigenson, L. (2008). Individual differences in non-verbal number acuity correlate with maths achievement. Nature 455, 665–668.
Holloway, I. D., Price, G. R., and Ansari, D. (2010). Common and segregated neural pathways for the processing of symbolic and nonsymbolic numerical magnitude: an fMRI study. Neuroimage 49, 1006–1017.
Hubbard, E. M., Piazza, M., Pinel, P., and Dehaene, S. (2005). Interactions between number and space in parietal cortex. Nat. Rev. Neurosci. 6, 435–448.
Hurewitz, F., Gelman, R., and Schnitzer, B. (2006). Sometimes area countes more than number. Proc. Natl. Acad. Sci. U.S.A. 103, 19599–19604.
Kucian, K., Grond, U., Rotzer, S., Henzi, B., Schönmann, C., Plangger, F., Gälli, M., Martin, E., and von Aster, M. (2011). Mental number line training in children with developmental dyscalculia. Neuroimage 57, 782–795.
Libertus, M. E., and Brannon, E. M. (2010). Stable individual differences in number discrimination in infancy. Dev. Sci. 13, 900–906.
Lipton, J. S., and Spelke, E. S. (2004). Discrimination of large and small numerosities by human infants. Infancy 5, 271–290.
Lyons, I. M., and Beilock, S. L. (2011). Numerical ordering ability mediates the relation between number-sense and arithmetic competence. Cognition 121, 256–261.
Maloney, E. A., Risko, E. F., Preston, F., Ansari, D., and Fugelsang, J. (2010). Challenging the reliability and validity of cognitive measures: the case of the numerical distance effect. Acta Psychol. (Amst.) 134, 154–161.
Mazzocco, M. M., Feigenson, L., and Halberda, J. (2011a). Impaired acuity of the approximate number system underlies mathematical learning disability (dyscalculia). Child Dev. 82, 1224–1237.
Mazzocco, M. M., Feigenson, L., and Halberda, J. (2011b). Preschoolers’ precision of the approximate number system predicts later school mathematics performance. PLoS ONE 6, e23749. doi: 10.1371/journal.pone.0023749
Meck, W. H., and Church, R. M. (1983). A mode control model of counting and timing processes. J. Exp. Psychol. Anim. Behav. Process. 9, 320–334.
Mix, K. S., Huttenlocher, J., and Levine, S. C. (2002). Multiple cues for quantification in infancy: is number one of them? Psychol. Bull. 128, 278–294.
Moyer, R. S., and Landauer, T. K. (1967). Time required for judgements of numerical inequality. Nature 215, 1519–1520.
Mundy, E., and Gilmore, C. K. (2009). Children’s mapping between symbolic and nonsymbolic representations of number. J. Exp. Child Psychol. 103, 490–502.
Nieder, A., Diester, I., and Tudusciuc, O. (2006). Temporal and spatial enumeration processes in the primate parietal cortex. Science 313, 1431–1435.
Nieder, A., Freedman, D. J., and Miller, E. K. (2002). Representation of the quantity of visual items in the primate prefrontal cortex. Science 297, 1708–1711.
Nieder, A., and Miller, E. K. (2004). A parieto-frontal network for visual numerical information in the monkey. Proc. Natl. Acad. Sci. U.S.A. 101, 7457–7462.
Pearson, J., Roitman, J. D., Brannon, E. M., Platt, M. L., and Raghavachari, S. (2010). A physiologically-inspired model of numerical classification based on graded stimulus coding. Front. Behav. Neurosci. 4:1. doi: 10.3389/neuro.08.001.2010
Piazza, M., Facoetti, A., Trussardi, A. N., Berteletti, I., Conte, S., Lucangeli, D., Dehaene, S., and Zorzi, M. (2010). Developmental trajectory of number acuity reveals a severe impairment in developmental dyscalculia. Cognition 116, 33–41.
Piazza, M., and Izard, V. (2009). How humans count: numerosity and the parietal cortex. Neuroscientist 15, 261–273.
Pica, P., Lemer, C., Izard, V., and Dehaene, S. (2004). Exact and approximate arithmetic in an Amazonian indigene group. Science 306, 499–503.
Roitman, J. D., Brannon, E. M., and Platt, M. L. (2007). Monotonic coding of numerosity in macaque lateral intraparietal area. PLoS Biol. 5, e208. doi:10.1371/journal.pbio.0050208
Sasanguie, D., Defever, E.,Van den Bussche, E., and Reynvoet, B. (2011). The reliability of and the relation between non-symbolic numerical distance effects in comparison, same-different judgments and priming. Acta Psychol. (Amst.) 136, 73–80.
Smith, L. B., and Evans, P. E. (1989). “Similarity, identity, and dimensions: perceptual classification in children and adults.” in Object Perception: Structure and Process, eds B. E. Shepp and S. Ballesteros (Hillsdale, NJ: Lawrence Erlbaum Associates), 325–356.
Tanji, J., Sawamura, H., and Shima, K. (2002). Numerical representation for action in the parietal cortex of the monkey. Nature 415, 918–922.
Tokita, M., and Ishiguchi, A. (2010). How might the discrepancy in the effects of perceptual variables on numerosity judgment be reconciled? Atten. Percept. Psychophys. 72, 1839–1853.
Tudusciuc, O., and Nieder, A. (2007). Neuronal population coding of continuous and discrete quantity in the primate posterior parietal cortex. Proc. Natl. Acad. Sci. U.S.A. 104, 14513–14518.
Venkatraman, V., Ansari, D., and Chee, M. W. (2005). Neural correlates of symbolic and non-symbolic arithmetic. Neuropsychologia 43, 744–753.
Verguts, T., and Fias, W. (2004). Representation of number in animals and humans: a neural model. J. Cogn. Neurosci. 16, 1493–1504.
Verguts, T., and Fias, W. (2008). Symbolic and nonsymbolic pathways of number processing. Philoso. Psychol. 21, 539–554.
Walsh, V. (2003). A theory of magnitude: common cortical metrics of time, space and quantity. Trends Cogn. Sci. 7, 483–488.
Wilson, A. J., Dehaene, S., Pinel, P., Revkin, S. K., Cohen, L., and Cohen, D. (2006a). Principles underlying the design of “The Number Race”, an adaptive computer game for remediation of dyscalculia. Behav. Brain Funct. 2, 19.
Wilson, A. J., Revkin, S. K., Cohen, D., Cohen, L., and Dehaene, S. (2006b). An open trial assessment of “The Number Race”, an adaptive computer game for remediation of dyscalculia. Behav. Brain Funct. 2, 20.
Wynn,K.(1998). Psychological foundations of number: numerical competence in human infants. Trends Cogn. Sci. 2, 296–303.
Keywords: numerosity, numerical, analog magnitudes, estimation, perceptual learning, approximate number system
Citation: DeWind NK and Brannon EM (2012) Malleability of the approximate number system: effects of feedback and training. Front. Hum. Neurosci. 6:68. doi: 10.3389/fnhum.2012.00068
Received: 05 October 2011; Accepted: 13 March 2012;
Published online: 19 April 2012.
Edited by:
Daniel Ansari, University of Western Ontario, CanadaCopyright: © 2012 DeWind and Brannon. This is an open-access article distributed under the terms of the Creative Commons Attribution Non Commercial License, which permits non-commercial use, distribution, and reproduction in other forums, provided the original authors and source are credited.
*Correspondence: Nicholas K. DeWind, Center for Cognitive Neuroscience, Levine Science Research Center, Duke University, Box 90999, Durham, NC 27708, USA. e-mail: nicholas.dewind@duke.edu