Relationship between neural response and adaptation selectivity to form and color: an ERP study
- 1Institute of Neuroinformatics, University of Zurich and Swiss Federal Institute of Technology, Zurich, Switzerland
- 2Laboratory for Perceptual Dynamics, RIKEN Brain Science Institute, Wako-shi, Japan
- 3Laboratory for Perceptual Dynamics, University of Leuven, Leuven, Belgium
Adaptation is widely used as a tool for studying selectivity to visual features. In these studies it is usually assumed that the loci of feature selective neural responses and adaptation coincide. We used an adaptation paradigm to investigate the relationship between response and adaptation selectivity in event-related potentials (ERPs). ERPs were evoked by the presentation of colored Glass patterns in a form discrimination task. Response selectivities to form and, to some extent, color of the patterns were reflected in the C1 and N1 ERP components. Adaptation selectivity to color was reflected in N1 and was followed by a late (300–500 ms after stimulus onset) effect of form adaptation. Thus for form, response and adaptation selectivity were manifested in non-overlapping intervals. These results indicate that adaptation and response selectivity can be associated with different processes. Therefore, inferring selectivity from an adaptation paradigm requires analysis of both adaptation and neural response data.
Introduction
Adaptation is a change in the response properties of neurons, which alters the responses to subsequent stimuli (Kohn, 2007). In both psychophysical and fMRI studies, adaptation is widely used as a tool for studying selective processing of stimulus features. In psychophysics, adaptation is one of the primary tools for investigating the “channels” used to process visual information (Gilinsky, 1968; Blakemore and Campbell, 1969; Harris, 1980; Graham, 1989; Webster et al., 2004; Clifford and Weston, 2005; Clifford et al., 2007; Rentzeperis and Kiper, 2010). The adaptation paradigm is popular in fMRI research for establishing which brain areas selectively respond to certain visual features (Engel and Furmanski, 2001; Grill-Spector and Malach, 2001; Engel, 2005; Krekelberg et al., 2006; Weigelt et al., 2008). In both types of studies, the reasoning is that the area adapted to a feature is the same as the one responsive to that feature.
However, regions showing selectivity to a certain feature in their neuronal responses may differ from the ones showing effects of adaptation to that feature (Krekelberg et al., 2006; Clifford et al., 2007; Weigelt et al., 2008). Studies of synaptic mechanisms of adaptation indicate that adaptation occurs at the level of input rather than output of a neuron (Priebe et al., 2002; Kohn and Movshon, 2003; Tolias et al., 2005; Sawamura et al., 2006; Carandini et al., 2007). Input selectivity need not be related in a straightforward, linear manner to action potential-based output selectivity. Rather, adaptation changes the tuning curves of neurons, leading to interactions between adaptation and test stimuli (Kohn and Movshon, 2003; Krekelberg et al., 2006; Sawamura et al., 2006). For example, adaptation of neurons in the inferior temporal cortex showed higher object selectivity than neuronal response (Sawamura et al., 2006). Furthermore, in the hierarchy of visual processing adaptation effects occur at several stages. Effects in higher visual areas may be inherited from earlier ones (Kohn and Movshon, 2003) and, therefore, do not uniquely specify their sources. These observations prevent us from reliably inferring neural tuning width from adaptation data. Overall, these circumstances complicate the inference of stimulus selectivity from adaptation (Krekelberg et al., 2006; Sawamura et al., 2006; Clifford et al., 2007). Inferring selectivity from an adaptation paradigm, therefore, requires establishing the correspondence between the locus of adaptation and of response selectivities.
In the present work we studied the relationship between adaptation and response selectivities. As a probe for this relationship we took up an issue which has been the subject of investigation: is visual processing of form color selective or color invariant? Color and form, together with other non-spatial features, define objects in visual perception. The integration of color and form information is a multistage process, the first signs of which are present as early as in the V1/V2 network (Seymour et al., 2010), prior to full-fledged integration in V4 (Shapley and Hawken, 2011).
Glass patterns are particularly useful stimuli for studying visual integration of color and form. Glass patterns consist of an ensemble of local dot pairs positioned randomly within the display (Glass, 1969). A subset of dot pairs has a characteristic orientation. Depending on the geometrical rule used for the orientation of the dot pairs, Glass patterns can elicit the perception of various global shapes (e.g., concentric or radial). Glass patterns are easily parameterized stimuli: the global structure of the pattern can be gradually degraded by substituting coherently aligned dot pairs with randomly oriented ones. The way Glass patterns are composed, suggests that they are processed in two stages: in the local processing stage the dot pairs are identified, and in the global processing stage the dot pairs are summed into a coherent global pattern.
Colored Glass patterns have been used in psychophysical studies, to probe the integration of color and form. These studies yielded somewhat contradictory results. On the one hand, some observed that global form processing is mediated by a color invariant mechanism (Kovacs and Julesz, 1992; Wilson and Switkes, 2005). On the other hand, Cardinal and Kiper (2003), and Mandelli and Kiper (2005) concluded that both local and global form processing in Glass patterns are color selective, with global form processes being more broadly tuned than local ones. To resolve this contradiction, Rentzeperis and Kiper (2010) used colored Glass patterns in an adaptation paradigm. They showed that adaptation induced a significant increase in detection and recognition thresholds for subsequent Glass patterns irrespectively of their colors. The authors concluded that form adaptation is color invariant and most likely operates in the global form processing stage. However, adaptation taking place elsewhere in the visual hierarchy could not be excluded. Bradley and colleagues (1988) used an adaptation paradigm to show that the presentation of color gratings has no effect on the sensitivity of luminance gratings, nor vice versa. To compound matters, robust masking of luminance by color has been reported, but not the other way around (De Valois and Switkes, 1983). Results from experiments with simultaneously superimposed color and luminance stimuli (Chen et al., 2000a) have also provided insights into how chromoluminance patterns may be processed (Chen et al., 2000b). Therefore, the modulated locus in the brain appears to depend on the psychophysical technique used.
Here, we determine the time course of adaptation and response selectivity as reflected in scalp-recorded electrical brain activity. The neural mechanisms of adaptation are rapid enough to contribute to moment-to-moment sensory processing (Kohn, 2007) and, therefore, adaptation selectivity, as well as response selectivity, can modulate evoked electrical brain activity. We combined an adaptation paradigm with event-related potentials (ERPs). We consider response selectivity to be the brain activity in response to a specific property of a stimulus. We examined response selectivities by comparing the ERPs evoked by Glass patterns of different colors (color selectivity) and of different forms (form selectivity). We consider adaptation selectivity to be the change in brain activity in response to a specific property of a stimulus after its repeated presentation. We examined adaptation selectivities by comparing the ERPs of the test patterns that were preceded by adapting stimuli of the same and different forms (form adaptation), and of the same and different colors (color adaptation). Due to their excellent temporal resolution, ERP recordings are an ideal tool for the examination of the processing stage of a certain experimental effect.
The components of the ERP can be a basis for understanding relationship between adaptation and response selectivity. ERP components are usually defined in respect to their functional significance and underlying neural sources (Otten and Rugg, 2005). Each ERP component is believed to reflect certain brain processes which arise from the same neuroanatomical module and represent the same cognitive function (Luck, 2005). When several factors influence the same component, they are understood to reflect the same brain process.
In general, adaptation leads to reduction of the EEG-MEG signal (Noguchi et al., 2004; Jacques et al., 2007; Kovacs et al., 2007; Vizioli et al., 2010). Therefore, in our study we raised the question whether those ERP components which reflect response selectivity to a certain visual feature are also the ones that are reduced after adaptation to this feature. For example, the coincidence of response and adaptation selectivities was found for the ERP component N170 which is specific for face perception (Jacques et al., 2007; Kovacs et al., 2007; Vizioli et al., 2010). We test whether this is the case for perception of color and form.
Color and form processing have been extensively studied using ERPs. Color selectivity is reflected in early ERP component C1 with onset latency 50 ms after stimulus presentation (Anllo-Vento et al., 1998). This early component was localized with dipole source modeling in the striate (V1) and extrastriate (V2, V3) cortices (Anllo-Vento et al., 1998; Di Russo et al., 2002). Subsequent color processing is reflected in N1 component (Vogel and Luck, 2000; Hopf et al., 2002). Form processing has also been shown to modulate the N1 component in form discrimination tasks (Ritter et al., 1983; Vogel and Luck, 2000) and in the perception of Glass patterns (Ohla et al., 2005).
A number of ERP studies investigated selective attention to color and form combined. Attention to color and form, as well as to other non-spatial features, is reflected in selection negativity (SN) which is a broad ERP wave in the posterior areas which starts in the latency range of N1, 120–220 ms after stimulus presentation and lasts about 200 ms (Hillyard et al., 1998). Attention to color or form in the conjoined stimuli showed independent activity in the initial part of SN and interaction in the later part, suggesting that color and form are treated in parallel (Smid et al., 1997, 1999). However, greater SN amplitude and earlier onset latencies for color selection suggest that it is processed faster and easier than form selection (Eimer, 1997; Proverbio et al., 2004; McGinnis and Keil, 2011). Attention to color can be further reflected in the positive wave in P3 time range, 320–500 ms after stimulus (Eimer, 1997).
Krekelberg and colleagues (2005) used an adaptation protocol with Glass pattern stimuli in an fMRI study to infer the loci of implied motion. We are aware of only one ERP study on perception of colored Glass patterns. Ohla and colleagues (2005) asked their participants to report the color of concentric, parallel, and random Glass patterns. Perception of concentric Glass patterns elicited larger N1 amplitude than perception of random and (to a lesser degree) parallel Glass patterns. No color effects on the ERPs were found.
Dipole source modeling localizes N1 in the extrastriate areas V3, V3a, and V4 (Di Russo et al., 2002), lateral occipital (Gomez Gonzalez et al., 1994) and inferior occipital-temporal cortex, Brodmann's areas 19/37 (Hopf et al., 2002). Importantly, N1 localization includes area V4 which is shown to be responsive to global form of Glass pattern (Ostwald et al., 2008) as well as to the integration of color and form (Shapley and Hawken, 2011). Therefore, we consider the N1 component as a main candidate for indication of adaptation and response selectivity during form and color processing. We also consider other ERP components in the range 50–500 ms after stimulus presentation as possible indices of adaptation and response selectivity.
Methods
Participants
Eighteen healthy participants took part in the experiments. Four of them were later excluded because of EEG artifacts (see below). The data from the remaining 14 participants (nine females; mean age: 23.9; SD: 5.6) were analyzed. All participants had normal or corrected to normal vision and obtained normal scores in the Ishihara test for color blindness (Ishihara, 2007). Participants gave written consent and were unaware of the purpose and design of the experiment. RIKEN BSI Institutional Review Board No. 2 (Research Ethics Committee) approved the experimental protocol. Participants were paid 1000 yen/h.
Stimuli
The stimuli were radial and concentric Glass patterns. The patterns were formed by 200 randomly positioned dot pairs. In concentric patterns the dot pairs are oriented perpendicularly to the radial lines projecting from the center of the stimulus; in radial patterns the dot pairs are oriented parallel to the radial lines.
Glass patterns were presented in a square aperture with a side of 11°. The diameter of each dot was 8′36″; the distance between the dots in a pair was 13′48″. We used larger dot sizes than in other experiments with Glass patterns (Wilson et al., 1997; Wilson and Wilkinson, 1998; Smith et al., 2002) to minimize luminance artifacts induced by chromatic aberrations. The dots were photometrically isoluminant with the background: the luminance was 28 cd/m2. The monitor was calibrated with a ColorCAL colorimeter. We chose to use photometric isoluminance because (1) with large stimuli the perceptual isoluminant point is unlikely to be spatially constant (Bilodeau and Faubert, 1997) and (2) in a previous study using similar procedure and task, Rentzeperis and Kiper (2010) had directly compared perceptual and photometric isoluminance and found no significant difference in subjects' performance.
The colors of dots and background were chosen from the DKL color space (Derrington et al., 1984) which is based on the MacLeod-Boynton chromaticity diagram (MacLeod and Boynton, 1979) derived from a linear transformation of cones' excitations. This physiologically based color coordinate system is defined by two axes, in which chromaticity varies but luminance is constant, and by an orthogonal axis where luminance varies but chromaticity is constant. We used two colors on the isoluminant plane which were on opposite sides of the origin along the (L-M) chromaticity axis. Along this axis, the signal from short-wavelength (S) sensitive cones does not change but the signals from long-wavelength (L) and middle-wavelength (M) sensitive cones co-vary so that their sum remains constant. Colors along the (L-M) axis appear bluish green and reddish and hereinafter will be referred to as “green” and “red.” For the background color we used the color at the intersection point of the three DKL axes, which appears gray.
Stimuli were presented on a gamma corrected 19-inch CRT monitor (Sony Trinitron, Multiscan G420) with a resolution of 800 × 600 pixels and a video frame rate of 75 Hz (non-interlaced) at a viewing distance of 95 cm. In psychophysical procedures programmed in Matlab (The MathWorks Inc.) a Visage Graphics Board (Cambridge Research Systems, UK) controlled stimulus presentation. In the EEG experiment E-prime software (Psychology Software Tools, Inc.) controlled stimulus presentation. The monitor was the only source of light in the experimental chamber. Throughout the experiments, participants were asked to fixate on a white dot in the center of the screen.
Experiments
Preliminary Procedures
In two psychophysical procedures we estimated individual stimulus parameters for the EEG experiment. These parameters were the chromatic contrast and coherence of the Glass patterns. We ran the psychophysical procedures and the EEG experiment in two different days.
The scaling of the axes in DKL space is arbitrary. To allow comparison across color directions, a common scaling scheme must be used. We decided to scale all color contrasts by their detection threshold and then to use a common multiple of the threshold as a color contrast for the stimuli in subsequent experiments [but see Mullen and colleagues (2007) who found that cone contrasts correlate better with fMRI responses than detection thresholds]. We refer to color contrast as the distance of a point in the DKL space from the origin. To scale the color contrast we used a two-interval forced-choice procedure. Participants were presented with two stimuli: an array of randomly oriented dot pairs on a uniform gray field and an empty uniform gray field. The stimuli were presented in random order. The duration of the presentations and the interval between them was 160 ms. Participants had to indicate with a button press whether the dot pairs were presented in the first or second interval. Distinct auditory cues indicated correct and incorrect judgments. The color contrast of the dots changed according to a staircase protocol. After three consecutive correct responses, the color contrast was decreased by a fraction of a log unit; after an incorrect response it was increased by the same amount. For the first five staircase reversals the fraction was 0.5, thenceforth it switched to 0.1. The procedure stopped after twelve staircase reversals, and the threshold was calculated as the average of the last five reversal points and corresponded to the 79% correct level. Each color was estimated in a separate session.
To make the colors clearly visible we multiplied the thresholds by a common factor. We derived the factor by dividing a predetermined contrast, common to all participants, by the highest detection threshold for a given participant. This procedure ensured that all stimuli were equally visible and that their contrasts could not exceed a predetermined value. The latter precaution reduced further the possibility of luminance artifacts.
Pattern Coherence Scaling Procedure
To ensure that patterns are equally visible not only in their color intensity but also in their spatial structure, we measured psychometric curves for the detection of radial and concentric Glass patterns as a function of coherence. Coherence is defined as the percentage of dot pairs oriented properly to characterize a radial or concentric pattern among randomly oriented pairs. Sensitivity to form of a pattern grows with increasing stimulus coherence, following a sigmoidal function. For each color we selected coherences such that each participant was equally sensitive to the radial and concentric patterns. The chosen coherences were below the point of saturation, within the dynamic range of the psychometric function. We reasoned that adaptation will have a stronger effect on test stimuli with such coherences.
In the pattern coherence scaling procedure, as well as in the EEG experiment, we used the following adaptation paradigm. A trial started with a three second presentation of an adaptation stimulus followed by a 300 ms presentation of a test stimulus. The adaptation stimulus was updated every 500 ms with a new set of dot pairs. These updates were necessary to minimize retinal adaptation at particular dot positions. The interval between adaptation and test stimuli varied randomly, according to a uniform distribution, from 400 to 600 ms. A response bar appeared at the center of the screen 300 ms after test stimulus offset. One end of the bar was labeled “radial,” the other—“concentric.” The middle of the bar was labeled “uncertain.” The initial position of the cursor was in the middle of the bar. In the pattern coherence scaling procedure we used neutral stimuli (stimuli that would have a minimal effect on the perception of the test stimuli) as adapting stimuli; in the EEG experiment we used Glass patterns of 100% coherence.
Participants were asked to report on the form of the test pattern by moving the cursor along the response bar using two keys on a numeric keyboard pad with index and middle fingers. They confirmed their choice by pressing another key with their middle finger. Participants were instructed to move the cursor close to the extremities of the response bar if their confidence in perception of a particular Glass pattern type was high. They were told that positions closer to the center of the bar indicated less certainty in their perception of the pattern. They were asked to position the cursor in the middle of the bar only if they were completely uncertain of their perception. The cursor could take seven contiguous positions: three positions in each direction corresponded to degrees of confidence for concentric and radial patterns and the middle position corresponded to complete uncertainty.
Another goal of the pattern coherence scaling procedure was to familiarize participants with the subsequent EEG experiment. Therefore, we included in the procedure neutral adaptation stimuli which did not bias participants to a particular form or color. The stimuli consisted of 200 randomly oriented dot pairs, half of which were red, and the other half were green. The test Glass patterns had six different coherence levels: 15%, 30%, 45%, 60%, 80%, and 100%. For each level of coherence we presented 20 radial and concentric patterns. We also presented 20 random (0% coherence) patterns. In total 260 test patterns were shown in a session. Red and green Glass patterns were tested in separate sessions. Each session lasted approximately 25 min.
The psychometric curve was built as follows: we assigned a weight of 1 to the answers in the correct direction of the response bar, a weight of 0 to the answers in the incorrect direction, and a weight of 0.5 to the answers in the center of the sliding bar (uncertain). We used the logistic psychometric function to fit the data. We found the parameters α and β that give the best fit using a maximum likelihood procedure (Wichmann and Hill, 2001a,b). For each participant we found a coherence value on the psychometric curve for which they had 80% success rate and used this coherence value to construct the test Glass patterns for the EEG experiment.
Before the pattern coherence procedures we ran a short training session to familiarize participants with Glass patterns. During the training, participants were shown either a radial or a concentric Glass pattern and were asked to indicate with a button press which pattern they perceived. Pattern coherence varied according to a staircase protocol. Distinct auditory cues indicated correct and incorrect responses. The training session terminated after five staircase reversals.
EEG Experiment
In the EEG experiment we used the adaptation paradigm described above (see “Pattern coherence scaling procedure”). Trials were grouped in four blocks. In each block the adaptation pattern was the same: red concentric, green concentric, red radial, or green radial Glass pattern. In each block we presented four types of test patterns (50 trials for each type): red concentric, green concentric, red radial, and green radial Glass patterns. The color contrasts of the adaptation and test patterns were set from the results of the color scaling procedure. We opted to have the maximum possible adaptation by choosing adaptation patterns with 100% dot coherence. The coherences of the test patterns were taken from the results of the pattern coherence scaling procedure. The order of trials was randomized within a block and the order of the blocks was randomized across participants. In total, each participant completed four blocks of 200 trials (800 trials) which took approximately two hours. The combinations of the four adaptation and four test patterns yielded 16 different trial types. Figure 1 shows a typical trial sequence. Table 1 shows all the trial types.
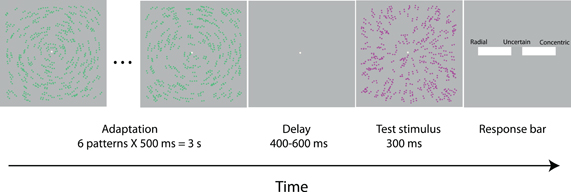
Figure 1. Time course of a trial in EEG experiment. A series of adaptation patterns of the same form and color updated every 500 ms for 3 s preceded the presentation of the test stimuli which was presented for 300 ms. After the test stimulus offset, the participants responded by moving a sliding bar. In the trial shown, the adaptation pattern is green concentric; the test pattern is red radial with 70% coherence. In the figure the luminance contrast of the Glass pattern dots is increased for illustrative purposes.
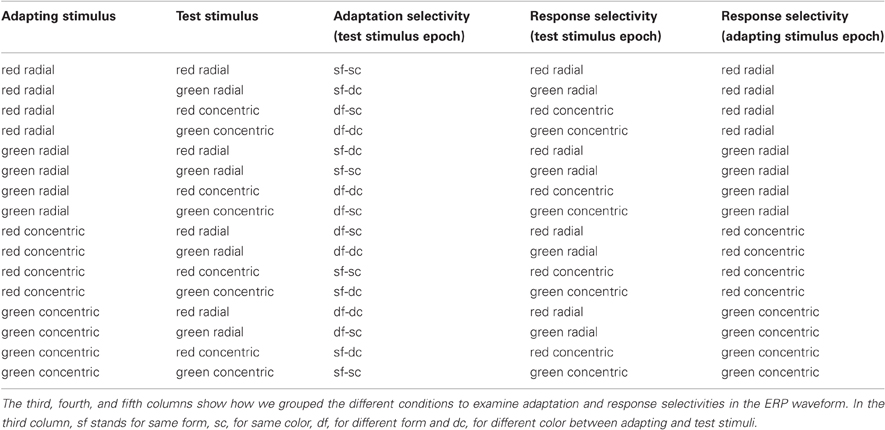
Table 1. The first two columns of the table show the adapting and test stimuli combinations of the 16 different trial types in the EEG experiment.
EEG Acquisition and Analysis
EEG was recorded with a 256-channel Geodesic sensor net (Electrical Geodesics Inc., Eugene, OR). The recording reference was the vertex electrode (Cz). The signal was digitized at 250 Hz, and filtered online with a bandpass of 0.1–100 Hz. Impedance was kept below 50 kOhm in all electrodes.
The EEG signal was further processed offline using EGI Netstation software, EEGLAB (Delorme and Makeig, 2004) and custom-made software programmed in Matlab. The EEG data were band-pass filtered in 0.3–25 Hz and segmented into epochs 600 ms long, starting 100 ms before and ending 500 ms after stimulus onset. In a trial, which consisted of the presentation of adaptation and test stimuli, we selected two epochs: the first one was time-locked to the onset of the first (of six) instantiation of the adaptation stimulus; the second epoch was time-locked to the onset of the test pattern.
We ran an artifact detection procedure using the recording reference electrode Cz. We excluded 88 electrodes on the lower part of the head (mainly on cheeks and neck) which are subjected to frequent muscle artifacts. Among the remaining 168 electrodes we identified the channels contaminated by artifacts as the ones having differential voltage amplitudes exceeding 120 μV (140 μV for the adaption stimulus epochs, since they were contaminated with more artifacts and we opted to have a compatible number of trials for the adaptation and test stimuli). A channel was marked as “bad” in the whole data-set if its amplitude exceeded the above thresholds in more than 20 percent of all segments. A segment was marked as “bad” and was excluded from analysis if it contained more than 10 “bad” channels (30 for the adaptation stimuli epochs). In the remaining segments, the “bad” channels were replaced using spherical spline interpolation across the whole channel set (Perrin et al., 1989). Of the 168 channels, on average two channels were interpolated for the test stimuli and eight channels for the adaptation stimuli. Finally the ERP data were visually inspected. Data of four participants were excluded from further analysis. In the rest of the participants on average 95% of the epochs were kept.
The trials were averaged separately for each participant and condition. At each time point a spatial average of the signal was calculated and subtracted from each channel to obtain the average-referenced data. The mean of a 100 ms baseline interval prior to stimulus onset was subtracted from every sample in the segment.
As the main hypotheses of our study were related to visual perception, we selected eight neighboring electrodes over the scalp projection of the primary visual cortices. These electrodes were located between the locations corresponding to O1, O2, and Oz electrodes of 10–20 system for electrode placement. We averaged the amplitude across these eight electrodes for further analysis. The adequacy of electrode selection was later confirmed by the topographical analysis (see Results).
We based the selection of target ERP components on previous studies which showed that color selectivity can be reflected in the C1 component (Anllo-Vento et al., 1998), and both color and form selectivities can be reflected in the N1 component (Ritter et al., 1983; Vogel and Luck, 2000; Hopf et al., 2002; Ohla et al., 2005). Color selectivity can be also reflected in the late positive wave in P3 time range, 320–500 ms after stimulus onset (Eimer, 1997). Furthermore, Sergent and colleagues (2005) have found that primary ERP correlates of conscious visual perception occur after 270 ms. Therefore, the late interval can also reflect form response or adaptation selectivities that modulate awareness. We selected the time windows with the following latencies: 40–90 ms (C1 component), 160–230 ms (N1 component) (Luck, 2005), and 300–500 ms.
We estimated the significance of the effects with a repeated-measures analysis of variance (ANOVA) on the mean amplitude of these time windows. We used Fisher's least significance difference test for post-hoc analysis.
Results
Behavioral Results on Adaptation Selectivity
We grouped the behavioral data into four conditions: adaptation and test stimuli having the same form and color (sf-sc), same form and different color (sf-dc), different form and same color (df-sc), and different form and color (df-dc). Figure 2A shows the distribution of responses for the four conditions for both concentric and radial Glass patterns. The response distribution when both adaptation and test stimuli had the same form (two top rows) was more uniform compared to the distribution when adaptation and test stimuli had different forms (two bottom rows). In the latter case, most of the responses were closer to the extremities of the response bar. In other words, participants identified the form of Glass patterns with much higher confidence when adaptation and test stimuli had different forms. This pattern of results indicates adaptation to form irrespective of the color of the adaptation and test Glass patterns.
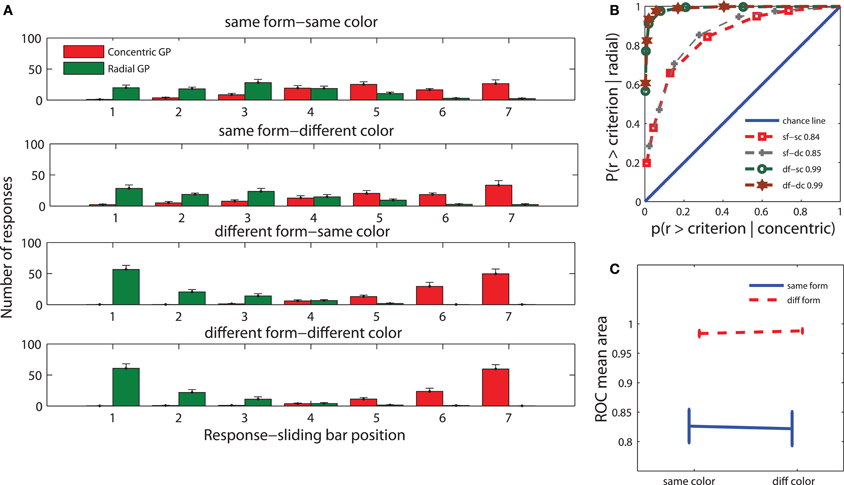
Figure 2. Behavioral results. (A) The distribution of responses for the following relationships between adapting and test stimuli: same form and color (sf-sc), same form and different color (sf-dc), different form and same color (df-sc), and different form and color (df-dc). The values of the x-axis indicate the 7 contiguous positions that the sliding bar can take. 1 corresponds to certainty for radial, 7 to certainty for concentric, and 4 to complete uncertainty. (B) The mean ROCs for the same conditions as in A. (C) Mean ROC areas for each condition. Error bars in A and C indicate the standard error of the mean (± s.e.m.)
To quantify performance, we calculated receiver operating characteristic (ROC) curves (Green and Swets, 1969) for the four conditions (Figure 2B). Each point on the ROC curves depicts the proportion of trials satisfying a response criterion when a radial pattern was shown against the proportion of trials satisfying a similar response criterion on the opposite end of the response bar when a concentric pattern was shown. The two ROC curves in which adaptation and test stimuli had the same form almost coincided. The same was true for the curves in which adaptation and test stimuli had different forms.
We used the area under the ROC curves as a measure of participants' performance. When both adaptation and test stimuli had the same form, participants' performance (Figure 2C) was clearly worse than when they had different forms, indicating that form adaptation has an effect on participants' perception. To test the significance of these results we carried out a repeated measures ANOVA on the areas under the ROC curves with form adaptation (same vs. different form between adaptation and test stimuli) and color adaptation (same vs. different color between adaptation and test stimuli) as factors. There was a significant effect of form adaptation [F(1, 13) = 30.5, P < 0.0001], but not of color adaptation [F(1, 13) = 0.3, P > 0.5]. There was no statistical interaction between form and color adaptation [F(1, 13) = 0.1, P > 0.5]. This result is in agreement with a recent behavioral study which showed that adaptation increased detection thresholds for subsequent Glass patterns irrespective of their colors (Rentzeperis and Kiper, 2010).
Note that the behavioral protocol used in this study was chosen to be time efficient to yield many trials for subsequent analysis of the ERPs. It is, however, not optimal to distinguish whether any observed changes in behavioral performance is due to changes in sensitivity (adaptation) or bias. Indeed, when adapting and test stimuli had the same form, it might have been more difficult for subjects to make a judgment about the test stimulus than when they had different forms because their strategy might have been to evaluate the similarity or dissimilarity of the adapting and test stimuli. Such a bias could lead to changes in the ROC curves that might be erroneously interpreted as adaptation. That adaptation does occur after passive observation of a high coherence Glass pattern was shown in previous studies (Clifford and Weston, 2005; Rentzeperis and Kiper, 2010) using two-alternative forced-choice procedures, which are known to minimize the effects of response bias (Green and Swets, 1969). In the study by Rentzeperis and Kiper (2010) in particular, analysis of the behavioral data showed that the increase in coherence thresholds observed after exposure to a high coherence pattern of the same form cannot be accounted by a response bias but is due to adaptation. It is thus highly probable that the difference between the “same form” and “different form” ROC curves shown in Figure 2 does not reflect only a change in bias but is due to adaptation as well.
To identify the time window during visual processing where form adaptation takes effect, we compared the ERPs elicited by the test stimuli for the same conditions. This analysis is found in the “Neural adaptation selectivity” section.
Electrophysiological Results
Neural Adaptation Selectivity
We combined the trials, in the test stimulus epoch, in four conditions corresponding to the relationships between adaptation and test patterns, as in the behavioral analysis (Figure 3C and Table 1, 3rd column). A repeated-measures ANOVA with factors of form adaptation and color adaptation did not reveal any significant effects on C1 amplitude. The amplitude of the N1 component showed a highly significant color adaptation effect [F(1, 13) = 71.6, P < 0.00001]. N1 amplitude was smaller when adaptation and test stimuli had the same color than when they had different colors. Form adaptation did not influence the N1 amplitude [F(1, 13) = 0.4, P > 0.5] (Figure 3A). However, during the late interval (300–500 ms) we observed a significant effect of form adaptation [F(1, 13) = 20.8, P < 0.0001] but not of color adaptation [F(1, 13) = 0.2, P > 0.05]. The ERP amplitude during the late interval was greater when both adaptation and test stimuli had the same form than when they had different forms (Figure 3B). Figure 3D shows the F-values of form and color adaptation and of their interaction for each time point.
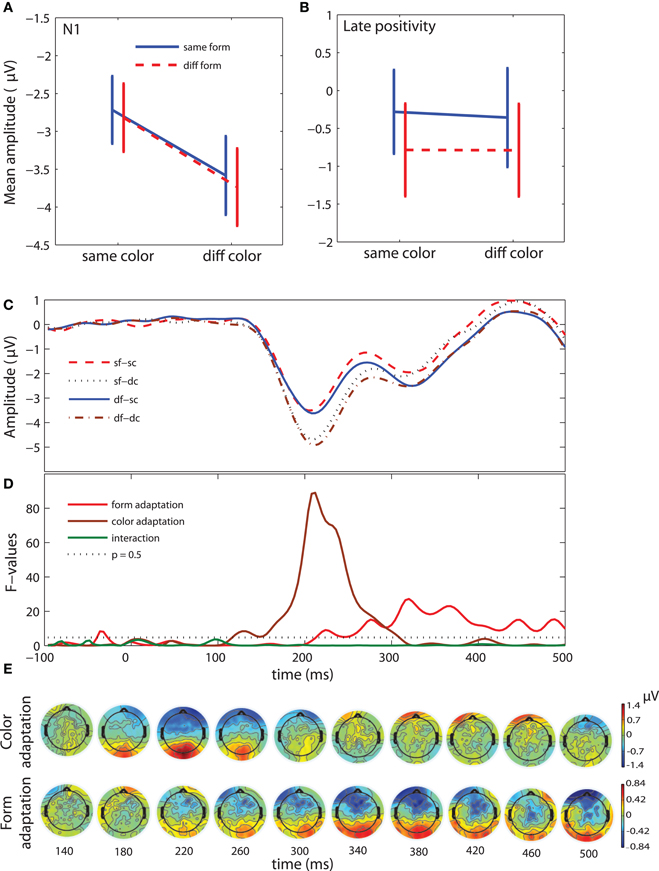
Figure 3. ERP results: adaptation selectivity (test stimulus epoch). (A) Mean-error plots of N1 amplitude (160–230 ms after the onset of the test stimulus). (B) Mean-error plots of the amplitude of the late positive component (300–500 ms after the onset of the test stimulus). (C) Grand-average waveforms for four conditions: same form and color (sf-sc), same form and different color (sf-dc), different form and same color (df-sc), and different form and color (df-dc). Time course of the F-values for the form adaptation, color adaptation, and form adaptation × color adaptation interaction effect. F-values above the dotted line have p-values less than 0.05. (E) Voltage difference maps. First row: Color adaptation effect. Voltage maps show the same minus different color conditions. Second row: Form adaptation effect. Voltage maps show the same minus different form conditions. The voltage maps are shown from 140 ms to 500 ms after stimulus onset with a step of 40 ms. Each voltage map is a 40 ms average.
We estimated the topography of adaptation selectivity by computing series of difference maps (Figure 3E). The maps for color adaptation and form adaptation show the amplitude in the same minus different color and the same minus different form conditions, respectively. In the map at 220 ms the color adaptation effect was largest over the occipital locations (Figure 3E, first row) which are typical for N1 (Gomez Gonzalez et al., 1994; Di Russo et al., 2002). In the map at 380 ms the form adaptation effect was similarly prominent over the occipital areas and, in addition, it was noticeable over the temporo-parietal areas (Figure 3E, second row). These topographical results confirmed that the eight electrodes selected for ERP analysis represented well the main ERP changes in the entire time course.
In sum, the analysis of adaptation selectivity showed that both color and form are adapted, albeit with different dynamics. Color adaptation is seen early (160–230) and affects the N1 component. This effect is followed by a significant late form adaptation effect (300–500 ms). The absence of interaction between adaptation selectivity to form and color indicates that these two processes run in parallel. The behavioral reports are in agreement with the absence of interaction between color and form adaptation. Thus, the adaptation results alone suggest that color and form processing is independent, and one may conclude that form perception is color invariant. However, the following ERP analysis of the response selectivity will clarify whether form and color adaptation overlap with form and color response selectivities.
Neural Response Selectivity
To estimate neural response selectivity in the test stimulus epoch we combined the trials in four conditions corresponding to four conjunctions of visual features of Glass patterns: green-radial, green-concentric, red-radial, red-concentric (Figure 4C and Table 1, 4th column). We applied a repeated-measures ANOVA with factors of color response (green vs. red) and form response (radial vs. concentric) on the amplitude of ERP components.
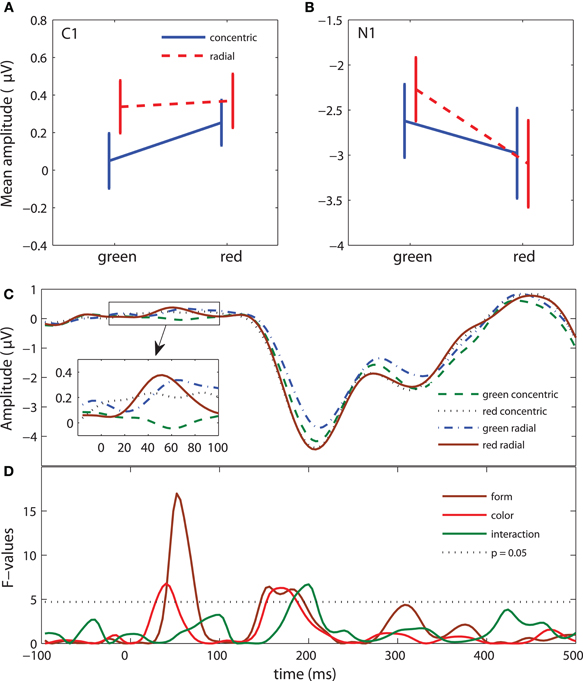
Figure 4. ERP results: neural response selectivity (test stimulus epoch). (A) Mean-error plots of C1 amplitude (40–90 ms after the onset of the test stimulus). (B) Mean-error plots of N1 amplitude (160–230 ms after the onset of the test stimulus). (C) Grand-average waveforms for four conditions. Time 0 indicates the onset of the test stimulus. (D) Time course of the F-values for the form response, color response, and form response × color response interaction effect. F-values above the dotted line have p-values less than 0.05.
In the test stimulus epoch there was a significant effect of form response for the C1 [F(1, 13) = 14.2, P < 0.005] and N1 [F(1, 13) = 5.3, P < 0.05] components. C1 amplitude was more positive for radial than for concentric patterns (Figure 4A). N1 amplitude (negative) was larger for concentric than for radial patterns (Figure 4B).
The color response effect approached significance for the C1 [F(1, 13) = 4, P = 0.068] and N1 [F(1, 13) = 3.9, P < 0.068] components. C1 and N1 amplitudes were larger for red patterns than for green ones. For the N1 component, we found a significant form-color response interaction [F(1, 13) = 4.9, P < 0.05]. The post-hoc test showed that the N1 amplitude elicited by green radial patterns was smaller than the amplitude of all other patterns (all P < 0.01). We did not find any significant effects in the late window (300–500 ms). Figure 4D shows the F-values for each time point for the color and form response effects and interaction.
We analyzed the ERPs triggered by the first instantiation of the adaptation patterns to examine neural response selectivity in the absence of an explicit task (Figure 5C and Table 1, 5th column). This analysis also gave us insights on the most robust selectivities (the ones that are present in the ERPs of both the adapting and test stimuli). As in the previous analysis, we examined the form and color response selectivities. Our analysis revealed a significant effect of form response on components C1 [F(1, 13) = 5.8, P < 0.05] and N1 [F(1, 13) = 5, P < 0.05]. Similarly to the test stimuli, C1 amplitude was more positive in radial than in concentric patterns and N1 amplitude (negative) was larger in concentric than in radial patterns (Figures 5A and 5B). The Color effect on C1 and N1 amplitude was not significant and there was no interaction in the N1 interval. Similarly to the test pattern analysis, there were no significant effects in the late window. Figure 5D shows the F-values for each time point. The form response effect has an identical pattern as in Figure 4D. However, the color response and interaction effects are absent.
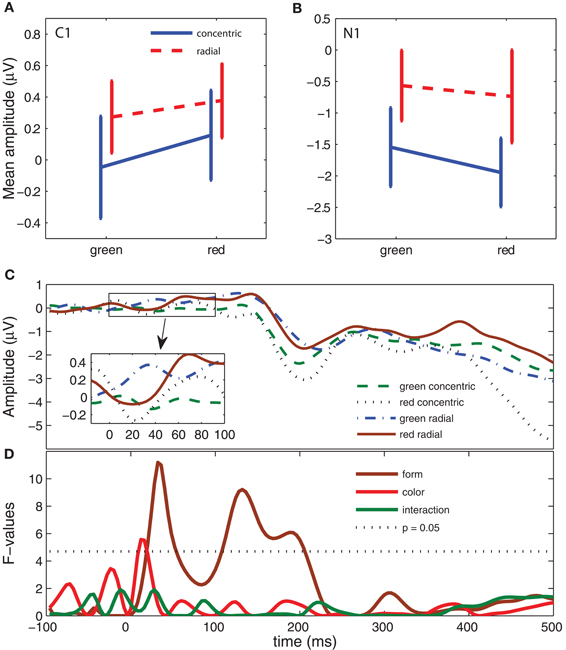
Figure 5. ERP results: neural response selectivity (adapting stimulus epoch). (A–D) Same analysis as in Figure 4.
In sum, the analysis of neural response revealed prominent selectivity to form during C1 and N1 intervals even when participants were not asked to report the form of the pattern (the epoch of the adapting stimulus). Furthermore, the analysis of the epoch of the test stimulus revealed the effect of color and a color-form interaction at N1, which suggests that neural response selectivity to form depends on color. This effect was not sustained when subjects were not asked to report the form of the Glass pattern in the adaptation epoch). Taken in isolation, response selectivity (on the test stimulus epoch) suggests color and form integration, leading to the conclusion that form perception is color selective. This conclusion is different from the one resulting from adaptation selectivity. This difference stems from the fact that form adaptation and form response were prominent during non-overlapping intervals.
Discussion
Adaptation Selectivity
Color adaptation was prominent during the N1 interval. Form adaptation reached significance after the N1 component, and did not interact with color adaptation. The behavioral results agreed with the ERP data of adaptation: subjects were selective to form independently of the color of the adapting and test stimuli. The occurrence of a form adaptation effect at the late ERP component and its correspondence to the behavioral response suggest that form adaptation is a late mechanism, probably related either to perceptual decision-making (Theodoni et al., 2011) or to consolidation of mid-level form processes into conscious perception (Sergent et al., 2005). Thus, the ERP analysis of adaptation selectivity revealed that adaptation to color and form occurs in two sequential, non-interacting stages. This indicates that the processes of adaptation selectivity are different for color and form.
Response Selectivity
Response selectivity to form was reflected in the amplitude of C1 and N1 components (Figures 4 and 5). C1, which has been identified as the earliest visual cortical response (Di Russo et al., 2002), is shown to be sensitive to the form of the Glass patterns (possibly to the orientation of the local dot pairs). The amplitude of the N1 component was larger for concentric than radial patterns. The sources of N1 may be located in the lateral and inferior occipital regions (Gomez Gonzalez et al., 1994; Hopf et al., 2002). Correspondingly, in a fMRI study, Ostwald and colleagues (2008) showed that concentric Glass patterns were classified more accurately than radial ones in the lateral occipital cortex. Furthermore, Ohla and colleagues (2005) found larger N1 amplitude for concentric Glass patterns compared to parallel and random ones. N1 has been associated with face identification mechanisms and is known to be most sensitive to ovoid figures (Itier and Taylor, 2004; Eimer et al., 2010). Therefore, the larger amplitude of concentric than radial patterns may be because a concentric Glass pattern is more similar to an ovoid figure than a radial pattern. Since a Glass pattern cannot be perceived concentric just from the identification of the local cues, the N1 component may reflect the activity of the mechanism integrating the local cues into a global percept.
Although the adapting and test stimuli were physically identical, the weak effect of color selectivity and color-form interaction were observed only in the ERPs evoked by the test, but not the adapting stimuli (cf. Figures 4D and 5D). These differences are likely due to the different roles played by adapting and test stimuli in our paradigm: during the adaptation interval the participants were not asked to perform a specific task beyond fixating the center of the screen. After test presentations participants were asked to report on the form of the test pattern. It is possible that increased attention to form elicits an ERP response that is more sensitive to its color as well, despite the fact that participants were not required to report on the stimulus' color. This could indicate that increased attention to form induces a color effect, similar to the object-based attention when selection of one feature of an object spreads the attentional effect on its other features (Duncan, 1984). Indeed, several studies reported that visual attention acts on an ensemble of features even when they are not relevant to the task (O'Craven et al., 1999; Blaser et al., 2000; Schoenfeld et al., 2003). The color effect found in the ERPs elicited by the test stimuli is consistent with previous ERP studies, which showed that color response selectivity is reflected in C1 (Anllo-Vento et al., 1998) and N1 (Vogel and Luck, 2000; Hopf et al., 2002). Thus, the analysis of response selectivity showed a parallel time course of color and form processing with interaction at the latency of N1.
Neural Response vs. Adaptation Selectivity
Figure 6 illustrates the time course of our findings for adaptation and response selectivity. For form, response selectivity was reflected in the C1 and N1 components (for both the test and adapting epochs) whereas adaptation selectivity was reflected in a late positivity after the N1 component. For color, response selectivity and adaptation selectivity coincided in N1. The possible localization of N1 sources in the ventral occipital areas (Gomez Gonzalez et al., 1994; Di Russo et al., 2002) and neuropsychological data which showed that lesion in these areas produces severe color deficiencies (Zeki, 1990; Bouvier and Engel, 2006; Shapley and Hawken, 2011) emphasize importance of these areas for color perception.
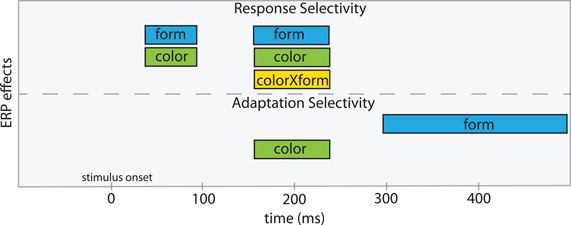
Figure 6. A scheme of the temporal windows where neural response and adaptation selectivity to form and color are manifested in the ERP components. The color and color × form response selectivities were prominent from the analysis of the test stimulus but not of the adapting stimulus.
Thus, for form, adaptation selectivity does not coincide temporally with response selectivity. For color, adaptation selectivity coincides with response selectivity at the latency of N1. This suggests that the loci of adaptation and response selectivity are the same for color but different for form. The dissimilarity between adaptation and response selectivities is also suggested by different strength of corresponding color effects (cf. F-values in Figures 3D and 4D). This ERP evidence is consistent with the observation that adaptation selectivity can be stronger than response selectivity in neurons of the inferior temporal cortex in monkeys (Sawamura et al., 2006). Taken together, these results show evidence for functional dissociation of processes associated with response and adaptation selectivity as they are reflected in the scalp-recorded electrical brain activity.
Adaptation is widely used as a tool in psychophysics and fMRI studies of stimulus selectivity (Krekelberg et al., 2006; Weigelt et al., 2008). Our study showed that conclusions about stimulus selectivity based on an adaptation paradigm can be different from those based on neural responses. In using an adaptation paradigm, precautions need to be made regarding the time courses of both adaptation and responses. Studying either of those in isolation can mislead us into incorrect conclusions. However, taken together, they can provide a complete picture of perceptual processing.
Conflict of Interest Statement
The authors declare that the research was conducted in the absence of any commercial or financial relationships that could be construed as a potential conflict of interest.
Acknowledgments
This work was supported from a Swiss National Science Foundation Grant 320030–116809 awarded to Daniel C. Kiper.
References
Anllo-Vento, L., Luck, S. J., and Hillyard, S. A. (1998). Spatio-temporal dynamics of attention to color: evidence from human electrophysiology. Hum. Brain Mapp. 6, 216–238.
Bilodeau, L., and Faubert, J. (1997). Isoluminance and chromatic motion perception throughout the visual field. Vision Res. 37, 2073–2081.
Blaser, E., Pylyshyn, Z. W., and Holcombe, A. O. (2000). Tracking an object through feature space. Nature 408, 196–199.
Bouvier, S. E., and Engel, S. A. (2006). Behavioral deficits and cortical damage loci in cerebral achromatopsia. Cereb. Cortex 16, 183–191.
Bradley, A., Switkes, E., and De Valois, K. (1988). Orientation and spatial frequency selectivity of adaptation to color and luminance gratings. Vision Res. 28, 841–856.
Carandini, M., Horton, J. C., and Sincich, L. C. (2007). Thalamic filtering of retinal spike trains by postsynaptic summation. J. Vis. 7, 20.1–2011.
Cardinal, K. S., and Kiper, D. C. (2003). The detection of colored Glass patterns. J. Vis. 3, 199–208.
Chen, C., Foley, J. M., and Brainard, D. H. (2000a). Detection of chromoluminance patterns on chromoluminance pedestals I: threshold measurements. Vision Res. 40, 773–788.
Chen, C., Foley, J. M., and Brainard, D. H. (2000b). Detection of chromoluminance patterns on chromoluminance pedestals II: model. Vision Res. 40, 789–803.
Clifford, C. W., Webster, M. A., Stanley, G. B., Stocker, A. A., Kohn, A., Sharpee, T. O., and Schwartz, O. (2007). Visual adaptation: neural, psychological and computational aspects. Vision Res. 47, 3125–3131.
Clifford, C. W., and Weston, E. (2005). Aftereffect of adaptation to Glass patterns. Vision Res. 45, 1355–1363.
De Valois, K. K., and Switkes, E. (1983). Simultaneous masking interactions between chromatic and luminance gratings. J. Opt. Soc. Am. 73, 11–18.
Delorme, A., and Makeig, S. (2004). EEGLAB: an open source toolbox for analysis of single-trial EEG dynamics including independent component analysis. J. Neurosci. Methods 134, 9–21.
Derrington, A. M., Krauskopf, J., and Lennie, P. (1984). Chromatic mechanisms in lateral geniculate nucleus of macaque. J. Physiol. 357, 241–265.
Di Russo, F., Martinez, A., Sereno, M. I., Pitzalis, S., and Hillyard, S. A. (2002). Cortical sources of the early components of the visual evoked potential. Hum. Brain Mapp. 15, 95–111.
Duncan, J. (1984). Selective attention and the organization of visual information. J. Exp. Psychol. Gen. 113, 501–517.
Eimer, M. (1997). An event-related potential (ERP) study of transient and sustained visual attention to color and form. Biol. Psychol. 44, 143–160.
Eimer, M., Kiss, M., and Nicholas, S. (2010). Response profile of the face-sensitive N170 component: a rapid adaptation study. Cereb. Cortex 20, 2442–2452.
Engel, S. A. (2005). Adaptation of oriented and unoriented color-selective neurons in human visual areas. Neuron 45, 613–623.
Engel, S. A., and Furmanski, C. S. (2001). Selective adaptation to color contrast in human primary visual cortex. J. Neurosci. 21, 3949–3954.
Gilinsky, A. S. (1968). Orientation-specific effects of patterns of adapting light on visual acuity. J. Opt. Soc. Am. 58, 13–18.
Gomez Gonzalez, C. M., Clark, V. P., Fan, S., Luck, S. J., and Hillyard, S. A. (1994). Sources of attention-sensitive visual event-related potentials. Brain Topogr. 7, 41–51.
Green, D. M., and Swets, J. A. (1969). Signal Detection Theory and Psychophysics. New York, NY: Wiley.
Grill-Spector, K., and Malach, R. (2001). fMR-adaptation: a tool for studying the functional properties of human cortical neurons. Acta Psychol. (Amst) 107, 293–321.
Hillyard, S. A., Teder-Salejarvi, W. A., and Munte, T. F. (1998). Temporal dynamics of early perceptual processing. Curr. Opin. Neurobiol. 8, 202–210.
Hopf, J. M., Vogel, E., Woodman, G., Heinze, H. J., and Luck, S. J. (2002). Localizing visual discrimination processes in time and space. J. Neurophysiol. 88, 2088–2095.
Ishihara, S. (2007). Ishihara's Tests for Colour Deficiency (38 plates Edn). Tokyo: Kanehara Trading Inc.
Itier, R. J., and Taylor, M. J. (2004). N170 or N1? Spatiotemporal differences between object and face processing using ERPs. Cereb. Cortex 14, 132–142.
Jacques, C., D'Arripe, O., and Rossion, B. (2007). The time course of the inversion effect during individual face discrimination. J. Vis. 7, 3.
Kohn, A. (2007). Visual adaptation: physiology, mechanisms, and functional benefits. J. Neurophysiol. 97, 3155–3164.
Kohn, A., and Movshon, J. A. (2003). Neuronal adaptation to visual motion in area MT of the macaque. Neuron 39, 681–691.
Kovacs, G., Zimmer, M., Harza, I., and Vidnyanszky, Z. (2007). Adaptation duration affects the spatial selectivity of facial aftereffects. Vision Res. 47, 3141–3149.
Kovacs, I., and Julesz, B. (1992). Depth, motion, and static-flow perception at metaisoluminant color contrast. Proc. Natl. Acad. Sci. U.S.A. 89, 10390–10394.
Krekelberg, B., Boynton, G. M., and van Wezel, R. J. (2006). Adaptation: from single cells to BOLD signals. Trends Neurosci. 29, 250–256.
Krekelberg, B., Vatakis, A., and Kourtzi, Z. (2005). Implied motion from form in the human visual cortex. J. Neurophysiol. 94, 4373–4386.
Luck, S. J. (2005). An Introduction to the Event-related Potential Technique. Cambridge, MA: MIT Press.
MacLeod, D. I., and Boynton, R. M. (1979). Chromaticity diagram showing cone excitation by stimuli of equal luminance. J. Opt. Soc. Am. 69, 1183–1186.
Mandelli, M. J., and Kiper, D. C. (2005). The local and global processing of chromatic Glass patterns. J. Vis. 5, 405–416.
McGinnis, E. M., and Keil, A. (2011). Selective processing of multiple features in the human brain: effects of feature type and salience. PLoS One 6:e16824. doi: 10.1371/journal.pone.0016824
Mullen, K. T., Dumoulin, S. O., Mcmahon, K. L., De Zubicaray, G. I., and Hess, R. F. (2007). Selectivity of human retinotopic visual cortex to S-cone-opponent, L/M-cone-opponent and achromatic stimulation. Eur. J. Neurosci. 25, 491–502.
Noguchi, Y., Inui, K., and Kakigi, R. (2004). Temporal dynamics of neural adaptation effect in the human visual ventral stream. J. Neurosci. 24, 6283–6290.
O'Craven, K. M., Downing, P. E., and Kanwisher, N. (1999). fMRI evidence for objects as the units of attentional selection. Nature 401, 584–587.
Ohla, K., Busch, N. A., Dahlem, M. A., and Herrmann, C. S. (2005). Circles are different: the perception of Glass patterns modulates early event-related potentials. Vision Res. 45, 2668–2676.
Ostwald, D., Lam, J. M., Li, S., and Kourtzi, Z. (2008). Neural coding of global form in the human visual cortex. J. Neurophysiol. 99, 2456–2469.
Otten, L. J., and Rugg, M. D. (2005). “Interpreting event-related brain potentials,” in Event-related Potentials: A Methods Handbook, ed T. C. Handy, (Cambridge, MA: MIT Press), 3–16.
Perrin, F., Pernier, J., Bertrand, O., and Echallier, J. F. (1989). Spherical splines for scalp potential and current density mapping. Electroencephalogr. Clin. Neurophysiol. 72, 184–187.
Priebe, N. J., Churchland, M. M., and Lisberger, S. G. (2002). Constraints on the source of short-term motion adaptation in macaque area MT.I. the role of input and intrinsic mechanisms. J. Neurophysiol. 88, 354–369.
Proverbio, A. M., Burco, F., Del Zotto, M., and Zani, A. (2004). Blue piglets? Electrophysiological evidence for the primacy of shape over color in object recognition. Brain Res. Cogn. Brain Res. 18, 288–300.
Rentzeperis, I., and Kiper, D. C. (2010). Evidence for color and luminance invariance of global form mechanisms. J. Vis. 10, 6.
Ritter, W., Simson, R., and Vaughan, H. G. Jr. (1983). Event-related potential correlates of two stages of information processing in physical and semantic discrimination tasks. Psychophysiology 20, 168–179.
Sawamura, H., Orban, G. A., and Vogels, R. (2006). Selectivity of neuronal adaptation does not match response selectivity: a single-cell study of the FMRI adaptation paradigm. Neuron 49, 307–318.
Schoenfeld, M. A., Tempelmann, C., Martinez, A., Hopf, J. M., Sattler, C., Heinze, H. J., and Hillyard, S. A. (2003). Dynamics of feature binding during object-selective attention. Proc. Natl. Acad. Sci. U.S.A. 100, 11806–11811.
Sergent, C., Baillet, S., and Dehaene, S. (2005). Timing of the brain events underlying access to consciousness during the attentional blink. Nat. Neurosci. 8, 1391–1400.
Seymour, K., Clifford, C. W., Logothetis, N. K., and Bartels, A. (2010). Coding and binding of color and form in visual cortex. Cereb. Cortex 20, 1946–1954.
Shapley, R., and Hawken, M. J. (2011). Color in the cortex: single- and double-opponent cells. Vision Res. 51, 701–717.
Smid, H. G., Jakob, A., and Heinze, H. J. (1997). The organization of multidimensional selection on the basis of color and shape: an event-related brain potential study. Percept. Psychophys. 59, 693–713.
Smid, H. G., Jakob, A., and Heinze, H. J. (1999). An event-related brain potential study of visual selective attention to conjunctions of color and shape. Psychophysiology 36, 264–279.
Smith, M. A., Bair, W., and Movshon, J. A. (2002). Signals in macaque striate cortical neurons that support the perception of glass patterns. J. Neurosci. 22, 8334–8345.
Theodoni, P., Kovacs, G., Greenlee, M. W., and Deco, G. (2011). Neuronal adaptation effects in decision making. J. Neurosci. 31, 234–246.
Tolias, A. S., Keliris, G. A., Smirnakis, S. M., and Logothetis, N. K. (2005). Neurons in macaque area V4 acquire directional tuning after adaptation to motion stimuli. Nat. Neurosci. 8, 591–593.
Vizioli, L., Rousselet, G. A., and Caldara, R. (2010). Neural repetition suppression to identity is abolished by other-race faces. Proc. Natl. Acad. Sci. U.S.A. 107, 20081–20086.
Vogel, E. K., and Luck, S. J. (2000). The visual N1 component as an index of a discrimination process. Psychophysiology 37, 190–203.
Webster, M. A., Kaping, D., Mizokami, Y., and Duhamel, P. (2004). Adaptation to natural facial categories. Nature 428, 557–561.
Weigelt, S., Muckli, L., and Kohler, A. (2008). Functional magnetic resonance adaptation in visual neuroscience. Rev. Neurosci. 19, 363–380.
Wichmann, F. A., and Hill, N. J. (2001a). The psychometric function: I.Fitting, sampling, and goodness of fit. Percept. Psychophys. 63, 1293–1313.
Wichmann, F. A., and Hill, N. J. (2001b). The psychometric function: II.Bootstrap-based confidence intervals and sampling. Percept. Psychophys. 63, 1314–1329.
Wilson, H. R., and Wilkinson, F. (1998). Detection of global structure in Glass patterns: implications for form vision. Vision Res. 38, 2933–2947.
Wilson, H. R., Wilkinson, F., and Asaad, W. (1997). Concentric orientation summation in human form vision. Vision Res. 37, 2325–2330.
Wilson, J. A., and Switkes, E. (2005). Integration of differing chromaticities in early and midlevel spatial vision. J. Opt. Soc. Am. A Opt. Image Sci. Vis. 22, 2169–2181.
Keywords: adaptation selectivity, color, EEG, form, response selectivity, vision
Citation: Rentzeperis I, Nikolaev AR, Kiper DC and van Leeuwen C (2012) Relationship between neural response and adaptation selectivity to form and color: an ERP study. Front. Hum. Neurosci. 6:89. doi: 10.3389/fnhum.2012.00089
Received: 16 December 2011; Accepted: 28 March 2012;
Published online: 20 April 2012.
Edited by:
Stephen A. Engel, University of Minnesota, USAReviewed by:
Bart Krekelberg, Rutgers, The State University of New Jersey, USAEugene Switkes, University of California Santa Cruz, USA
Copyright: © 2012 Rentzeperis, Nikolaev, Kiper and van Leeuwen. This is an open-access article distributed under the terms of the Creative Commons Attribution Non Commercial License, which permits non-commercial use, distribution, and reproduction in other forums, provided the original authors and source are credited.
*Correspondence: Ilias Rentzeperis, Institute of Neuroinformatics, University of Zurich and Swiss Federal Institute of Technology, Winterthurerstrasse 190, CH-8057 Zurich, Switzerland. e-mail: elias@ini.phys.ethz.ch