Correlated components of ongoing EEG point to emotionally laden attention – a possible marker of engagement?
- 1 Department of Biomedical Engineering, City College of NewYork, NewYork, NY, USA
- 2 Columbia University, New York, NY, USA
Recent evidence from functional magnetic resonance imaging suggests that cortical hemodynamic responses coincide in different subjects experiencing a common naturalistic stimulus. Here we utilize neural responses in the electroencephalogram (EEG) evoked by multiple presentations of short film clips to index brain states marked by high levels of correlation within and across subjects. We formulate a novel signal decomposition method which extracts maximally correlated signal components from multiple EEG records. The resulting components capture correlations down to a one-second time resolution, thus revealing that peak correlations of neural activity across viewings can occur in remarkable correspondence with arousing moments of the film. Moreover, a significant reduction in neural correlation occurs upon a second viewing of the film or when the narrative is disrupted by presenting its scenes scrambled in time. We also probe oscillatory brain activity during periods of heightened correlation, and observe during such times a significant increase in the theta band for a frontal component and reductions in the alpha and beta frequency bands for parietal and occipital components. Low-resolution EEG tomography of these components suggests that the correlated neural activity is consistent with sources in the cingulate and orbitofrontal cortices. Put together, these results suggest that the observed synchrony reflects attention- and emotion-modulated cortical processing which may be decoded with high temporal resolution by extracting maximally correlated components of neural activity.
Introduction
The ability to reliably decode brain state from recordings of neural activity represents a major neuroscientific frontier. Up until recently, the majority of brain decoding research has employed the event-related design (Spiers and Maguire, 2007) in which neural activity is regressed onto discrete event variables, allowing one to compute the neural correlates of a predefined and presumably fixed brain state. In natural settings, however, brain states are both continuous and transient. Moreover, the events eliciting state changes do not generally occur in a temporally regularized manner. Thus, there exists a need to track and index ongoing changes in cognitive state. In the absence of event markers, one possible solution is to regress the neural activity of one subject onto that of another, thus utilizing the correlation between multiple records to inform the state variables. Indeed, recent studies employing functional magnetic resonance imaging (fMRI) have revealed strong voxel-wise inter-subject correlations (ISC) across participants exposed to a common naturalistic stimulus (i.e., movie clips; Hasson et al., 2004, 2010; Hanson et al., 2009). Unfortunately, voxel-wise correlations in the blood oxygenation level dependent (BOLD) signal are unable to capture weaker activity that is distributed over distant cortical areas. Furthermore, the limited temporal resolution of fMRI constrains the potential of so-called “reverse-correlation” procedures (Hasson et al., 2004) that identify stimulus features eliciting the observed peaks in correlation. In other words, while fMRI may tell us if neural activity significantly correlates in response to a common stimulus, it will likely not be able to tell us precisely when this synchronization occurs. Finally, the hemodynamic response measured in fMRI only indirectly captures neural activity and does not allow for analysis of fast oscillatory activity (although it does correlate with oscillatory activity in the gamma band; Mukamel et al., 2005).
To address these issues, in this study we employ EEG which offers a temporally fine and direct measure of neural activity. We record EEG during multiple views of short film clips and optimally measure the temporal correlation of neural activity between the multiple views. Instead of correlating raw signals in an electrode-to-electrode fashion, we derive a novel signal decomposition method which finds linear components of the data with maximal mutual correlation. The resulting spatially filtered EEG can capture patterns of activity distributed over large cortical areas that would remain occluded in voxel-wise or electrode-wise analysis. Furthermore, the temporal resolution of EEG is sufficiently fine to capture rapid variations in amplitude and instantaneous power in ongoing neural oscillations. Patterns of neural oscillation have long been associated with cognitive functions such as attention [alpha-band activity (Klimesch et al., 1998; Foxe and Snyder, 2011), emotional involvement (beta oscillations; Ray and Cole, 1985)] and memory encoding (theta activity; Klimesch, 1999). Thus, utilizing EEG allows us to relate the measured correlations to ongoing oscillatory activity, shedding light on the cognitive states involved during synchronized periods.
The measure of correlation presented here is fundamentally different from that proposed in Hasson et al. (2004), which only captures coincidence of high or low activity in the hemodynamic response. Here, we leverage the high temporal resolution of EEG to measure correlation in time between two viewings. Hence, the spatial components extracted here capture not only coincidence, but rather, they represent neural activity that similarly tracks or follows the stimulus. We employ our measure to investigate the link between neural correlation and viewer engagement – a cognitive state which lacks a rigorous definition in the neuroscience context and which we define operationally by “emotionally laden attention.” In addition to the scientific value afforded by uncovering the neural substrates of engagement, the ability to monitor engagement in an individual or population has potential application in several contexts: neuromarketing (Ariely and Berns, 2010), quantitative assessment of entertainment (Gunter, 2000), measuring the impact of narrative discourse (Mar, 2004), and the study of attention-deficit disorders (Oosterlaan and Sergeant, 1998). We hypothesize that our statistically optimized measure of brain synchrony closely corresponds to the level of engagement of the subject during viewing. To test this prediction directly, we manipulate the expected level of engagement in various ways and find that our measure of neural correlation acts as a regularized and time-resolved marker of engagement. Specifically, our analysis reveals that peaks in this neural correlation measure occur in high correspondence with arousing moments of the film, and fail to arise in amateur footage of everyday life. Moreover, when the presentation of the film clip is repeated, or when it is shown with its scenes scrambled in time, a significant decrease in correlation is observed. Additionally, we probe the instantaneous power in conventionally analyzed EEG frequency bands, and demonstrate significant co-variation of the activity in these bands with the optimized correlation measure: while parietal and occipital power in the alpha and beta bands are decreased during peaks in synchrony, frontal theta power is increased during time windows of heightened correlation. Finally, low-resolution source localization analysis suggests that the components of correlated scalp activity are consistent with sources in the cingulate and orbitofrontal cortices. These results suggest that modulation of cortical processing during attention- and emotion-laden states leads to the observed between-view correlation, and such moments of “engagement” may be decoded from the EEG down to a 1-s time resolution.
Materials and Methods
Extraction of Maximally Correlated Components
First we aimed to develop an analysis technique that is suitable for the continuous stream of neural activity generated during viewing of these film clips. With natural stimuli such as video, there may not be well-defined epochs that could be used with traditional methods of analyzing evoked or induced responses in EEG. Thus, instead of regressing the EEG signal against predefined discrete moments in time, we correlate the signal with the data from a second viewing that serves as a time-accurate reference for analysis. The second viewing could be by the same or a different subject. We want to combine electrodes linearly so as to identify, if necessary, distributed sources of neural activity instead of relying on individual voltage readings on the scalp. The traditional technique for extracting linear combinations of data with maximal correlation is Canonical Correlation Analysis (CCA; Hotelling, 1936). Unfortunately, CCA requires the canonical projection vectors (i.e., spatial filters) to be orthogonal. This is not a meaningful constraint as spatial distributions are determined by anatomy and the location of current sources and are thus not expected to be orthogonal. Moreover, CCA assumes that each of the two data sets requires a different linear combination, thus doubling the number of free parameters and unnecessarily reducing estimation accuracy (Bellman, 1957). By dropping this assumption – a sensible choice as the two data sets are in principle no different – we have fewer degrees of freedom which allows us also to drop the constraint on orthogonality. The resulting algorithm, which maximizes the Pearson Product Moment Correlation Coefficient (Pearson, 1896) and is referred to here as “correlated components analysis,” amounts to simultaneously diagonalizing the pooled covariance and the cross-correlations of the two data sets. The linear components that achieve this can be obtained as the solutions of a generalized eigenvalue equation (equation 3), very much along the lines of other source separation algorithms used in EEG (Parra and Sajda, 2003).
Correlated Component Analysis
Here we provide the details of a component analysis technique which has been specifically designed to find linear components of the data that are maximally correlated in time when comparing two different renditions.
Given two data sets X1 ∈ ℝD×T and X2 ∈ ℝD×T, where D is the number of channels (i.e., electrodes) and T the number of time samples, we seek to find a weight vector w1 ∈ ℝD such that the resulting linear projections and exhibit maximal correlation. For example, X1 and X2 may be the EEG data records stemming from two viewings of the movie clip. Moreover, w is a spatial filter which linearly combines the electrodes such that the resulting filter outputs y1 and y2 recover correlated sources. Formally, the optimization problem seeks to maximize the Pearson Product Moment Correlation Coefficient (Pearson, 1896) between y1 and y2 (assuming zero-mean data):
where the sample covariance matrices are denoted by Differentiating equation (1) with respect to w and setting to zero yields:
where σij = wTR ij w denote scalar power terms required to bring the two data sets onto the same scale. While we generally do not have prior knowledge of σij, here we make the assumption that the two data sets have similar power levels, and thus σ11 ≈ σ221. Moreover, we symmetrize the cross-covariance matrix R12 to arrive at the following eigenvalue equation:
where λ = σ12/σ11. As equation (3) is a generalized eigenvalue problem, there are multiple (and not necessarily orthogonal) solutions. The weight vector that maximizes the correlation coefficient between y1 and y2 follows as the principal eigenvector of (R11 + R22)−1(R12 + R21), with the optimal value of the correlation given by the corresponding eigenvalue. Moreover, the second strongest correlation is obtained by projecting the data matrices onto the eigenvector corresponding to the second strongest eigenvalue, and so forth. As the decorrelation (correlation matrix inverse) operation is sensitive to dimensions dominated by noise, we effectively regularize the algorithm by truncating the eigenvalue spectrum of the pooled covariance to the K strongest principal components. The value of K serves as a regularization parameter: the larger the number of whitened components, the stronger the optimal correlation. However, lower values for K will shield the learning algorithm from picking up spurious correlations from noisy recordings.
Intra- and Inter-Subject Correlation (IaSC, ISC)
The two data matrices X1 and X2 used to compute the correlation and cross-correlation matrices in the forthcoming results are defined here. For the first analysis which is concerned with within-subject correlations, we define the subject-aggregated data matrices as follows:
where is the EEG data record from the ith viewing of the movie by the nth subject. For the analysis that is concerned with across-subject correlations, we defined the aggregated matrices 1 and 2 such that the subsequent correlation considers all unique combination of pairs of subjects. For example, for a three-subject population, we have:
where it should be noted that the above matrices correlate the records from viewing 1 only. Analogous definitions hold for the second viewing. As it is expected that only certain scenes evoke significant correlations, we compute the correlations in a time-resolved fashion by employing a sliding window with a 5-s duration with a shift of the window occurring every second (80% overlap between successive windows).
Forward Model
Given a set of linear spatial filters W and the data covariance matrix R, the forward models A = RW(W T RW)−1 represent the scalp projections of the synchronized activity extracted by the projection vectors W (Parra et al., 2005).
Source Localization
We have used the standardized low-resolution brain electromagnetic tomography package (sLORETA, version 20081104) to translate the obtained forward models into distributions of underlying cortical activity (Pascual-Marqui, 2002).
Spectral Analysis
To compute the instantaneous power of EEG in the theta (4–8 Hz), alpha (8–13 Hz), and beta (13–30 Hz) frequency bands, we employed a complex Morlet filter of the form with the following parameters for each band: (theta) a = 0.05, fc = 6, σ = 0.12, − 0.5 ≤ t ≤ 0.5 s; (alpha) a = 0.05, fc = 10, σ = 0.1, − 0.33 ≤ t ≤ 0.33 s; (beta) a = 0.2, fc = 20, σ = 0.075, − 0.33 ≤ t ≤ 0.33 s. The instantaneous power follows as the squared magnitude of the complex filter output y(t) = h(t)* x(t), where * denotes the convolution operator.
Experimental Paradigm
A total of 20 subjects with self-reported normal or corrected-to-normal vision and normal hearing, participated in the study. The minimum, median, and maximum age of the subjects was 21, 24, and 45, respectively, with 14 males and 6 females volunteering. All experiments were approved by the Institutional Review Board of the City College of New York and all subjects gave written informed consent prior to the experiment. Subjects were instructed to sit comfortably, attentively watch the forthcoming movie clips, and refrain as much as possible from overt movements. Each subject was then presented with three 6-min movie clips, with each clip being shown twice. The order of the three clips was randomized across subjects, but the order was preserved within each subject (for example, a typical session consisted of M2-M1-M3-M2-M1-M3). The movie clips chosen were from the following films: “Bang! You’re Dead,” (1961) directed by Alfred Hitchcock as part of the Alfred Hitchcock Presents series; “The Good, the Bad, and the Ugly,” (1966) directed by Sergio Leone; and a control film which depicts a natural outdoor scene on a college campus.
Data Collection and Pre-Processing
The EEG was recorded with a BioSemi Active Two system (BioSemi, Amsterdam, Netherlands) at a sampling frequency of 512 Hz. Subjects were fitted with a standard, 64-electrode cap following the international 10/10 system. To subsequently remove eye-movement artifacts, we also recorded the electrooculogram (EOG) with four auxiliary electrodes. All signal processing was performed offline in the MATLAB software (MathWorks, Natick, MA, USA). After extracting the EEG/EOG segments corresponding to the duration of each movie, the signals were high-pass filtered (0.5 Hz) and notch filtered (60 Hz). Eye-movement related artifacts were removed by linearly regressing out the four EOG channels from all EEG channels; we chose the regression approach over component-based techniques which are compared in Wallstrom et al. (2004). EEG samples whose squared magnitude falls above four standard deviations of the mean power of their respective channel were replaced with zeros. It should be noted that without regressing eye-movement related activity from the data, the forthcoming correlated components showed stereotypical signatures of eye movements, as expected given that well-edited films are known to evoke similar scan paths in viewers (Dorr et al., 2010). After regression, these components disappeared.
Statistical Significance
To establish significance of the time-resolved correlation, we employ a permutation test approach (Fisher, 1971). To yield correlation values under the null hypothesis, we compute the correlations with one of the two records (either from a second viewing or subject) scrambled in time: the second record is divided into 5-s blocks, with the order of the blocks then randomly shuffled. All significance tests are corrected for multiple comparisons using the false discovery rate (Benjamini and Hochberg, 1995).
Results
Peaks in Intra-Subject Correlations (IaSC) Occur at Momentous Film Events
We first consider intra-subject correlations (IaSC) between the two viewings and their relationship to stimulus characteristics. To that end, we construct subject-aggregated data matrices by concatenating in time the data from multiple subjects separately for each viewing (see equation 4). The aggregated data is substituted into the eigenvalue equation of equation (3) to yield the optimal spatial filters and resulting components. For each of n = 10 subjects, the coincidence in neural activity across the two viewings is then measured by computing the correlation coefficient in the component space. The population IaSC follows as the average of these correlation coefficients across all subjects.
Figure 1A depicts the top three correlation-maximizing components, shown in the form of “forward models” (Parra et al., 2005; see Methods) which depict the projection of the correlated neural activity on the scalp. It is interesting to note the remarkable level of agreement in the forward models across the three movies shown, including the amateur film depicting an outdoor scene lacking noteworthy action. The first component is symmetric and marked by an occipital positivity and parietal negativity. The second component is also symmetric with positivity over the temporal lobes and negativity over the medial parietal cortex. Meanwhile, the third component shows a strong frontal positivity with broad temporal-parietal-occipital negativity.
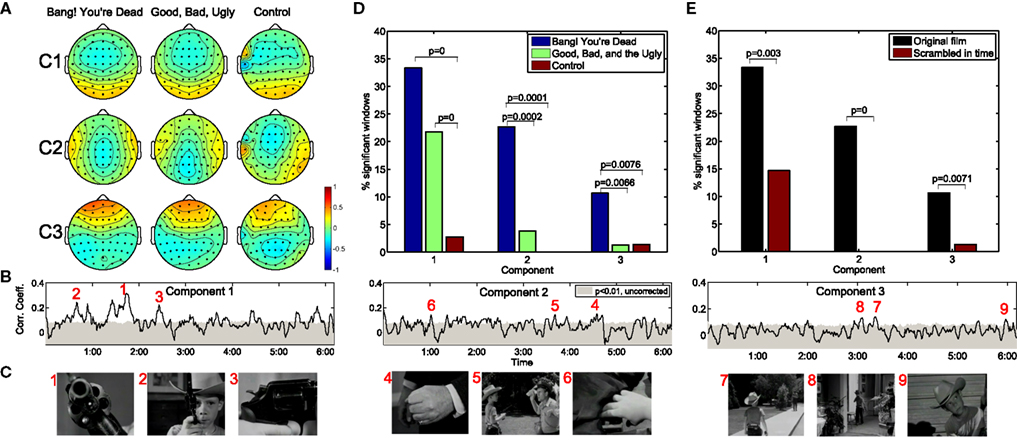
Figure 1. Neural correlations during two critically acclaimed films and one amateur control. The scalp projections of the first three maximally correlated components show a remarkable congruence across the three films shown (A). The within-subject correlation peaks at particularly arousing moments of “Bang! You’re Dead,” (B,C) with over 30% of the film resulting in statistically significant correlations in the first component (D). On the other hand, any extended periods of statistically significant correlation fail to arise during the control clip. Moreover, when presenting “Bang! You’re Dead” with its scenes scrambled in time, a significant reduction in neural correlation ensues (E).
The resulting population correlation coefficients are shown as a function of movie time for “Bang! You’re Dead” in Figure 1B. The gray shaded area indicates the correlation level required to achieve significance at the p < 0.01 level (using a permutation test). The first component shows extended periods of statistical significance, staying above the significance level for approximately 33% (corrected for multiple comparisons by controlling the False Discovery Rate; Benjamini and Hochberg, 1995) of the film. More importantly, the peaks of the population IaSC correspond to moments in the clip marked by a high level of suspense, tension, or surprise, often involving close-ups of the young protagonist’s revolver (which the audience, but not the boy, knows is genuine and contains one bullet) being triggered – Figure 1C. For an appreciation of the correspondence between the population IaSC and the plot trajectory, please refer to the online demo for a real-time visualization of all three components’ population IaSC curves throughout the film clip. The correlation time series of the second component spends approximately 23% of the film duration above the significance level, with local maxima seeming to coincide with scenes of cinematic tension involving hands (i.e., the protagonist’s Uncle realizes that his revolver is in the hands of the boy; the protagonist points the real gun at an approaching mailman; the boy finds a case of bullets in the guest room). Finally, the population IaSC as measured in the space of the third component is significant for approximately 10% of the clip duration, exhibiting peaks at moments roughly linked to anticipation. Figure 1D summarizes the proportion of significantly correlated time windows of each component and movie. It is clear that there is little correlated neural activity present in the EEG stemming from the control film. We employed a standard hypothesis test of proportions (Glantz, 2005) to test whether pairs of observed ratios are drawn from disparate distributions: where significant, we have indicated the corresponding p-values. In the first component, for example, there is a significant increase in the proportion of significantly correlated time windows in the two critically acclaimed films as compared to the control film.
Population IaSC is Strongly Attenuated When “Meaning” of Stimulus is Lost
We constructed a further control by extracting the (46) scenes of “Bang! You’re Dead,” randomly shuffling their temporal order, and recording the neural activity in response to this temporally reordered, but otherwise identical, stimulus (for this experiment, a separate group n = 10 subjects was employed, and each subject viewed the scrambled film twice). Comparing the neural responses of the scrambled film with the original version controls for the low-level visual and auditory features of the stimulus which are identical in both conditions. On the other hand, the meaning, affect, and suspense are presumably elevated when viewing the film clip in its original order. As shown in Figure 1E, the proportion of statistically significant windows is reduced to 14, 0% (no significant time windows), and 1% for components 1, 2, and 3, respectively, in the scrambled film. Once again, a hypothesis test of proportions reveals that these reductions are statistically significant at the p < 0.01 level.
Inter-Subject Correlation (ISC) Decreases during Second Viewing
Next, we consider the effect of prior exposure to the stimulus on the resulting neural correlation. To that end, we measured the population inter-subject correlation (ISC) during the first and second viewings of the clips for n = 10 subjects. Analogously to the measure of population IaSC defined above, we construct the aggregated matrices such that the subsequent correlation considers all unique combinations of pairs of subjects (see equation 5). Once these concatenated data sets are constructed, the eigenvalue problem of equation (3) is solved to yield the spatial filters maximizing the ISC across the entire population.
Figure 2A depicts the scalp projections of the maximally correlated components for “Bang! You’re Dead.” It is immediately evident that these components bear a strong resemblance to those maximizing the population IaSC in the previous subsection – this is an intuitively satisfying result, as it stands to reason that the neural “sources” responsible for the correlated stimulus-driven activity across viewings of the same individual would also lead to across-subject reliability. While a high level of congruence exists between the forward models of the first and second viewings, it is interesting to note the stronger frontal positivity in the third component of the first viewing (as compared to the second viewing). For each viewing, we also computed the time-resolved correlation coefficients averaged across subject-pairs (shown in Figure 2B), and performed the Wilcoxon signed rank test to determine the probability that the differences in population ISC between the two viewings could have originated from a zero-median distribution (Gibbons and Chakraborti, 1992). For all three components, the null hypothesis was rejected (p = 0.004, p = 0.012, p = 0.005, for components 1, 2, and 3 respectively). Finally, as shown in Figure 2C, there is a statistically significant reduction in the proportion of time windows showing significant correlation during the second viewing in the second (p = 0.022) and third components (p = 0.027).
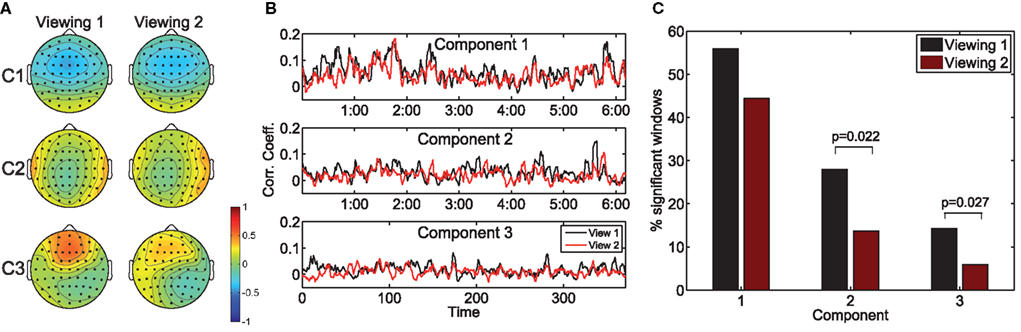
Figure 2. The effect of prior exposure on neural correlation. The scalp projections of the components maximizing population ISC during the first viewing are largely congruent to those stemming from viewing 2 (A). However, the resulting time-resolved correlation measures are significantly lower during the second viewing (B). Furthermore, more time windows exhibit statistically significant ISC in the first viewing (C).
High Neural Correlation Marked by Decreased Alpha and Increased Theta
Due to the fine temporal resolution inherent to EEG, it is possible to uncover the frequency bands that are systematically increased (or decreased) during periods of high correlation. For example, desynchronization in the alpha band has been shown to be associated with increased attention (Klimesch et al., 1998), while increased alpha-band oscillations presumably reflect an attention suppression mechanism (Foxe and Snyder, 2011). As a result, one may expect an inverse relationship between alpha power and decoded engagement. To that end, we compared the instantaneous power (Boashash, 1992) at several nominal EEG frequency bands (collapsed across subjects and viewings) during times of high within-subject correlation to that observed during low-correlation periods. For each subject, we computed the mean instantaneous power during temporal windows in the top and bottom 20% of the population IaSC, and then tested the power differences (high correlation versus low correlation, n = 10) for statistical significance using a one-sample Student’s t-test. This procedure is performed in the component space: that is, the instantaneous powers are computed on the spatially filtered EEG. The results are summarized in Figure 3, which displays the corresponding boxplots of differences in instantaneous power. Each boxplot displays the median (central mark), the 25 and 75 percentiles (box edges), extrema (whiskers), and samples considered outliers (“plus” signs).
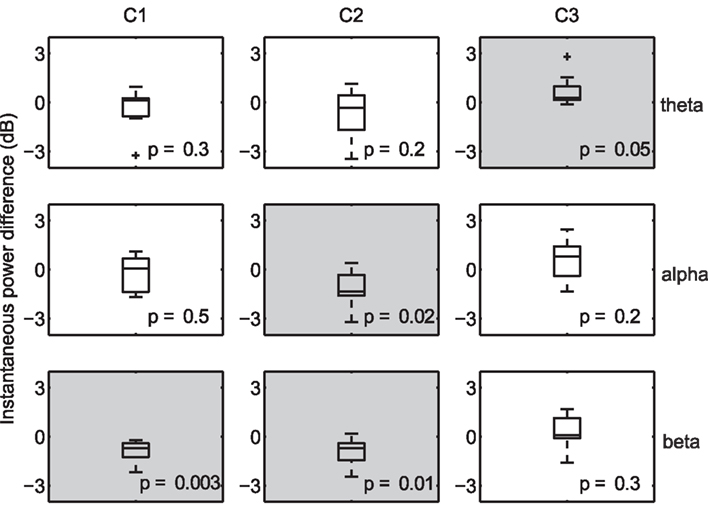
Figure 3. Differences in instantaneous power during moments of high versus low neural correlation. Distributions are constructed along the subject dimension (n = 10, with statistically significant effects denoted with a light gray background). High correlation windows are marked by synchronization of theta activity in the third component, desynchronization of alpha in the second component, and desynchronization of beta in the first and second components.
Effects deemed to be statistically significant are indicated with gray shading, and p-values are listed in each panel. As expected, there is a significant decrease in alpha power, measured in the space of the second (temporal-parietal) component, during periods of high IaSC. Moreover, the power in the theta band of the third (frontal) component is significantly increased during highly correlated times – synchronization of frontal theta power with a concurrent decrease in alpha power has been linked to the encoding of new information (Klimesch, 1999; Jensen and Tesche, 2002). It has also been shown in an fMRI study that successful encoding of episodic memory is correlated with high ISC during initial exposure (Hasson et al., 2008). Finally, a strong reduction in beta power in both the first and second components is revealed – a decrease in temporal beta has been associated with so-called “intake” tasks, or those that require sustained monitoring of external emotionally laden stimuli (Ray and Cole, 1985).
Source Analysis Suggests Emotional Involvement
While the spatial resolution of EEG is inherently poor, low-resolution tomography (LORETA) of scalp potentials has been extensively employed to suggest possible cortical origins of the observed activity (Fuchs et al., 2002; Pascual-Marqui, 2002; Jurcak et al., 2007). To that end, we computed the LORETA estimates of the neural current source distributions explaining the scalp projections of the synchronized activity. The results are illustrated in Figure 4.
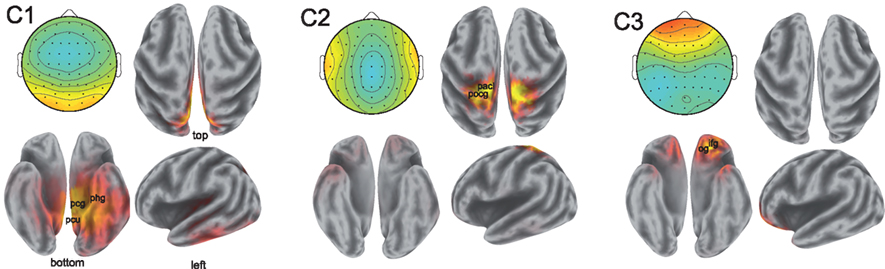
Figure 4. Sources of correlated neural activity for components 1, 2, and 3. The scalp projections of the correlated activity are shown in the top left of each pane; the estimated distributions of cortical sources are depicted in the remaining three panes. The correlated activity of component 1 suggests involvement of the posterior cingulate gyrus (Brodmann Area 31, labeled pcg), the parahippocampal gyrus (Brodmann Area 27, phg), and precuneus (Brodmann Area 7, pcu). The postcentral gyrus (pocg) and paracentral lobule (pacl) are implicated in the localization of the activity in component two. The activity captured by component 3 is consistent with sources in the inferior frontal gyrus (ifg) and the orbital gyrus (og). Anatomical locations shown are approximate.
The localization results from the first component of synchronized activity suggest a possible source in the cingulate cortex, with particularly strong activation occurring in the posterior cingulate of the left hemisphere. The cingulate cortex has been viewed by some as a unitary component of the limbic system subserving emotional processing (Vogt, 2005). Strong activations may also originate in the parahippocampal gyri (involved in the processing of scenes; Epstein et al., 2003), as well as in the precuneus and superior parietal lobule of the parietal cortex – widespread involvement of the parietal cortex in neural correlation was also reported in fMRI (Hasson et al., 2004). Performing LORETA on the scalp projection of the synchronized activity in the second component is also consistent with activity originating in the parietal cortex, with the postcentral gyrus and paracentral lobules showing strong activations across both hemispheres. Meanwhile, source analysis of activity in the third component reveals possible sources in frontal regions (in descending order of strength of activation): the inferior frontal, orbital, middle frontal, and superior frontal gyri. The orbitofrontal cortex is considered to be a region of multimodal association and is involved in the representation and learning of reinforcers that elicit emotions and conscious feelings (Kringelbach, 2005).
Discussion
To investigate the relationship between engagement – an everyday phenomenon which one can readily describe subjectively – and neural correlation on a temporally fine time scale, we developed a component analysis technique which yields cleaner estimates of the underlying neural synchrony than that obtained by simply correlating (noisy) EEG in an electrode-to-electrode fashion. By then manipulating the naturalistic stimulus (for example, by repeating the film or showing it with scrambled scenes), we found a close correspondence between expected engagement and neural correlation. The observed desynchronization of alpha-band activity during times of high neural correlation suggests increased attention during moments of engagement. Indeed, there may be significant overlap between engagement and attention, as both appear to involve a suppression of internally oriented mental processing with a focus on external stimuli. We suggest here that in addition to increased attention, engagement entails emotional involvement (“emotionally laden attention”), a claim supported by the finding of decreased beta activity (Ray and Cole, 1985). Furthermore, we find increased theta activity in frontal areas which has been repeatedly implicated in memory encoding (Klimesch, 1999; Jensen and Tesche, 2002). This is also consistent with the finding that the most memorable events are those that are emotionally arousing (Anderson et al., 2006).
It is worthwhile to point out that we also repeated the analysis but with canonical correlation analysis (CCA) employed to derive the components. The resulting spatial filters exhibited very noisy topologies with seemingly little anatomical plausibility. We attributed this to the higher dimensionality of CCA and insufficient data to fit its parameter space. Both the proposed “Correlated Components Analysis” and the classical CCA explicitly correlate two data sets; instead, one may also apply conventional source separation algorithms such as Independent Components Analysis (ICA; Delorme and Makeig, 2004) to a concatenated data matrix of the form [X1X2]. Blind source separation techniques such as ICA are also powerful in extracting artifactual components which may then be straightforwardly subtracted from the data. On the other hand, the components yielded by an ICA decomposition are unordered and do not necessarily represent activity that is correlated across viewings. Thus, a manual procedure (and subsequent multiple comparison correction) would be required to search for components which exhibit the desired behavior (i.e., correlation across viewings). To that end, an ICA-type algorithm which incorporates correlation constraints may prove useful in future investigations.
Analyzing naturalistic data presents a challenge in that segments of data severely corrupted by subject movement and rapid impedance changes need to be retained in the processed data set: in multiple-trial analyses of the event-related variety, one may simply discard corrupted trials. Here, in an effort to preserve the temporal structure of the data, we have replaced all samples varying from their channel’s mean by more than 4 standard deviations with zeros. Fortunately, the obtained components do not show temporal time courses or spatial topologies consistent with motion artifacts. Ultimately, the effects of the manipulations used (showing the film a second time or with its scenes scrambled) on the resulting neural correlations suggest that what is being observed is neural in origin.
The analysis of the cortical origins of scalp potentials, particularly in the third component, argues for possible sources in the orbitofrontal cortex associated with emotional involvement. While analysis of scalp potentials cannot conclusively pinpoint the location of a current source in the brain (Kincses et al., 1999; Grave de Peralta Menendez et al., 2000), it can nevertheless suggest which source locations are consistent with the data, and thus helps to generate hypotheses as to the spatial origins of activity. Thus, we plan to perform combined fMRI-EEG experiments to confirm the estimates observed here. Moreover, a combined fMRI-EEG study will ascertain the importance of temporal resolution in identifying moments of high “engagement” – while the frame rate of a film far exceeds the temporal resolution of any fMRI scanner, the information rates of natural audiovisual stimuli are substantially lower than the frame rates employed to display their content. The fine temporal resolution of EEG may allow one to establish the time scale at which engagement is regulated in human subjects – something likely not feasible with fMRI.
Given the rising interest in the workings of the brain under real world conditions (Spiers and Maguire, 2007), the decoding and tracking of brain states in natural, uncontrolled settings promises to be a vigorous research direction in the coming years. While naturalistic experiments are straightforward to conduct (in contrast to the more controlled variety of event-related designs), the task of analysis becomes substantially more difficult in the sense that discerning the features of the perceptually rich, unregularized stimuli is a non-trivial undertaking. The results of our study point to the ability of marking ongoing attentional and emotional changes using temporally localized changes in neural synchrony. Moreover, while not considered in this work, it may be interesting to differentiate stimuli eliciting peaks in IaSC with those evoking peaks in ISC. Intuitively, IaSC measures how reliably a scene elicits a response in the viewer in repeated presentations. It is thus not surprising that we found the respective components to correspond to markers of engagement. On the other hand, ISC conveys an agreement of a group of individuals, in that multiple viewers must experience a common stimulus similarly for the correlation to peak. The within-subject correlations were strongly modulated by the “meaning” of the stimuli, in the sense that identical stimuli with a disrupted narrative strongly attenuated IaSC. While not explicitly analyzed here, we expect ISC to similarly depend on narrative. Whether the agreement of the group of individuals expressed by ISC is group specific, i.e., “cultural,” or whether a narrative is universally engaging may be an interesting subject for further study.
If one takes a dynamical systems view of the brain in which sensory processing interrupts internally oriented “default-mode” activity (Gusnard et al., 2001; Raichle et al., 2001; Greicius et al., 2003), one may view the proposed algorithm as attempting to extract the stimulus-driven response while filtering out the intrinsic activity. In actuality, the neural response to the stimulus varies both within and across subjects due to subjective evaluations of the stimulus, and due to the uniqueness of each individual’s brain. Moreover, it is not inconceivable that resting-state activity exhibit some correlation across viewings. In general, however, projections of the data which maximize correlation across viewings will reflect more of the sensory processing and less of the default-mode activity than that of the raw recordings.
The observed involvement of attention and emotion suggests a paradigm in which cortical processing of external stimuli is modulated by cognitive states. In this view, the brain is a dynamical system in which its extrinsic response to a stimulus is shaped by its global state. For example, the amplitude modulating effect of attention on visual evoked response has been observed as early as the 1960s (Garcia Austt et al., 1964). Thus, the neural activity of a less attentive viewer will exhibit less of the extrinsic response and more of the intrinsic activity (the effective “noise”), leading to decreased correlation across multiple views. Another possibility is that sensory processing becomes more precisely time-locked to the stimulus during periods of high engagement. The precise mechanism leading to increased correlation will remain a subject of investigation.
Regardless of the semantic description that one ascribes to states marked by elevated neural synchrony, the results presented in this study demonstrate that the amount of temporally resolved neural correlation conveys high-level properties of the stimulus. By further probing the spatial, spectral, and temporal dimensions of this encoding, we may gain valuable insights into how neural signals convey our everyday experience.
Conflict of Interest Statement
The authors declare that the research was conducted in the absence of any commercial or financial relationships that could be construed as a potential conflict of interest.
Acknowledgments
This work was supported by DARPA under contract N10PC20050. The authors would like to thank Uri Hasson for kindly providing us with several film clips, as well as Bryan Conroy and Jason Sherwin for fruitful discussions.
Footnote
- ^Note that in our application, it is reasonable to assume that the power levels of recordings stemming from two viewings (or two subjects) are roughly equivalent.
References
Anderson, A. K., Wais, P. E., and Gabrieli, J. D. E. (2006). Emotion enhances remembrance of neutral events past. Proc. Natl. Acad. Sci. U.S.A. 103, 1599–1604.
Ariely, D., and Berns, G. S. (2010). Neuromarketing: the hope and hype of neuroimaging in business. Nat. Rev. Neurosci. 11, 284–292.
Benjamini, Y., and Hochberg, Y. (1995). Controlling the false discovery rate: a practical and powerful approach to multiple testing. J. R. Stat. Soc. Series B Stat. Methodol. 57, 289–300.
Boashash, B. (1992). Estimating and interpreting the instantaneous frequency of a signal – part 1: fundamentals. Proc. IEEE 80, 520–538.
Delorme, A., and Makeig, S. (2004). EEGLAB: an open source toolbox for analysis of single-trial EEG dynamics including independent component analysis. J. Neurosci. Methods 134, 9–21.
Dorr, M., Martinetz, T., Gegenfurtner, K. R., and Barth, E. (2010). Variability of eye movements when viewing dynamic natural scenes. J. Vis. 10, 28.
Epstein, R., Graham, K. S., and Downing, P. E. (2003). Viewpoint-specific scene representations in human parahippocampal cortex. Neuron 37, 865–876.
Foxe, J. J., and Snyder, A. C. (2011). The role of alpha-band brain oscillations as a sensory suppression mechanism during selective attention. Front. Psychol. 2:154. doi: 10.3389/fpsyg.2011.00154
Fuchs, M., Kastner, J., Wagner, M., Hawes, S., and Ebersole, J. S. (2002). A standardized boundary element method volume conductor model. Clin. Neurophysiol. 113, 702–712.
Garcia Austt, E., Bogacz, J., and Vanzulli, A. (1964). Effects of attention and inattention upon visual evoked response. Electroencephalogr. Clin. Neurophysiol. 17, 136–143.
Gibbons, J. D., and Chakraborti, S. (1992). Nonparametric Statistical Inference, 3rd Rev/Ex Edn. New York: CRC Press.
Grave de Peralta Menendez, R., Gonzalez Andino, S. L., Morand, S., Michel, C. M., and Landis, T. (2000). Imaging the electrical activity of the brain: ELECTRA. Hum. Brain Mapp. 9, 1–12.
Greicius, M. D., Krasnow, B., Reiss, A. L., and Menon, V. (2003). Functional connectivity in the resting brain: a network analysis of the default mode hypothesis. Proc. Natl. Acad. Sci. U.S.A. 100, 253–258.
Gusnard, D. A., Akbudak, E., Shulman, G. L., and Raichle, M. E. (2001). Medial prefrontal cortex and self-referential mental activity: relation to a default mode of brain function. Proc. Natl. Acad. Sci. U.S.A. 98, 4259–4264.
Hanson, S. J., Gagliardi, A. D., and Hanson, C. (2009). Solving the brain synchrony eigenvalue problem: conservation of temporal dynamics (fMRI) over subjects doing the same task. J. Comput. Neurosci. 27, 103–114.
Hasson, U., Furman, O., Clark, D., Dudai, Y., and Davachi, L. (2008). Enhanced intersubject correlations during movie viewing correlate with successful episodic encoding. Neuron 57, 452–462.
Hasson, U., Malach, R., and Heeger, D. J. (2010). Reliability of cortical activity during natural stimulation. Trends Cogn. Sci. (Regul. Ed.) 14, 40–48.
Hasson, U., Nir, Y., Levy, I., Fuhrmann, G., and Malach, R. (2004). Intersubject synchronization of cortical activity during natural vision. Science 303, 1634–1640.
Jensen, O., and Tesche, C. D. (2002). Frontal theta activity in humans increases with memory load in a working memory task. Eur. J. Neurosci. 15, 1395–1399.
Jurcak, V., Tsuzuki, D., and Dan, I. (2007). 10/20, 10/10, and 10/5 systems revisited: their validity as relative head-surface-based positioning systems. Neuroimage 34, 1600–1611.
Kincses, W. E., Braun, C., Kaiser, S., and Elbert, T. (1999). Modeling extended sources of event-related potentials using anatomical and physiological constraints. Hum. Brain Mapp. 8, 182–193.
Klimesch, W. (1999). EEG alpha and theta oscillations reflect cognitive and memory performance: a review and analysis. Brain Res. Brain Res. Rev. 29, 169–195.
Klimesch, W., Doppelmayr, M., Russegger, H., Pachinger, T., and Schwaiger, J. (1998). Induced alpha band power changes in the human EEG and attention. Neurosci. Lett. 244, 73–76.
Kringelbach, M. L. (2005). The human orbitofrontal cortex: linking reward to hedonic experience. Nat. Rev. Neurosci. 6, 691–702.
Mar, R. (2004). The neuropsychology of narrative: story comprehension, story production and their interrelation. Neuropsychologia 42, 1414–1434.
Mukamel, R., Gelbard, H., Arieli, A., Hasson, U., Fried, I., and Malach, R. (2005). Coupling between neuronal firing, field potentials, and fMRI in human auditory cortex. Science 309, 951–954.
Oosterlaan, J., and Sergeant, J. A. (1998). Response inhibition and response re-engagement in attention-deficit/hyperactivity disorder, disruptive, anxious and normal children. Behav. Brain Res. 94, 33–43.
Parra, L., and Sajda, P. (2003). Blind source separation via generalized eigenvalue decomposition. J. Mach. Learn. Res. 4, 1261–1269.
Parra, L. C., Spence, C. D., Gerson, A. D., and Sajda, P. (2005). Recipes for the linear analysis of EEG. Neuroimage 28, 326–341.
Pascual-Marqui, R. D. (2002). Standardized low-resolution brain electromagnetic tomography (sLORETA): technical details. Methods Find Exp. Clin. Pharmacol. 24(Suppl. D), 5–12.
Pearson, K. (1896). Mathematical contributions to the theory of evolution. III. Regression, heredity, and panmixia. Philos. Trans. R. Soc. Lond. A 187, 489–498.
Raichle, M. E., MacLeod, A. M., Snyder, A. Z., Powers, W. J., Gusnard, D. A., and Shulman, G. L. (2001). A default mode of brain function. Proc. Natl. Acad. Sci. U.S.A. 98, 676–682.
Ray, W., and Cole, H. (1985). EEG alpha activity reflects attentional demands, and beta activity reflects emotional and cognitive processes. Science 228, 750–752.
Spiers, H. J., and Maguire, E. A. (2007). Decoding human brain activity during real-world experiences. Trends Cogn. Sci. (Regul. Ed.) 11, 356–365.
Vogt, B. A. (2005). Pain and emotion interactions in subregions of the cingulate gyrus. Nat. Rev. Neurosci. 6, 533–544.
Keywords: electroencephalography, engagement, attention, canonical correlation analysis, brain reading
Citation: Dmochowski JP, Sajda P, Dias J and Parra LC (2012) Correlated components of ongoing EEG point to emotionally laden attention – a possible marker of engagement? Front. Hum. Neurosci. 6:112. doi: 10.3389/fnhum.2012.00112
Received: 08 February 2012; Paper pending published: 29 March 2012;
Accepted: 13 April 2012; Published online: 16 May 2012.
Edited by:
Srikantan S. Nagarajan, University of California San Francisco, USAReviewed by:
Guillaume A. Rousselet, University of Glasgow, UKGennady Knyazev, Academy of Medical Sciences, Siberian Branch, Russia
Copyright: © 2012 Dmochowski, Sajda, Dias and Parra. This is an open-access article distributed under the terms of the Creative Commons Attribution Non Commercial License, which permits non-commercial use, distribution, and reproduction in other forums, provided the original authors and source are credited.
*Correspondence: Jacek P. Dmochowski and Lucas C. Parra, Department of Biomedical Engineering, City College of New York 160 Convent Avenue, New York, NY 10031, USA. e-mail: jdmochowski@ccny.cuny.edu; parra@ccny.cuny.edu