Differential synchronization in default and task-specific networks of the human brain
- 1 Department of Psychology, University of British Columbia, Vancouver, BC, Canada
- 2 Brain Research Centre, University of British Columbia, Vancouver, BC, Canada
On a regional scale the brain is organized into dynamic functional networks. The activity within one of these, the default network, can be dissociated from that in other task-specific networks. All brain networks are connected structurally but evidently are only transiently connected functionally. One hypothesis as to how such transient functional coupling occurs is that network formation and dissolution is mediated by increases and decreases in oscillatory synchronization between constituent brain regions. If so, then we should be able to find transient differences in intra-network synchronization between the default network and a task-specific network. In order to investigate this hypothesis we conducted two experiments in which subjects engaged in a Sustained Attention to Response Task while having brain activity recorded via high-density electroencephalography (EEG). We found that during periods when attention was focused internally (mind wandering) there was significantly more neural phase synchronization between brain regions associated with the default network, whereas during periods when subjects were focused on performing the visual task there was significantly more neural phase synchrony within a task-specific brain network that shared some of the same brain regions. These differences in network synchrony occurred in each of theta, alpha, and gamma frequency bands. A similar pattern of differential oscillatory power changes, indicating modulation of local synchronization by attention state, was also found. These results provide further evidence that the human brain is intrinsically organized into default and task-specific brain networks, and confirm that oscillatory synchronization is a potential mechanism for functional coupling within these networks.
Introduction
At a regional scale the brain is organized into functionally specific networks (Passingham et al., 2002; Bullmore and Sporns, 2009). Several networks with different functional properties have been delineated, including those for sensory/perceptual processing (Mishkin et al., 1983; van Essen and Maunsell, 1983; Rauschecker and Tian, 2000; Alain et al., 2001), orienting attention (Corbetta et al., 2008), and memory encoding and retrieval (Maguire and Frith, 2004; Habecka et al., 2005; Burianova et al., 2010). Importantly, a network distinct from most task-specific networks has been labeled the “default network” (Raichle et al., 2001; Buckner et al., 2007). Whereas task-specific networks tend to become activated when attention is directed externally toward behaviorally relevant stimuli, the default network has been shown to increase in activity during rest (Buckner et al., 2007). Functional connectivity and correlation analyses have also shown the default network to be anticorrelated with task-specific networks in the sense that when task-specific networks become active the default network decreases in activity and vice versa (Greicius et al., 2003; Fox et al., 2005; Jerbi et al., 2010).
The dominant brain regions comprising the default network – the medial-frontal cortex, the temporal lobe, the hippocampal formation, and the parietal lobe (Buckner et al., 2007) have been shown to be functionally linked (Greicius et al., 2003, 2009; Honey et al., 2009). It is still unknown, however, how the brain switches functionally between default and task-specific networks, or whether default and task-specific networks are always anticorrelated or can be simultaneously active. One attractive hypothesis is that transient functional organization of such large-scale neural assemblies is brought about by modulations of phase synchronization of neural oscillations (von Stein et al., 2000; Varela et al., 2001; Ward, 2003). If inter-regional phase synchronization is a plausible mechanism for the transient formation and dissolution of default and task-specific functional networks, then phase synchronization within task-specific networks should be greater when attention is focused on a specific task, whereas that within the default network should be greater when attention is focused inward, away from the external task. It is probably unrealistic, however, to expect extreme anticorrelation of synchronization in these networks if a task is ongoing and performed at a reasonable level, as synchronization in the task-specific network would be required to maintain performance if the synchronization is functionally important.
Such a pattern of differential synchronization between default and task-specific networks should be manifested at several oscillation frequencies, particularly theta (4–8 Hz), alpha (9–12 Hz), and gamma (30–50 Hz), given the links between cognitive processes and oscillations in these frequency bands (von Stein and Sarnthein, 2000; Varela et al., 2001; Ward, 2003). Previously, differential synchronization of 40-Hz oscillations has been produced in a simplified cortical network simulation (Deco et al., 2009), and alpha-band synchronization within groups of EEG scalp electrodes has been inferred to be activated by default processing (Fingelkurts and Fingelkurts, 2011). Moreover, seed-based correlation mapping of power changes in MEG data has been used to demonstrate transient formation of resting state networks separately from the dorsal attention network (de Pasquale et al., 2010).
Alpha-band (8–14 Hz) spectral power in the occipital lobe increases when visual processing is suppressed and decreases when visual processing is enhanced, whereas gamma-band power shows the opposite behavior (Kelly et al., 2006; Klimesch et al., 2007; Doesburg et al., 2009; Jensen and Mahazeri, 2010). Thus, when the occipital lobe is fully engaged in visual task-specific processing there should be lower alpha power and greater gamma power than when it is not so engaged. Consistent with this, pre-stimulus parietal–occipital alpha power is negatively correlated with attention state ratings in a rapid serial visual presentation task (MacDonald et al., 2011).
During most prolonged tasks attention waxes and wanes, alternating periods of “on-task” and “mind wandering” (Smallwood and Schooler, 2006). Given that attention is directed inward during periods of mind wandering, the default network is expected to be active during this time. The Sustained Attention to Response Task (SART; Robertson et al., 1997) can be used to induce periods of mind wandering as well as periods of task-directed attention. The highly repetitive nature of this task automates responses and subjects’ attention often drifts inward. Using SART and fMRI it has been shown that the default network is more active during periods of mind wandering, whereas a task-specific network is more active during periods of task-directed attention (Christoff et al., 2009). Thus, we implemented a SART in two high-density EEG experiments in order to investigate whether oscillatory activity and phase synchrony within default and task-specific brain networks would differ in ways similar to those observed in fMRI BOLD activations.
Materials and Methods
Subjects
In Experiment 1, 15 subjects (11 women, mean age ± SD = 21.5± 3.2) completed a SART for $20; in Experiment 2, 10 subjects (seven women, mean age ± SD = 21.5 ± 2.0) completed a similar SART for $20. One subject in Experiment 2 indicated no off-task periods and her data were discarded. All subjects were right handed with no history of neurological conditions and had normal or corrected-to-normal vision. Subjects provided written informed consent to the experimental procedure, which was approved by the UBC Clinical (Experiment 1) or Behavioral (Experiment 2) Ethics Review Board.
Sustained Attention to Response Task
The SART involved presenting a serial stream of visual stimuli to subjects (Figure 1). In Experiment 1 subjects pressed a button if the stimulus was one of the numerals 0–9 and withheld their response to the letter X. Within each block of 12–36 stimuli, one or two stimuli to which response had to be withheld (letter X) occurred at random. Subjects completed 38.2 blocks on average. During the interval between task-relevant stimuli (numerals or X), two task-irrelevant stimuli were presented, in random order, to the subject (see Figure 1). The “task-irrelevant” stimuli were added to the standard SART in order to allow for the measurement of peripheral, sensory processing during mind wandering. Analyses of event-related potential responses to these stimuli were reported by Kam et al. (2011). In Experiment 2 subjects pressed a button for numerals 0–2 and 4–9 and withheld their response to the numeral 3, which occurred randomly on 10% of the trials. Each stimulus was presented for 500 ms and a response was allowed up to 2 s after stimulus onset.
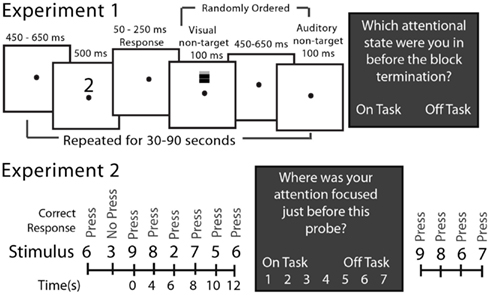
Figure 1. The SART for Experiments 1 and 2. In Experiment 1 at the top, open boxes illustrate video screen frames in the sequence presented to the subject. The target stimuli requiring responses were the randomly selected numerals 0–9 and the no-response target was an “X.” Non-target stimuli, which were never responded to, were either a grating presented on the screen above the fixation point or a brief sound. These occurred on every trial but in random order from trial to trial. In Experiment 2 at the bottom, only the sequence of stimuli is illustrated there. The target stimuli requiring responses were the numerals 0–2 and 4–9 and the no-response stimulus was a “3”; there were no non-target stimuli. The dark boxes illustrate the experience (attention state) probes that interrupted the ongoing SART from time to time, and which were different in the two experiments.
In Experiment 1 subjects were asked by the experimenter, who was in the room with the subject, to identify verbally their attention state immediately prior to the experience probe as being “on-task” (fully attentive to task performance at block’s end) or “off-task” (inattentive to the task at the block’s end). The block duration randomly varied between 30 and 90 s. In Experiment 2, subjects, alone in the room, were queried by the computer as to their attention state 115 times during the experiment at random intervals (block length) averaging approximately 42 s after the response to the previous experience probe. They responded by indicating their state on a 1 (“completely off-task”) to 7 (“completely on-task”) attention state scale by pressing the appropriate computer key.
EEG Recording
In Experiment 1, EEGs were recorded from 64 active electrodes (Bio-Semi Active2 system) distributed evenly over the head, relative to two scalp electrodes located over medial-frontal cortex (CMS/DRL), using a second order high-pass filter of 0.05 Hz, with a gain of 0.5 and digitized on-line at a sampling rate of 256 samples-per-second. The vertical EOG was recorded from an electrode inferior to the right eye, and the horizontal EOG from an electrode on the right outer canthus. In Experiment 2, EEGs were recorded from 60 passive electrodes in a standard electrode cap (Electro-cap, Inc.) at locations based on the International 10–10 System, relative to an electrode over the right mastoid with ground at AFz. Data were sampled at 500 Hz through an analog pass band of 0.01–100 Hz (SA Instrumentation, San Diego, CA, USA). The EOG was recorded from four periocular electrodes. Electrode impedance was below 10 kΩ. Prior to analysis all signals were re-referenced to an average reference, resampled to 250 Hz, and digitally high-pass filtered at 1 Hz.
EEG Data Analysis
EEG data were analyzed using EEGLAB software (Delorme and Makeig, 2004), an open source MATLAB toolkit (MathWorks, Natick, USA), and custom scripts. First we performed an Independent Component Analysis (ICA) on the continuous data. ICA uses temporal informational independence to separate out the unique EEG components corresponding to the volume-conducted projections of partially synchronous local cortical field activity within a variety of single, compact, cortical domains (Bell and Sejnowski, 1995; Stone, 2004; Delorme et al., 2012). The brain sources of the Independent Components (ICs) produced from this analysis were localized using dipole fitting of their single-dipole scalp maps. The canonical three-dimensional locations of the electrodes were co-registered with the Montreal Neurological Institute (MNI) average brain, and the EEGLAB dipfit2 algorithm was used to find dipole locations. Only ICs whose best-fitting single dipoles were localized within Talairach brain space and with less than 15% residual variance (termed “valid” ICs) were included in subsequent analyses. Note, however, that the data analyzed further were the time series of the ICs themselves, not the activations of their best-fitting dipoles, whose locations are used here only to give meaning to the ICs.
Wavelet coefficients of the sinusoidal oscillations between 5 and 70 Hz were obtained from a Morlet wavelet analysis on each IC time series. Wavelet analysis divides the total broadband IC signal into a set of frequency bands for which amplitude (power) and phase at each time point are computable from the wavelet coefficients.
Because we could not ascertain precisely how long a subject was in a particular attention state before each attention probe, we used a fixed time window of 12 s before the probe. This window has been used successfully in previous similar studies. For Experiment 1, windows preceding subjects’ indication that they were focused on the experiment were labeled “on-task,” whereas for Experiment 2 windows preceding responses five, six, and seven on the 1–7 attention state scale were labeled “on-task.” For Experiment 1, windows preceding subjects’ indication that they were off-task were labeled “off-task,” whereas for Experiment 2 windows preceding attention scale responses 1, 2, and 3 were labeled “off-task.” Windows preceding attention scale response “4” in Experiment 2 were not analyzed. No non-response stimuli occurred in the analyzed 12-s intervals in either experiment. This was by design, as we wished to analyze a stable on-task or off-task state, and a non-response stimulus occurring in this period could have changed the subject’s attention state.
Cluster analysis based on Talairach locations of dipoles associated with all valid ICs was performed to find neural sources that were common across subjects. In Experiment 1 a total of 230 ICs for the 15 subjects were separated into 13 clusters (Experiment 2: 266 ICs for nine subjects into 15 clusters) by applying the k-means algorithm of EEGLAB. For Experiment 1, seven clusters that contained the dipoles of at least 9 of the 15 subjects’ ICs within a single Brodmann brain area were retained (Experiment 2: seven clusters with at least five of nine subjects) for further analysis. Clusters were pruned so that they contained only a single IC from each represented subject; in case of multiple ICs from a single subject only that subject’s IC whose dipole was closest to the centroid of the cluster was retained.
In order to assess neural synchrony within the brain sources of the retained ICs we performed a time–frequency analysis of event-related spectral perturbation (ERSP). Within the epochs assigned to each attention condition, each of which consisted of the time period from stimulus onset until 650 ms after stimulus onset, oscillatory amplitude relative to a baseline (−150 to −50 ms), in decibels, was determined at each time point at frequencies from 5 to 70 Hz. Statistical significance of differences between the ERSPs in the on- and off-task conditions at each time point was assessed using the EEGLAB permutation test.
In order to assess the functional connections between different areas of the brain (inter-regional connectivity), phase locking analysis was performed. The phase locking value (PLV) was calculated between every pair of valid ICs for which a subject had one in each of two clusters. Phase cross-coherence (PLV) values were obtained using the following formula:
where Wi,k ( f,t) are the wavelet coefficients for each time, t, and frequency, f, point for each IC, i, and k = 1 to N is the index of trials (Delorme and Makeig, 2004). PLV values range from 0, which indicates no phase locking, to 1, which indicates perfect phase locking (constant phase difference). Approximate constancy of phase difference indicates stochastic synchronization, and thus a functional connection, between the relevant brain areas. Note that although the ICs are maximally informationally independent by design, they are not completely independent. There is always a (usually small) residual amount of mutual information between ICs that cannot be reduced. Moreover, ICA was done on the broadband EEG signals, which are dominated by low frequencies. Thus, there is the possibility that significant phase locking can occur transiently between pairs of ICs, particularly for frequencies above 5 Hz. It is this phase locking that our analysis assesses. Note also that because PLV was measured between maximally independent ICs, whose sources were localized to disparate brain regions, there is virtually no possibility of volume-conduction-induced spurious PLV. Indeed the entire point of the ICA is to disentangle the various neural sources from the composite, volume-conducted signal (see Delorme et al., 2012). Also, entrainment of ongoing low-frequency oscillations in the 100- to 200-ms after stimulus onset (Gruber et al., 2005) is not a compelling explanation for the observed inter-regional synchronization in theta and alpha bands, as our ICs typically did not show coherent ERP components, with the exception of ICs in occipital and parietal cortex, and inter-trial coherence (typically <0.2) was far below that required (typically >0.8) for such entrainment to explain a significant part of the evoked activity (Makeig et al., 2004).
To obtain statistically significant differences between PLVs in the on- and off-task conditions, a method relying on surrogate distributions was utilized (Maris and Oostenveld, 2007; Maris et al., 2007). The PLVs were averaged for all subjects within a cluster for each condition (on-task vs. off-task) and compared to generate a difference between mean PLVs across conditions. All PLVs from both conditions were then combined and randomly shuffled. The shuffled PLVs were separated into two pseudo-conditions and the difference between their means was computed. This process was repeated 1000 times for each IC comparison and the results were rank ordered to produce a distribution of comparison results that would have been found by chance. The mean difference between ICs in the on- and off-task conditions was then ranked with respect to the surrogate distribution and its rank used to measure the statistical likelihood of finding the result by chance. Comparisons were performed within a standard time window of 0–650 ms post stimulus onset. The frequency windows used for comparison were theta (4–8 Hz), alpha (9–14 Hz), and gamma (30–50 Hz). In order to minimize experiment-wise error, each test was conducted at the 0.001 probability level (mean PLV difference required to be greater than or less than all surrogate differences).
Phase locking value differences were only considered to be significant if a second criterion was also met. We used the EEGLAB procedure for determining whether a group of PLVs is generally different from zero to filter the PLV values. In this procedure, individual subjects’ PLVs were masked at p < 0.01 for each of a number of smaller time–frequency windows (the grain of the wavelet analysis, hereafter called “pixels”) within each larger time–frequency window in each condition separately, and the group of masked PLVs was masked at p < 0.001 or less. Masking for individual PLVs in each pixel was done with a permutation (surrogate) method based on 200 shufflings of the epochs for each IC involved, and that for the group was done with a binomial probability calculation. In the latter case, the p-value used for the individual tests was taken as the probability of a “success” in a binomial distribution with P(failure) = 1 − P(success), and the binomial probability of k or more of n individuals with a significant PLV at p < 0.01 was kept at or less than 0.001 (the minimum binomial probability was determined by the number of individual IC pairs available).
We discuss only those significant PLV differences between the on-task and off-task conditions (from the first test) in which a cluster of pixels in the more significant condition also was significantly different from zero within the indicated time–frequency window, meaning that all or most of the subjects had significantly greater than zero PLV for each of those pixels. The one exception was for the default network in Experiment 2, where none of the indicated significant results passed this latter stringent test. There were a number of IC pairs for which PLV was significantly different from zero by the binomial test in both on-task and off-task conditions, including about half of those where the PLVs were significantly different between conditions by the permutation test. This was to be expected because, even when mind wandering and thus off-task, subjects were still performing the SART task at an acceptable albeit slightly reduced level. Moreover, and especially in Experiment 2, there were also a number of pairs for which the off-task PLV was different from zero and the on-task was not but the permutation test was not passed. In order not to over-interpret our data we do not discuss these cases further, although they are predominantly consistent with our conclusions.
Results
Behavioral Data
Subjects reported being off-task on 57.5% and on-task on 42.5% of the experience probes (SE = 3.5%) in Experiment 1, and 35.5% (SE = 10.9%) and 49.4% (SE = 11.7%) respectively in Experiment 2 (15.1% discarded as neither; “4” on the 7-point response scale). Average false alarms were 6.1 (SD = 4.4) and 11.0 (SD = 4.3) in on-task and off-task epochs, respectively, in Experiment 1, and 14.8 (SD = 13.2) and 25.0 (SD = 22.7) respectively in Experiment 2. Because amount of time spent in on-task and off-task states differed across attention state, subjects, and experiments, however, we normalized false alarm errors with respect to these times. First, we assumed that the proportion of total time spent in each state was the same as the proportion of experience probes that indicated that state. Then we divided the proportion of false alarms in each state by the proportion of experience probes indicating that state, yielding a normalized false alarm measure for each attention state. We then aggregated this measure across experiments. As is common in SART (e.g., Christoff et al., 2009), the average normalized measure of off-task false alarms, 1.34, was greater than that for on-task false alarms, 0.84 (t = 2.00, df = 23, p = 0.029, one-tailed). We used a one-tailed test in this case because we only wished to confirm that our SART results were in the typical direction. There were no significant differences in response time. This latter result, too, is typical in this SART paradigm (e.g., Christoff et al., 2009).
Localization of Active Brain Regions
Tables 1 and 2 summarize the results of IC analysis and dipole fitting followed by cluster analysis to identify the neural sources that were common to the majority of subjects. Six cluster dipole centroids in each experiment were found to correspond to brain areas identified in previous fMRI studies as belonging to the default or executive networks (Figure 2). A task-specific source in the occipital lobe was also identified in both experiments. Five cortical regions (Figure 3, left) were identified as similar across experiments within typical EEG localization error based on Talairach coordinates of cluster dipole centroids and Brodmann area: occipital (Talairach −10, −97, −5 and 15, −84, −7 for Experiments 1 and 2 respectively), left (−73, −27, 1 and −73, −22, 2) and right (62, −25, −5 and 71, −12, 3) middle temporal, left anterior cingulate (−21, −16, 45 and −3, 10, 19), and orbito-frontal (0, 45, −26 and 9, 59, −22). We emphasize that, as expected from the ICA (Delorme et al., 2012), all of these ICs displayed single-dipole scalp maps for both their centroids and the individual subjects’ ICs. It is thus reasonable to consider that the dipole locations represent at least regional sources, and ideally single, compact cortical domains (Delorme et al., 2012), in the indicated brain regions.
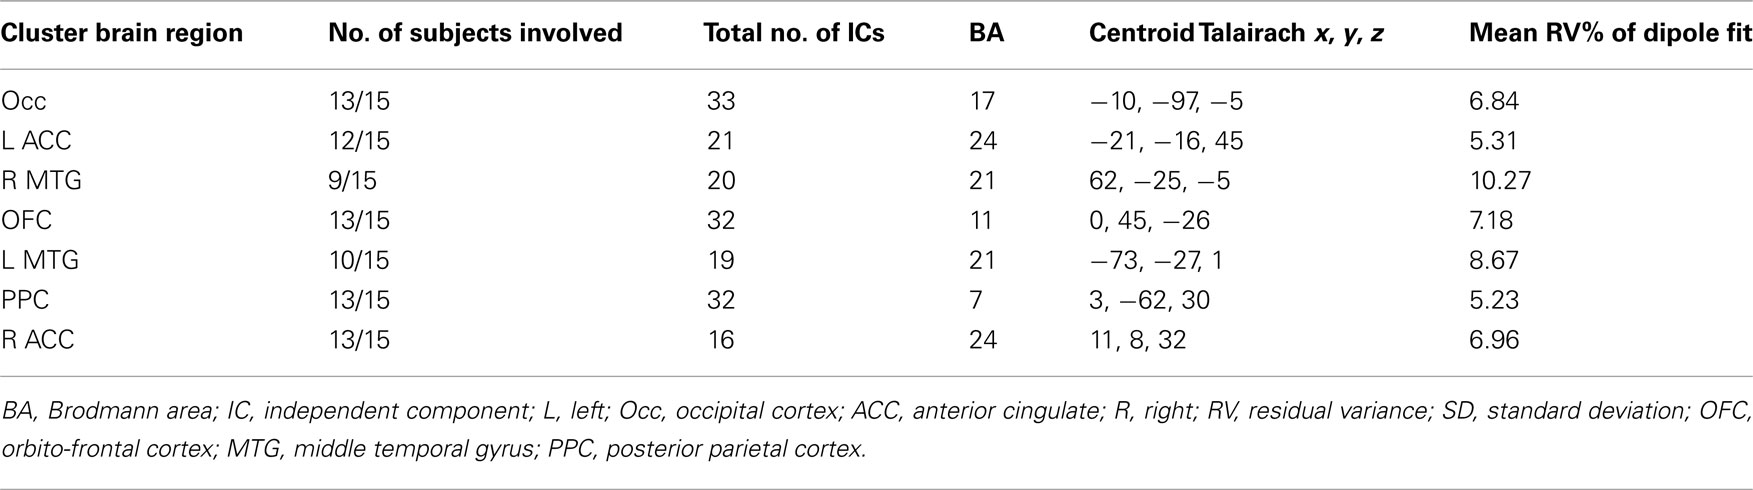
Table 1. Cluster properties Experiment 1.
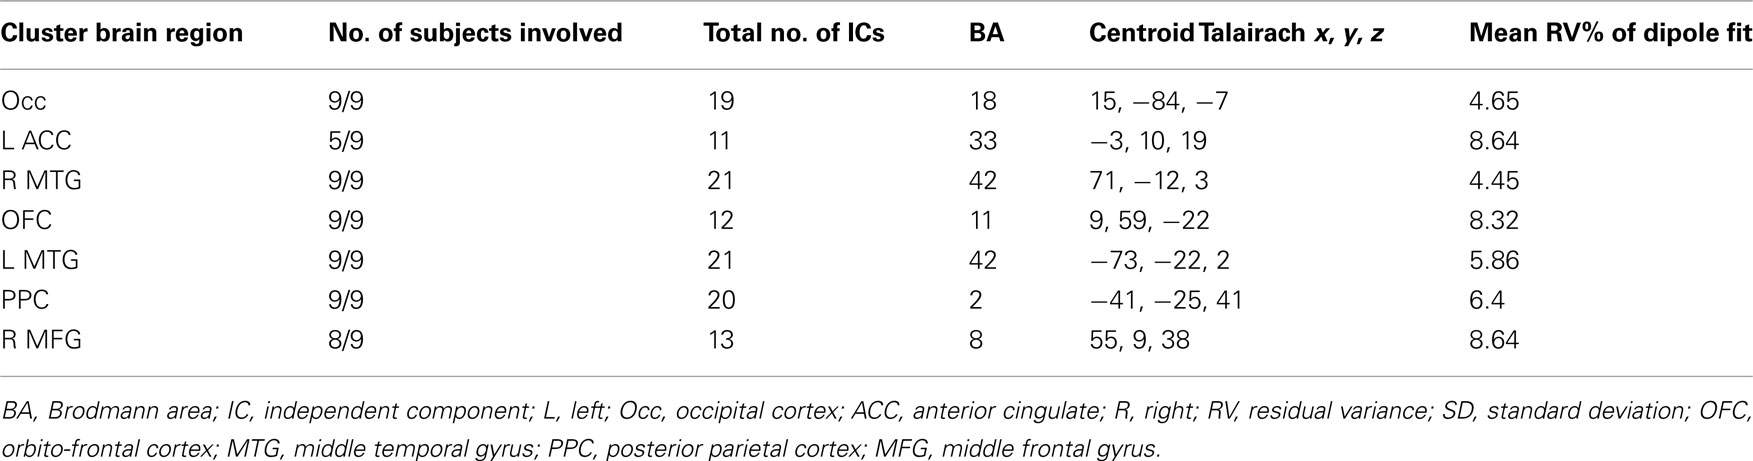
Table 2. Cluster properties Experiment 2.
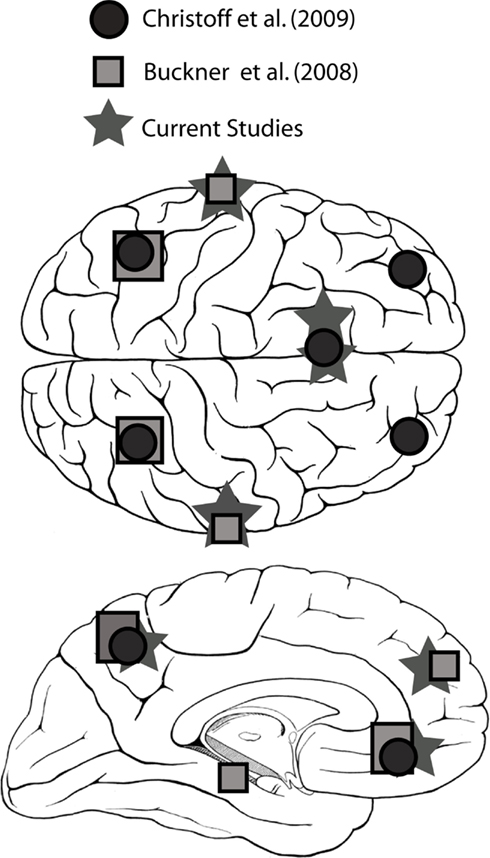
Figure 2. Brain regions identified with the default network in several fMRI studies (Buckner et al., 2007; Christoff et al., 2009) and in the current study.
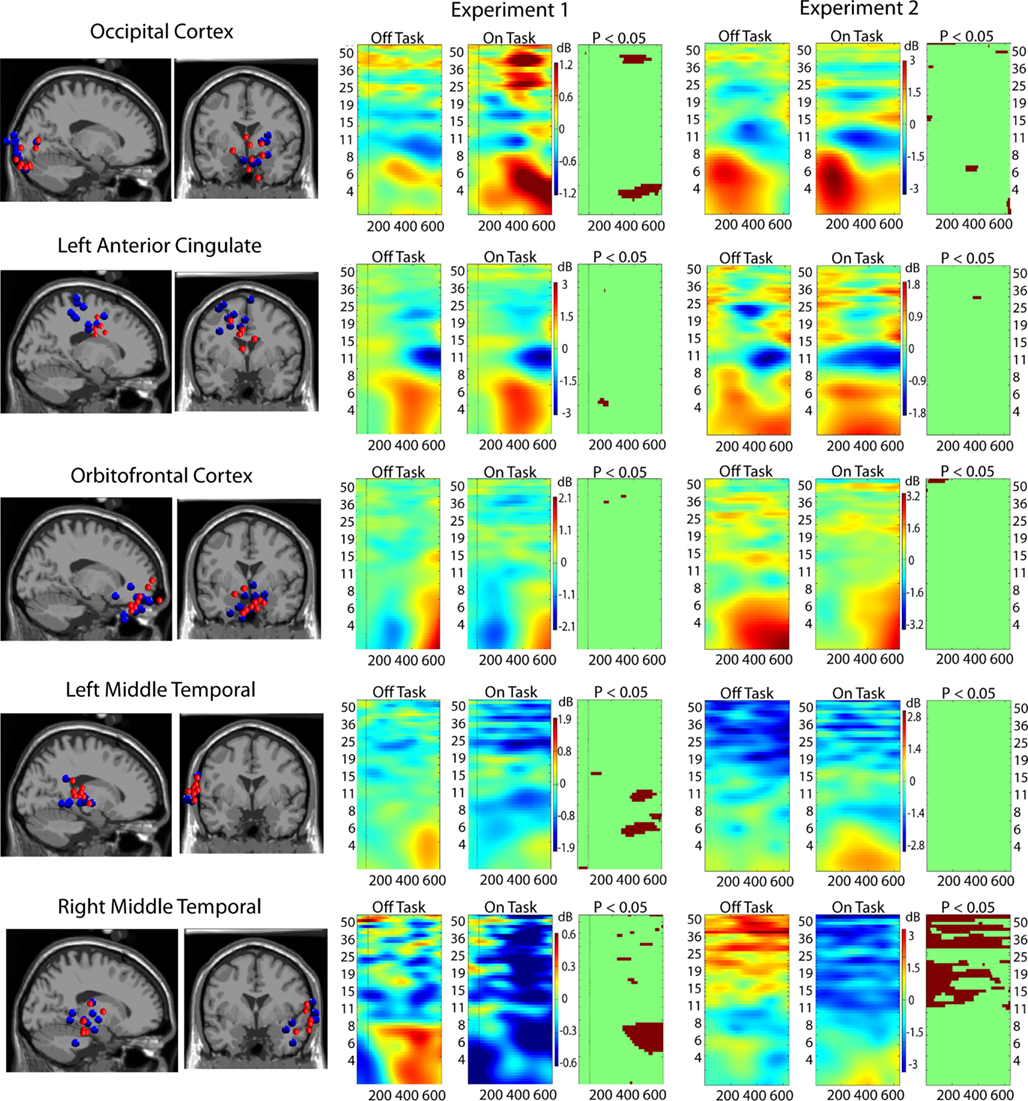
Figure 3. Event-related spectral perturbation (ERSP) results for ICs localized to five critical brain regions. Leftmost columns show the locations in the brain of clusters of ICs from the two experiments: Experiment 1 in red dots and Experiment 2 in blue dots. Rightmost three columns display ERSP results (Off-task and On-task) and the On-task Off-task difference masked at p = 0.05 by permutation test.
Intra-Regional Synchrony in Task-Specific and Default Networks
Figure 3 (middle and right) displays the results of on-task vs. off-task ERSP comparisons. Although there are some differences, the convergence across experiments is remarkable. The occipital cortex displays significantly greater power in the theta band during on-task epochs. Suppression in the alpha-band occurs in both conditions (a sign of active stimulus processing). There is also greater power in the gamma-band during on-task epochs in Experiment 1, and weaker evidence of this in Experiment 2. From these indications, we concluded that this region is a task-specific region. The right middle temporal cortex, however, displays significantly greater power throughout the alpha and gamma bands in off-task epochs without regard to target onset. We therefore concluded that this region is mostly involved in default processing. The other areas either display similar patterns in on- and off-task epochs (orbito-frontal and anterior cingulate) or display a mixed pattern (left middle temporal). We therefore characterized these regions as possibly being involved in both task-specific and default networks.
Inter-Regional Synchrony in Task-Specific and Default Networks
For this analysis, we added two additional regions from each experiment to the five discussed above: Experiment 1: posterior parietal (Talairach 3, −62, 30) and right anterior cingulate (11, 8, 32); Experiment 2: posterior parietal (−41, −25, 41) and right middle frontal gyrus (55, 9, 38). These were not sufficiently close in Talairach space to be considered analogous across the experiments but were important in the phase locking analysis. The right middle frontal gyrus (Experiment 2) showed on-task off-task ERSP differences indicating that it might be more strongly involved in the off-task network, whereas the other three areas displayed ERSP differences more consistent with a task-related function (Figure 4). Results from the analysis of phase locking between all pairs of the seven brain regions for each experiment are shown in Figure 5.
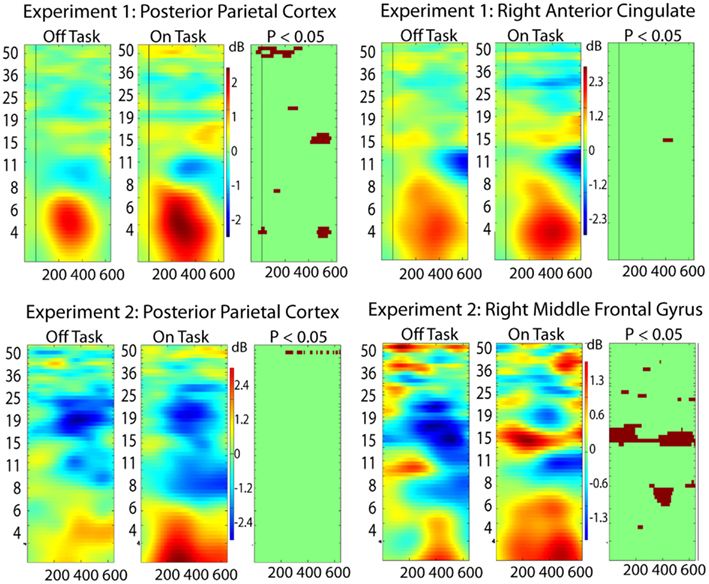
Figure 4. Event-related spectral perturbation (ERSP) results for two additional ICs (see text for Talairach locations of the ICs in the brain) in each experiment. From right to left the columns display ERSP results for Off-task epochs, On-task epochs, and the On-task Off-task difference masked at p = 0.05 by permutation test.
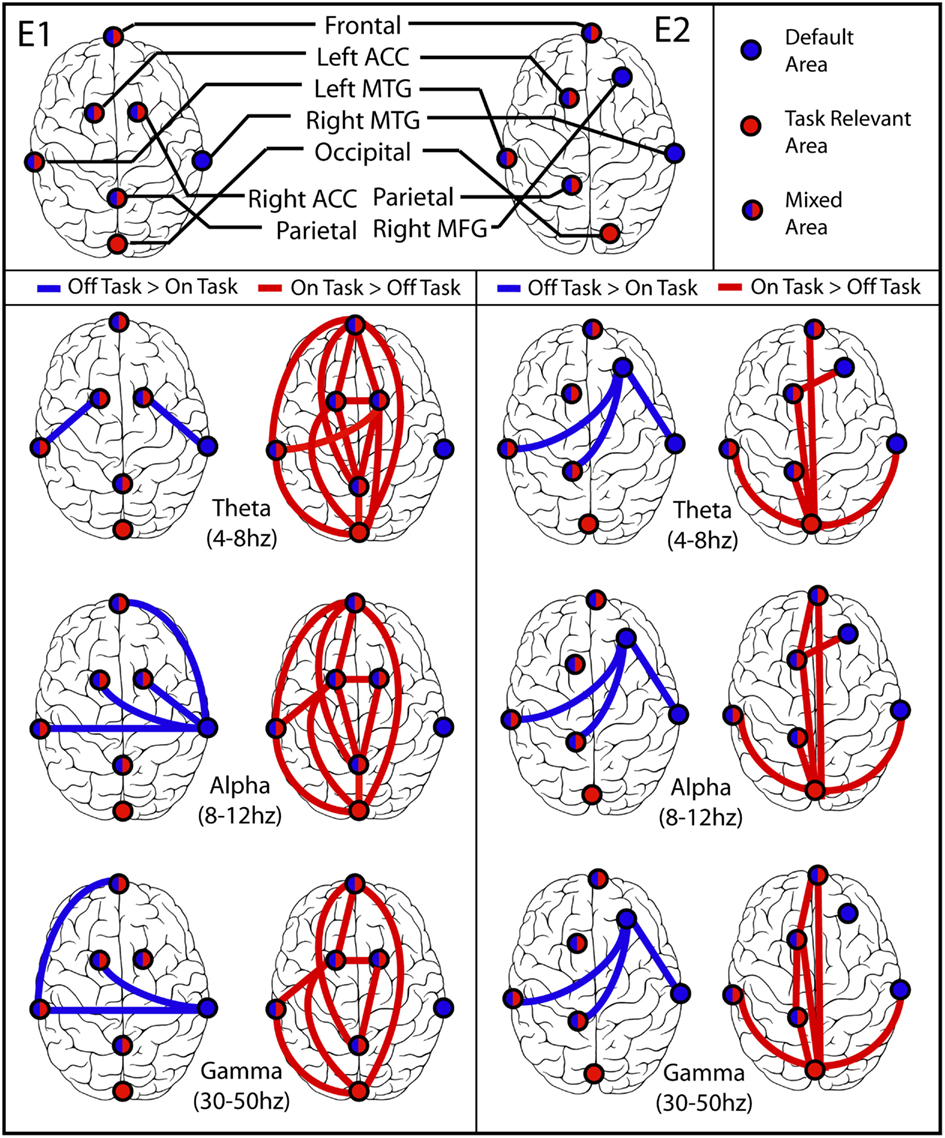
Figure 5. Synchronization between brain regions. (E1) Experiment 1 on left, (E2) Experiment 2 on right. In each part the left column displays blue lines between regions that were more synchronized during off-task epochs (default network), and the right column displays red lines between regions that were more synchronized during on-task epochs. In all but the Experiment 2 off-task > on-task network, lines are displayed only if both the difference between average PLV was significant at p = 0.001 in the indicated direction and the more significant coherence was also significantly different from zero for most or all of the subjects in the cluster by binomial test at p = 0.001. The off-task network in Experiment 2 passed only the first of these criteria.
The pattern of network connectivity in theta, alpha, and gamma frequency bands is clearly different when PLV is greater in off-task than in on-task epochs, presumably involving default network processing in addition to task-specific processing, from that when PLV is greater for on-task epochs, presumably involving primarily task-specific processing. Notably, occipital cortex was significantly more synchronized with other brain regions only during on-task epochs. Moreover, in Experiment 1 occipital cortex was never more synchronized with right middle temporal cortex, a default region, during either type of epoch whereas during off-task epochs right middle temporal cortex was more synchronized with several other regions. In Experiment 2, the right middle frontal gyrus seemed to be a more focal region for the network when PLV was greater in off-task epochs. Again, however, the occipital cortex was not involved in the off-task network and was the focal point of the on-task network. Finally, the overall pattern of greater on-task synchronization had a distinctive fronto-parietal character, whereas the pattern of greater off-task synchronization was distinctly more lateralized.
Discussion
The data reported here support the idea that synchronization within default and task-specific networks in the cerebral cortex differs in ways similar to previous studies. That is, functional connectivity within these dissociable brain-regional networks varies transiently during off-task and on-task epochs. The fact that synchronization differs within these networks as a function of whether both default and task-specific processing (off-task, mind wandering) or mostly task-specific processing (on-task) is occurring, is consistent with the idea that inter-regional synchronization is a mechanism that modulates functional coupling within these networks.
Also important is our finding that blind source separation (ICA) of EEG data can be used to localize brain activity to areas within default and task-specific networks. Overall, several core locations in the default network were identified. Some discrepancy between the results in this study and previous findings is to be expected, however, since, even in fMRI studies, differences in default network locations are found across experiments, probably reflecting differences in task contexts or normalization procedures. Overall, the convergence in spatial locations between fMRI and high-density EEG with ICA provides new evidence for the validity of the methodologies used in this study. It also provides additional evidence for the reality of the default network as a robust subset of brain areas whose study is not contingent on a particular brain imaging method.
The pattern of results obtained converges well with the characterization of the activities of default network regions posited by Buckner et al. (2007). As the default network shares several brain regions with the networks responsible for memory retrieval and simulation of future events, the major function of default network processing may be using past experiences to conduct simulations relevant to anticipating and planning for future events so as to maximize adaptive responses to them. Consistent with this speculation, in our study areas in the left and right middle temporal regions displayed a high level of synchronization at all frequencies during off-task epochs, suggesting that while off-task, subjects were more likely to retrieve and manipulate information from memory at the expense of that from the immediate environment (more false alarms). Perhaps the most striking characterization of the pattern of synchrony in off-task epochs is its left-to-right pattern of functional connections in contrast to the more anterior-to-posterior pattern during on-task epochs (Figure 4). Rather than emphasizing processing information from posterior sensory regions, off-task processing seemed to be characterized in addition by memory systems in lateral temporal structures interacting with frontal regions and with each other.
In contrast, synchronization results also revealed a distinct on-task network that was clearest when subjects indicated that they were paying attention to the task. During the on-task condition for Experiment 1, greater inter-regional synchronization was found in at least one frequency band in all clusters examined, with the notable exception of the right middle temporal cortex. The synchronization results were slightly weaker for Experiment 2, but indicated extensive synchronization throughout an on-task network. Importantly, in both experiments synchronization was robust between occipital, parietal, and frontal regions during on-task periods. This set of areas has been linked repeatedly to the control of goal-oriented attention.
The SART often involves potential response conflicts. Because the number of target stimuli to be responded to is much higher than the single no-response stimulus, responses often become automated. In the unlikely event that a no-response stimulus does appear, a potential conflict occurs between the subject’s habitual behavior (press the button) and the correct response (withhold the button press). This tendency likely explains the greater on-task synchrony between the anterior cingulate and frontal and parietal systems, given that the anterior cingulate has been robustly linked to conflict detection in the brain (Kerns et al., 2004).
In both experiments there was overlap between areas within the default and on-task networks. In Experiment 1, of the seven common IC clusters found, only the occipital and right middle temporal clusters displayed significantly greater inter-regional synchronization in only one condition. In Experiment 2, only occipital cortex displayed such synchronization. The result that occipital cortex was less synchronized with other areas during off-task epochs was to be expected, given that sensory processing is attenuated during default network activity (c.f., Kam et al., 2011). Likewise, memory processes associated with the right temporal lobe were probably unnecessary in the context of the SART. More importantly, however, it seems that a core network of brain regions was at play during both on- and off-task epochs (c.f., Christoff et al., 2009). A tentative explanation for this finding is that a set of basic neural operations sustained activities in both on- and off-task conditions. Whether attention was focused internally or externally, some basic attention-related, executive, and memory processes were likely active. Within this core network, which may underlie both default and task-specific networks and which may include high-capacity network “hubs” such as the ACC and OFC, basic brain processes remain activated, although they might vary considerably from moment to moment (Deco et al., 2011). Depending on this core network’s functional integration with other areas and networks, however, it attains the unique characteristics associated with particular states of mind.
In conclusion, our results contribute to the evolving picture of the cognitive brain as intrinsically organized into somewhat overlapping default and task-specific brain networks, and support the idea that oscillatory synchronization is a potential mechanism for functional coupling within these networks.
Conflict of Interest Statement
The authors declare that the research was conducted in the absence of any commercial or financial relationships that could be construed as a potential conflict of interest.
Acknowledgments
This research was supported by Discovery Grants from the Natural Sciences and Engineering Research Council (NSERC) of Canada to Lawrence M. Ward and to Todd C. Handy, by a NSERC predoctoral fellowship to Julia Wing Yan Kam, and by a UBC AURA grant to Lawrence M. Ward.
References
Alain, C., Arnott, S. R., Hevenor, S., Graham, S., and Grady, C. L. (2001). “What” and “where” in the human auditory system. Proc. Natl. Acad. Sci. U.S.A. 98, 12301–12306.
Bell, A. J., and Sejnowski, T. J. (1995). An information-maximization approach to blind separation and blind deconvolution. Neural Comput. 7, 1129–1159.
Buckner, R. L., Andrews-Hanna, J. R., and Schacter, D. L. (2007). The brain’s default network. Ann. N. Y. Acad. Sci. 1124, 1–38.
Bullmore, E., and Sporns, O. (2009). Complex brain networks: graph theoretical analysis of structural and functional systems. Nat. Rev. Neurosci. 10, 186–198.
Burianova, H., McIntosh, A. R., and Grady, C. L. (2010). A common functional brain network for autobiographical, episodic, and semantic memory retrieval. Neuroimage 49, 865–874.
Christoff, K., Gordon, A. M., Smallwood, J., Smith, R., and Schooler, J. W. (2009). Experience sampling during fMRI reveals default network and executive system contributions to mind wandering. Proc. Natl. Acad. Sci. U.S.A. 106, 1279–1284.
Corbetta, M., Patel, G., and Shulman, G. L. (2008). The reorienting system of the human brain: from environment to theory of mind. Neuron 58, 306–324.
de Pasquale, F., Penna, S. D., Snyder, A. Z., Lewis, C., Mantini, D., Marzetti, L., Belardinelli, P., Ciancetta, L., Pizzella, V., Romani, G. L., and Corbetta, M. (2010). Temporal dynamics of spontaneous MEG activity in brain networks. Proc. Natl. Acad. Sci. U.S.A. 107, 6040–6045.
Deco, G., Jirsa, V., McIntosh, A. R., Sporns, O., and Kotter, R. (2009). Key role of coupling, delay, and noise in resting brain fluctuations. Proc. Natl. Acad. Sci. U.S.A. 106, 10302–10307.
Deco, G., Jirsa, V. K., and McIntosh, A. R. (2011). Emerging concepts for the dynamical organization of resting state activity in the brain. Nat. Rev. Neurosci. 12, 43–56.
Delorme, A., and Makeig, S. (2004). EEGLAB: an open source toolbox for analysis of single-trial EEG dynamics. J. Neurosci. Methods 134, 9–21.
Delorme, A., Palmer, J., Onton, J., Oostenveld, R., and Makeig, S. (2012). Independent EEG sources are dipolar. PLoS ONE 7, e30135. doi:10.1371/journal.pone.0030135
Doesburg, S. M., Green, J. J., McDonald, J. J., and Ward, L. M. (2009). From local inhibition to long-range integration: a functional dissociation of alpha-band synchronization across cortical scales in visuospatial attention. Brain Res. 1303C, 97–110.
Fingelkurts, A. A., and Fingelkurts, A. A. (2011). Persistent operational synchrony within brain default-mode network and self-processing operations in healthy subjects. Brain Cogn. 75, 79–90.
Fox, M. D., Snyder, A. Z., Vincent, J. L., Corbetta, M., Van Essen, D. C., and Raichle, M. E. (2005). The human brain is intrinsically organized into dynamic, anticorrelated functional networks. Proc. Natl. Acad. Sci. U.S.A. 102, 9673–9678.
Greicius, M. D., Krasnow, B., Reiss, A. L., and Menon, V. (2003). Functional connectivity in the resting brain: a network analysis of the default mode hypothesis. Proc. Natl. Acad. Sci. U.S.A. 100, 253–258.
Greicius, M. D., Supekar, K., Menon, V., and Dougherty, R. F. (2009). Resting-state functional connectivity reflects structural connectivity in the default mode network. Cereb. Cortex 19, 72–78.
Gruber, W. R., Klimesch, W., Sauseng, P., and Doppelmayr, M. (2005). Alpha phase synchronization predicts P1 and N1 latency and amplitude size. Cereb. Cortex 15, 371–377.
Habecka, C., Rakitina, B. C., Moellera, J., Scarmeasa, N., Zarahna, E., Browne, T., and Stern, Y. (2005). An event-related fMRI study of the neural networks underlying the encoding, maintenance, and retrieval phase in a delayed-match-to-sample task. Brain Res. Cogn. Brain Res. 23, 207–220.
Honey, C. J., Sporns, O., Cammoun, L., Gigandet, X., Thiran, J. P., Meuli, R., and Hagmann, P. (2009). Predicting human resting-state functional connectivity from structural connectivity. Proc. Natl. Acad. Sci. U.S.A. 106, 2035–2040.
Jensen, O., and Mahazeri, A. (2010). Shaping functional architecture by oscillatory alpha activity: gating by inhibition. Front. Hum. Neurosci. 4:186. doi:10.3389/fnhum.2010.00186
Jerbi, K., Vidal, J. R., Ossandon, T., Dalal, S. S., Jung, J., Hoffmann, D., Minotti, L., Bertrand, O., Kahane, P., and Lachaux, J. P. (2010). Exploring the electrophysiological correlates of the default–mode network with intracerebral EEG. Front. Syst. Neurosci. 4:27. doi:10.3389/fnsys.2010.00027
Kam, J. W. Y., Dao, E., Farley, J., Fitzpatrick, K., Smallwood, J., Schooler, J. W., and Handy, T. C. (2011). Slow fluctuations in attentional control of sensory cortex. J. Cogn. Neurosci. 23, 460–470.
Kelly, S. P., Lalor, E. C., Reilly, R. B., and Foxe, J. J. (2006). Increases in alpha oscillatory power reflect an active retinotopic mechanism for distracter suppression during sustained visuospatial attention. J. Neurophysiol. 95, 3844–3851.
Kerns, J. G., Cohen, J. D., MacDonald, A. W., Cho, R. Y., Stenger, A., and Carter, C. S. (2004). Anterior cingulate conflict monitoring and adjustments in control. Science 303, 1023–1026.
Klimesch, W., Sauseng, P., and Hanslmayr, S. (2007). EEG alpha oscillations: the inhibition timing hypothesis. Brain Res. Rev. 53, 63–88.
MacDonald, J. S. P., Mathan, S., and Yeung, N. (2011). Trial-by-trial variations in subjective attentional state are reflected in ongoing prestimulus EEG alpha oscillations. Front. Percept. Sci. 2:82. doi:10.3389/fpsyg.2011.00082
Maguire, E. A., and Frith, C. D. (2004). The brain network associated with acquiring semantic knowledge. Neuroimage 22, 171–178.
Makeig, S., Debener, S., Onton, J., and Delorme, A. (2004). Mining event-related brain dynamics. Trends Cogn. Sci. (Regul. Ed.) 8, 204–210.
Maris, E., and Oostenveld, R. (2007). Nonparametric statistical testing of EEG- and MEG-data. J. Neurosci. Methods 164, 177–190.
Maris, E., Schoffelen, J. M., and Fries, P. (2007). Nonparametric statistical testing of coherence differences. J. Neurosci. Methods 163, 161–175.
Mishkin, M., Ungerleider, L. G., and Macko, K. (1983). Object vision and spatial vision: two cortical pathways. Trends Neurosci. 6, 414–417.
Passingham, R. E., Stephan, K. E., and Kötter, R. (2002). The anatomical basis of functional localization in the cortex. Nat. Rev. Neurosci. 3, 606–616.
Raichle, M. E., MacLeod, A. M., Snyder, A. Z., Powers, W. J., and Gusnard, D. A. (2001). A default mode of brain function. Proc. Natl. Acad. Sci. U.S.A. 98, 676–682.
Rauschecker, J. P., and Tian, B. (2000). Mechanisms and streams for processing of “what” and “where” in auditory cortex. Proc. Natl. Acad. Sci. U.S.A. 97, 11800–11806.
Robertson, I. H., Manly, T., Andrade, J., Baddeley, B. T., and Yiend, J. (1997). ‘Oops!’: performance correlates of everyday attentional failures in traumatic brain injured and normal subjects. Neuropsychologia 35, 747–758.
Stone, J. V. (2004). Independent Component Analysis: A Tutorial Introduction. Cambridge, MA: MIT Press.
van Essen, D. C., and Maunsell, J. H. R. (1983). Hierarchical organization and functional streams in the visual cortex. Trends Neurosci. 6, 370–375.
Varela, F., Lachaux, J. P., Rodriguez, E., and Martinerie, J. (2001). The brainweb: phase synchronization and large scale integration. Nat. Rev. Neurosci. 2, 229–239.
von Stein, A., Chiang, C., and König, P. (2000). Top-down processing mediated by interareal synchronization. Proc. Natl. Acad. Sci. U.S.A. 97, 14748–14753.
von Stein, A., and Sarnthein, J. (2000). Different frequencies for different scales of cortical integration: from local gamma to long range alpha/theta synchronization. Int. J. Psychophysiol. 3, 301–313.
Keywords: default network, task-specific network, neural synchronization, oscillatory power, theta band, alpha-band, gamma-band, mind wandering
Citation: Kirschner A, Kam JWY, Handy TC and Ward LM (2012) Differential synchronization in default and task-specific networks of the human brain. Front. Hum. Neurosci. 6:139. doi: 10.3389/fnhum.2012.00139
Received: 02 March 2012; Paper pending published: 29 March 2012;
Accepted: 30 April 2012; Published online: 21 May 2012.
Edited by:
Shuhei Yamaguchi, Shimane University, JapanReviewed by:
Hidenao Fukuyama, Kyoto University, JapanDouglas Owen Cheyne, Hospital for Sick Children, Canada
Copyright: © 2012 Kirschner, Kam, Handy and Ward. This is an open-access article distributed under the terms of the Creative Commons Attribution Non Commercial License, which permits non-commercial use, distribution, and reproduction in other forums, provided the original authors and source are credited.
*Correspondence: Lawrence M. Ward, Department of Psychology, University of British Columbia, 2136 West Mall, Vancouver, BC, Canada V6T 1Z4. e-mail: lward@psych.ubc.ca