Discriminative analysis of non-linear brain connectivity in schizophrenia: an fMRI Study
 Longfei Su
 Lubin Wang1
  Hui Shen
 Dewen Hu
- 1College of Mechatronics and Automation, National University of Defense Technology, Changsha, China
- 2Department of Automatic Control, College of Mechatronics and Automation, National University of Defense Technology, Changsha, China
- 3Department of Automation, Institute of Computing Technology, Beijing Jiaotong University, Beijing, China
Background: Dysfunctional integration of distributed brain networks is believed to be the cause of schizophrenia, and resting-state functional connectivity analyses of schizophrenia have attracted considerable attention in recent years. Unfortunately, existing functional connectivity analyses of schizophrenia have been mostly limited to linear associations.
Objective: The objective of the present study is to evaluate the discriminative power of non-linear functional connectivity and identify its changes in schizophrenia.
Method: A novel measure utilizing the extended maximal information coefficient was introduced to construct non-linear functional connectivity. In conjunction with multivariate pattern analysis, the new functional connectivity successfully discriminated schizophrenic patients from healthy controls with relative higher accuracy rate than the linear measure.
Result: We found that the strength of the identified non-linear functional connections involved in the classification increased in patients with schizophrenia, which was opposed to its linear counterpart. Further functional network analysis revealed that the changes of the non-linear and linear connectivity have similar but not completely the same spatial distribution in human brain.
Conclusion: The classification results suggest that the non-linear functional connectivity provided useful discriminative power in diagnosis of schizophrenia, and the inverse but similar spatial distributed changes between the non-linear and linear measure may indicate the underlying compensatory mechanism and the complex neuronal synchronization underlying the symptom of schizophrenia.
Introduction
Schizophrenia, which is characterized by delusions, auditory hallucinations, and impairments in memory, attention, and executive function, is one of the most devastating, cryptic, and costly psychiatric disorders (van Os et al., 2010; Sui et al., 2012). It brings not only great suffering to patients but also significant costs to society. Traditionally, the diagnosis of schizophrenia depends on the observation of psychiatric symptoms and longitudinal courses, while modern diagnoses of such psychiatric disorders require objective neurological measures (Kendler, 2009; Insel et al., 2010; Shen et al., 2010). The underlying etiology and mechanisms of schizophrenia are still unclear, but it is believed that the dysfunctional integration of distributed brain networks leads to this mental disease (Friston and Frith, 1995; Andreasen et al., 1998). Thus, based on fMRI data, functional connectivity research on schizophrenia has attracted considerable attention in recent years (Camchong et al., 2011; Pettersson-Yeo et al., 2011; Bassett et al., 2012; Fornito et al., 2012; Liu et al., 2012; Tu et al., 2012; Vertes et al., 2012; Zalesky et al., 2012). Furthermore, the introduction of multivariate pattern classification to behavioral and cognitive neuroscience increases the potential of functional connectivity in clinical diagnoses of this mental disease (Shen et al., 2010; Fan et al., 2011).
Functional connectivity, defined as statistical associations between remote neurophysiological events, aims to characterize the communication between different brain regions (Friston et al., 1993). Most functional connectivity analyses use temporal correlations or covariance to examine the simultaneous coupling between two time series. Fluctuations in the blood oxygen level dependence (BOLD) signal have attracted attention since the 1990's (Biswal et al., 1995, 1996). In contrast to functional connectivity, which need previous acknowledge about the disease and did not estimate the potential functional connectivity of other ROIs (Lowe et al., 1998, 2000; Xiong et al., 1999; Cordes et al., 2000; Hampson et al., 2002), whole brain functional connectivity analyses of schizophrenia which require less field specific knowledge have attracted considerable attention in recent years (Liang et al., 2006; Liu et al., 2006; Lynall et al., 2010; Alexander-Bloch et al., 2013).
Previous whole brain functional connectivity analyses of schizophrenia which primarily used temporal correlation or covariance as the measure limited to consideration of only the linear associations (Liang et al., 2006; Liu et al., 2006; Lynall et al., 2010; Alexander-Bloch et al., 2013). Because correlation calculations in the full-lag space are computationally expensive (Cecchi et al., 2007), correlation related studies have prevalently used the zeroth lag correlation. The hemodynamic response can significantly reduce the computational expense for its limited duration (Li et al., 2009), but presents another problem, namely, the hemodynamic response function (HRF) varies across subjects and brain regions (Buckner et al., 1998; Miezin et al., 2000; Lee et al., 2001; Saad et al., 2001), and the zeroth lag correlation is sensitive to changes in regional HRFs. Specifically, the simple correlation (zeroth lag) is sensitive to the lag between time series that cannot sufficiently depict the functional interactions of the human brain (Smith et al., 2011). Thus, we believe that the underlying neural activity cannot be accurately reflected by the zeroth lag correlation- or covariance-based methods.
Investigating functional connectivity in schizophrenia from the frequency domain is an alternative of the temporal correlation (Fallani et al., 2010; Salvador et al., 2010). Although the spectral analogs of functional connectivity such as coherence fixed some of the problems (i.e., lag between time series) faced by the simple correlation methods, coherence explores only linear relationships between time series (Sun et al., 2004; Smith et al., 2011). However, the non-linearity of the HRF has been reported by several studies (Buxton et al., 1998; Friston et al., 2003; de Zwart et al., 2009; Daunizeau et al., 2012). As an output of HRF, the BOLD signal also has non-linear properties (Vazquez and Noll, 1998; Xie et al., 2008a,b; Zhang et al., 2008). Notably, non-linear relationships between time series extracted from resting state BOLD signals have also been confirmed (Lahaye et al., 2003).
The first goal of this study is to evaluate the discriminative power of non-linear functional connectivity in schizophrenia which may have potential application in diagnosis of neuropsychiatric disorders. The second goal is to investigate the changes of the non-linear functional connectivity in schizophrenia which may contribute to the pathophysiology of schizophrenia. Aiming at exploring non-linear associations in schizophrenia, we present a novel method that introduces the extended maximal information coefficient (eMIC) to construct functional connectivity of the whole brain.
The eMIC represents the difference between the MIC which is a statistical method for detecting various associations between pairs of variables in large data sets (Reshef et al., 2011) and the square of the Pearson correlation coefficient (PCC). In a previous study, the square of PCC was proved to be equal to the Hilbert-Schmidt Independence Criterion (HSIC) and gave excellent performance in feature selection (Song et al., 2007). By applying the MIC, PCC and eMIC with fMRI data, we investigated the discriminative power of non-linear and linear functional connectivity. Based on the classification result, we further evaluated the changes and spatial distribution of linear and non-linear functional connectivity in schizophrenia.
Materials and Methods
Materials
Participants
The fMRI data used in this study were acquired from 64 participants who were all right-handed native Chinese speakers. Participants consisted of 32 patients suffering from schizophrenia and 32 healthy controls. All the patients were recruited from outpatient departments and inpatient units at the Department of Psychiatry, Second Xiangya Hospital of Central South University in Changsha, China, between March 2006 and October 2007, and satisfied the Diagnostic and Statistical Manual of Mental Disorders, Fourth Edition (DSM-IV; American Psychiatric Association, 1994) criteria. Five patients were medication-free, while the others accepted antipsychotic drugs at the time of image acquisition. The healthy subjects were recruited by advertisements, and matched to the patients on age and gender. None of them had major head trauma, history of alcohol or drug dependence, or history of neurological disorder. Written informed consents were obtained from all the subjects who took part in this study. This study was approved by the Medical Research Ethics Committee of the Second Xiangya Hospital, Central South University. Details about the participants were displayed in Table 1.
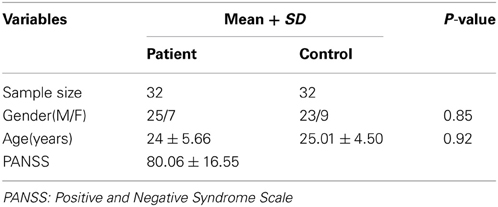
Table 1. Characteristics of participants in this study.
Imaging protocol
In the experiments, subjects were instructed simply to keep their eyes closed, to relax, remain awake and perform no specific cognitive exercise. After each session, subjects were asked whether they were awake in the previous session and all the subjects confirmed. MRI scans were performed with a 1.5T GE Signa System (GE Signa, Milwaukee, Wisconsin, USA). To reduce the head movements, subjects' heads were fixed by using foam pads with a standard birdcage head coil. The functional MRI images were collected by using a gradient-echo echo planar imaging sequence. The imaging parameters were as follows: repetition time/echo time = 2000/40 ms, thickness/gap = 5/1 mm, field of view = 240 × 240 cm, flip angle = 90°, matrix = 64 × 64, and slices = 20. Each functional resting state session lasted ~6 min, and 180 volumes were obtained.
Data preprocessing
Data preprocessing was performed by using statistical parametric mapping software package (SPM2, Wellcome Department of Cognitive Neurology, Institute of Neurology, London, UK, http://www.fil.ion.ucl.ac.uk/spm/). In each subject, the first 5 volumes of the scanned data were discarded for magnetic saturation effects. The remaining 175 volumes were corrected by registering and reslicing for head motion. Next, the volumes were normalized to the standard echo planar imaging template in the Montreal Neurological Institute (MNI) space. The resulting images were spatially smoothed with a Gaussian filter of 8 mm full-width half-maximum kernel, detrended to abandon linear trend and then temporally filtered with a Chebyshev band-pass filter (0.01–0.08 Hz). The registered fMRI volumes with the MNI template were further divided into 116 regions according to the automatic anatomical labeling atlas (Schmahmann et al., 1999; Tzourio-Mazoyer et al., 2002). The atlas divides the cerebrum into 90 regions (45 in each hemisphere) and divides the cerebellum into 26 regions (nine in each cerebellar hemisphere and eight in the vermis). All region of interest masks were generated using the free software WFU_PickAtlas (version 3.0, http://www.ansir.wfubmc.edu) (Maldjian et al., 2003).
Regional mean time series were obtained for each individual by averaging the functional MRI time series over all voxels in each of the 116 regions. Each regional mean time series was further corrected for the effects of head movement by regression on the time series of translations and rotations of the head estimated in the course of initial movement correction by image realignment. The residuals of these regressions constituted the set of regional mean time series used for functional connectivity analysis (Achard et al., 2006).
We evaluated functional connectivity between each pair of regions using the MIC, PCC, and eMIC. Thus, for each subject, we obtained three resting state functional networks captured by three 116 × 116 symmetric matrixes respectively. Removing 116 diagonal elements, we extracted the upper triangle elements of the functional connectivity matrix as classification features, i.e., the feature space for classification was spanned by the (116 × 115)/2 = 6670 dimensional feature vectors.
Methods
MIC and EMIC
In this section, we provide a brief description of the MIC and eMIC for detecting the association between two time series. Two time series can be viewed as a set of ordered data pairs. The MIC between a set of ordered pairs will not change if the rank of pairs is disturbed but the relative ranks of the x- and y-values do not change. If two variables are related to each other, then a grid can be drawn on the scatterplot of the two variables that encapsulates that relationship. Based on this concept, this method investigated all the grids up to the maximal grid resolution, which depends on the sample size (Reshef et al., 2011). The MI is defined as follows:
where H(X) and H(Y) are the marginal entropies, H(Y|X.) and H(Y|X.) are the conditional entropies, and H(X, Y) is the joint entropy of X and Y.
Formally, let Gx × y be all the possible partitions with rows x and y columns (width of rows are different; width of the columns are different, too) of the scatterplot for the ordered pairs of two vectors. As the partitions were not equal, there are many possible partitions with x rows and columns of the scatterplot, let Ig denote the MI for one possible partition with x × y grids that are applied to the ordered samples of the two vectors. For fair comparison between grids of different resolution, the MI values of different partitions with x × y grids of scatterplot for the ordered pairs of two vectors are normalized to the interval [0, 1]. The mx × y is defined as
MIC is the maximal value of mx × y over the ordered pairs (x, y), x ≤ n, y ≤ n, n is the length of the vectors (i.e. number of factors in the vector). In practice, to accelerate computation, it is not necessary to compute mx × y over all (x, y), x = n, y = n. Alternatively, we can compute the mx × y over all (x, y) xy < B. Empirically, B is defined as B = n0.6. We can then define
Additionally, the eMIC can be defined as
Refer to (Song et al., 2007; Reshef et al., 2011) for more details of the MIC and HSIC.
Identification of features with high discriminative power
Due to the noise, registration error, and inter-individual anatomical differences, only a small number of the 6670 features are highly discriminative. To achieve good discriminative performance as well as resistance to noise and individual disparity, the first step of constructing the classification model was selecting those features with high discriminative power to construct the feature space for classification. The discriminative power of a feature can be quantitatively measured by its relevance to classification (Guyon and Elisseeff, 2003). Here, we used the Kendall tau rank correlation coefficient (Kendall and Jean, 1990) which provides a distribution free test of independence between two variables. Let (x1, y1), (x2, y2),…, (xN, yN) be a set of samples of the joint random variables X and Y respectively. Any pair of samples (xi, yi) and (xj, yj) are said to be concordant if the ranks for both elements agree. The Kendall tau coefficient is defined as:
For any sample (xi, yi), i = 1, 2,…, N of the variables need only consider the pairs between itself and the rest N − 1 samples. When i was changed from 1 to N, each pairs was counted twice. Then, number of total simple pairs = 0.5 × N × (N − 1).
Suppose there are m samples in the control group and n samples in the patient group. Let xij denote the functional connectivity feature i of the jth samples and yj denote the class label of this sample (+1 for controls and −1 for patients). The Kendall tau correlation coefficient of the functional connectivity feature i can be defined as
Because the samples in the same groups are neither concordant pairs nor discordant pairs, the relationship between two samples that belong to the same group is not considered, number of total simple pairs = (N − m) × (N − n), N = m + n. The nc and nd are the numbers of concordant and discordant pairs between the two groups, respectively. For a pair of two-observation data sets {xij, yj} and {xik, yk}, it is neither concordant pair nor discordant pair if yi = yk; it is a concordant pair when
where sgn( ) is a signum function. Correspondingly, it is a discordant pair when
Thus, a positive correlation coefficient τi represents that the ith functional connectivity exhibits significant decrease in the patient group compared to the control group, while a negative τi represents that the ith functional connectivity increases in the patient group. The discriminative power was defined as the absolute value of the Kendall tau correlation coefficient. Then we ranked all the features according to their discriminative power and selected those with correlation coefficient over a threshold as the final feature set for classification.
Since a leave-one-out cross-validation strategy was introduced to estimate the generalization ability of the classifiers (see below) and the training data set for feature ranking is slightly different in each iteration of the cross-validation, the first selected features differed slightly from iteration to iteration. Therefore, the contribution of different regions to classification was not evenly distributed, and some regions formed many highly discriminating functional connections with other regions, while some did not. Consensus functional connectivity was introduced here, which was defined as the functional connectivity feature appearing in each cross-validation iteration. Region weight, representing the relative contribution to the identification of schizophrenic patients, was denoted by its occurrence number in the consensus functional connections in this study. The consensus functional connectivity discriminative power was denoted by the mean of its discriminative powers across all iterations of the cross-validation.
Support vector classification and performance evaluation
When the data set of features with high discriminative power was obtained, support vector machines (SVM) with linear kernel function were employed to solve the classification problem (Vapnik, 1995; Bishop, 2006). Due to the classification results were influenced by the number of involved features, classification accuracies with fixed parameter setting of SVM (LIBSVM3.11: Linear kernel, C = 1) using a wide range of feature number were reported. Due to our limited number of samples, we used a leave-one-out cross-validation strategy to estimate the generalization ability of our classifier. The performance of a classifier can be quantified using the generalization rate (GR, i.e., the rate of all the subjects correctly classified), sensitivity (SS, i.e., the rate of the patients correctly classified) and specificity (SC, i.e., the rate of the controls correctly classified) based on the results of cross-validation.
Results
We constructed whole brain functional connectivity using the PCC, MIC, and eMIC based on fMRI data collected from schizophrenic patients and matched healthy controls. Multivariate pattern classification was then introduced to determine the discriminative abilities of the three kinds of functional connectivity. Finally, we analyzed the abnormalities of non-linear and linear functional connections in schizophrenia and determined the spatial distribution of the brain regions related to symptoms of schizophrenia.
Classification
We examined the whole brain resting-sate functional connectivity of the schizophrenic patients and the healthy controls using PCC, MIC, and eMIC, respectively. The 6670 mean functional connections of the controls (Figure 1, the first row) and the patients (Figure 1, the mid row) according to the PCC, MIC, and eMIC. In the third row of Figure 1, the first two panels were presented the relationship between the MIC and PCC, and between the eMIC and PCC, where each red star represented one of the 6670 mean functional connections over the patients, each blue cross represented one of the 6670 mean functional connections over the controls. The last panel in the third row of Figure 1 showed the mean and deviation of the 6670 mean function connections of the patients (red bar) and the controls (blue bar) which were depicted in the first two panels of the third row. Linear SVM was employed to differentiate the patients with schizophrenia from healthy controls using the whole brain functional connectivity extracted by the PCC, MIC, and eMIC.
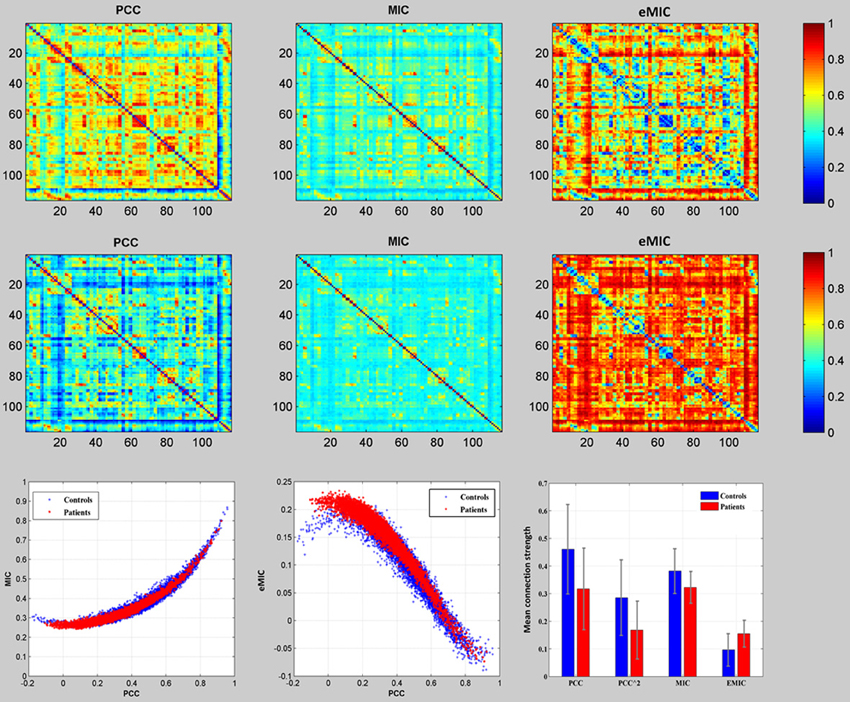
Figure 1. Comparison of mean functional connectivity of the PCC, MIC, and eMIC. The top row showed the mean functional connectivity maps of the healthy controls, the mid row showed the mean functional connectivity maps of the schizophrenic patients, the bottom row (the first two) showed the 6670 mean functional connections of the patients (red star) and that of the healthy controls (blue cross) according to MIC, and eMIC against that of the PCC, and (the last one) the comparison of the mean and the deviation of all the 6670 connections according to PCC, MIC, and eMIC between the patients (red bar) and the controls (blue bar).
To evaluate the discriminative power of the PCC, MIC, and eMIC, we conducted multivariate classification. When the numbers of connections used for classification changed, the classification accuracies changed accordingly. The subjects were classified by using the first connections, and 6670 accuracy rates were obtained. With this approach, the eMIC exhibited excellent performance and the highest classification accuracy rate among the three methods. When the number of features for classification is fixed, the obtained accuracy cannot fully reflect the discriminative power of the whole feature space. Here, we present the classification results using a wide range (50, 100, 150, …, 1000) of the first selected connections (Figure 2). Clearly, the classification accuracies (GR) of the eMIC were consistently higher than the accuracies of the other two methods across the full feature space.
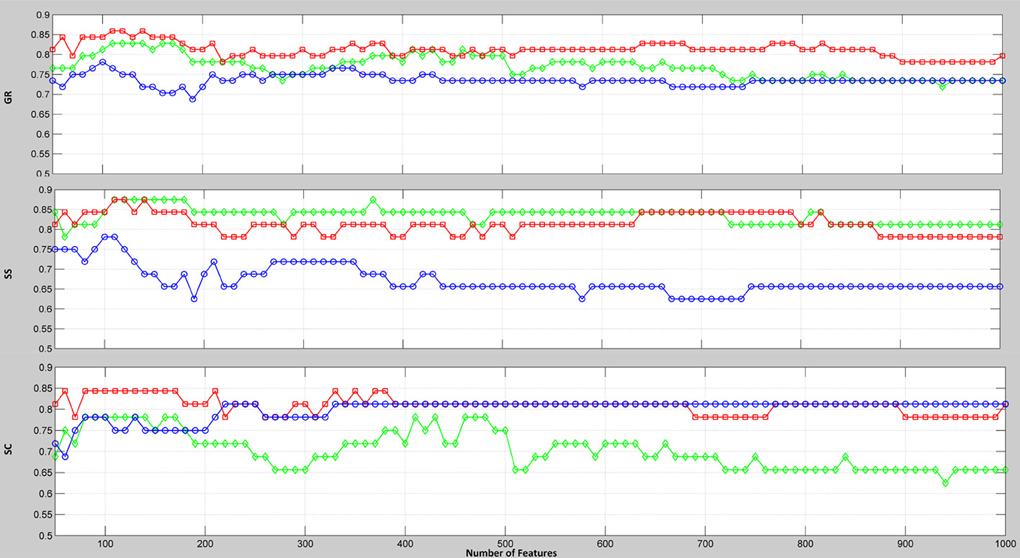
Figure 2. Classification accuracy rates relative to the number of selected connections extracted by the PCC, MIC, and eMIC. The x-axis represents the number of connections involved in classification; the y-axis represents the classification accuracy. GR (the rate of all the subjects correctly classified), SS (the rate of the patients correctly classified), and SC (the rate of the controls correctly classified) are all plotted. Colors represent the types of connection.
Changes of Functional Connectivity
From Figure 2, we can see that when no more than 150 features were involved in the classification, the PCC, MIC, and eMIC gave the best performance. Then, if more features were involved, the classification accuracy of the three methods decreased and the classification accuracy tend to be stable when the number over 200. Therefore, consensus functional connections of the first 200 features involved in the classification corresponding to the PCC, MIC, and eMIC were evaluated. Additionally, the number of features was identified in accordance with previous study (Dosenbach et al., 2010). Then, 113 consensus functional connections were obtained from each iteration of the leave-one-out cross-validation for the MIC and PCC, and 122 consensus functional connections were identified for the eMIC. The consensus functional connections from the PCC, MIC, and eMIC were projected to a surface rendering of a human brain that was visualized with BrainNetViewer (http://www.nitrc.org/projects/bnv/) (see Figure 3). Further, we added a probabilistic atlas of the cerebellum to the ICBM152 cerebrum template that was released with the software.
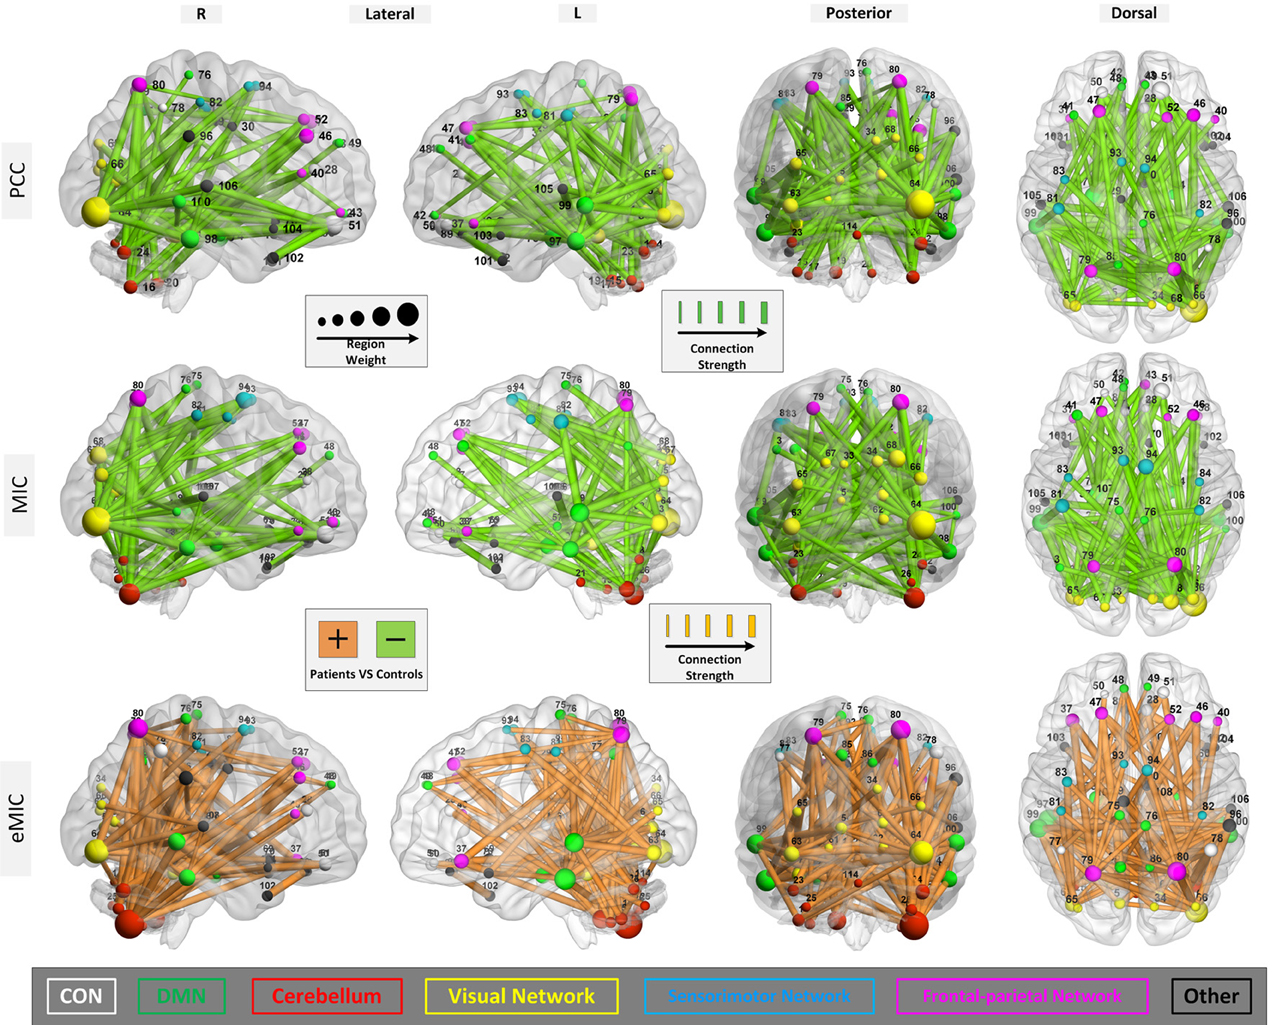
Figure 3. Region weights and strength of the connections constructed with PCC, MIC, and eMIC. The connections are displayed in a surface rendering of a human brain. The thicknesses of the consensus connections during leave-one-out cross-validation are scaled by their strength (normalized mean of the rank orders in all iterations during the leave-one-out cross-validation). Connections whose strength were increased in the patients relative to the controls are shown in orange, and connections whose strength were decreased in patients are shown in light green. The ROIs related to the selected consensus connections are also scaled by their weights (sum of the weights of all connections to and from that ROI) and displayed. The ROIs are color-coded according to the functional networks (CON, white; DMN, green; cerebellum, red; visual network, yellow; sensorimotor network, cyan; frontal-parietal network, rose; and other, black). The number in this figure for ROIs is shown in Table A1.
Primary consideration was given to changes in the strength of the connections. The consensus functional connections according to PCC and MIC were all decreased in patients with schizophrenia compared to healthy controls. It is generally accepted that the strength of functional connectivity is decreased in patients with schizophrenia compared with healthy controls. The PCC- and MIC-based functional connections found in our study are consistent with this common view. In contrast, the strength of the eMIC connections were elevated in patients with schizophrenia. In the Discussion section, we provide a detailed explanation. Additionally, in terms of anatomical location, both the consensus MIC connections and the consensus eMIC connections were largely consistent with the consensus PCC connections. The MIC and the PCC shared 56 common connections, the eMIC and the PCC shared 53 common connections, and the common connections make up approximately half of the total consensus connections. Significant difference of eMIC to PCC is related to the functional connections between the cerebellum and the temporal cortex located in the default model network (DMN) that were found by eMIC but were not detected by PCC. Although there were no PCC functional connections between the cerebellum and the temporal cortex, the cerebellum and the temporal cortex were both connected with the parietal cortex (Figure 4).
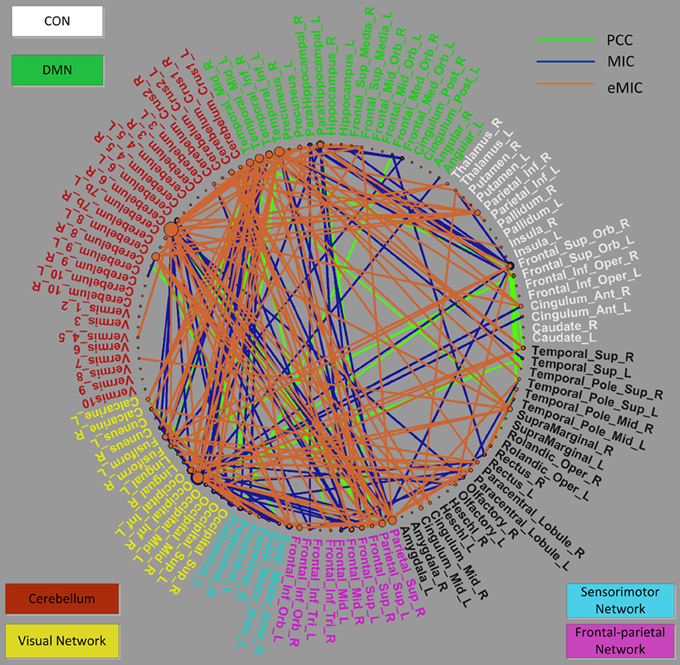
Figure 4. Distribution of selected consensus connections constructed by the PCC, MIC, and eMIC and region weights of related ROIs demonstrated in a circle graph. The names of the ROIs are color-coded as shown in Figure 3. The green lines represent connections constructed by the PCC, blue lines represent connections constructed by the MIC, and orange lines represent connections constructed by the eMIC. This figure was plotted using the MATLAB toolbox called PlotPie which was developed by our study group and will be released in the near future.
Distribution of Functional Connectivity
In addition, we investigated the distribution of brain regions that are related to the consensus connections produced by the PCC, MIC, and eMIC. Overall, the distributions of ROIs identified by the PCC, MIC, and eMIC were similar, although the consensus connections were not completely identical across the three methods (Figures 3, 4).
To facilitate analysis, these ROIs can be categorized as follows: (i) the cingulo-opercular network (CON), including several regions in the anterior prefrontal cortex, the inferior parietal cortex, the basal ganglion, the dorsal anterior cingulate cortex (dACC), the insular, the thalamus, and the cerebellum (which will be discussed later separately due to its importance), which is a newly defined cognitive network with great significance for schizophrenia (Dosenbach et al., 2007; Tu et al., 2012); (ii) the DMN, including structures of the hippocampus, the posterior cingulate cortex, the medial prefrontal cortex (mPFC), and the bilateral inferior parietal cortex, which is believed to play an important role in the pathogenesis of schizophrenia (Raichle et al., 2001; Fransson, 2005; Whitfield-Gabrieli et al., 2009); (iii) the cerebellum network, which can be seen as part of the CON; (iv) the visual network comprising the primary visual cortex, the extra-striate visual areas and the lingual gyrus, fusiform gyrus, and calcarine gyrus, which is involved in visual processing (Beckmann and Smith, 2005; Damoiseaux et al., 2006; van den Heuvel et al., 2008; van den Heuvel and Hulshoff Pol, 2010a,b); (v) the sensorimotor network, including the primary sensory cortex, the primary motor cortex the supplementary motor cortex (Biswal et al., 1995; van den Heuvel and Hulshoff Pol, 2010a,b); and (vi) the frontal-parietal network, consisting of the superior parietal and the superior frontal cortex, which is involved in attention processing (Dosenbach et al., 2010; Beckmann et al., 2005; De Luca et al., 2006) (Figure 4).
For the three kinds of functional connectivity, the ROIs with the heaviest weight were distributed primarily in the DMN, cerebellum, visual network, and frontal-parietal network. Specifically, the cerebellum was the most important network according to eMIC, while the visual cortex was the most weighted network according to PCC and MIC.
Discussion
In this study, we introduced a novel measure called eMIC for estimating the non-linear functional connectivity underlying schizophrenia and applied this estimation of functional connectivity to distinguish schizophrenic patients from healthy controls. Then, we found that strength of the non-linear functional connectivity increased in patients with schizophrenia which was opposed to that observed for the traditional method, which can be attributed to the compensatory mechanisms in the human brain. Furthermore, the non-linear and linear functional connectivity presented similar but not completely the same spatial distribution.
Analysis of Classification
The results of the classifications produced by the PCC, MIC, and eMIC were obtained using the same procedure and the same classifier parameters. The only factor affecting the classification accuracy is the measure of the functional connectivity. Using support vector classification, we compared the discriminative powers of the three kinds of functional connectivity produced by PCC, MIC, and eMIC. The eMIC produced consistently higher classification accuracies than the other two methods across the full connection space (Figure 2). Furthermore, when all 6670 features were used for classification, we obtained the classification results displayed in Table 2. The classification accuracy of the eMIC remained higher than those of the other methods. In short, the functional connectivity produced by the eMIC had the greatest discriminative ability among all three methods.
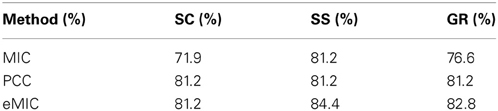
Table 2. Classification results when all 6670 features were involved.
Now, we pay more attention to the reason for the better classification accuracy of eMIC. The MIC maximizes the association between two time series, whereas the PCC captures only linear function. Then, the eMIC may capture the subtle non-linear neuronal synchronization in human brain, which will improve the performance of eMIC. From another point of view, the eMIC combines the discriminative information of both the PCC and MIC, which reflects a feature-level information fusion that increased classification accuracy. An MI-based study reported that the linear functions accounted for most of the associations between the fMRI time series and that non-linear functions only mined 5% more information in fMRI time series (Hlinka et al., 2011); this could be explain why the eMIC gave limited improvement to PCC (Figure 2). Conservatively, this result confirmed that the non-linear associations have discriminative power which should not be overlooked. We believe that these non-linear connections add new discriminative information to the linear connections which may increase the classification accuracy.
Changes of Functional Connectivity in Schizophrenia
Here, we give a detailed analysis of the increased strength of the selected eMIC functional connections. The decreased strength of the PCC functional connections in schizophrenia have been noted in an overwhelming majority of studies (Camchong et al., 2011; Pettersson-Yeo et al., 2011; Repovs et al., 2011; Fornito et al., 2012), which was also confirmed by our previous study (Shen et al., 2010). However, the eMIC-based functional connections demonstrated increased strength in schizophrenic patients compared to healthy controls. As MIC captures various associations but the majority of associations were linear which can be estimated by PCC (Hlinka et al., 2011), decrease of the PCC strength leads to decrease of the MIC strength. The human brain is an organ with great plasticity and adaptability. Thus, the compensatory mechanism of the human brain, that's non-linear correlation will strengthened to reconcile the influence of the corrupt of linear correlation, can result in increases of non-linear functional connectivity. Although the connection selecting procedures of the three methods were implemented separately, the consensus functional connections by the eMIC and the PCC still had a relatively high identity (approximately 50%), which support the notion that the compensatory mechanism of the human brain results in the increase strength of the eMIC in patients with schizophrenia.
If the strength of MIC did not change between the patients and the controls, while the PCC decreased, the increase of the strength of eMIC will be purely caused by the changes of PCC. In fact, the connection strength of MIC decreased in the patients (Figure 1) and gave classification accuracy over 80% (Figure 2). Thus, the increase of eMIC in schizophrenic patients was not simply caused by the decrease of PCC but by the decrease of both PCC and MIC. We believe that the eMIC captures subtle changes of functional connectivity and adds new discriminative information to the classification.
Network Analysis of Non-Linear Functional Connectivity
As the eMIC provided useful discriminative information to the linear functional connectivity, aberrant non-linear and linear functional connections were both categorized into six networks for explaining the symptom of schizophrenia. Therein, connections between the DMN and the cerebellum, the DMN and the visual network, the DMN and the frontal-parietal network, and the cerebellum and the frontal-parietal network demonstrated the greatest discriminative power for both the linear and non-linear functional connectivity.
The DMN, the CON (cerebellum), visual network, and frontal-parietal network which are related to specific brain functions were all weighted by the linear and non-linear measures. The DMN was frequently reported in previous studies and weighted in our study. The three methods all identified the important nodes in the DMN such as the mPFC, inferior parietal cortex, Para hippocampal gyrus, and middle temporal cortex. This network is generally accepted as an important network associated with schizophrenia (Bluhm et al., 2007; Garrity et al., 2007; Whitfield-Gabrieli et al., 2009). The CON is believed to support the “task model” in opposition to the “default model” (Dosenbach et al., 2006). In our study, the cerebellum_6_R which can be seen as part of the CON is important for all the three functional connectivity, particularly for the new non-linear measure. Additionally, the PCC, MIC, and eMIC all gave the visual network heavy weight. The frontal-parietal network was also identified by the all the three measures, which was reported as important brain regions in previous studies (Honey et al., 2005; Lynall et al., 2010).
The DMN, the CON (including cerebellum), visual network, and frontal-parietal network obtained slightly different region weight according to the PCC, MIC, and eMIC, respectively. Functional connections between the DMN and the cerebellum were identified by the eMIC but not by the PCC. If the cerebellum is viewed as part of the CON, interactions between the DMN and the CON can be established by the eMIC. The wide spread changes in the CON and DMN may interact with each other, and contribute to the functional basis of schizophrenia. In the connections produced by the PCC and MIC, the right inferior occipital cortex in the visual network exhibited the greatest region weights. However, the cerebellum_6_R exhibited the greatest region weight for the eMIC. This result implies that the cerebellum may play a role in non-linear interaction between different brain regions. Connections between the visual network and regions of the frontal cortex are believed to be involved in visual perception which may contribute to the aberrance of visual perception in schizophrenia (Harvey et al., 2011; Calderone et al., 2013). The cerebellum and the DMN are linked to the frontal-parietal network by eMIC and MIC but not PCC. Combined with the DMN, this network is thought to be closely related to attention tasks (Bush and Shin, 2006; Gao and Lin, 2012), which may explain the occurrence of attention impairment and its relationship to the DMN in schizophrenia.
In conclusion, from the functional network perspective, the distribution of ROIs with the greatest weight according to the linear and non-linear connections was similar but not completely the same, and the non-linear connections shed new light on interpretation of the schizophrenic symptoms.
Limitations
Although the new functional connectivity constructed by using the eMIC method exhibits better performance in the classification and has explored new information about schizophrenia, there are several limitation in this study. First, our sample size was small. Generalizations of the proposed methods need to be tested with large data sets. Second, the number of slices in the fMRI image used in this study was 20, which was relatively fewer and may not sufficiently to capture the details of the abnormalities in the patients. Third, network analysis of the human brain is a trend in the literature which include ROI localization and connectivity estimation. Our study is confined to connectivity analyses that do not include definition of ROIs.
Conclusions
In this study, we introduced a novel non-linear functional connectivity for schizophrenia study. The classification results show that the non-linear functional connectivity has an equal if not better discriminative ability than existing linear measures in schizophrenia identification. This result suggests that non-linear functional connectivity should be taken into account in research on schizophrenia and other psychiatric disorders. Furthermore, we found that the non-linear functional connectivity which was strengthened in the patients has a similar distribution with its linear counterpart. This new finding indicates the presence of compensatory mechanism between linear and non-linear associations and non-linear functional network abnormalities underlying the symptom of schizophrenia.
Study Funding
This study was supported by the National Basic Research Program of China (2011CB707802) and the National Natural Science Foundation of China (61003202, 61005084).
Conflict of Interest Statement
The authors declare that the research was conducted in the absence of any commercial or financial relationships that could be construed as a potential conflict of interest.
Acknowledgments
This work was supported by the National Basic Research Program of China (2011CB707802) and the National Natural Science Foundation of China (61003202, 61005084).
References
Achard, S., Salvador, R., Whitcher, B., Suckling, J., and Bullmore, E. (2006). A resilient, low-frequency, small-world human brain functional network with highly connected association cortical hubs. J. Neurosci. 26, 63–72. doi: 10.1523/JNEUROSCI.3874-05.2006
Alexander-Bloch, A. F., Vertes, P. E., Stidd, R., Lalonde, F., Clasen, L., Rapoport, J., et al. (2013). The anatomical distance of functional connections predicts brain network topology in health and schizophrenia. Cereb. Cortex 23, 127–138. doi: 10.1093/cercor/bhr388
Andreasen, N. C., Paradiso, S., and O'Leary, D. S. (1998). “Cognitive dysmetria” as an integrative theory of schizophrenia: a dysfunction in cortical-subcortical-cerebellar circuitry? Schizophr. Bull. 24, 203–218. doi: 10.1093/oxfordjournals.schbul.a033321
Bassett, D. S., Nelson, B. G., Mueller, B. A., Camchong, J., and Lim, K. O. (2012). Altered resting state complexity in schizophrenia. Neuroimage 59, 2196–2207. doi: 10.1016/j.neuroimage.2011.10.002
Beckmann, C. F., DeLuca, M., Devlin, J. T., and Smith, S. M. (2005). Investigations into resting-state connectivity using independent component analysis. Philos. Trans. R. Soc. Lond. B Biol. Sci. 360, 1001–1013. doi: 10.1098/rstb.2005.1634
Beckmann, C. F., and Smith, S. M. (2005). Tensorial extensions of independent component analysis for multisubject FMRI analysis. Neuroimage 25, 294–311. doi: 10.1016/j.neuroimage.2004.10.043
Biswal, B., DeYoe, A. E., and Hyde, J. S. (1996). Reduction of physiological fluctuations in fMRI using digital filters. Magn. Reson. Med. 35, 107–113. doi: 10.1002/mrm.1910350114
Biswal, B., Yetkin, F. Z., Haughton, V. M., and Hyde, J. S. (1995). Functional connectivity in the motor cortex of resting human brain using echo-planar MRI. Magn. Reson. Med. 34, 537–541. doi: 10.1002/mrm.1910340409
Bluhm, R. L., Miller, J., Lanius, R. A., Osuch, E. A., Boksman, K., Neufeld, R. W., et al. (2007). Spontaneous low-frequency fluctuations in the BOLD signal in schizophrenic patients: anomalies in the default network. Schizophr. Bull. 33, 1004–1012. doi: 10.1093/schbul/sbm052
Buckner, R. L., Koutstaal, W., Schacter, D. L., Dale, A. M., Rotte, M., and Rosen, B. R. (1998). Functional-anatomic study of episodic retrieval. II. Selective averaging of event-related fMRI trials to test the retrieval success hypothesis. Neuroimage 7, 163–175. doi: 10.1006/nimg.1998.0328
Bush, G., and Shin, L. M. (2006). The Multi-Source Interference Task: an fMRI task that reliably activates the cingulo-frontal-parietal cognitive/attention network. Nat. Protoc. 1, 308–313. doi: 10.1038/nprot.2006.48
Buxton, R. B., Wong, E. C., and Frank, L. R. (1998). Dynamics of blood flow and oxygenation changes during brain activation: the balloon model. Magn. Reson. Med. 39, 855–864. doi: 10.1002/mrm.1910390602
Calderone, D. J., Hoptman, M. J., Martínez, A., Nair-Collins, S., Mauro, C. J., Bar, M., et al. (2013). Contributions of low and high spatial frequency processing to impaired object recognition circuitry in schizophrenia. Cereb. Cortex 23, 1849–1858. doi: 10.1093/cercor/bhs169
Camchong, J., MacDonald, A. W. 3rd., Bell, C., Mueller, B. A., and Lim, K. O. (2011). Altered functional and anatomical connectivity in schizophrenia. Schizophr. Bull. 37, 640–650. doi: 10.1093/schbul/sbp131
Cecchi, G. A., Rao, A. R., Centeno, M. V., Baliki, M., Apkarian, A. V., and Chialvo, D. R. (2007). Identifying directed links in large scale functional networks: application to brain fMRI. BMC Cell Biol. 8(Suppl. 1):S5. doi: 10.1186/1471-2121-8-S1-S5
Cordes, D., Haughton, V. M., Arfanakis, K., Wendt, G. J., Turski, P. A., Moritz, C. H., et al. (2000). Mapping functionally related regions of brain with functional connectivity MR imaging. Am. J. Neuroradiol. 21, 1636–1644.
Damoiseaux, J. S., Rombouts, S. A. R. B., Barkhof, F., Scheltens, P., Stam, C. J., Smith, S. M., et al. (2006). Consistent resting-state networks across healthy subjects. Proc. Natl. Acad. Sci. U.S.A. 103, 13848–13853. doi: 10.1073/pnas.0601417103
Daunizeau, J., Stephan, K. E., and Friston, K. J. (2012). Stochastic dynamic causal modelling of fMRI data: should we care about neural noise? Neuroimage 62, 464–481. doi: 10.1016/j.neuroimage.2012.04.061
De Luca, M., Beckmann, C. F., De Stefano, N., Matthews, P. M., and Smith, S. M. (2006). fMRI resting state networks define distinct modes of long-distance interactions in the human brain. Neuroimage 29, 1359–1367. doi: 10.1016/j.neuroimage.2005.08.035
de Zwart, J. A., van Gelderen, P., Jansma, J. M., Fukunaga, M., Bianciardi, M., and Duyn, J. H. (2009). Hemodynamic nonlinearities affect BOLD fMRI response timing and amplitude. Neuroimage 47, 1649–1658. doi: 10.1016/j.neuroimage.2009.06.001
Dosenbach, N. U., Nardos, B., Cohen, A. L., Fair, D. A., Power, J. D., Church, J. A., et al. (2010). Prediction of individual brain maturity using fMRI. Science 329, 1358–1361. doi: 10.1126/science.1194144
Dosenbach, N. U. F., Fair, D. A., Miezin, F. M., Cohen, A. L., Wenger, K. K., Dosenbach, R. A. T., et al. (2007). Distinct brain networks for adaptive and stable task control in humans. Proc. Natl. Acad. Sci. U.S.A. 104, 11073–11078. doi: 10.1073/pnas.0704320104
Dosenbach, N. U. F., Visscher, K. M., Palmer, E. D., Miezin, F. M., Wenger, K. K., Kang, H. S. C., et al. (2006). A core system for the implementation of task sets. Neuron 50, 799–812. doi: 10.1016/j.neuron.2006.04.031
Fallani, F. D. V., Maglione, A., Babiloni, F., Mattia, D., Astolfi, L., Vecchiato, G., et al. (2010). Cortical network analysis in patients affected by schizophrenia. Brain Topogr. 23, 214–220. doi: 10.1007/s10548-010-0133-2
Fan, Y., Liu, Y., Wu, H., Hao, Y., Liu, H., Liu, Z., et al. (2011). Discriminant analysis of functional connectivity patterns on Grassmann manifold. Neuroimage 56, 2058–2067. doi: 10.1016/j.neuroimage.2011.03.051
Fornito, A., Zalesky, A., Pantelis, C., and Bullmore, E. T. (2012). Schizophrenia, neuroimaging and connectomics. Neuroimage 62, 2296–2314. doi: 10.1016/j.neuroimage.2011.12.090
Fransson, P. (2005). Spontaneous low-frequency BOLD signal fluctuations: an fMRI investigation of the resting-state default mode of brain function hypothesis. Hum. Brain Mapp. 26, 15–29. doi: 10.1002/hbm.20113
Friston, K. J., and Frith, C. D. (1995). Schizophrenia: a disconnection syndrome? Clin. Neurosci. 3, 89–97.
Friston, K. J., Frith, C. D., Liddle, P. F., and Frackowiak, R. S. (1993). Functional connectivity: the principal-component analysis of large (PET) data sets. J. Cereb. Blood Flow Metab. 13, 5–14. doi: 10.1038/jcbfm.1993.4
Friston, K. J., Harrison, L., and Penny, W. (2003). Dynamic causal modelling. Neuroimage 19, 1273–1302. doi: 10.1016/S1053-8119(03)00202-7
Gao, W., and Lin, W. (2012). Frontal parietal control network regulates the anti-correlated default and dorsal attention networks. Hum. Brain Mapp. 33, 192–202. doi: 10.1002/hbm.21204
Garrity, A. G., Pearlson, G. D., McKiernan, K., Lloyd, D., Kiehl, K. A., and Calhoun, V. D. (2007). Aberrant “default mode” functional connectivity in schizophrenia. Am. J. Psychiatry 164, 450–457. doi: 10.1176/appi.ajp.164.3.450
Guyon, I., and Elisseeff, A. (2003). An introduction to variable and feature selection. J. Mach. Learn. Res. 3, 1157–1182.
Hampson, M., Peterson, B. S., Skudlarski, P., Gatenby, J. C., and Gore, J. C. (2002). Detection of functional connectivity using temporal correlations in MR images. Hum. Brain Mapp. 15, 247–262. doi: 10.1002/hbm.10022
Harvey, P.-O., Lee, J., Cohen, M. S., Engel, S. A., Glahn, D. C., Nuechterlein, K. H., et al. (2011). Altered dynamic coupling of lateral occipital complex during visual perception in schizophrenia. Neuroimage 55, 1219–1226. doi: 10.1016/j.neuroimage.2010.12.045
Hlinka, J., Palus, M., Vejmelka, M., Mantini, D., and Corbetta, M. (2011). Functional connectivity in resting-state fMRI: is linear correlation sufficient? Neuroimage 54, 2218–2225. doi: 10.1016/j.neuroimage.2010.08.042
Honey, G. D., Pomarol-Clotet, E., Corlett, P. R., Honey, R. A., McKenna, P. J., Bullmore, E. T., et al. (2005). Functional dysconnectivity in schizophrenia associated with attentional modulation of motor function. Brain 128(Pt 11), 2597–2611. doi: 10.1093/brain/awh632
Insel, T., Cuthbert, B., Garvey, M., Heinssen, R., Pine, D. S., Quinn, K., et al. (2010). Research domain criteria (RDoC): toward a new classification framework for research on mental disorders. Am. J. Psychiatry 167, 748–751. doi: 10.1176/appi.ajp.2010.09091379
Kendall, M. G., and Jean, D. G. (1990). Rank Correlation Methods. NewYork, NY: Oxford University Press. doi: 10.2307/2333282
Kendler, K. S. (2009). An historical framework for psychiatric nosology. Psychol. Med. 39, 1935–1941. doi: 10.1017/S0033291709005753
Lahaye, P. J., Poline, J. B., Flandin, G., Dodel, S., and Garnero, L. (2003). Functional connectivity: studying nonlinear, delayed interactions between BOLD signals. Neuroimage 20, 962–974. doi: 10.1016/S1053-8119(03)00340-9
Lee, S. P., Duong, T. Q., Yang, G., Iadecola, C., and Kim, S. G. (2001). Relative changes of cerebral arterial and venous blood volumes during increased cerebral blood flow: implications for BOLD fMRI. Magn. Reson. Med. 45, 791–800. doi: 10.1002/mrm.1107
Li, K., Guo, L., Nie, J., Li, G., and Liu, T. (2009). Review of methods for functional brain connectivity detection using fMRI. Comput. Med. Imaging Graph. 33, 131–139. doi: 10.1016/j.compmedimag.2008.10.011
Liang, M., Zhou, Y., Jiang, T., Liu, Z., Tian, L., Liu, H., et al. (2006). Widespread functional disconnectivity in schizophrenia with resting-state functional magnetic resonance imaging. Neuroreport 17, 209–213. doi: 10.1097/01.wnr.0000198434.06518.b8
Liu, H., Liu, Z., Liang, M., Hao, Y., Tan, L., Kuang, F., et al. (2006). Decreased regional homogeneity in schizophrenia: a resting state functional magnetic resonance imaging study. Neuroreport 17, 19–22. doi: 10.1097/01.wnr.0000195666.22714.35
Liu, H. H., Kaneko, Y., Ouyang, X., Li, L., Hao, Y. H., Chen, E. Y. H., et al. (2012). Schizophrenic patients and their unaffected siblings share increased resting-state connectivity in the task-negative network but not its anticorrelated task-positive network. Schizophr. Bull. 38, 285–294. doi: 10.1093/schbul/sbq074
Lowe, M. J., Dzemidzic, M., Lurito, J. T., Mathews, V. P., and Phillips, M. D. (2000). Correlations in low-frequency BOLD fluctuations reflect cortico-cortical connections. Neuroimage 12, 582–587. doi: 10.1006/nimg.2000.0654
Lowe, M. J., Mock, B. J., and Sorenson, J. A. (1998). Functional connectivity in single and multislice echoplanar imaging using resting-state fluctuations. Neuroimage 7, 119–132. doi: 10.1006/nimg.1997.0315
Lynall, M. E., Bassett, D. S., Kerwin, R., McKenna, P. J., Kitzbichler, M., Muller, U., et al. (2010). Functional connectivity and brain networks in schizophrenia. J. Neurosci. 30, 9477–9487. doi: 10.1523/JNEUROSCI.0333-10.2010
Maldjian, J. A., Laurienti, P. J., Kraft, R. A., and Burdette, J. H. (2003). An automated method for neuroanatomic and cytoarchitectonic atlas-based interrogation of fMRI data sets. Neuroimage 19, 1233–1239. doi: 10.1016/S1053-8119(03)00169-1
Miezin, F. M., Maccotta, L., Ollinger, J. M., Petersen, S. E., and Buckner, R. L. (2000). Characterizing the hemodynamic response: effects of presentation rate, sampling procedure, and the possibility of ordering brain activity based on relative timing. Neuroimage 11(6 Pt 1), 735–759. doi: 10.1006/nimg.2000.0568
Pettersson-Yeo, W., Allen, P., Benetti, S., McGuire, P., and Mechelli, A. (2011). Dysconnectivity in schizophrenia: where are we now? Neurosci. Biobehav. Rev. 35, 1110–1124. doi: 10.1016/j.neubiorev.2010.11.004
Raichle, M. E., MacLeod, A. M., Snyder, A. Z., Powers, W. J., Gusnard, D. A., and Shulman, G. L. (2001). A default mode of brain function. Proc. Natl. Acad. Sci. U.S.A. 98, 676–682. doi: 10.1073/pnas.98.2.676
Repovs, G., Csernansky, J. G., and Barch, D. M. (2011). Brain Network Connectivity in Individuals with Schizophrenia and Their Siblings. Biol. Psychiatry 69, 967–973. doi: 10.1016/j.biopsych.2010.11.009
Reshef, D. N., Reshef, Y. A., Finucane, H. K., Grossman, S. R., McVean, G., Turnbaugh, P. J., et al. (2011). Detecting novel associations in large data sets. Science 334, 1518–1524. doi: 10.1126/science.1205438
Saad, Z. S., Ropella, K. M., Cox, R. W., and DeYoe, E. A. (2001). Analysis and use of FMRI response delays. Hum. Brain Mapp. 13, 74–93. doi: 10.1002/hbm.1026
Salvador, R., Sarro, S., Gomar, J. J., Ortiz-Gil, J., Vila, F., Capdevila, A., et al. (2010). Overall brain connectivity maps show cortico—subcortical abnormalities in schizophrenia. Hum. Brain Mapp. 31, 2003–2014. doi: 10.1002/hbm.20993
Schmahmann, J. D., Doyon, J., McDonald, D., Holmes, C., Lavoie, K., Hurwitz, A. S., et al. (1999). Three-dimensional MRI atlas of the human cerebellum in proportional stereotaxic space. Neuroimage 10(3 Pt 1), 233–260. doi: 10.1006/nimg.1999.0459
Shen, H., Wang, L., Liu, Y., and Hu, D. (2010). Discriminative analysis of resting-state functional connectivity patterns of schizophrenia using low dimensional embedding of fMRI. Neuroimage 49, 3110–3121. doi: 10.1016/j.neuroimage.2009.11.011
Smith, S. M., Miller, K. L., Salimi-Khorshidi, G., Webster, M., Beckmann, C. F., Nichols, T. E., et al. (2011). Network modelling methods for FMRI. Neuroimage 54, 875–891. doi: 10.1016/j.neuroimage.2010.08.063
Song, L., Smola, A., Gretton, A., and Borgwardt, K. (2007). “Supervised Feature selection via dependence estimation,” in Machine Learning, ed Z. Ghahramani (NewYork, NY: Omnipress), 823–830. doi: 10.1145/1273496.1273600
Sui, J., Yu, Q., He, H., Pearlson, G. D., and Calhoun, V. D. (2012). A selective review of multimodal fusion methods in schizophrenia. Front. Hum. Neurosci. 6:27. doi: 10.3389/fnhum.2012.00027
Sun, F. T., Miller, L. M., and D'Esposito, M. (2004). Measuring interregional functional connectivity using coherence and partial coherence analyses of fMRI data. Neuroimage 21, 647–658. doi: 10.1016/j.neuroimage.2003.09.056
Tu, P.-C., Hsieh, J.-C., Li, C.-T., Bai, Y.-M., and Su, T.-P. (2012). Cortico-striatal disconnection within the cingulo-opercular network in schizophrenia revealed by intrinsic functional connectivity analysis: a resting fMRI study Neuroimage 59, 238–247. doi: 10.1016/j.neuroimage.2011.07.086
Tzourio-Mazoyer, N., Landeau, B., Papathanassiou, D., Crivello, F., Etard, O., Delcroix, N., et al. (2002). Automated anatomical labeling of activations in SPM using a macroscopic anatomical parcellation of the MNI MRI single-subject brain. Neuroimage 15, 273–289. doi: 10.1006/nimg.2001.0978
van den Heuvel, M. P., and Hulshoff Pol, H. E. (2010a). Exploring the brain network: a review on resting-state fMRI functional connectivity. Eur. Neuropsychopharmacol. 20, 519–534. doi: 10.1016/j.euroneuro.2010.03.008
van den Heuvel, M. P., and Hulshoff Pol, H. E. (2010b). Specific somatotopic organization of functional connections of the primary motor network during resting state. Hum. Brain Mapp. 31, 631–644. doi: 10.1016/j.euroneuro.2010.03.008
van den Heuvel, M., Mandl, R., and Hulshoff Pol, H. (2008). Normalized cut group clustering of resting-state FMRI data. PLoS ONE 3:e2001. doi: 10.1371/journal.pone.0002001
van Os, J., Kenis, G., and Rutten, B. P. (2010). The environment and schizophrenia. Nature 468, 203–212. doi: 10.1038/nature09563
Vapnik, V. (1995). The Nature of Statistical Learning Theory. NewYork, NY: Springer. doi: 10.10007/978-1-4757-2440-0
Vazquez, A. L., and Noll, D. C. (1998). Nonlinear aspects of the BOLD response in functional MRI. Neuroimage 7, 108–118. doi: 10.1006/nimg.1997.0316
Vertes, P. E., Alexander-Bloch, A. F., Gogtay, N., Giedd, J. N., Rapoport, J. L., and Bullmore, E. T. (2012). Simple models of human brain functional networks. Proc. Natl. Acad. Sci. U.S.A. 109, 5868–5873. doi: 10.1073/pnas.1111738109
Whitfield-Gabrieli, S., Thermenos, H. W., Milanovic, S., Tsuang, M. T., Faraone, S. V., McCarley, R. W., et al. (2009). Hyperactivity and hyperconnectivity of the default network in schizophrenia and in first-degree relatives of persons with schizophrenia. Proc. Natl. Acad. Sci. U.S.A. 106, 1279–1284. doi: 10.1073/pnas.0809141106
Xie, X., Cao, Z., and Weng, X. (2008a). Spatiotemporal nonlinearity in resting-state fMRI of the human brain. Neuroimage 40, 1672–1685. doi: 10.1016/j.neuroimage.2008.01.007
Xie, X., Cao, Z., and Weng, X. (2008b). Detecting spatiotemporal nonlinear dynamics in resting state of human brain based on fMRI datasets. Neuroimage 205, 19–25. doi: 10.1016/j.neuroimage.2008.01.007
Xiong, J., Parsons, L. M., Gao, J. H., and Fox, P. T. (1999). Interregional connectivity to primary motor cortex revealed using MRI resting state images. Hum. Brain Mapp. 8, 151–156. doi: 10.1002/(SICI)1097-0193(1999)8:2/3<151::AID-HBM13>3.0.CO;2-5
Zalesky, A., Fornito, A., Egan, G. F., Pantelis, C., and Bullmore, E. T. (2012). The relationship between regional and inter-regional functional connectivity deficits in schizophrenia. Hum. Brain Mapp. 33, 2535–2549. doi: 10.1002/hbm.21379
Zhang, N., Zhu, X. H., and Chen, W. (2008). Investigating the source of BOLD nonlinearity in human visual cortex in response to paired visual stimuli. Neuroimage 43, 204–212. doi: 10.1016/j.neuroimage.2008.06.033
Appendix
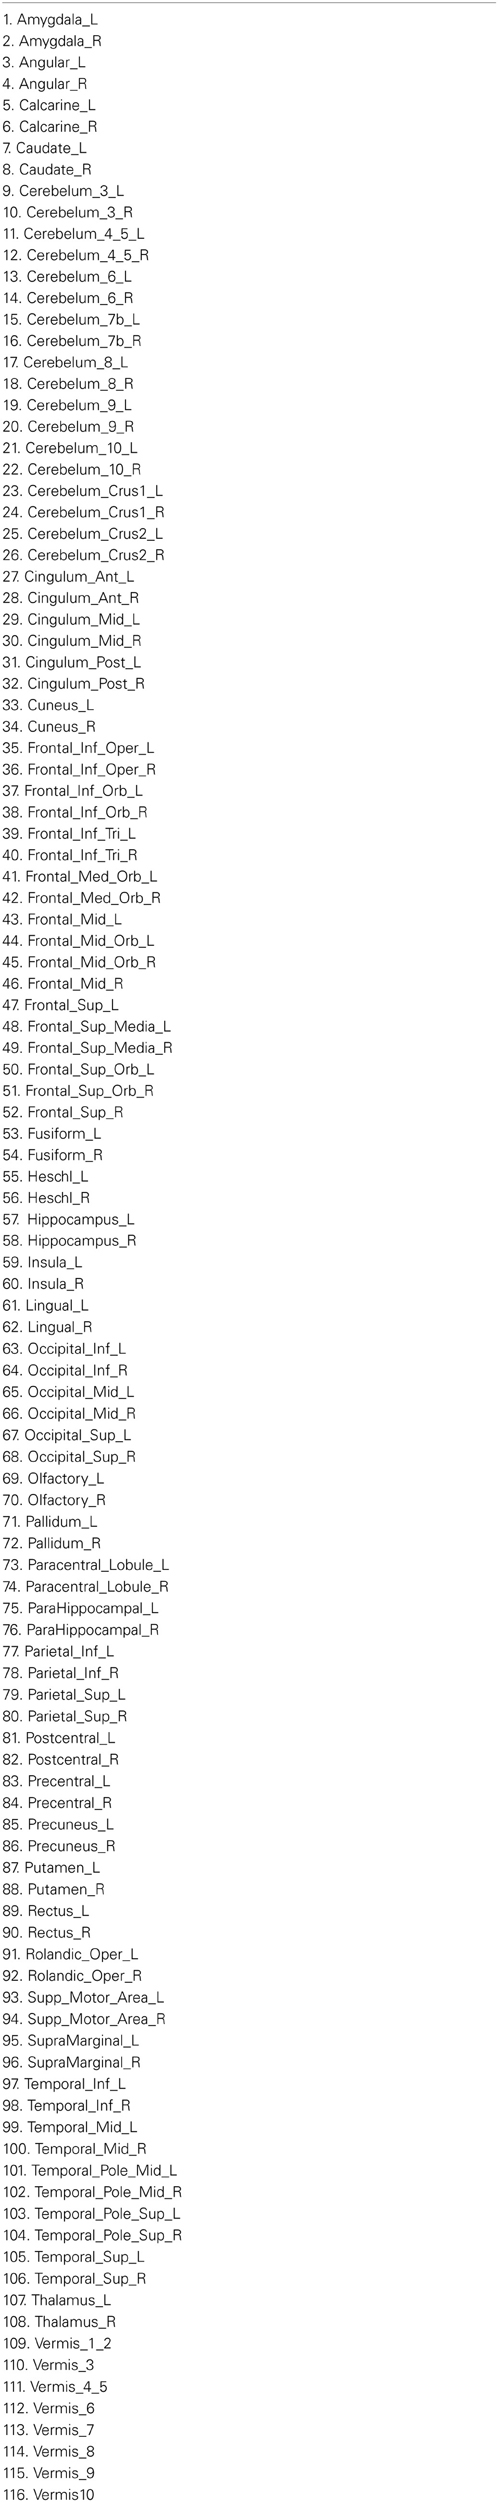
Table A1. Names of the ROIs used in this study.
Keywords: schizophrenia, resting-state functional connectivity, non-linear, extended maximal information coefficient, compensatory
Citation: Su L, Wang L, Shen H, Feng G and Hu D (2013) Discriminative analysis of non-linear brain connectivity in schizophrenia: an fMRI Study. Front. Hum. Neurosci. 7:702. doi: 10.3389/fnhum.2013.00702
Received: 03 September 2013; Paper pending published: 16 September 2013;
Accepted: 04 October 2013; Published online: 22 October 2013.
Edited by:
Shuhei Yamaguchi, Shimane University, JapanCopyright © 2013 Su, Wang, Shen, Feng and Hu. This is an open-access article distributed under the terms of the Creative Commons Attribution License (CC BY). The use, distribution or reproduction in other forums is permitted, provided the original author(s) or licensor are credited and that the original publication in this journal is cited, in accordance with accepted academic practice. No use, distribution or reproduction is permitted which does not comply with these terms.
*Correspondence: Dewen Hu, College of Mechatronics and Automation. National University of Defense Technology No. 109, Deya Road, Kaifu District, Changsha City, Hunan Province, China e-mail: dwhu@nudt.edu.cn