Disentangling the attention network test: behavioral, event related potentials, and neural source analyses
 Alejandro Galvao-Carmona1*
  Javier J. González-Rosa2
  Antonio R. Hidalgo-Muñoz1
  Dolores Páramo3
  María L. Benítez4 Guillermo Izquierdo3 Manuel Vázquez-Marrufo1
- 1Psychophysiology Unit (Lab B508), Department of Experimental Psychology, Faculty of Psychology, University of Seville, Seville, Spain
- 2Laboratory for Clinical Neuroscience, Centre of Biomedical Technology (CTB), Technical University of Madrid (UPM), Madrid, Spain
- 3Multiple Sclerosis Unit, Virgen Macarena University Hospital, Seville, Spain
- 4Department of Physiotherapy, Faculty of Nursing, University of Seville, Seville, Spain
Background: The study of the attentional system remains a challenge for current neuroscience. The “Attention Network Test” (ANT) was designed to study simultaneously three different attentional networks (alerting, orienting, and executive) based in subtraction of different experimental conditions. However, some studies recommend caution with these calculations due to the interactions between the attentional networks. In particular, it is highly relevant that several interpretations about attentional impairment have arisen from these calculations in diverse pathologies. Event related potentials (ERPs) and neural source analysis can be applied to disentangle the relationships between these attentional networks not specifically shown by behavioral measures.
Results: This study shows that there is a basic level of alerting (tonic alerting) in the no cue (NC) condition, represented by a slow negative trend in the ERP trace prior to the onset of the target stimuli. A progressive increase in the CNV amplitude related to the amount of information provided by the cue conditions is also shown. Neural source analysis reveals specific modulations of the CNV related to a task-related expectancy presented in the NC condition; a late modulation triggered by the central cue (CC) condition and probably representing a generic motor preparation; and an early and late modulation for spatial cue (SC) condition suggesting specific motor and sensory preactivation. Finally, the first component in the information processing of the target stimuli modulated by the interaction between orienting network and the executive system can be represented by N1.
Conclusions: The ANT is useful as a paradigm to study specific attentional mechanisms and their interactions. However, calculation of network effects is based in subtractions with non-comparable experimental conditions, as evidenced by the present data, which can induce misinterpretations in the study of the attentional capacity in human subjects.
Introduction
The attentional system is one of the most studied in cognitive neuroscience. Several models have been established, the most accepted being that of Posner and Petersen (1990; recently updated, Petersen and Posner, 2012). To study simultaneously diverse attentional networks, Fan et al. (2002) developed a task (termed attention network test; ANT) based in the combination of the cuing paradigm developed by Posner (1978), and the flanker task proposed by Eriksen and Eriksen (1974).
The attentional networks that can be studied by the ANT are as follows (Fan et al., 2005; Petersen and Posner, 2012). First, a general preparatory state or the “arousal” level needed for rapid detection of expected stimulus is managed by the alerting network, and is associated with increased activity in the right frontal lobe and right parietal lobe. These regions receive noradrenergic projections (related to alertness) from the locus coeruleus. Second, the movement of the attentional focus is allowed by the orienting network. The brain areas involved are the posterior parietal cortex, the thalamic pulvinar nucleus, the superior colliculus and the frontal eye fields. The orienting network is associated with the cholinergic system. Last, the executive network is responsible for conflict resolution (stimulus or response), error detection and inhibitory control, which is associated with the activity of the Anterior Cingulate Cortex (ACC) and the lateral prefrontal cortex. These regions contain a large number of dopamine receptors, suggesting that the dopamine system is involved in the executive network. Some recent studies also include vigilance or tonic alertness as another mechanism involved in the ANT (Roca et al., 2011; Martella et al., 2014). From the original study of Fan et al. (2002), several others have described the anatomy and physiology of these attentional networks in greater detail (Westlye et al., 2011; Chica et al., 2012; Yin et al., 2012), as well as possible variables that can modulate any of these three attentional networks (Roberts et al., 2006; Ishigami and Klein, 2010; Knight and Mather, 2013). A considerable number of them have applied ANT to several pathologies: Alzheimer (Fuentes et al., 2010); Multiple sclerosis (Urbanek et al., 2010); Schizophrenia (Neuhaus et al., 2010a); Mild Cognitive Impairment (van Dam et al., 2013); etc., describing how different attention mechanisms are impaired in these pathologies.
Although different regions of the brain may be locations of these attentional networks, it is suggested that there is a certain degree of independence between them (Fernández-Duque and Posner, 1997; Fan et al., 2005), and others have demonstrated that interaction between networks does exist. Callejas et al. (2005), using a task with auditory cues and visual targets, showed that the alerting network interferes with the executive network (causing a worse performance). They found a benefit from the alerting network for the orienting network, and also a benefit of the orienting network to the executive system. Fuentes and Campoy (2008), by varying SOAs between cues and targets, showed that the alerting network enhanced the orienting function in specific SOAs. Fan et al. (2007) found that the ACC was involved in both alerting (as a response anticipation) and executive functions (as response conflict), suggesting a possible locus for their interaction. Collecting data from 15 studies (N = 1129 healthy subjects), some authors have found that the networks were not independent and suggest caution in the interpretation of the data in this test (Macleod et al., 2010). McConnell and Shore (2011), using correlation analysis between all the conditions, showed that interactions between networks were present and pointed out the difficulty of measuring attention function through subtraction of the experimental conditions.
One possible way to clarify the interactions between these attentional networks is through neurophysiological measures such as the Event-Related Potentials (ERPs). In this particular test (ANT), different components can show what is going on in information processing, particularly with the attentional networks.
The first component that could be relevant is the contingent negative variation (CNV) (Walter et al., 1964) that is present between the presentation of a warning cue (S1) and the onset of the target stimuli (S2). Because the first stimulus (S1) usually serves as a preparatory or “warning” signal for the second “imperative” stimulus (S2), usually requiring a motor response, it is assumed that the CNV represents neuronal activity necessary for sensorimotor integration, which is related to planning, intentionality or decisional processes (e.g., the execution of externally paced, voluntary movements) (Rohrbaugh and Gaillard, 1983; Brunia, 1993). The CNV is comprised of at least two components or windows in the CNV interval (Rohrbaugh et al., 1976), one early or initial phase related to the orienting, and another later or terminal related to the expectancy. The early phase of the CNV is evoked by S1 and has been linked to sensory processes associated with evaluating the information contained in the warning stimulus and characterizing orienting activity, whereas the late CNV is considered to reflect both motor and cognitive preparatory processes associated with an imperative stimulus (Rohrbaugh and Gaillard, 1983; Ruchkin et al., 1986; Brunia, 1993; van Boxtel and Brunia, 1994).
Fronto-parietal networks involved in the CNV period are related to the motor planning or the sensory preparation and their neural generators, as determined by fMRI or EEG source analysis (Corbetta and Shulman, 2002; Gómez et al., 2003, 2007; Peelen et al., 2004). In particular, Gómez et al. (2007) stated that the neural sources for the early phase of the CNV are placed in the SMA, whereas late phases are located in primary motor cortex (MI) and extraestriate regions (Gómez et al., 2003, 2007; Nagai et al., 2004).
Other studies have focused on the role of this component in temporal tasks. In explicit timing tasks, the supplementary motor area (SMA) is activated (Macar et al., 1999) and bilateral premotor cortex would be more involved in implicit timing tasks (Praamstra et al., 2006). However, the question of timing processes related to the CNV period remains unresolved (Coull, 2004; van Rijn et al., 2011).
Another question in the meaning of the CNV is its dependency on motor preparation. Thus, from a preparatory process viewpoint for voluntary movements, the relationship between the CNV and other slow cortical negative potentials (e.g., the readiness potential—RP) has in part been solved (Ikeda et al., 1997; Brunia et al., 2012), and there is also good evidence that the late CNV can be elicited in the absence of a motor response (Ruchkin et al., 1986; Brunia et al., 2012). In this respect, it is possible to disentangle an “expectancy-related cognitive mechanism” independent from a motor preparation for the S2 stimuli (Mento et al., 2013). The evidence indicates that the meaning of the CNV is still under debate, with several mechanisms being intertwined in the S1-S2 interval.
In the specific case of the CNV and its application in the ANT, few studies have been carried out and these have been mainly focused in pathological matters. Kratz et al. (2011), in analyzing the potential modulations in the CNV interval, found an increase of the amplitude in the late phase for the spatial cue (SC) condition with respect to the neutral cue condition in healthy controls. However, other cuing conditions were not analyzed. Missonnier et al. (2013), in comparing all the conditions, concluded that the CNV amplitude was related to the amount of information given for the cue. The CNV amplitude was larger for the more informative SC (alerting and orienting, timing and sensory benefit) compared to the central cue (CC) (alerting, timing benefit), and obviously so in no cue (NC) condition.
With regard to the ERPs belonging to the target stimuli, the modulations in the early ERPs caused by visual attention have described; for instance, when a target stimulus is presented in an attended location, its P1 and N1 components increase compared to the same stimulus displayed in an unattended location (Hillyard and Mangun, 1987; Posner and Dehaene, 1994). In the particular case of the previous presentation of a SC, valid cued targets had an increase in the P1 amplitude, indexing greater enhanced sensory processing (Wright et al., 1995; Gonzalez-Rosa et al., 2006). However, if invalid cues are used, there was an increase in the N1, indexing the need for reorientation of the attention resources (Wright et al., 1995). On the other hand, others have also consistently described an increase of the N1 component related to validly cued target stimuli (Hillyard and Anllo-Vento, 1998; Nobre et al., 2000).
In analyzing these components in the ANT, Neuhaus et al. (2010b) looked at the modulations of the N1 and found that the amplitude varied by the alerting and orienting networks. In particular, the lowest amplitude occurred for the NC condition, larger for the double cue condition, and at the highest for the SC condition.
Lastly, the P3 component has also been analyzed in relation to the congruence variable in the ANT performance. A very definite reduction in the amplitude of the P3 occurred for the incongruent compared to the congruent condition (Neuhaus et al., 2010a). Reduction of the P3 amplitude was related in this study to a higher level of difficulty, but with the need for an inhibition in the response for the incongruent condition. However, some alternative interpretations of the decrease in the P3 have been proposed. Kratz et al. (2011) mentioned that the lower amplitude for the P3 component in ADHD children in the ANT indicated less attentional resources for this group.
Despite all these previous studies, some questions remain unresolved about the ANT: (1) how is behavioral performance affected in this test when the SOA between the cue and target stimuli is extended to a fixed interval of 1 s? (2) Is there any modulation in the CNV trace by a tonic alertness in the NC condition? (3) Has it been confirmed that it is possible to observe different CNV amplitudes related to the availability of cuing information? (4) Which psychological mechanisms are indexed in the early and late phases of the CNV? (5) Which of the target stimuli ERP components is modulated by the interaction of attentional networks? (6) Does the P3 reflect, as in previous studies, a decrease in its amplitude caused by incongruent stimuli compared to the congruent? (7) Can neural source analysis identify specific and overlapped brain areas for the diverse cuing conditions prior to the onset of the target stimuli?
We hypothesized that fixed and longer SOA (1 s) between cue and target stimuli could probably benefit from the following factors: cue (central and spatial regard to the NC condition) and congruence (congruent vs. incongruent targets); however, it is probable that no interaction among these factors will be observed. A certain negative trend is also to be expected in the CNV for the NC condition prior to the onset of the stimuli related to a general tonic alertness present during the performance of an experiment. Moreover, more information provided by the cue will produce bigger amplitudes in the CNV. In particular, modulation in the amplitude for the CC condition will probably occur at the late phase of the CNV, associated with the timing process and general motor preparation. In the case of SC condition, a difference in amplitude compared to the NC and CC condition would be expected in early and late phases of the CNV, related to more specific motor and sensory preparation. With regard to the first locus for the interaction between networks, perhaps one of the early components (the P1 or the N1) or both could represent it. A decrease in amplitude in the incongruent condition for the P3 component will probably be found. Lastly, neural sources may show overlapping regions for all cuing conditions and some specific for each one.
Materials and Methods
Ethic Statement
This study was carried out in compliance with the Helsinki Declaration. All participants signed informed consents before their inclusion and the protocol was approved by the ethics committee of the University of Seville (project code: PSI2010-16825).
Subjects
Twenty-five healthy adults (15 males, 10 females) aged from 22 to 58 years (mean 29.6 ± 8.7 years) took part in this experiment, only one being left-handed. All participants reported normal or corrected-to-normal visual acuity and had no history of neurological or psychiatric diseases.
Stimuli and Procedure
The ANT was used as per the original authors (Fan et al., 2002). Stimuli consisted of a row of 5 horizontal white lines, with arrowheads pointing left or right, against a black background (see Figure 1). There were two types of target stimuli: a congruent target (C), when the central arrow was flanked by other arrows pointing in the same direction, and an incongruent target (I), when the flanking arrows pointed in opposite directions. Target stimuli represented a total visual angle of 3.28 on the x axis and 0.41 on the y axis. The congruent and incongruent trials occurred in equal proportions. Under each condition (congruent or incongruent), half were pointing to the left and half to the right. The subject's task was to indicate the direction of the central arrow by pressing the left button/arrow pointing to the left with the left thumb, or the right button/arrow pointing to the right with the right thumb. The target was presented in one of two locations, either 0.86 above or below the fixation cross in the center of the display, the cross appearing in the center of the visual display throughout the entire experiment. To engage the alerting and orienting processes, a cue (an asterisk symbol) was shown before the appearance of target. There were three cue conditions: NC, CC (at the fixation cross for alerting), and SC (at the target location for alerting plus orienting). All cues occurred in the same proportions. Cues were displayed with a visual angle of 0.41 on the x axis and 0.41 on the y axis. In the NC condition, a black square the same size as the cue was shown (not visible to the subjects) to adapt all the timings for the different cue conditions and make them comparable for ERPs analysis. As a result of the combination of target and cue conditions, the following six conditions were applied: no cue congruent (NC-C), no cue incongruent (NC-I), central cue congruent (CC-C), central cue incongruent (CC-I), spatial cue congruent (SC-C), and spatial cue incongruent (SC-I).
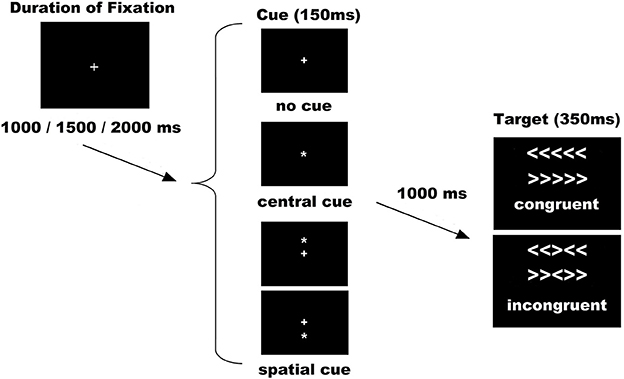
Figure 1. Experimental procedure. Possible combinations of sets of cues and targets were six: no cue congruent (NC-C), no cue incongruent (NC-I), central cue congruent (CC-C), central cue incongruent (CC-I), spatial cue congruent (SC-C), and spatial cue incongruent (SC-I). Abbreviation: ms, milliseconds.
With respect to the duration of stimuli and interstimuli intervals, some adaptations were made to the original version (Fan et al., 2002; see Figure 1). The duration of the cue was 150 ms before a fixed duration of 1000 ms. The target (with flankers) was then presented for 350 ms. The time-window for participants' response was 1000 ms after target onset and the duration between the offset of the target and the start of the next trial was variable (1000, 1500, or 2000 ms). The experiment consisted of 288 trials in 2 blocks of 144. All the trials (diverse cues and different possible targets) were randomly presented in both blocks. With respect to behavior analysis, as suggested by others (Callejas et al., 2005; McConnell and Shore, 2011), we analyzed the interactions between conditions, but without subtractions (network effects) that could hide specific attentional mechanisms. Therefore, reaction time and accuracy were calculated for all conditions and averaged separately. Trials with an error were not included in the behavioral or ERPs analysis. All the participants were instructed to respond as quickly and accurately as possible.
EEG Procedure
The electroencephalogram (EEG) was recorded from 58 scalp electrodes (Fp1, Fpz, Fp2, F3A, F4A, F7, F5, F3, F1, Fz, F2, F4, F6, F8, FC5, FC3, FC1, FCz, FC2, FC4, FC6, T3, C5, C3, C1, Cz, C2, C4, C6, T4, T3L, CP5, CP3, CP1, CPz, CP2, CP4, CP6, T4L, T5, P5, P3, P1, Pz, P2, P4, P6, T6, PO5, PO3, PO1, POz, PO2, PO4, PO6, O1, Oz, O2) (see Figure 2), all of which were compared to an averaged reference. Vertical and horizontal electro-oculograms (VEOG and HEOG) were recorded. The electrode signals were amplified with BrainAmp amplifiers and digitally stored using Brain Vision Recorder software (Brain Products GmbH, Germany). The EEG signal was digitized at 500 Hz and filtered through the amplifier using a band-pass of 0.01–100 Hz, with the impedance below 5 kΩ during the experiment. Trials with a HEOG signal outside the ±75 μV range were rejected. To obtain a good and balanced signal-to-noise ratio between conditions, all the individual averages also comprised >45 artifact-free trials (Polich, 1986; Duncan et al., 2009).
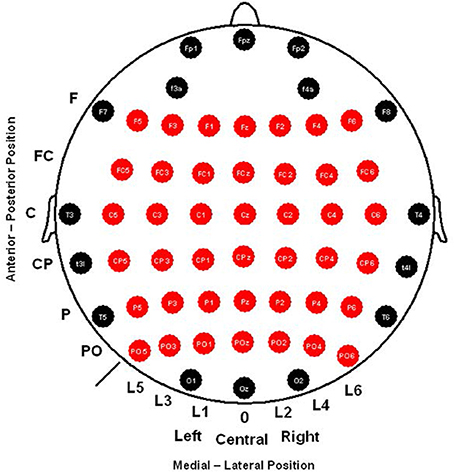
Figure 2. The 58 scalp electrodes recorded and sets of 42 electrodes analyzed (in red) for ERPs (CNV, P1, N1, and P3) that were used.
For the CNV amplitude analysis, baseline correction was done 150 ms prior to the onset of the cue stimuli. The CNV amplitude was analyzed for each cue condition in a time-window of 500 ms prior to the arrival of the target stimulus (specifically in 100 ms intervals, see Event Related Potentials Analysis Section for more details). After that, and because modulation found in the CNV under every cue condition, baseline correction was done 200 ms prior to the onset of the target stimuli for post-stimulus ERP component analysis. As suggested by Duncan et al. (2009), the latency and amplitude of the P1 and N1 components were measured as follows: finding the electrode with the maximum amplitude, identifying the latency of this peak and then exporting the amplitude value at that latency for the rest of the derivations included in the analysis. In the case of the P3 component, Pz electrode showed the maximum amplitude and had two peaks in some cases that were not recognizable in all subjects for latency analysis. Therefore, only amplitude analysis based in a range defined in the grand average (300–700 ms after the target onset) was set for this component in both target conditions (congruent and incongruent). Derivations used to analyze latencies and/or amplitudes for all these components are depicted in Figure 2.
Neural Sources Analysis/Source Modeling
The spatiotemporal dynamics of cortical sources underlying the CNV were also analyzed. We estimated the foci of activations that were time-locked to the stimulus onset for each time-point for each cue condition and participant using the sLORETA (Standardized Low Resolution Electromagnetic Tomography) method implemented into Brainstorm software (http://neuroimage.usc.edu/brainstorm/). This method estimates cortical generator structures without a priori assumptions regarding the location and/or number of current sources (Pascual-Marqui, 2002; Pascual-Marqui et al., 2002). All computations were based on the 3-shell realistic head model (Fuchs et al., 1999), using default EEG sensor positions for each participant. A total of 6430 distributed current dipoles were estimated at a spatial resolution of 5 mm for each participant, whose locations (but not orientations) were constrained onto the cortical surface of the MNI-Colin27 brain template (Montreal Neurological Institute—MNI).
Relative activation values per subject and condition were normalized by calculating z-scores at each time-point relative to the baseline activity within the −150 to 0 ms window previous to the onset of the cue stimulus. These z-scores used to plot cortical maps and the absolute values of the z-scores were then averaged across the subjects. Source reconstructions were performed on the waves obtained from the grand-average of each condition and subject in 2 CNV intervals, −500 to −400 ms and −100 to 0 ms before the target stimulus, which showed previous ERPs differences between experimental conditions during the CNV period. To examine which cortical regions were significantly activated for task condition and each selected time-window of the CNV, cue-locked source activation values were inspected against the baseline using paired t-tests. To correct for multiple comparisons, we used the approach of controlling the false discovery rate, FDR (Benjamini and Yekutieli, 2001), with a threshold of p(FDR) < 0.01. Sources were set at a threshold of 50% according to full-width at half-maximum (FWHM) criterion (Fuchs et al., 1999), and only areas (sources) fulfilling FWHM criteria with a minimum cluster size of 8 voxels were further considered. Anatomical localization of significant regions and Brodmann areas (BA) were first identified using MNI space by the MNI2TAL tool (http://imaging.mrc-cbu.cam.ac.uk/imaging/MniTalairach), and then confirmed by Talairach Client software (http://www.talairach.org), with correction to Talairach space (Brett et al., 2002).
Statistical Analysis of Behavioral Data
For behavioral analysis (reaction time and accuracy), a Repeated Measures ANOVA (RM-ANOVA) was used with the following factors and levels: Cue factor (NC, CC, and SC) and Congruence factor (Congruent and Incongruent conditions).
Event Related Potentials Analysis
To analyze alerting and orienting attentional networks, the CNV amplitude was analyzed by a RM-ANOVA with the following factors and levels: Interval factor (5 levels, each level representing an interval of 100 ms previous to the onset of target stimuli); Cue factor (three levels, NC, CC, and SC); Anteroposterior location factor (6 levels, Frontal, Frontocentral, Central, Centro-parietal, Parietal and Parieto-occipital) and Medial-Lateral Position factor [7 levels, Line 5, Line 3, and Line 1 for the left hemisphere; Midline (o zero); Line 2, Line 4, and Line 6 for the right hemisphere] (see Figure 2).
Specifically for the NC condition, statistical significance of the difference between averaged ERP amplitude and zero value for each subject was calculated before the onset of the target stimuli. To do this, a t-test against zero was used in each of the 10 intervals of 100 ms prior to the onset of the target stimuli (fixed duration of the cue-target interval was 1 s). The level of significance was recalculated (p = 0.05/420 = 0.0001) considering that the number of comparisons, the number of electrodes × intervals, was 42 × 10 = 420.
To measure the modulations caused by the attentional networks in the amplitude of the P1 and N1 components, 2 RM-ANOVAs were used, one for each component analyzed using a 3 × 2 × 6 × 7 design: Cue factor (NC, CC, and SC), Congruence factor (congruent and incongruent targets), Anteroposterior location factor (Frontal, Frontocentral, Central, Centro-parietal, Parietal and Parieto-occipital) and Medial-Lateral Position factor [Line 5, Line 3, and Line 1 for the left hemisphere; Midline (o zero); and Line 2, Line 4, and Line 6 for the right hemisphere] (see Figure 2). The P1 and N1 latencies were analyzed using an RM-ANOVA for each component with a 3 × 2 design: Cue factor (NC, CC, and SC) and Congruence factor (congruent and incongruent targets).
Amplitude modulations of the P3 component were analyzed with a RM-ANOVA for the following factors: Congruence factor (congruent and incongruent targets), Anteroposterior location factor (Frontal, Frontocentral, Central, Centro-parietal, Parietal and Parieto-occipital) and Medial-Lateral Position factor [Line 5, Line 3, and Line 1 for the left hemisphere; Midline (o zero); and Line 2, Line 4, and Line 6 for the right hemisphere] (see Figure 2).
The variables were checked for normality using the Shapiro–Wilk test (p > 0.05). A Greenhouse-Geisser correction for sphericity was applied and p = 0.05 was considered significant. The Bonferroni correction was used in multiple comparisons post-hoc analysis.
Results
Behavioral Data
Mean Reaction Times (RTs) and Accuracy (Acc) for each experimental condition are summarized in Table 1 and Figure 3. A statistically significant result was found for the Cue factor [F(2, 48) = 183.81; p < 0.001]. After post-hoc comparisons, the SC condition was faster than the CC (p < 0.001) and NC condition (p < 0.001), and for CC condition compared to the “NC” condition (p < 0.001). A statistical significant difference was also found with the Congruence factor [F(1, 24) = 378.85; p < 0.001], because it had a faster congruent RT value than the incongruent one.
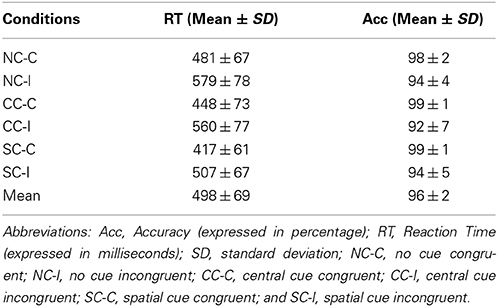
Table 1. ANT behavioral results.
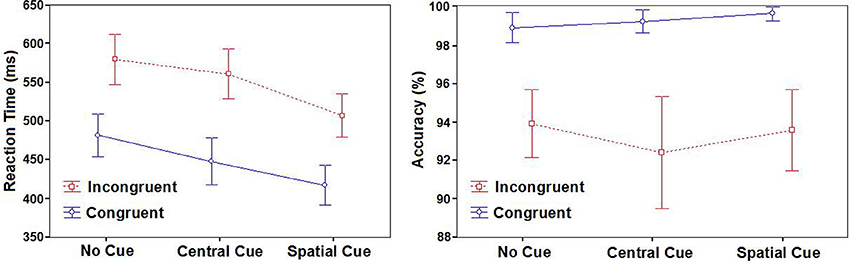
Figure 3. Behavioral results. Mean reaction times (in milliseconds) and accuracy (in percentages) with standard deviations according to cues and targets.
The interaction of Cue × Congruence factors was also significant [F(2, 48) = 15.45; p < 0.001]. With post-hoc comparisons, all conditions were different in every possible comparison (all of them p < 0.001). The SC-C condition was the fastest, followed by the SC-I condition, the CC-C condition, and the CC-I condition in this order. Finally, the slowest conditions were the NC ones, with the NC incongruent condition being slower than the congruent one.
With respect to the accuracy measure, there was no effect of the Cue factor [F(2, 48) = 0.84; p = 0.44] or the interaction of Cue × Congruence factors [F(2, 48) = 1.42; p = 0.25]. Only the Congruence factor had a significant main effect [F(1, 24) = 42.1; p < 0.001], with significantly higher values of accuracy for congruent targets than incongruent ones (p < 0.001).
Event Related Potentials
The contingent negative variation
All the participants had the maximum amplitude value for the CNV in the FcZ or Cz derivations for every cue condition in each interval analyzed. Amplitude analysis of modulations in the CNV component gave statistical differences for diverse factors or interactions between them: Cue factor [F(2, 48) = 16.62; p < 0.001], Cue and interval factors [F(8, 192) = 17.87, p < 0.001], Interval, Cue, and Anteroposterior location factors [F(40, 960) = 6.79; p < 0.001] and also Interval, Cue, and Medial-Lateral Position factors [F(48, 1152) = 4.35; p < 0.001] (see Figure 4 and Table 2). Post-hoc analysis confirmed that the reasons of these significant effects were a higher amplitude (more negative) of the CNV for the SC condition than the NC and CC conditions in all intervals analyzed (500 ms previous to the onset of the target) (p < 0.05 for almost all electrodes analyzed, except Pz, POz, and PO2 electrodes in the −500 to −400 ms interval analyzed) (see Figures 2,4). The CC condition also had a higher negative amplitude value than the NC condition in the 300 ms before target onset (p < 0.05 for most electrodes analyzed, except F5, F3, F1, F2, F4, F6, FC5, FC3, FC6, C6, P5, P6, POz, and PO2 in the −300 to −200 ms interval; F5, F4, F6, FC3, FC6, and P3 electrodes in the −200 to −100 ms interval; and F5, F6, FC3, and FC6 electrodes in the −100 to 0 ms interval analyzed).
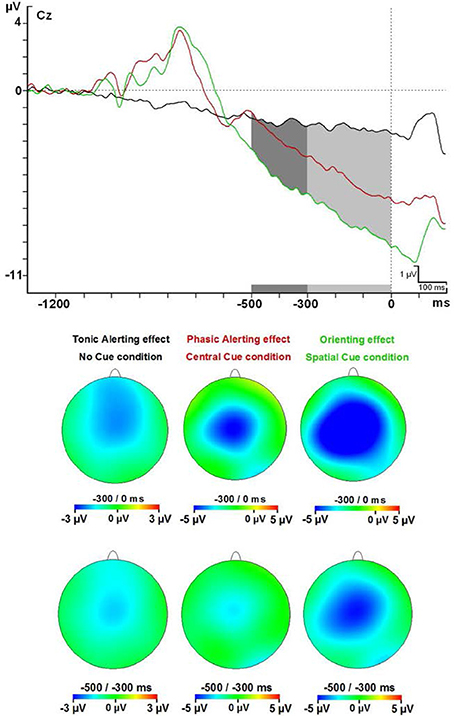
Figure 4. Contingent negative variation modulations at Cz electrode and topographical maps. Abbreviations: ms, milliseconds; μV, microvolts.
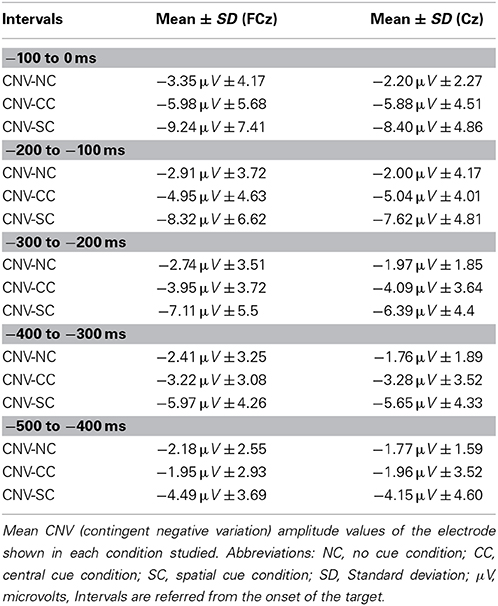
Table 2. The CNV amplitude values.
Importantly, a t-test against zero for the CNV in the NC condition showed that some electrodes in fronto-central areas gave statistically different results (p < 0.0001) compared to zero value for 7 intervals (700 ms before the target onset) (see Figure 5 for detailed locations of these effects). Negative amplitude values were found for the CNV in this condition at all intervals (see Table 3).
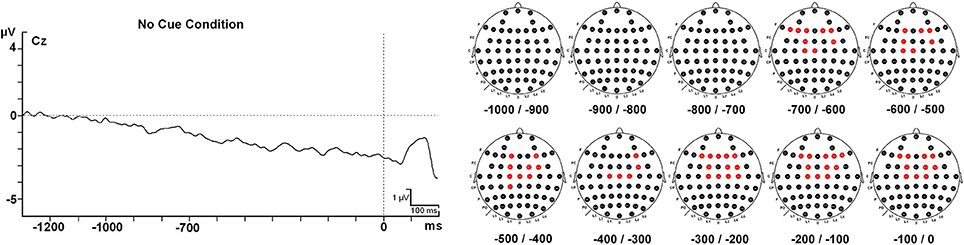
Figure 5. CNV component modulation in the no cue condition and electrodes that showed statistical differences (in red) between averaged ERP amplitudes and zero value (t-test against zero) in each of the 10 intervals of 100 ms prior to the onset of the target stimulus analyzed. Abbreviations: ms, milliseconds; μV, microvolts.
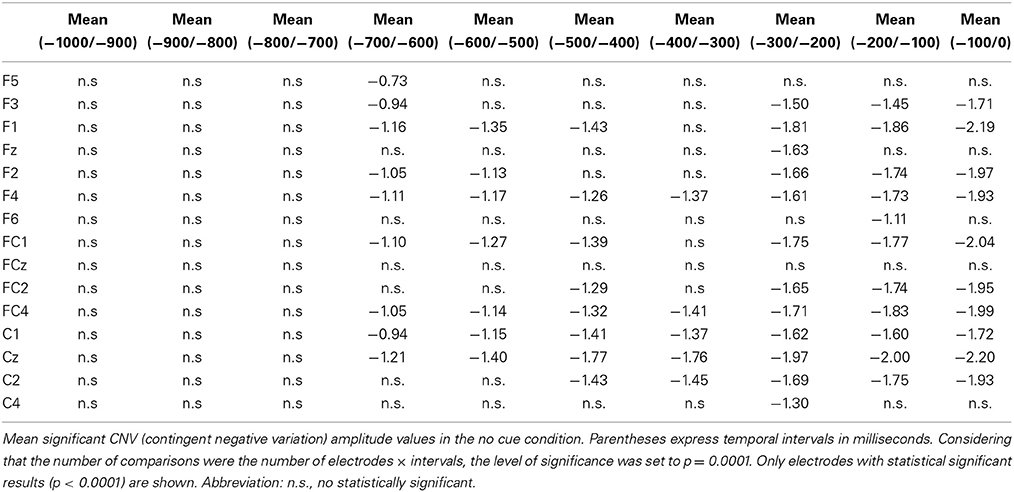
Table 3. Amplitude values of the CNV in the no cue condition.
The target P1 and N1 components
PO5 and PO6 electrodes gave the maximum amplitude value for the P1 and N1 components for all cue × congruence conditions. Table 4 summarizes latency and amplitude values of the P1 and N1 component analyzed for each condition. RM-ANOVA showed no effect in the P1 latency for any factor. Concerning the amplitude of the P1 component (see Table 4), significant interactions of Cue × Anteroposterior location factors [F(10, 240) = 6.7; p < 0.001] and Cue × Medial-Lateral Position factors [F(12, 288) = 3.296; p < 0.001] were found. Post-hoc t-test indicated that the SC condition has the highest amplitude for the P1 compared to the CC and NC conditions in the parieto-occipital electrodes (p < 0.001 for PO5 and PO6 electrodes) (see Figure 6). NC and CC conditions were not significantly different with these electrodes (p > 0.05).
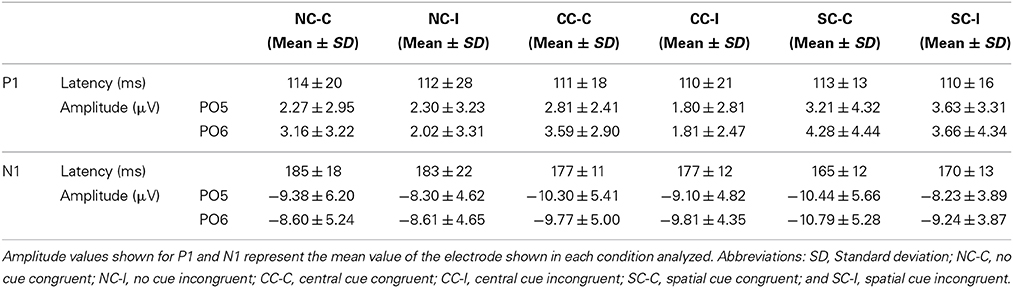
Table 4. The P1 and N1 latency and amplitude values.
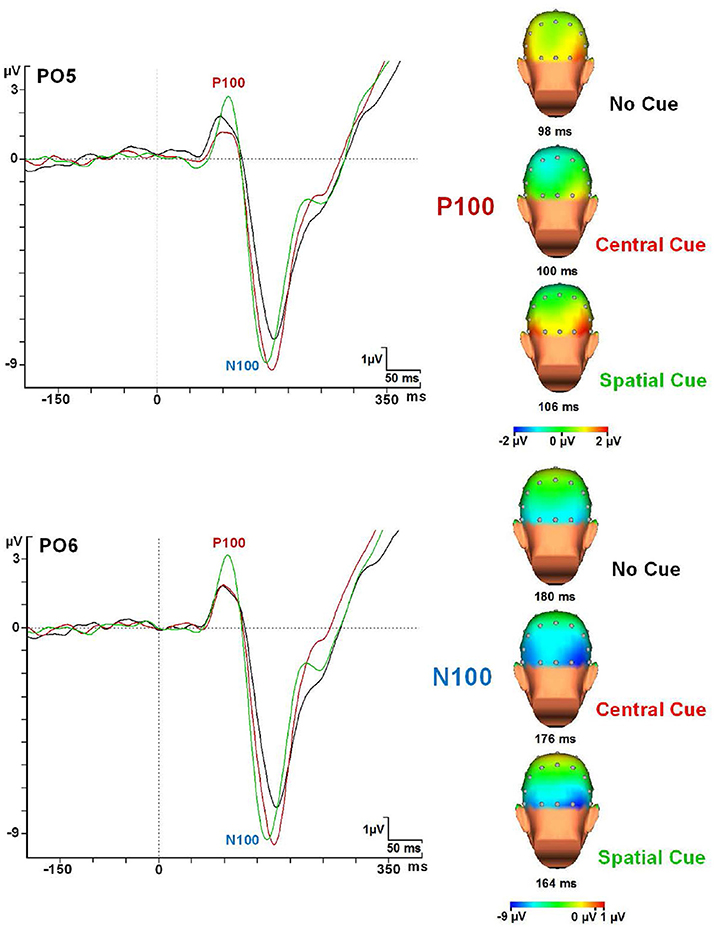
Figure 6. P1 and N1 modulations in every cue condition at the PO5 and PO6 electrodes and topographical maps. Abbreviations: ms, milliseconds; μV, microvolts.
About the amplitude of the N1 (see Table 4), a significant effect of Cue factor [F(2, 48) = 9.81; p < 0.001] and a significant interaction effect of Cue × Anteroposterior × Medial-Lateral Position factors [F(60, 1440) = 2.428; p < 0.001] were observed. After post-hoc analysis, a higher amplitude was seen for the CC condition (p < 0.001) in the parieto-occipital scalp regions (PO5 and PO6 electrodes) compared to SC and NC conditions (see Figure 6).
With regard to the latency of the N1 component, RM-ANOVA showed an effect for the cue factor [F(2, 48) = 17.65; p < 0.001]. Congruence factor or interactions of cue × congruence factors were not significant. However, post-hoc analysis showed that SC condition compared to CC condition gave faster values in the congruent target condition (p < 0.001), but no statistical differences were found between them in the incongruent target condition (p > 0.05). Moreover, post-hoc analysis also confirmed that the SC conditions gave faster N1 latency than the NC condition (both in the congruent and the incongruent target conditions) (p < 0.001). No statistical differences were found between NC and CC Conditions (p > 0.05) (see Figures 6, 7).
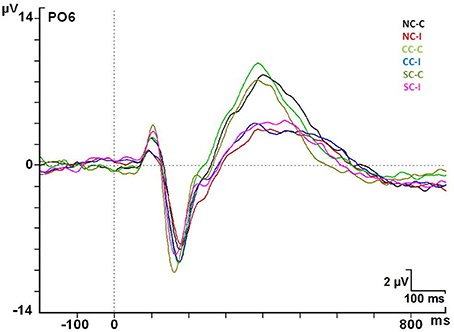
Figure 7. ERP modulations at the PO6 electrode in every cue × congruence condition. Abbreviations: ms, milliseconds; μV, microvolts.
The target P3 component
The maximum amplitude for the P3 component occurred in the parietal regions (Pz) for target stimuli. There was a significant effect by Congruence factor [F(1, 24) = 44.88; p < 0.001]. The Pz electrode gave mean values of 6.57 ± 3.35 μV for the congruent condition and 4.00 ± 2.42 μV for the incongruent one. Post-hoc analysis indicated a statistically significant increase of the amplitude for congruent targets compared to incongruent ones in the 42 electrodes analyzed (p < 0.05), except for the F1 electrode (p > 0.05) (see Figure 7).
Neural sources analysis
Figure 8 shows the distributed source activation pattern evoked by different ANT task conditions during the two selected CNV periods. BA, in which significant differences were found, are summarized in Tables 5, 6.
Figure 8. (A,B) Cortical activation maps presented in Z scores according to the baseline and showing significant activity (FDR-adjusted p < 0.01). Sources of the CNV effect were estimated in 2 CNV intervals of interest, −500 to −400 ms and −100 to 0 ms, before the target stimulus, which had shown previous ERP differences between experimental conditions during the CNV period. Source reconstructions maps were clipped at 50% (FWHM). (C,D) Cue-conditions effects on the mean time-course of activation in superior parietal lobe (SPL), and supplementary motor area (SMA) elicited during the ANT task for no cue (NC), central cue (CC), and spatial cue (SC) conditions in the 100 ms scoring windows at which statistical analyses were carried out. The data represent the grand-average source waveforms for all subjects, collapsing left and right hemispheres for the selected areas.
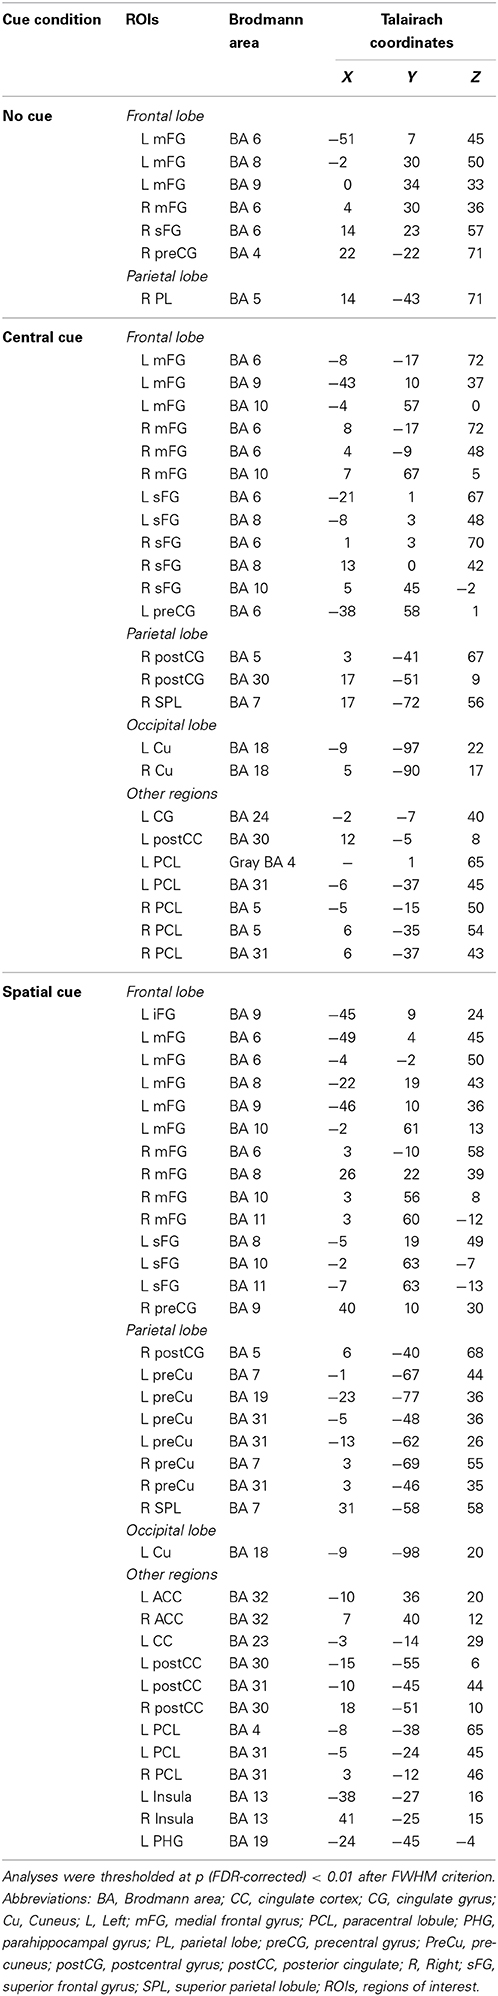
Table 5. Summary of anatomical regions with significant activations compared to baseline in every cuing condition of the ANT test during the late CNV interval (−100 to 0 ms).
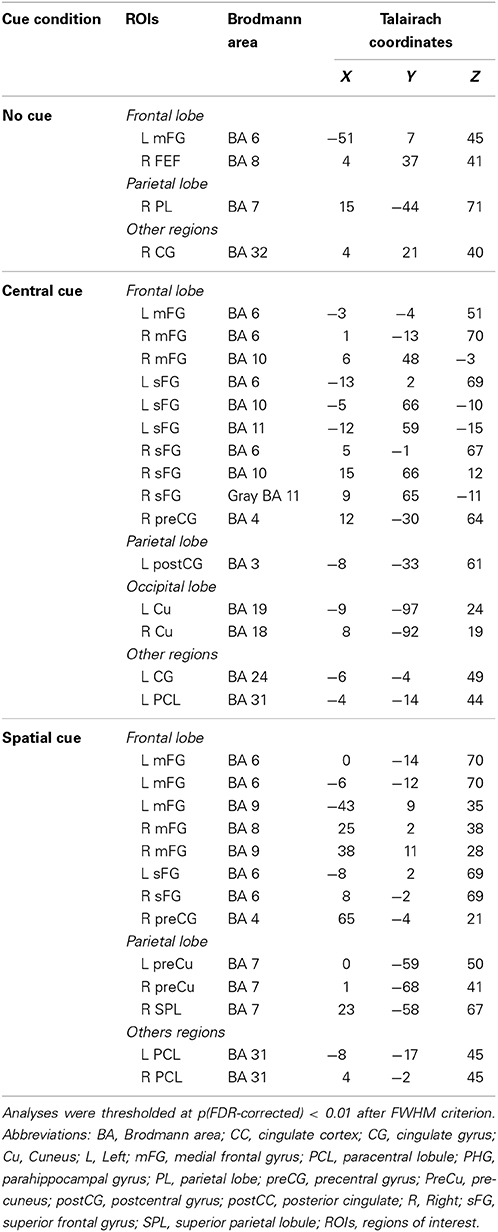
Table 6. Summary of anatomical regions with significant activations compared to baseline in every cuing condition of the ANT test during the early CNV interval (−500 to −400 ms).
During the first CNV time-window of interest (−500 to −400 ms before the target stimulus), source analysis showed the specific neural network activated when no warning cue was presented (NC) in comparison to when there was a cue preceding the target stimulus. Figure 8 also shows that a focal source of activity occurred within the frontal areas, confined to frontal eye fields (BA 8), with additional sources in the parietal and motor areas. CC led, indeed, to an increased bilateral activation of motor areas (BA 4/6) and in the frontal pole (BA 10), as well as other medial and superior frontal areas (BA 11/24). On the other hand, the presence of a valid SC was associated with a more widely distributed activation neural pattern in bilateral middle frontal gyrus (BA 8/9), parietal lobule (BA 7), and motor (BA 4/6/31) areas.
Concerning source localizations obtained during the late CNV time period (−100 to 0 ms before the target onset), the absence of warning cue (NC) showed once again a similar pattern: an increased activation pattern of bilateral medial frontal areas (BA 8), accompanied by a focal activation of the right parietal lobule (BA 4/5), and other middle frontal areas (BA 6/9). However, as expected, different motor and sensorial brain areas were most strongly activated when subjects were attending to some cue preceding the target stimulus. More specifically, early activation of the frontal pole and motor areas spread throughout a more bilateral and wide activation of the same brain areas following CC, with further increased activity within the posterior cingulate areas (BA 31), the right parietal cortex (BA 5/7) and the bilateral occipital regions (BA 18). Similarly to the active brain areas during CC, a widespread network of cortical sources were identified for the SC condition involving the bilateral motor and cingulate areas (BA 6, BA 24/30/31/32), frontal (BA 9, BA8, BA 11) and parietal cortex (BA 7), and increased recruitment of new brain areas as bilateral insula cortex (BA 13) and others involved in visual processing (BA 18/19).
Discussion
Behavioral Data
The classical result in behavioral measures for the ANT was obtained. A faster response was found for the SC condition compared to the CC condition, and for both compared to the NC condition. This result reflects that cuing improves the performance in the responses, as described by the founders of this test (Fan et al., 2002, 2005). In particular, CC condition could be considered as a timing cue and the SC condition as a timing and SC that improve the performance in this task, due to the fixed SOA between the onset of the cue and the onset of the target. With respect to the executive system, a significant statistical difference was found for the congruence factor, indicating faster responses for the congruent compared to the incongruent targets as in previous studies (Fan et al., 2002, 2005). With regard to the accuracy variable, a significant difference was found only for the congruence factor, with a worse performance for the incongruent condition. This result guarantees that the effect in reaction time cannot be explained by a speed-accuracy trade-off (incongruent targets had slower responses and poorer accuracy values). With regard to the interactions between these two conditions, post-hoc tests showed that all cue × congruence comparisons were statistically different. Therefore, our data strictly show no interaction between cue and congruence conditions. These results suggest that, all conditions in our study represent a diverse set of cognitive mechanisms (probably some shared and others not) that account for reaction time differences. The data we obtained supports the notion that the timing between cue and target stimuli is relevant in determining the possible interactions of alerting, orienting and executive networks, as previously noted (Callejas et al., 2005; Fuentes and Campoy, 2008). In the vast majority of the ANT studies, SOAs between cue and target were quickly established (~400 ms); in our case, this interval was lapsed for 1 s, which maybe the cause in finding behavioral differences in all conditions and non-specific interactions between the attentional networks, as found by others (Fan et al., 2005; Fuentes and Campoy, 2008). Due to the differences found in the behavior, but the impossibility of disentangling the cognitive processes involved in the diverse conditions, neurophysiological indexes were analyzed.
Event Related Potentials
Contingent negative variation
Statistical analysis showed that the CNV linked to the SC condition had a higher amplitude compared to the NC and CC conditions in the 500 ms prior to the onset of the target stimuli. Besides, the CNV from CC condition was greater in amplitude compared to the NC condition in the 300 ms prior to the onset of the target stimuli. An increase in the CNV amplitude caused by the presentation of a warning cue has already been described (Harter and Anllo-Vento, 1991; Wright et al., 1995; Gonzalez-Rosa et al., 2011). Moreover, a progressive increase in the CNV amplitude related to the amount of information contained in the cue occurred in our study, as suggested by others (Missonnier et al., 2013).
Importantly, the absence of the differences between the CNV from NC and CC conditions in the lapse of 500 to 300 ms prior to the onset of the target stimuli, and the statistical difference in the interval of 300 ms prior to the onset, suggest that the benefit from the CC (timing preparation) is specially located in the last phase of the CNV period. Previous studies have observed that the benefit in explicit timing tasks involved the SMA activation (Macar et al., 1999). Our neural source analysis showed that BA 6 (SMA) is activated in the CC condition as in the SC condition (both shared the timing benefit), but no effect was seen for the NC condition.
On the other hand, the difference between the SC condition and CC and NC conditions in the entire interval before the presentation of the target stimuli indicates that the benefit due to the certainty of the information provided by the SC probably involves several mechanisms occurring in different phases of the CNV. In particular, neural sources analysis showed that the SC condition caused activation in a higher number of areas compared to the CC and NC conditions. Among these areas, it was possible to find areas involved in decisional processes (BA 11 or BA 24, Orbitofrontal area or ventral anterior cingulate cortex), motor planning (BA 6, SMA) and sensory preparation (BA 19, associative visual cortex); see above for the relationship with the P1 component. The CC condition activates a similar set of areas (BA11, BA24, and BA31; Orbitofrontal area, ventral anterior cingulate cortex, and Dorsal Posterior cingulate cortex), but no significant activity for the BA19 or other visual areas, suggesting there was no specific sensory preparation.
Remarkably, both conditions (spatial and central) gave a different set of areas activated in the early and late phase of the CNV (Tables 5, 6), which suggests that, during the CNV interval, a complex organization in the brain activity takes place for both conditions sharing some mechanisms, but with some specific areas engaged for them individually. In summary, these findings are consistent with previous studies describing a general frontoparietal network that seems to be involved in the preparatory period between the cue (spatial and central) and the subsequent target (Corbetta and Shulman, 2002; Gómez et al., 2003, 2007; Fan et al., 2007); in the same way, it seems to point to a detailed spatio-temporal distribution of neural sources underlying the CNV, which would be related to different cue-dependent settings involved in specific cognitive preparation processes.
Apart from this result on the CNV for CC and SC conditions, a negative trend for the NC condition in the interval previous to the presentation of the target stimuli was found. During the 700 ms prior to the onset of the target, the CNV trace for the “NC” condition was statistically different from zero. This supports other studies where a better level of alertness (subjectively experienced) was related to an increased amplitude of the CNV (Ikemi, 1988; Linssen et al., 2011). It is surprising that a trend can be found when NC is presented in this period. At the same time, it is reasonable to think that a minimal level of general alertness oriented to the task is present in healthy subjects during an experiment. This modulation is not strictly related to the concept of vigilance or tonic alerting as has been studied by other groups adding an additional task to the ANT (Roca et al., 2011; Martella et al., 2014). It is related more to evidence found by Mento et al. (2013) where the execution of a cognitive task with fixed time parameters can build an expectancy that is echoed in the CNV. In the present paradigm, the subject awaits after the last target for the new stimuli that is coming (cue or target). After ~2 s, the subject knows that one of them will show up suddenly, and thus starts preparing for it. The interesting question in this case is that the construction of this task-related expectancy is created by the experience of the subject after some trials with all SOA possibilities, and where the maximum time between offset of the target and next stimuli is 2 s. This level of alertness (supposedly created by the subject estimations) is relevant in monitoring significant events during the performance of a task, and is impaired in subjects with ADHD (Spronk et al., 2008).
Analyzing the neural sources in the NC condition, it is possible to see that diverse areas are activated in different intervals of this trend. In the beginning, areas modulated are mainly related to the decisional processes (BA11, Orbitofrontal area) and monitoring (BA32, dorsal anterior cingulate cortex) which is logical, considering that the subject has to await both kind of stimuli (cues or targets). However, when the onset of a cue or a target is close (a timing built by subject experience), 2 specific areas are active (BA8 and BA10, frontal eye fields and anterior prefrontal cortex). Bunzeck et al. (2006) showed that when the demand of the task is reduced, activity of BA8 decreases. It seems reasonable that, when the subject is waiting for the cue or target, a higher demand is required and BA8 shows significant activity. With regard to the BA10, this area has been related to the maintenance of attention toward external stimuli (Burgess et al., 2007) and in the integration of the outcome of different cognitive operations for the achievement of goals in complex situations (Ramnani and Owen, 2004), as it is at that critical interval for a correct performance of the task.
The target P1 and N1 components
In the early ERPs for the target stimuli, the P1 showed a modulation in amplitude related to the cue factor. In particular, there was an increase in this component following a SC compared to NC or CC conditions. This is in accord with previous studies where higher amplitude has been related to the stimuli presented in the attended location (Hillyard and Mangun, 1987; Posner and Dehaene, 1994), which may be one reason for the improved behavioral performance. The sensory benefit is probably caused by preactivation during the CNV interval of the BA 19 in the SC condition. This area has been considered as a candidate for the P1 generator (Di Russo et al., 2002). No difference was found in the comparison between the P1 following NC or CC conditions, which reflects the lack of specific sensory preparation for both conditions. Differences in performance among them must be due to some other mechanisms (i.e., motor planning).
Regarding the latency of the N1 component, ANOVA showed a major effect caused by the cue factor, but no effects by the congruence factor or interaction between both factors. However, analyzed post-hoc, some interaction between these factors emerged. In particular, after a SC, the N1 showed a faster peak than when was preceded by a NC condition in both cases (target stimulus congruent or incongruent). However, comparison between SC and CC conditions showed that only with congruent targets was the N1 latency faster for the SC condition, with no statistical differences being found for the incongruent targets. The data suggest, in general, that the greater the information given by the cue, the lower is the latency of the N1 component. However, the interaction between the cue and congruence factors modulates in some way the latency of this component, possibly by showing that the executive system cannot use the facilitation of the SCs when an incongruent target is presented.
In the amplitude analysis of this component, there were not interactions between cue and congruence factors; however, some modulations were specifically produced separately by these factors. In the case of the cue factor, statistical analysis showed that the CC condition increases the amplitude of the subsequent N1 compared to the SCand NC conditions. It is reasonable to think that the increase in the CC compared to the SC condition is justified by the need in some cases of reorienting or moving the attentional focus to the target location, as previously suggested (Luck et al., 1990). However, the benefit of the attended location (SC condition), as shown by others (Luck et al., 1994), was not evident from our data. In this case, the reorientation effect in part could overcompensate for the increase in amplitude from the benefit of the spatial attention. However, due to the absence of any statistical difference between “NC” and SC conditions, it is more likely that the benefit of spatial attention does not occur in the course of the present data. This could be caused by the SOA we used for the CNV period being too long for the spatial attention benefit seen in previous by Luck et al. (1994). The lack of the visual attention effect in the N1 and the presence of modulation in the P1 reflect definite independence between these processes (Hillyard and Anllo-Vento, 1998; Hillyard et al., 1998).
On the other hand, another reason might explain the difference in the comparison between the CC and the NC conditions. McConnell and Shore (2011) suggested that the CC condition induces the subject to spread his attentional system in the visual field, whereas the other conditions (NC or SC) are more concentrated in specific regions (NC condition attending mainly to the fixation point, or the SC condition attending to a specific location defined by the cue). Two reports show that the N1 amplitude is increased for stimuli that require a larger sampling spread of the visual field for visual perception than for stimuli that require a small spread (Snyder et al., 2012; Benwell et al., 2014). Thus, our interpretation is that the modulation in the N1 component between CC and NC conditions reflects the need to readjust the global vs. local distribution of the attentional focus.
To sum up, different modulations in the N1 component reflect the way this component offers a complex set of modulations in the ANT and could be a specific neurophysiological index for the interaction of attentional networks, and consequently helpful to find its anatomical locations. Further research is necessary to confirm and interpret the role of this component in the interaction of attentional networks.
The target P3 component
Lastly, the amplitude of the P3 component was considerably increased for the congruent compared to the incongruent condition. This result has already been obtained using the ANT (Neuhaus et al., 2007, 2010a). Their conclusion was that the decrease for the P3 is related to response inhibition, but it was impossible to rule out the difficulty of the task involved as other have concluded (Polich, 1987; Hagen et al., 2006). However, not all the studies supporting the incongruent conditions have shown a lower less amplitude for this component. Zhang et al. (2013) found higher amplitude for the P3 component with incongruent compared to congruent stimuli. They believed that the decrease in the incongruent stimuli in the Neuhaus et al. (2010a) study is related to conflict at the response level, while the increase was possible because the conflict occurs at the perceptual level. Finally, it is also relevant that Rusnáková et al. (2011), using intracerebral recording, found that the P3-like potentials occurred more frequently with the incongruent than congruent stimuli in the temporal lateral neocortex and orbitofrontal cortex. These results show that the congruence variable comprises diverse cognitive mechanisms that make it difficult to reach clear conclusions. Indeed, another interpretation pointed to a decrement of the P3 amplitude related to a pathological (ADHD) reduction of attentional resources involved in the task (Kratz et al., 2011). However, a possible interpretation for this decrease could be the obverse. The P3 component, built by several mechanisms (evaluation of the stimuli, task relevancy, etc.), could show dispersion in time of these mechanisms when the difficulty is higher and greater synchronization of them when the demands of the task are lower. In the first case, greater attentional demands lead to lower amplitude in the P3 and vice-versa for the congruent condition, which is less demanding. In any case, to disentangle all these possibilities is beyond the aim this study and the precise meaning for the P3 component in this test needs further investigation.
The Problem of Subtractions in the Attention Network Test
All the evidence suggests that the different conditions that compose the ANT include different cognitive mechanisms, which are only shared in some cases. For instance, in the NC condition, the expectancy of the subject is quite different from the one that occurs with the CC and SC conditions. Essentially, in the former condition, the subject is naïve about the stimulus that will be displayed (cue or target), which makes it more difficult and slows the responses. In the CC and SC conditions, complete certainty of a target presentation is achieved and no new cue is expected. Therefore, the comparison between the NC and CC conditions is not merely a comparison between alert and not alert, as is usually suggested by studies using the ANT. The cognitive load between NC and CC/SC conditions is different, and more resources are needed in the former condition. Moreover, it is impossible to prepare any sensory or motor facilitation when a cue or a target is expected (it would be more a go-no go task rather than a choice task). This apart, the NC condition with regard to the CC condition is not even a valid comparison for alerting, since, as seen before, some negative trend in the CNV interval (representing a task-related expectancy) is seen in the NC condition so that it may not be engaged after the presentation of the CC.
In the case of the classical orienting network effect, subtraction between CC and SC conditions is not only based on two levels of orienting (oriented or not), but is also a different location that is attended (larger for the CC compared to the SC condition), and at the same time a higher number of elements (four possible targets in the CC condition with their corresponding possible motor responses rather than two for the SC condition). These differences cause a different initial state of the brain in processing the forthcoming target stimuli, which can induce different ways of processing the target stimuli thereby making it difficult to accept classical networks subtraction.
Conclusion
The classical behavioral results of this test were observed—more informative cuing represents faster reaction times, and incongruent targets proved slower compared to the congruent ones. However, no specific interactions were found for all experimental conditions, probably due to the longer cue-target interval used in our experiments.
We have presented new findings regarding the ANT paradigm; specific modulations of the CNV are related to: a task-related expectancy presented in the NC condition; late modulation in the CNV triggered by the CC condition and representing probably a generic motor preparation; and an early and late modulation in the CNV for SC condition, representing more specific motor and sensory preactivations.
Regarding the ERPs for the target stimuli, the P1 amplitude increased following the SC suggesting an enhanced processing of spatially attended stimuli. More difficult to interpret have been the modulations for the N1 in latency and the amplitude that could be assigned to this component as the first locus for the interaction between attentional networks in the information processing of target stimuli. The P3 component has a bigger amplitude for the congruent than for the incongruent targets, which could represent different mechanisms of response inhibition, task difficulty, or simply an increase in the simultaneity of different processes indexed by this component.
Finally, neural sources show that, during the cue-target interval, some areas are shared between different cuing conditions, whereas others are specific to each one. Considering all these data, it seems reasonable that the network effects (calculated by subtractions) must be taken with caution, especially when clinical samples are considered and misinterpretations could be made. However, the ANT combined with ERPs is suitable for studying subtle mechanisms in information processing, including attentional ones as well as motor, decision-making, etc.
Conflict of Interest Statement
The authors declare that the research was conducted in the absence of any commercial or financial relationships that could be construed as a potential conflict of interest.
Acknowledgment
This study was supported by Plan Nacional I+D+i (Ministerio de Economía y Competitividad, Government of Spain, PSI2010-16825); Asociación Neuroinvest and Asociación Sanitaria Virgen Macarena. The authors wish to thank all the subjects for their participation in this study. We also would like to thank Dr. Manuel Morales for helpful assistance with the statistical section, and to Eduardo Cueto Mateos for his assistance with the EEG placement of electrodes. Lastly, we would like to thank both reviewers for their comments on the manuscript, which has greatly improved this paper.
References
Benjamini, Y., and Yekutieli, D. (2001). The control of the false discovery rate in multiple testing under dependency. Ann. Stat. 29, 1165–1188. doi: 10.1214/aos/1013699998
Benwell, C. S., Harvey, M., and Thut, G. (2014). On the neural origin of pseudoneglect: EEG-correlates of shifts in line bisection performance with manipulation of line length. Neuroimage 86, 370–380. doi: 10.1016/j.neuroimage.2013.10.014
Pubmed Abstract | Pubmed Full Text | CrossRef Full Text | Google Scholar
Brett, M., Johnsrude, I. S., and Owen, A. M. (2002). The problem of functional localization in the human brain. Nat. Rev. Neurosci. 3, 243–249. doi: 10.1038/nrn756
Pubmed Abstract | Pubmed Full Text | CrossRef Full Text | Google Scholar
Brunia, C. H. M. (1993). Waiting in readiness: gating in attention and motor preparation. Psychophysiology 30, 327–339. doi: 10.1111/j.1469-8986.1993.tb02054.x
Pubmed Abstract | Pubmed Full Text | CrossRef Full Text | Google Scholar
Brunia, C. H. M., Van Boxtel, G. J. M., and Böcker, K. B. E. (2012). “Negative slow waves as indices of anticipation: the Bereitschaftspotential, the contingent negative variation, and the stimulus-preceding negativity,” in The Oxford Handbook of Event-Related Potential Components, eds S. J. Luck and E. S. Kappenman (Oxford: Oxford University Press), 189–207.
Bunzeck, N., Schütze, H., and Düzel, E. (2006). Category-specific organization of prefrontal response-facilitation during priming. Neuropsychologia 44, 1765–1776. doi: 10.1016/j.neuropsychologia.2006.03.019
Pubmed Abstract | Pubmed Full Text | CrossRef Full Text | Google Scholar
Burgess, P. W., Dumontheil, I., and Gilbert, S. J. (2007). The gateway hypothesis of rostral prefrontal cortex (area 10) function. Trends Cogn. Sci. 11, 290–298. doi: 10.1016/j.tics.2007.05.004
Pubmed Abstract | Pubmed Full Text | CrossRef Full Text | Google Scholar
Callejas, A., Lupiàñez, J., Funes, M. J., and Tudela, P. (2005). Modulations among the alerting, orienting and executive control networks. Exp Brain Res. 167, 27–37. doi: 10.1007/s00221-005-2365-z
Pubmed Abstract | Pubmed Full Text | CrossRef Full Text | Google Scholar
Chica, A. B., Thiebaut de Schotten, M., Toba, M., Malhotra, P., Lupiáñez, J., and Bartolomeo, P. (2012). Attention networks and their interactions after right-hemisphere damage. Cortex 48, 654–663. doi: 10.1016/j.cortex.2011.01.009
Pubmed Abstract | Pubmed Full Text | CrossRef Full Text | Google Scholar
Corbetta, M., and Shulman, G. L. (2002). Control of goal-directed and stimulus-driven attention in the brain. Nat. Rev. Neurosci. 3, 201–215. doi: 10.1038/nrn755
Pubmed Abstract | Pubmed Full Text | CrossRef Full Text | Google Scholar
Coull, J. T. (2004). fMRI studies of temporal attention: allocating attention within, or towards, time. Brain Res. Cogn. Brain Res. 21, 216–226. doi: 10.1016/j.cogbrainres.2004.02.011
Pubmed Abstract | Pubmed Full Text | CrossRef Full Text | Google Scholar
Di Russo, F., Martínez, A., Sereno, M. I., Pitzalis, S., and Hillyard, S. A. (2002). Cortical sources of the early components of the visual evoked potential. Hum. Brain Mapp. 15, 95–111. doi: 10.1002/hbm.10010
Pubmed Abstract | Pubmed Full Text | CrossRef Full Text | Google Scholar
Duncan, C. C., Barry, R. J., Connolly, J. F., Fisher, C., Michie, P. T., Näätänen, R., et al. (2009). Event-related potentials in clinical research: guidelines for eliciting, recording, and quantifying mismatch negativity, P300, and N400. Clin. Neurophysiol. 120, 1883–1908. doi: 10.1016/j.clinph.2009.07.045
Pubmed Abstract | Pubmed Full Text | CrossRef Full Text | Google Scholar
Eriksen, B. A., and Eriksen, C. W. (1974). Effects of noise letters upon the identification of a target letter in a nonsearch task. Percept. Psychophys. 16, 143–149. doi: 10.3758/BF03203267
Fan, J., Kolster, R., Ghajar, J., Suh, M., Knight, R. T., Sarkar, R., et al. (2007). Response anticipation and response conflict: an event-related potential and functional magnetic resonance imaging study. J. Neurosci. 27, 2272–2282. doi: 10.1523/JNEUROSCI.3470-06.2007
Pubmed Abstract | Pubmed Full Text | CrossRef Full Text | Google Scholar
Fan, J., McCandliss, B. D., Fossella, J., Flombaum, J. I., and Posner, M. I. (2005). The activation of attentional networks. Neuroimage 26, 471–479. doi: 10.1016/j.neuroimage.2005.02.004
Pubmed Abstract | Pubmed Full Text | CrossRef Full Text | Google Scholar
Fan, J., McCandliss, B. D., Sommer, T., Raz, A., and Posner, M. I. (2002). Testing the efficiency and independence of attentional networks. J. Cogn. Neurosci. 14, 340–347. doi: 10.1162/089892902317361886
Pubmed Abstract | Pubmed Full Text | CrossRef Full Text | Google Scholar
Fernández-Duque, D., and Posner, M. I. (1997). Relating the mechanisms of orienting and alerting. Neuropsychologia 35, 477–486. doi: 10.1016/S0028-3932(96)00103-0
Pubmed Abstract | Pubmed Full Text | CrossRef Full Text | Google Scholar
Fuchs, M., Wagner, M., Kohler, T., and Wischmann, H. A. (1999). Linear and nonlinear current density reconstructions. J. Clin. Neurophysiol. 16, 267–295.
Fuentes, L. J., and Campoy, G. (2008). The time course of alerting effect over orienting in the Attention Network Test. Exp. Brain Res. 185, 667–672. doi: 10.1007/s00221-007-1193-8
Pubmed Abstract | Pubmed Full Text | CrossRef Full Text | Google Scholar
Fuentes, L. J., Fernández, P. J., Campoy, G., Antequera, M. M., García-Sevilla, J., and Antúnez, C. (2010). Attention network functioning in patients with dementia with Lewy bodies and Alzheimer's disease. Dement. Geriatr. Cogn. Disord. 29, 139–145. doi: 10.1159/000275672
Gómez, C. M., Flores, A., and Ledesma, A. (2007). Fronto-parietal networks activation during the contingent negative variation period. Brain Res. Bull. 73, 40–47. doi: 10.1016/j.brainresbull.2007.01.015
Pubmed Abstract | Pubmed Full Text | CrossRef Full Text | Google Scholar
Gómez, C. M., Marco, J., and Grau, C. (2003). Preparatory visuo-motor cortical network of the contingent negative variation estimated by current density. Neuroimage 20, 216–224. doi: 10.1016/S1053-8119(03)00295-7
Pubmed Abstract | Pubmed Full Text | CrossRef Full Text | Google Scholar
Gonzalez-Rosa, J. J., Vazquez-Marrufo, M., Vaquero, E., Duque, P., Borges, M., Gamero, M. A., et al. (2006). Differential cognitive impairment for diverse forms of multiple sclerosis. BMC Neurosci. 7:39. doi: 10.1186/1471-2202-7-39
Pubmed Abstract | Pubmed Full Text | CrossRef Full Text | Google Scholar
Gonzalez-Rosa, J. J., Vazquez-Marrufo, M., Vaquero, E., Duque, P., Borges, M., Gómez, C. M., et al. (2011). Cluster analysis of behavioural and event-related potentials during a contingent negative variation paradigm in remitting-relapsing and benign forms of multiple sclerosis. BMC Neurol. 11:64. doi: 10.1186/1471-2377-11-64
Pubmed Abstract | Pubmed Full Text | CrossRef Full Text | Google Scholar
Hagen, G. F., Gatherwright, J. R., Lopez, B. A., and Polich, J. (2006). P3a from visual stimuli: task difficulty effects. Int. J. Psychophysiol. 59, 8–14. doi: 10.1016/j.ijpsycho.2005.08.003
Pubmed Abstract | Pubmed Full Text | CrossRef Full Text | Google Scholar
Harter, M. R., and Anllo-Vento, L. (1991). “Visual-spatial attention: preparation and selection in children and adults,” in Event-Related Brain Research (EBG Suppl. 42), eds C. H. M. Brunia, G. Mulder and M. N. Verbaten (Amsterdam: Elsevier Science Publishers, B.V), 183–194.
Hillyard, S. A., and Anllo-Vento, L. (1998). Event-related brain potentials in the study of visual selective attention. Proc. Natl. Acad. Sci. U.S.A. 95, 781–787.
Hillyard, S. A., and Mangun, G. R. (1987). Sensory gating as a physiological mechanism for visual selective attention. Electroencephalogr. Clin. Neurophysiol. Suppl. 40, 61–67.
Hillyard, S. A., Vogel, E. K., and Luck, S. J. (1998). Sensory gain control (amplification) as a mechanism of selective attention: electrophysiological and neuroimaging evidence. Philos. Trans. R. Soc. Lond. B Biol. Sci. 353, 1257–1270. doi: 10.1098/rstb.1998.0281
Pubmed Abstract | Pubmed Full Text | CrossRef Full Text | Google Scholar
Ikeda, A., Shibasaki, H., Kaji, R., Terada, K., Nagamine, T., Honda, M., et al. (1997). Dissociation between contingent negative variation (CNV) and Bereitschaftspotential (BP) in patients with parkinsonism. Electroencephalogr. Clin. Neurophysiol. 102, 142–151. doi: 10.1016/S0921-884X(96)95067-5
Pubmed Abstract | Pubmed Full Text | CrossRef Full Text | Google Scholar
Ikemi, A. (1988). Psychophysiological effects of self-regulation method: EEG frequency analysis and contingent negative variations. Psychother. Psychosom. 49, 230–239. doi: 10.1159/000288088
Pubmed Abstract | Pubmed Full Text | CrossRef Full Text | Google Scholar
Ishigami, Y., and Klein, R. M. (2010). Repeated measurement of the components of attention using two versions of the Attention Network Test (ANT): stability, isolability, robustness, and reliability. J. Neurosci. Methods 190, 117–1128. doi: 10.1016/j.jneumeth.2010.04.019
Pubmed Abstract | Pubmed Full Text | CrossRef Full Text | Google Scholar
Knight, M., and Mather, M. (2013). Look out-it's your off-peak time of day! time of day matters more for alerting than for orienting or executive attention. Exp. Aging Res. 39, 305–321. doi: 10.1080/0361073X.2013.779197
Pubmed Abstract | Pubmed Full Text | CrossRef Full Text | Google Scholar
Kratz, O., Studer, P., Malcherek, S., Erbe, K., Moll, G. H., and Heinrich, H. (2011). Attentional processes in children with ADHD: an event-related potential study using the Attention Network Test. Int. J. Psychophysiol. 81, 82–90. doi: 10.1016/j.ijpsycho.2011.05.008
Pubmed Abstract | Pubmed Full Text | CrossRef Full Text | Google Scholar
Linssen, A. M., Vuurman, E. F., Sambeth, A., Nave, S., Spooren, W., Vargas, G., et al. (2011). Contingent negative variation as a dopaminergic biomarker: evidence from dose-related effects of methylphenidate. Psychopharmacology 218, 533–542. doi: 10.1007/s00213-011-2345-x
Pubmed Abstract | Pubmed Full Text | CrossRef Full Text | Google Scholar
Luck, S. J., Heinze, H. J., Mangun, G. R., and Hillyard, S. A. (1990). Visual event-related potentials index focused attention within bilateral stimulus arrays. II. Functional dissociation of P1 and N1 components. Electroencephalogr. Clin. Neurophysiol. 75, 528–542. doi: 10.1016/0013-4694(90)90139-B
Pubmed Abstract | Pubmed Full Text | CrossRef Full Text | Google Scholar
Luck, S. J., Hillyard, S. A., Mouloua, M., Woldorff, M. G., Clark, V. P., and Hawkins, H. L. (1994). Effects of spatial cuing on luminance detectability: psychophysical and electrophysiological evidence for early selection. J. Exp. Psychol. Hum. Percept. Perform. 20, 887–904. doi: 10.1037/0096-1523.20.4.887
Pubmed Abstract | Pubmed Full Text | CrossRef Full Text | Google Scholar
Macar, F., Vidal, F., and Casini, L. (1999). The supplementary motor area in motor and sensory timing: evidence from slow brain potential changes. Exp. Brain Res. 125, 271–280. doi: 10.1007/s002210050683
Pubmed Abstract | Pubmed Full Text | CrossRef Full Text | Google Scholar
Macleod, J. W., Lawrence, M. A., McConnell, M. M., Eskes, G. A., Klein, R. M., and Shore, D. I. (2010). Appraising the ANT: psychometric and theoretical considerations of the Attention Network Test. Neuropsychology 24, 637–651. doi: 10.1037/a0019803
Pubmed Abstract | Pubmed Full Text | CrossRef Full Text | Google Scholar
Martella, D., Manzanares, S., Campoy, G., Roca, J., Antúnez, C., and Fuentes, L. J. (2014). Phasic and tonic alerting in mild cognitive impairment: a preliminary study. Exp. Gerontol. 49, 35–39. doi: 10.1016/j.exger.2013.11.001
Pubmed Abstract | Pubmed Full Text | CrossRef Full Text | Google Scholar
McConnell, M. M., and Shore, D. I. (2011). Mixing measures: testing an assumption of the Attention Network Test. Atten. Percept. Psychophys. 73, 1096–1107. doi: 10.3758/s13414-010-0085-3
Pubmed Abstract | Pubmed Full Text | CrossRef Full Text | Google Scholar
Mento, G., Tarantino, V., Sarlo, M., and Bisiacchi, P. S. (2013). Automatic temporal expectancy: a high-density event-related potential study. PLoS ONE 1:e62896. doi: 10.1371/journal.pone.0062896
Pubmed Abstract | Pubmed Full Text | CrossRef Full Text | Google Scholar
Missonnier, P., Herrmann, F. R., Richiardi, J., Rodríguez, C., Deiber, M. P., Gold, G., et al. (2013). Attention-related potentials allow for a highly accurate discrimination of mild cognitive impairment subtypes. Neurodegener. Dis. 12, 59–70. doi: 10.1159/000338815
Pubmed Abstract | Pubmed Full Text | CrossRef Full Text | Google Scholar
Nagai, Y., Critchley, H. D., Featherstone, E., Fenwick, P. B., Trimble, M. R., and Dolan, R. J. (2004). Brain activity relating to the contingent negative variation: an fMRI investigation. Neuroimage 21, 1232–1241. doi: 10.1016/j.neuroimage.2003.10.036
Pubmed Abstract | Pubmed Full Text | CrossRef Full Text | Google Scholar
Neuhaus, A. H., Koehler, S., Opgen-Rhein, C., Urbanek, C., Hahn, E., and Dettling, M. (2007). Selective anterior cingulate cortex deficit during conflict solution in schizophrenia: an event-related potential study. J. Psychiatr. Res. 41, 635–644. doi: 10.1016/j.jpsychires.2006.06.012
Pubmed Abstract | Pubmed Full Text | CrossRef Full Text | Google Scholar
Neuhaus, A. H., Trempler, N. R., Hahn, E., Luborzewski, A., Karl, C., Hahn, C., et al. (2010a). Evidence of specificity of a visual P3 amplitude modulation deficit in schizophrenia. Schizophr. Res. 124, 119–126. doi: 10.1016/j.schres.2010.08.014
Pubmed Abstract | Pubmed Full Text | CrossRef Full Text | Google Scholar
Neuhaus, A. H., Urbanek, C., Opgen-Rhein, C., Hahn, E., Ta, T. M., Koehler, S., et al. (2010b). Event-related potentials associated with Attention Network Test. Int. J. Psychophysiol. 76, 72–79. doi: 10.1016/j.ijpsycho.2010.02.005
Pubmed Abstract | Pubmed Full Text | CrossRef Full Text | Google Scholar
Nobre, A. C., Sebestyen, G. N., and Miniussi, C. (2000). The dynamics of shifting visuospatial attention revealed by event-related potentials. Neuropsychologia 38, 964–974. doi: 10.1016/S0028-3932(00)00015-4
Pubmed Abstract | Pubmed Full Text | CrossRef Full Text | Google Scholar
Pascual-Marqui, R. D. (2002). Standardized low-resolution brain electromagnetic tomography (sLORETA): technical details. Methods Find. Exp. Clin. Pharmacol. 24 Suppl. D, 5–12.
Pascual-Marqui, R. D., Esslen, M., Kochi, K., and Lehmann, D. (2002). Functional imaging with low resolution brain electromagnetic tomography (LORETA): a review. Methods Find. Exp. Clin. Pharmacol. 24 Suppl. C, 91–95.
Peelen, M. V., Heslenfeld, D. J., and Theeuwes, J. (2004). Endogenous and exogenous attention shifts are mediated by the same large-scale neural network. Neuroimage 22, 822–830. doi: 10.1016/j.neuroimage.2004.01.044
Pubmed Abstract | Pubmed Full Text | CrossRef Full Text | Google Scholar
Petersen, S. E., and Posner, M. I. (2012). The attention system of the human brain: 20 years after. Annu. Rev. Neurosci. 35, 73–89. doi: 10.1146/annurev-neuro-062111-150525
Pubmed Abstract | Pubmed Full Text | CrossRef Full Text | Google Scholar
Polich, J. (1986). P300 development from auditory stimuli. Psychophisiology 23, 590–597. doi: 10.1111/j.1469-8986.1986.tb00677.x
Pubmed Abstract | Pubmed Full Text | CrossRef Full Text | Google Scholar
Polich, J. (1987). Task difficulty, probability, and inter-stimulus interval as determinants of P300 from auditory stimuli. Electroencephalogr. Clin. Neurophysiol. 68, 311–320. doi: 10.1016/0168-5597(87)90052-9
Pubmed Abstract | Pubmed Full Text | CrossRef Full Text | Google Scholar
Posner, M. I. (1978). Chronometric Explorations of Mind. Hillsdale, NJ: Lawrence Erlbaum Associates.
Posner, M. I., and Petersen, S. E. (1990). The attention system of the human brain. Annu. Rev. Neurosci. 13, 25–42. doi: 10.1146/annurev.ne.13.030190.000325
Pubmed Abstract | Pubmed Full Text | CrossRef Full Text | Google Scholar
Praamstra, P., Kourtis, D., Kwok, H. F., and Oostenveld, R. (2006). Neurophysiology of implicit timing in serial choice reaction-time performance. J. Neurosci. 26, 5448–5455. doi: 10.1523/JNEUROSCI.0440-06.2006
Pubmed Abstract | Pubmed Full Text | CrossRef Full Text | Google Scholar
Ramnani, N., and Owen, A. M. (2004). Anterior prefrontal cortex: in-sights into function from anatomy and neuroimaging, Nat. Rev. Neurosci. 5, 184–194. doi: 10.1038/nrn1343
Pubmed Abstract | Pubmed Full Text | CrossRef Full Text | Google Scholar
Roberts, K. L., Summerfield, A. Q., and Hall, D. A. (2006). Presentation modality influences behavioral measures of alerting, orienting, and executive control. J. Int. Neuropsychol. Soc. 12, 485–492.
Roca, J., Castro, C., López-Ramón, M. F., and Lupiáñez, J. (2011). Measuring vigilance while assessing the functioning of the three attentional networks: the ANTI-Vigilance task. J. Neurosci. Methods 198, 312–324. doi: 10.1016/j.jneumeth.2011.04.014
Pubmed Abstract | Pubmed Full Text | CrossRef Full Text | Google Scholar
Rohrbaugh, J. W., and Gaillard, A. W. K. (1983). “Sensory and motor aspects of the contingent negative variation,” in Tutorials in ERP Research: Endogenous Components, eds A. W. K. Gaillard and W. Ritter (Amsterdam: North-Holland), 269–310.
Rohrbaugh, J. W., Syndulko, K., and Lindsley, D. B. (1976). Brain wave components of the contingent negative variation in humans. Science 191, 1055–1057. doi: 10.1126/science.1251217
Pubmed Abstract | Pubmed Full Text | CrossRef Full Text | Google Scholar
Ruchkin, D. S., Sutton, S., Mahaffey, D., and Glaeser, J. (1986). Terminal CNV in the absence of motor response. Electroencephlogr. Clin. Neurophysiol. 63, 445–463. doi: 10.1016/0013-4694(86)90127-6
Pubmed Abstract | Pubmed Full Text | CrossRef Full Text | Google Scholar
Rusnáková, S., Daniel, P., Chládek, J., Jurák, P., and Rektor, I. (2011). The executive functions in frontal and temporal lobes: a flanker task intracerebral recording study. J. Clin. Neurophysiol. 28, 30–35. doi: 10.1097/WNP.0b013e31820512d4
Pubmed Abstract | Pubmed Full Text | CrossRef Full Text | Google Scholar
Snyder, A. C., Shpaner, M., Molholm, S., and Foxe, J. J. (2012). Visual object processing as a function of stimulus energy, retinal eccentricity and Gestalt configuration: a high-density electrical mapping study. Neuroscience 221, 1–11. doi: 10.1016/j.neuroscience.2012.03.035
Pubmed Abstract | Pubmed Full Text | CrossRef Full Text | Google Scholar
Spronk, M., Jonkman, L. M., and Kemner, C. (2008). Response inhibition and attention processing in 5- to 7-year-old children with and without symptoms of ADHD: an ERP study. Clin. Neurophysiol. 119, 2738–2752. doi: 10.1016/j.clinph.2008.09.010
Pubmed Abstract | Pubmed Full Text | CrossRef Full Text | Google Scholar
Urbanek, C., Weinges-Evers, N., Bellmann-Strobl, J., Bock, M., Dörr, J., Hahn, E., et al. (2010). Attention Network Test reveals alerting network dysfunction in multiple sclerosis. Mult. Scler. 16, 93–99. doi: 10.1177/1352458509350308
Pubmed Abstract | Pubmed Full Text | CrossRef Full Text | Google Scholar
van Boxtel, G., and Brunia, C. H. M. (1994). Motor and non-motor aspects of slow brain potentials. Biol. Psychol. 38, 35–51. doi: 10.1016/0301-0511(94)90048-5
Pubmed Abstract | Pubmed Full Text | CrossRef Full Text | Google Scholar
van Dam, N. T., Sano, M., Mitsis, E. M., Grossman, H. T., Gu, X., Park, Y., et al. (2013). Functional neural correlates of attentional deficits in amnestic mild cognitive impairment. PLoS ONE. 8:e54035. doi: 10.1371/journal.pone.0054035
Pubmed Abstract | Pubmed Full Text | CrossRef Full Text | Google Scholar
van Rijn, H., Kononowicz, T. W., Meck, W. H., Ng, K. K., and Penney, T. B. (2011). CNV and its relation to time estimation. Front. Integr. Neurosci. 5:91. doi: 10.3389/fnint.2011.00091
Walter, W. G., Cooper, R., Aldridge, V. J., McCallum, W. C., and Winter, A. L. (1964). Contingent negative variation: an electric sign of sensorimotor association and expectancy in the human brain. Nature 203, 380–384. doi: 10.1038/203380a0
Pubmed Abstract | Pubmed Full Text | CrossRef Full Text | Google Scholar
Westlye, L. T., Grydeland, H., Walhovd, K. B., and Fjell, A. M. (2011). Associations between regional cortical thickness and attentional networks as measured by the attention network test. Cereb. Cortex 21, 345–356. doi: 10.1093/cercor/bhq101
Pubmed Abstract | Pubmed Full Text | CrossRef Full Text | Google Scholar
Wright, M. J., Geffen, G. M., and Geffen, L. B. (1995). Event related potentials during covert orientation of visual attention: effects of cue validity and directionality. Biol. Psychol. 41, 183–202. doi: 10.1016/0301-0511(95)05128-7
Pubmed Abstract | Pubmed Full Text | CrossRef Full Text | Google Scholar
Yin, X., Zhao, L., Xu, J., Evans, A. C., Fan, L., Ge, H., et al. (2012). Anatomical substrates of the alerting, orienting and executive control components of attention: focus on the posterior parietal lobe. PLoS ONE 7:e50590. doi: 10.1371/journal.pone.0050590
Pubmed Abstract | Pubmed Full Text | CrossRef Full Text | Google Scholar
Zhang, R., Hu, Z., Debi, R., Zhang, L., Li, H., and Liu, Q. (2013). Neural processes underlying the“same”-“different” judgment of two simultaneously presented objects- an EEG study. PLoS ONE 8:e81737. doi: 10.1371/journal.pone.0081737
Pubmed Abstract | Pubmed Full Text | CrossRef Full Text | Google Scholar
Keywords: attention, neural networks, ANT, CNV, source analysis, P300, alerting, orienting
Citation: Galvao-Carmona A, González-Rosa JJ, Hidalgo-Muñoz AR, Páramo D, Benítez ML, Izquierdo G and Vázquez-Marrufo M (2014) Disentangling the attention network test: behavioral, event related potentials, and neural source analyses. Front. Hum. Neurosci. 8:813. doi: 10.3389/fnhum.2014.00813
Received: 11 August 2014; Accepted: 23 September 2014;
Published online: 13 October 2014.
Edited by:
Francesco Di Russo, University of Rome “Foro Italico,” ItalyReviewed by:
Andres H. Neuhaus, Charité University Medicine, GermanyChristopher S. Y. Benwell, University of Glasgow, UK
Copyright © 2014 Galvao-Carmona, González-Rosa, Hidalgo-Muñoz, Páramo, Benítez, Izquierdo and Vázquez-Marrufo. This is an open-access article distributed under the terms of the Creative Commons Attribution License (CC BY). The use, distribution or reproduction in other forums is permitted, provided the original author(s) or licensor are credited and that the original publication in this journal is cited, in accordance with accepted academic practice. No use, distribution or reproduction is permitted which does not comply with these terms.
*Correspondence: Alejandro Galvao-Carmona, Psychophysiology Unit, Department of Experimental Psychology, Faculty of Psychology, University of Seville, Street Camilo José Cela, Seville 41018, Spain e-mail: agalvao@us.es