Synchrony between sensory and cognitive networks is associated with subclinical variation in autistic traits
 Jacob S. Young
 David V. Smith
 Christopher G. Coutlee
 Scott A. Huettel
- 1Pritzker School of Medicine, University of Chicago, Chicago, IL, USA
- 2Department of Psychology, Rutgers University, Newark, NJ, USA
- 3Center for Cognitive Neuroscience, Duke University, Durham, NC, USA
- 4Department of Psychology and Neuroscience, Duke University, Durham, NC, USA
Individuals with autistic spectrum disorders exhibit distinct personality traits linked to attentional, social, and affective functions, and those traits are expressed with varying levels of severity in the neurotypical and subclinical population. Variation in autistic traits has been linked to reduced functional and structural connectivity (i.e., underconnectivity, or reduced synchrony) with neural networks modulated by attentional, social, and affective functions. Yet, it remains unclear whether reduced synchrony between these neural networks contributes to autistic traits. To investigate this issue, we used functional magnetic resonance imaging to record brain activation while neurotypical participants who varied in their subclinical scores on the Autism-Spectrum Quotient (AQ) viewed alternating blocks of social and nonsocial stimuli (i.e., images of faces and of landscape scenes). We used independent component analysis (ICA) combined with a spatiotemporal regression to quantify synchrony between neural networks. Our results indicated that decreased synchrony between the executive control network (ECN) and a face-scene network (FSN) predicted higher scores on the AQ. This relationship was not explained by individual differences in head motion, preferences for faces, or personality variables related to social cognition. Our findings build on clinical reports by demonstrating that reduced synchrony between distinct neural networks contributes to a range of subclinical autistic traits.
Introduction
Navigating our social environment requires us to infer the thoughts, intentions, and goals of others (Saxe, 2006). These social computations are disrupted in a host of psychopathologies (Lyon et al., 1999; Couture et al., 2006; Zucker et al., 2007), particularly autism spectrum disorders (ASD; Pelphrey et al., 2004; Oberman and Ramachandran, 2007). Individuals with ASD exhibit a range of altered attentional, social, and affective functions, as evident with varying levels of severity in the subclinical population (Gerdts and Bernier, 2011). Recent work has attempted to quantify variability in autistic traits—from subclinical to clinical levels—using the Autism-Spectrum Quotient (AQ; Baron-Cohen et al., 2001). This questionnaire provides a broad assessment of multiple areas, including social skills, attention switching, attention to detail, communication, and imagination (Baron-Cohen et al., 2001). Although high scores on the AQ can provide useful diagnostic information regarding ASD (Woodbury-Smith et al., 2005), variation in AQ primarily reflects the extent of autistic traits within an individual, thereby providing information regarding individual differences in autistic traits, even within a subclinical sample (Baron-Cohen et al., 2001).
Understanding the neural bases of variability in the AQ and ASD has emerged as a focal point across several studies in social neuroscience (Adolphs, 2010). Studies employing tasks requiring social cognition and attentional control have implicated a number of brain areas—particularly the amygdala (Ashwin et al., 2007), fusiform gyrus (Dziobek et al., 2010), anterior cingulate cortex (Dichter et al., 2009), and the temporo-parietal junction (Lombardo et al., 2011; von dem Hagen et al., 2011)—in the pathophysiology of autism. Building on these observations, other work has highlighted the importance of underconnectivity—evident as changes in white matter tracts or reduced synchrony in functional magnetic resonance imaging (fMRI) data—within these brain systems (Just et al., 2004, 2007); in other words, greater severity in autistic traits, whether clinical or subclinical, can be associated with reduced connectivity within specific brain systems. Recent findings suggest that reduced connectivity within resting-state networks containing the amygdala is associated with greater severity in autistic traits (von dem Hagen et al., 2013). Such results lead to the specific hypothesis that the interactions between different resting-state networks—particularly during the processing of socially-relevant stimuli such as faces, which convey important social information regarding other individuals (Little et al., 2008)—may be disrupted by variation in autistic traits.
We evaluated whether reduced connectivity between a sensory network related to perception of faces relative to scenes face-scene network (FSN) and a cognitive network containing the anterior cingulate cortex (executive control network (ECN; Smith et al., 2009)) predicted increased autistic traits. To test this hypothesis, we employed fMRI to record brain activation from 47 neurotypical males (i.e., individuals not exhibiting clinical symptoms of autism) viewing alternating blocks of faces and scenes (Figure 1); those individuals also completed the AQ as a behavioral measure of autism-spectrum traits. We used a model-free analytic technique (independent component analysis; ICA) (Beckmann and Smith, 2005) to identify key neural networks and to separate those networks from sources of unwanted variability (e.g., head motion). These networks were then submitted to a spatial regression to reveal how each network responds across time within each participant. Our key analysis focused on individual differences in the synchrony between ECN and FSN (Figure 2). We found that reduced synchrony between ECN and FSN correlated with greater severity in autistic traits (indicated by higher scores on the AQ). These findings suggest that changes in the interactions between large-scale neural networks may contribute to the pattern of altered function observed in individuals along the autism spectrum.
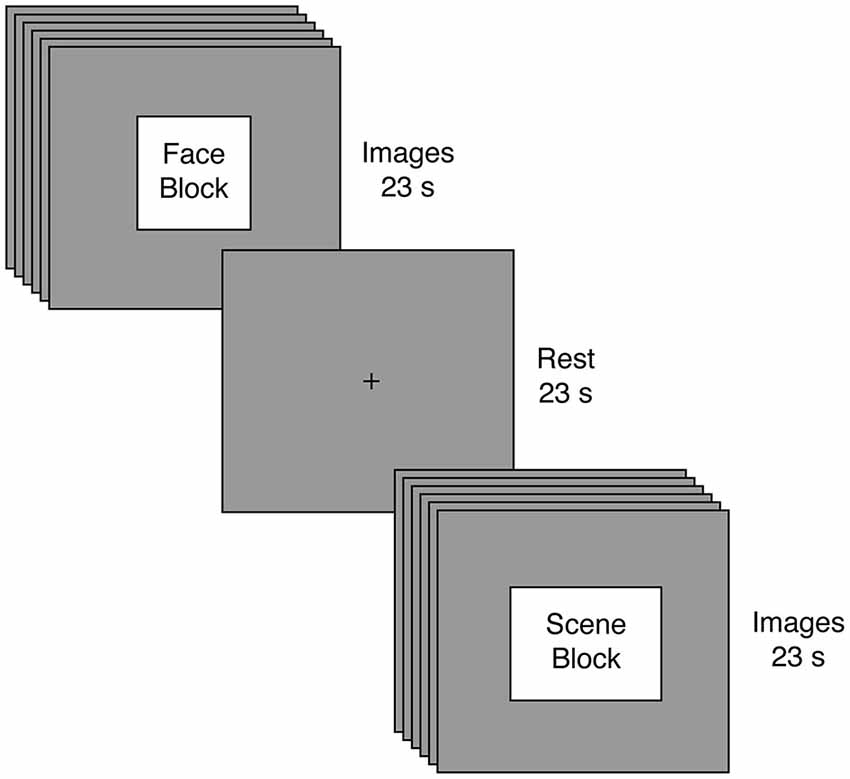
Figure 1. Experimental Task. Participants engaged in a passive visual stimulation paradigm involving alternating blocks of faces and scenes. Blocks were 23 s in duration and comprised six different images, with each image presented for 3 s and followed by a 1 s fixation cross. Following every block of visual stimulation, participants rested for 23 s.
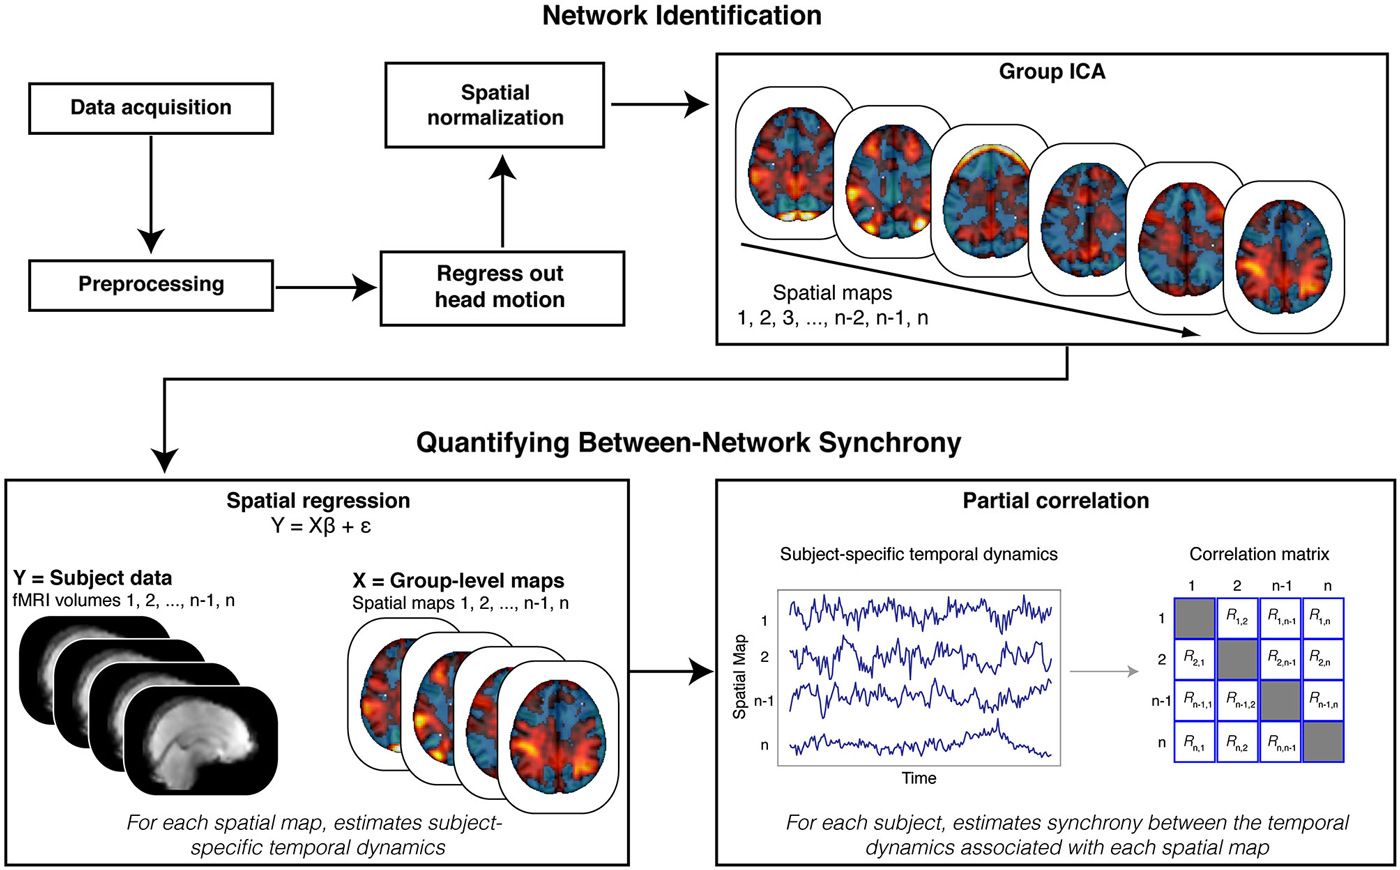
Figure 2. Analysis Schematic. Our analysis proceeded in multiple steps. Data were first preprocessed, and motion parameters and volumes identified as motion spikes were regressed from the data. Filtered data were then spatially transformed into standard (MNI) space. Next, we stacked data across participants and submitted the resulting matrix to a tensorial group independent component analysis (ICA). The ICA produced spatial maps that were then back projected onto the functional data (via spatial regression) to reveal participant-specific time courses for each spatial map. We estimated synchrony between the time courses associated with the spatial maps using partial correlation analyses. Crucially, partial correlation analysis allowed us to quantify, within each participant, the synchrony between each spatial map while controlling for the influence of other, potentially confounding (e.g., head motion), spatial maps.
Materials and Methods
Participants
Forty-seven male young adults completed the study. Prescreening excluded individuals with prior neurological or psychiatric illness. We also excluded three participants prior to data analysis for excessive head motion (see below for motion quality control description), leaving a final sample of 44 for all analyses (mean age: 24.07 years; range: 18–32 years). All procedures and methods were conducted in accordance with guidelines approved by the Institutional Review Board at Duke University Medical Center. Written informed consent was obtained from all participants.
Stimuli and Tasks
Prior to beginning the main task, all participants completed a variant of an unrelated response-time task using visual images (Libedinsky et al., 2011); results from this task will be reported elsewhere. The main task employed passive visual stimulation (Figure 1). Participants viewed eight blocks of face and scene images. Each block presented six images of the same category, but the attractiveness (determined by an independent group and unrelated to our current aims) could either be high or low. Images were presented for 3 s each and were separated by a 1 second fixation interval, yielding a total block length of 23 s for each block. Image blocks were separated by a 23 s fixation interval. To facilitate tensorial decomposition (Beckmann and Smith, 2005), all participants experienced the same stimuli in the same order: Face High Attractiveness, Scene Low Attractiveness, Face Low Attractiveness, Scene High Attractiveness, Scene Low Attractiveness, Face High Attractiveness, Face Low Attractiveness, Scene High Attractiveness. Once again, our key analyses focused on the image category rather than attractiveness.
After completing the scanner portion of the experiment, each participant completed two computer tasks. First, each participant completed a simple rating task where an attractiveness judgment was provided for each image previously seen in the response-time task and in passive viewing task. Each participant’s highest rated face and scene images were then used in a preference task. This task displayed 15 pairs of faces and scenes with identical high ratings, and the participant was asked to indicate which image he preferred. We used the relative number of face vs. scene choices as an idiosyncratic index of preferences; therefore, participants could range from −15 (complete scene preference) to 15 (complete face preference). All tasks were programed using the Psychophysics Toolbox (Version 3) (Brainard, 1997).
Each participant also completed the AQ (Baron-Cohen et al., 2001). As an additional control for personality variables related to social cognition, we also used the interpersonal reactivity index (Davis, 1983), which provided empathetic concern and perceptive-taking subscales.
Image Acquisition
Images were acquired with a General Electric MR750 3.0 Tesla scanner equipped with an 8-channel parallel imaging system. To collect the neuroimaging data, we utilized a T2*-weighted spiral-in sensitivity encoding sequence (acceleration factor = 2), with slices parallel to the axial plane connecting the anterior and posterior commissures (repetition time (TR): 1580 ms; echo time (TE): 30 ms; matrix: 64 × 64; field of view (FOV): 243 mm; voxel size: 3.8 × 3.8 × 3.8 mm; 37 interleaved axial slices acquired in ascending order; flip angle: 70 degrees). The first eight volumes were discarded prior to preprocessing the functional data. To facilitate coregistration and normalization of the functional data, we also acquired whole-brain high-resolution anatomical scans (T1-weighted FSPGR sequence; TR: 7.58 ms; TE: 2.93 ms; matrix: 256 × 256; FOV: 256 mm; voxel size: 1 × 1 × 1 mm; 206 axial slices; flip angle: 12 degrees).
FMRI Preprocessing
We used the FMRIB Software Library (FSL Version 4.1.8)1 package (Smith et al., 2004) for preprocessing. We first motion corrected our data by realigning the time series to the middle volume (Jenkinson et al., 2002). We then skull stripped the non-brain material using the brain extraction tool (Smith, 2002) and corrected for intravolume slice-timing differences using Fourier-space phase shifting to align to the middle slice. After spatially smoothing the images with a 5 mm full-width-half-maximum Gaussian kernel, we applied a high-pass temporal filter to remove signals with periods exceeding 100 s. Finally, each 4-dimensional dataset was grand-mean intensity normalized using a single multiplicative factor. Prior to group analyses, functional data were spatially normalized to the Montreal Neurological Template (MNI) avg152 T1-weighted template (3 mm isotropic resolution) using a 12-parameter affine transformation implemented in FLIRT (Jenkinson and Smith, 2001).
As part of our preprocessing, we also examined three partially correlated metrics summarizing participant-specific data quality: signal-to-fluctuation-noise ratio (SFNR; Friedman and Glover, 2006), mean volume-to-volume head motion, and number of motion spikes within the time series. To identify volumes as motion spikes, we first computed the root-mean-square error (RMSE) of each volume relative to the middle time point; the resulting values were then submitted to a boxplot threshold to identify outliers (i.e., RMSE amplitude exceeded the 75th percentile plus the value of 150% of the interquartile range of RMSE for all volumes in a run). We excluded subjects where any of these measures was extreme relative to other subjects (i.e., beyond the upper or lower 5th percentile in the distribution of values for that specific measure). This procedure created the following exclusion thresholds: SFNR < 34.68; proportion of outlier volumes > 0.121; mean volume-to-volume head motion > 0.204 mm. These thresholds identified three problematic subjects who were excluded from further analysis, leaving a final sample of 44 subjects for all analyses. To improve the data quality in the remaining subjects, we also regressed out variance tied to the motion parameters and also the motion spikes.
General Linear Model
We used FEAT to estimate a general linear model with local autocorrelation. The model included four regressors corresponding to the blocks of image presentation (Face High Attractiveness, Face Low Attractiveness, Scene High Attractiveness, and Scene Low Attractiveness). We also included covariates associated with motion parameters and motion spikes. Our analysis focused on a bidirectional contrast of face blocks relative to scene blocks. We combined data across participants using a mixed-effects model (Beckmann et al., 2003). Brain activations are displayed using MRIcroGL,2 and anatomical labels for local maxima (all coordinates reported in MNI space) were obtained using the Harvard-Oxford Cortical and Subcortical atlases (Zilles and Amunts, 2010).
Independent Component Analyses
To identify large-scale neural networks in the fMRI data, we performed a tensor-based independent components analysis (ICA) using Multivariate Exploratory Linear Decomposition into Independent Components (MELODIC) Version 3.10 within FS (Beckmann and Smith, 2004, 2005). Prior to estimating the ICAs, we demeaned each participant’s functional data and normalized the voxel-wise variance to prevent regions with high variability (e.g., cerebrospinal fluid) from biasing the ICA (Beckmann and Smith, 2004). The resulting dataset was then whitened and projected into a 25-dimensional subspace using probabilistic principal component analysis. Using a fixed-point iteration technique (Hyvärinen, 1999) to optimize for non-Gaussian spatial source distributions, the whitened observations were decomposed into sets of vectors that describe signal variation across the temporal, spatial, and subject domains (Beckmann and Smith, 2005). The estimated component maps were thresholded by dividing the maps by standard deviation of the residual noise and then fitting a Gaussian-Gamma mixture model to the histogram of normalized intensity values (Beckmann and Smith, 2004).
Dual-Regression Analyses
To evaluate individual differences in connectivity with spatial maps identified by the ICA, we employed a dual-regression analytical approach (Filippini et al., 2009; Murty et al., 2014; Smith et al., 2014b; Utevsky et al., 2014). The dual-regression approach first requires a spatial-regression. In this step, spatial maps are regressed onto each participant’s functional data, resulting in a T (time points) × C (components) set of beta coefficients that characterize the within-subject temporal dynamics of each spatial network. In the second temporal-regression step, the resulting temporal dynamics from the first step that describe each network, in each subject, are regressed onto each subject’s functional data. The output of this analysis is a set of spatial maps that quantify each voxel’s connectivity with each network identified with the group ICA, individually for each subject. Importantly, this analysis estimates each voxel’s connectivity with each spatial network while controlling for the influence of other networks—some of which may reflect artifacts, such as head motion and physiological noise.
Quantifying Synchrony Between Networks
We adopted a synchrony analysis based on previous research (Cole et al., 2010). We focused our core analyses on the synchrony between the ECN and the FSN. First, we used a spatial correlation to select the independent component map that best matched the network defined as the ECN in prior work (Smith et al., 2009),3 and the map that best matched the contrast for faces relative to scenes from our GLM model, respectively. Next, the entire set of independent component maps were regressed onto the functional data to reveal participant-specific time courses for each map. These time courses were then submitted to a partial correlation analysis to estimate the synchrony between each network, after accounting for correlations with all other networks (Figure 2). This technique allowed us to control for the influence of shared variance with the other independent components in the functional data, as well as other potential confounds (e.g., head motion). Taken together, this analytical approach is analogous to a between-sessions psychophysical interaction analysis, where functional connectivity (between networks) can be tested for dependency on an inter-subject variable (e.g., AQ scores) (Friston, 2011; O’Reilly et al., 2012).
Results
Identifying Key Sensory and Cognitive Networks
Our analyses focused on the interaction between social and ECN. To identify these networks, we employed two approaches. First, we used a general linear model to compare responses to faces and scenes (see Section Materials and Methods). This analysis revealed canonical areas implicated in processing visual stimuli containing faces (Kanwisher et al., 1997) and scenes (Epstein and Kanwisher, 1998). Specifically, a comparison of responses evoked by viewing faces relative to those evoked by viewing scenes revealed activation in the fusiform face area (Table 1). Likewise, a comparison of responses evoked by viewing scenes relative to those evoked by viewing faces revealed activation in the parahippocampal place area (Table 2).
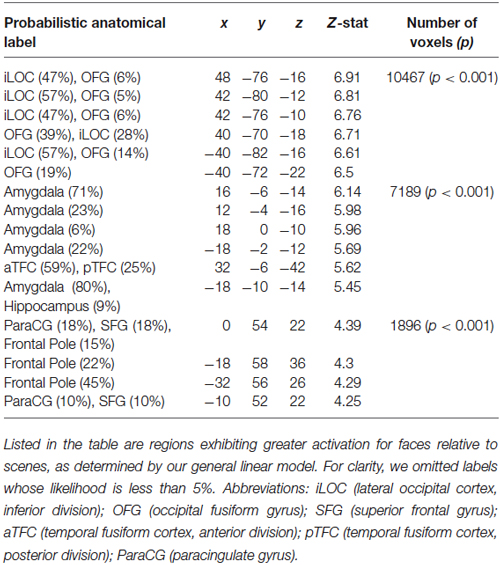
Table 1. Regions responding to faces relative to scenes.
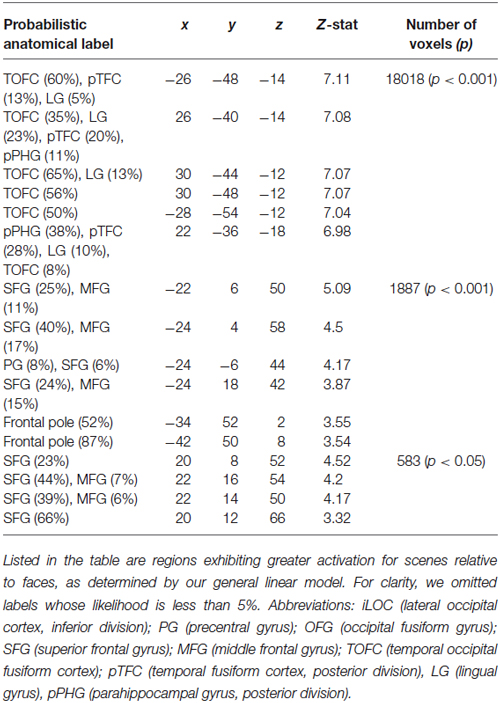
Table 2. Regions responding to scenes relative to faces.
Next, we used independent components analysis (ICA) to identify distinct neural networks modulated by our task (Beckmann and Smith, 2004, 2005; Beckmann, 2012). This analysis produced a set of 25 spatial maps, with some maps resembling artifactual signals (e.g., head motion) and others reflecting cognitive and sensory networks. These independent component maps were then compared (using a spatial correlation analysis) against the contrast image associated with viewing faces relative to viewing scenes. We selected the independent component map with the highest spatial correlation with our contrast image (rmax = 0.71; other maps: rmean = 0.03); hereafter, we refer to this map as our FSN (Figure 3, upper left). We applied a similar spatial correlation approach to identify the ECN identified in prior work (Smith et al., 2009). This canonical spatial map was similar to one independent component map in our data (rmax = 0.30; other maps: rmean = 0.04), which will henceforth be referred to as our ECN (Figure 3, lower left). (We note that some groups label the ECN as a salience network; however, the precise name of the network does not impact our core conclusions because the two names describe the same neuroanatomical network shown in Figure 3).
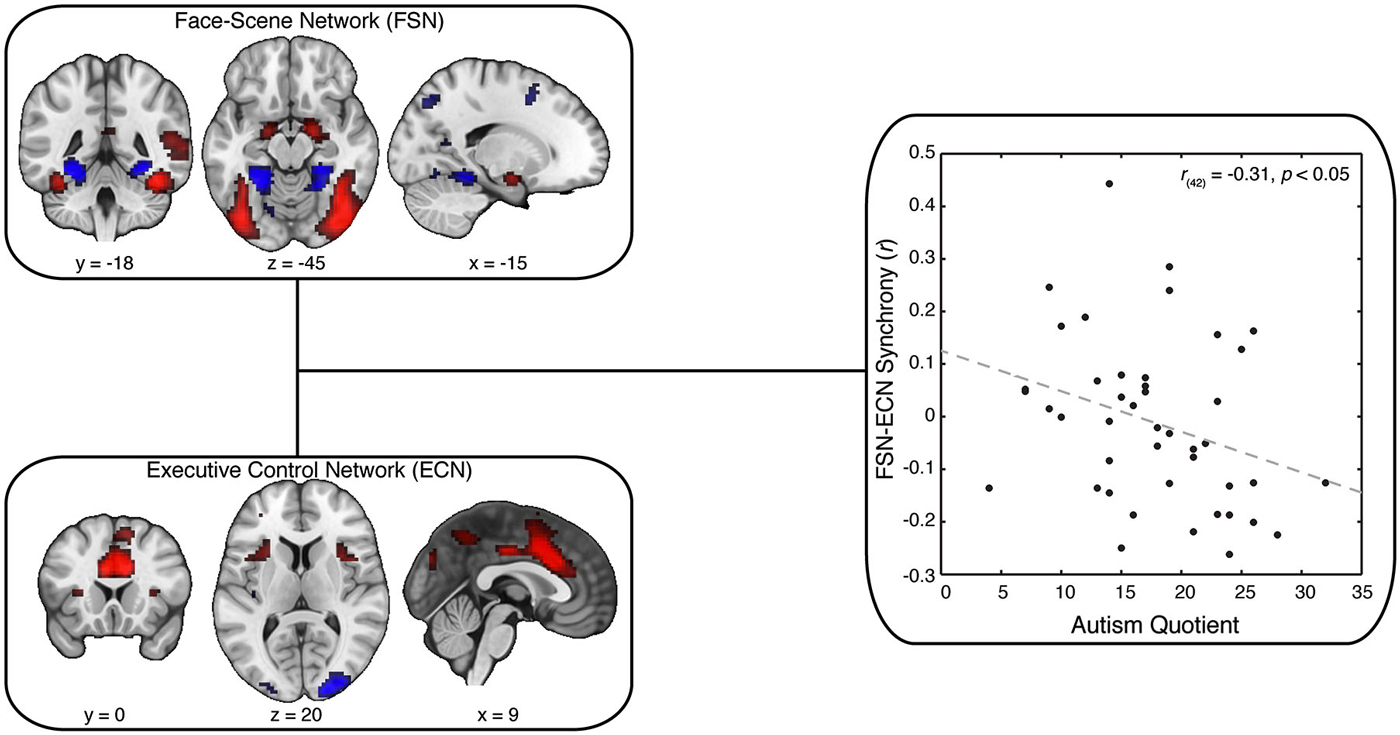
Figure 3. Synchrony Between FSN and ECN Reflect Variation in AQ. Our key analysis focused on synchrony between spatial maps postulated to involve face-scene processing (Face-Scene Network; FSN) and executive control (Executive Control Network; ECN). These maps were selected from our ICA spatial maps using spatial correlation: FSN was matched to the general-linear model output associated with a contrast of faces minus scenes; ECN was matched to an independent reference map derived from another study (Smith et al., 2009). Strikingly, we found that decreased synchrony between FSN and ECN predicted greater scores on the Autism Quotient (AQ). Crucially, this result was not explained by individual differences in head motion, data quality, or personality variables related to social cognition.
Reduced Synchrony between ECN and FSN Reflects Increased Autistic Traits
We next examined whether the ECN and FSN contribute to variation in autistic traits. We predicted autistic traits would be associated with the synchrony between the ECN and FSN. To test this prediction, we adopted a two-stage analytical approach (Figure 2; Cole et al., 2010). First, all spatial maps—those associated with signal and those associated with noise—are regressed onto each participant’s functional data to recover participant-specific temporal dynamics associated with each network. Second, these temporal dynamics are then submitted to a partial correlation analysis to estimate the participant-specific synchrony between each map while controlling for the influence of other, potentially confounding, maps. The resulting synchrony measures were then correlated with AQ scores. We found that reduced synchrony between ECN and FSN predicted increased autistic traits (r(42) = −0.31, p < 0.05; Figure 3, right). To evaluate the uncertainty associated with this correlation, we bootstrapped the effect size (N = 10,000) and identified the 95% confidence interval, which was bounded by −0.05 and −0.55. Although this confidence interval indicates that the true effect is likely small, we emphasize that a relatively small effect is to be expected given a large sample and the use of measures with imperfect reliability (Vul et al., 2009; Yarkoni, 2009).
Thus, to increase our confidence in the validity of our effect and rule out potentially confounding variables we conducted a series of post hoc control analyses. We first examined the relationship between autistic traits and preferences for faces relative to scenes. Although most subjects exhibited a slight bias toward choosing faces over scenes (mean = 4.22; range = −15:15), these preferences were not correlated with AQ scores (r(42) = 0.18, p = 0.24). Next, we evaluated whether the relationship between ECN-FSN synchrony and autistic traits was explained by individual differences in other, potentially confounding factors related to data quality and personality characteristics. To do this, we employed a hierarchical regression method that regressed ECN-FSN synchrony onto two blocks of factors. First, we included five regressors relating to individual differences in data quality (motion spikes and SFNR; Friedman and Glover, 2006), preferences between faces and scenes, and personality variables related to social cognition (perspective-taking abilities and empathic-concern) (Davis, 1983). This set of factors failed to explain significant variation in ECN-FSN synchrony (r2 = 0.02; F(5,38) = 0.19, p = 0.96). Second, we added AQ scores to our regression model. We found that the addition of AQ scores significantly improved the fit our model (Δ r2 = 0.10; F(1,37) = 4.30, p < 0.05). In addition, AQ scores were significantly associated with ECN-FSN synchrony (t(37) = −2.07, p < 0.05) (Table 3).
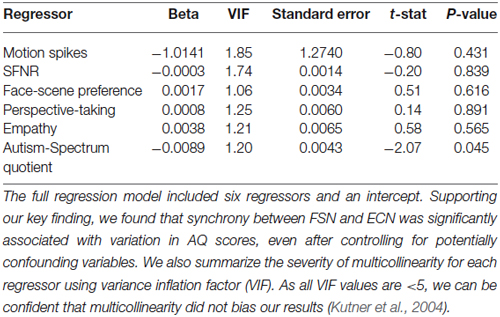
Table 3. Regression statistics.
In a separate post hoc control analysis, we also examined the specificity of the relationship between AQ scores and ECN-FSN synchrony. Although our partial correlation analysis (Figure 2) estimates inter-network synchrony while controlling for the influence of potentially confounding variables (e.g., other networks), it remains possible that the relationship between AQ scores and network synchrony is driven by responses to the task. To rule out this explanation, we quantified synchrony between the FSN and the default-mode network (DMN), an alternative large-scale network implicated in a host of cognitive processes (Buckner et al., 2008; Mars et al., 2012). We found that FSN-DMN synchrony was not associated with variation in AQ scores (r(42) = 0.01, p = 0.95). This observation therefore increases confidence in the specificity of our key finding.
For completeness, we also examined whether AQ scores significantly modulated voxelwise functional connectivity with either ECN or FSN. To test this relationship, we expanded our synchrony analysis into a dual-regression analysis by regressing the time course of each voxel onto the temporal dynamics for all networks (Filippini et al., 2009; Smith et al., 2014b; Utevsky et al., 2014) (see Section Methods). This analysis failed to reveal any voxels whose functional connectivity with FSN or ECN decreased (or increased) as a function of AQ scores. Although it is challenging to interpret the absence of an effect, these observations suggest that the computations related to AQ and tied to ECN and FSN are distributed across each network (Friston, 2011; Smith et al., 2014b).
Discussion
Navigating social interactions is essential in everyday life, yet even basic social interactions can pose tremendous difficulty for individuals with ASD—and even for individuals who lack a formal diagnosis of autism but who share autism spectrum traits. Researchers investigating the neural bases of autism have consistently highlighted the importance of atypical connectivity (Supekar et al., 2013), particularly underconnectivity (i.e., reduced connectivity) across brain regions (Just et al., 2004, 2007). We predicted that increased autistic traits would be associated with reduced synchrony between two distinct neural networks implicated in cognitive control and face processing. To test this prediction, we used a model-free ICA in conjunction with a partial correlation analysis to characterize synchrony between large-scale neural networks. We found that reduced synchrony between the ECN and a FSN correlated with increased AQ scores within a subclinical population.
Our findings are consistent with previous work linking underconnectivity to autistic traits (Just et al., 2007; Di Martino et al., 2011; Müller et al., 2011). Reduced connectivity has reliably been observed with regions involved in face and visual information processing (Villalobos et al., 2005; Kleinhans et al., 2008). In addition, tasks requiring executive control have revealed that individuals with autism exhibit reduced connectivity with dorsolateral prefrontal cortex (Koshino et al., 2005). More recent observations have suggested that increased autistic traits are also associated with reduced frontostriatal connectivity (Sims et al., 2014). Although these diverse findings hint that neither autism nor autistic spectrum traits result from a single factor in isolation (Happé et al., 2006), recent work has attempted to understand how underconnectivity disrupts the integration of information (Just et al., 2004, 2007). Accordingly, reduced synchrony between the ECN and FSN networks may suggest difficulty in integrating information across sensory and cognitive processes. Nevertheless, we note that other interpretations are also possible. For example, the association between ECN-FSN synchrony and autistic traits might reflect an individual’s ability to discern the emotional states of the faces (Alaerts et al., 2014). Alternatively, reduced synchrony between ECN and FSN could represent a decrease in the reward valuation and processing of these facial images (Sims et al., 2014). While more work is needed to discern exactly how individual differences in ECN-FSN connectivity are influencing the behavioral and personality traits seen in autistic individuals, we believe our findings fit with other studies linking underconnectivity to autistic traits.
Unlike the majority of previous work examining functional underconnectivity and autistic traits, we focused on reduced connectivity between distinct, large-scale neural networks. Our approach allowed us to estimate how interactions between the ECN and FSN contribute to variation in autistic traits while controlling for potential confounds related to head motion. Controlling for head motion is crucial in functional connectivity studies (Power et al., 2012), particularly those examining between-subject differences (Satterthwaite et al., 2012), such as variation in autistic traits. Additionally, our study also expands on the findings of prior observations that have been limited to resting-state functional connectivity. Although one previous study has examined resting-state connectivity between networks in autistic individuals (von dem Hagen et al., 2013), our task utilized alternating blocks of social and nonsocial visual stimulation to drive changes in processing, which may be an important consideration given the social deficits observed in individual exhibiting a range of subclinical and clinical autistic traits. Yet, we note that directly linking task conditions (e.g., social and nonsocial) to reduced synchrony would require a resting-state control scan (Utevsky et al., 2014) and/or an alternative paradigm amenable to modeling task-dependent changes in connectivity using a beta-series correlation approach (Rissman et al., 2004). While these considerations could help illuminate how task conditions influence synchrony, we emphasize that our core conclusion is agnostic on the role of task conditions and network synchrony. Taken together, our results complement and extend prior work examining how reduced connectivity contributes to a range of autistic traits.
Nevertheless, we note that some limitations accompany our results. First, we did not examine task-dependent changes in connectivity in this study. Thus, our synchrony results—like those reported elsewhere (Cole et al., 2010)—could partially reflect changes in the activation of each network (Friston, 2011). Also, because our FSN arises because of differences in the brain responses to faces and scenes, we cannot be sure that our results are driven by neural processing specific to faces. Future work could build on our results by isolating specific features or qualities of facial stimuli—such as their emotional expression (Ashwin et al., 2007), attractiveness (Smith et al., 2014a), or perceived status (Utevsky and Platt, 2014)—and showing that variability in those features drives the connectivity changes we observed. In addition, although we controlled for head motion and other potential confounds, we note that other, unmeasured factors may contribute to our findings. For example, AQ scores have been linked to other personality variables, including extraversion, neuroticism, and conscientiousness (Wakabayashi et al., 2006). Other studies have also found associations between AQ and empathic abilities and systemizing tendencies (Wheelwright et al., 2006) as well as social responsiveness (Armstrong and Iarocci, 2013). Although we did not measure these variables in our study, we emphasize that our results were not explained by individual differences in empathetic concern or perceptive-taking subscales of the interpersonal reactivity index (Davis, 1983). Future studies could further mitigate these caveats with larger (and more diverse) samples and a larger array of personality measures.
In summary, our results suggest that the synchrony between large-scale neural networks can contribute to the severity of subclinical autistic traits, as measured by the AQ. Examining synchrony between large-scale neural networks may provide enhanced sensitivity for detecting subtle abnormalities associated with autistic traits (Tyszka et al., 2014). We speculate that the relationship between large-scale neural networks could have broad implications for social and cognitive neuroscience. For instance, network synchrony measures may facilitate comparative studies of social cognition by grounding questions on the dynamics of large-scale neural networks (Hecht et al., 2013). Additionally, our analytic approach may have implications for understanding other disorders as well. For example, it remains unclear how the synchrony between large-scale neural networks contributes to depression (Greicius et al., 2007), schizophrenia (Calhoun et al., 2009), and anorexia (Watson et al., 2010). In the future, clinicians could potentially use network synchrony measures as a biomarker for the severity of various personality disorders.
Human Subjects Certification
All procedures and methods were conducted in accordance with guidelines approved by the Institutional Review Board at Duke University Medical Center. Written informed consent was obtained from all participants (text is reproduced in Section Methods).
Author Contributions
DVS, JSY, CGC, and SAH designed research; DVS, JSY, CGC, and SAH performed research; DVS and JSY analyzed data under the supervision of SAH; DVS, JSY, CGC, and SAH wrote the paper.
Conflict of Interest Statement
The authors declare that the research was conducted in the absence of any commercial or financial relationships that could be construed as a potential conflict of interest.
Acknowledgments
This study was funded by National Institutes of Health grant RC1-MH88680 (SAH), an Incubator Award from the Duke Institute for Brain Sciences (SAH), and National Research Service Award F32-MH107175 (DVS). Neuroimaging data can be provided upon request.
Footnotes
- ^ www.fmrib.ox.ac.uk/fsl/
- ^ www.mccauslandcenter.sc.edu/mricrogl/
- ^ See http://fsl.fmrib.ox.ac.uk/analysis/brainmap+rsns/
References
Adolphs, R. (2010). Conceptual challenges and directions for social neuroscience. Neuron 65, 752–767. doi: 10.1016/j.neuron.2010.03.006
PubMed Abstract | Full Text | CrossRef Full Text | Google Scholar
Alaerts, K., Woolley, D. G., Steyaert, J., Di Martino, A., Swinnen, S. P., and Wenderoth, N. (2014). Underconnectivity of the superior temporal sulcus predicts emotion recognition deficits in autism. Soc. Cogn. Affect. Neurosci. 9, 1589–1600. doi: 10.1093/scan/nst156
PubMed Abstract | Full Text | CrossRef Full Text | Google Scholar
Armstrong, K., and Iarocci, G. (2013). Brief report: the autism spectrum quotient has convergent validity with the social responsiveness scale in a high-functioning sample. J. Autism Dev. Disord. 43, 2228–2232. doi: 10.1007/s10803-013-1769-z
PubMed Abstract | Full Text | CrossRef Full Text | Google Scholar
Ashwin, C., Baron-Cohen, S., Wheelwright, S., O’Riordan, M., and Bullmore, E. T. (2007). Differential activation of the amygdala and the ‘social brain’ during fearful face-processing in Asperger syndrome. Neuropsychologia 45, 2–14. doi: 10.1016/j.neuropsychologia.2006.04.014
PubMed Abstract | Full Text | CrossRef Full Text | Google Scholar
Baron-Cohen, S., Wheelwright, S., Skinner, R., Martin, J., and Clubley, E. (2001). The Autism-Spectrum Quotient (Aq): evidence from Asperger syndrome/high-functioning autism, malesand females, scientists and mathematicians. J. Autism Dev. Disord. 31, 5–17. doi: 10.1023/A:1005653411471
PubMed Abstract | Full Text | CrossRef Full Text | Google Scholar
Beckmann, C. F. (2012). Modelling with independent components. Neuroimage 62, 891–901. doi: 10.1016/j.neuroimage.2012.02.020
PubMed Abstract | Full Text | CrossRef Full Text | Google Scholar
Beckmann, C. F., Jenkinson, M., and Smith, S. M. (2003). General multilevel linear modeling for group analysis in FMRI. Neuroimage 20, 1052–1063. doi: 10.1016/s1053-8119(03)00435-x
PubMed Abstract | Full Text | CrossRef Full Text | Google Scholar
Beckmann, C. F., and Smith, S. M. (2004). Probabilistic independent component analysis for functional magnetic resonance imaging. IEEE Trans. Med. Imaging 23, 137–152. doi: 10.1109/tmi.2003.822821
PubMed Abstract | Full Text | CrossRef Full Text | Google Scholar
Beckmann, C. F., and Smith, S. M. (2005). Tensorial extensions of independent component analysis for multisubject FMRI analysis. Neuroimage 25, 294–311. doi: 10.1016/j.neuroimage.2004.10.043
PubMed Abstract | Full Text | CrossRef Full Text | Google Scholar
Brainard, D. H. (1997). The psychophysics toolbox. Spat. Vis. 10, 443–446. doi: 10.1163/156856897x00357
PubMed Abstract | Full Text | CrossRef Full Text | Google Scholar
Buckner, R. L., Andrews-Hanna, J. R., and Schacter, D. L. (2008). The brain’s default network: anatomy, function and relevance to disease. Ann. N Y Acad. Sci. 1124, 1–38. doi: 10.1196/annals.1440.011
PubMed Abstract | Full Text | CrossRef Full Text | Google Scholar
Calhoun, V. D., Eichele, T., and Pearlson, G. (2009). Functional brain networks in schizophrenia: a review. Front. Hum. Neurosci. 3:17. doi: 10.3389/neuro.09.017.2009
PubMed Abstract | Full Text | CrossRef Full Text | Google Scholar
Cole, D. M., Beckmann, C. F., Long, C. J., Matthews, P. M., Durcan, M. J., and Beaver, J. D. (2010). Nicotine replacement in abstinent smokers improves cognitive withdrawal symptoms with modulation of resting brain network dynamics. Neuroimage 52, 590–599. doi: 10.1016/j.neuroimage.2010.04.251
PubMed Abstract | Full Text | CrossRef Full Text | Google Scholar
Couture, S. M., Penn, D. L., and Roberts, D. L. (2006). The functional significance of social cognition in schizophrenia: a review. Schizophr. Bull. 32(Suppl. 1), S44–S63. doi: 10.1093/schbul/sbl029
PubMed Abstract | Full Text | CrossRef Full Text | Google Scholar
Davis, M. H. (1983). Measuring individual differences in empathy: evidence for a multidimensional approach. J. Pers. Soc. Psychol. 44, 113–126. doi: 10.1037/0022-3514.44.1.113
Dichter, G. S., Felder, J. N., and Bodfish, J. W. (2009). Autism is characterized by dorsal anterior cingulate hyperactivation during social target detection. Soc. Cogn. Affect. Neurosci. 4, 215–226. doi: 10.1093/scan/nsp017
PubMed Abstract | Full Text | CrossRef Full Text | Google Scholar
Di Martino, A., Kelly, C., Grzadzinski, R., Zuo, X. N., Mennes, M., Mairena, M. A., et al. (2011). Aberrant striatal functional connectivity in children with autism. Biol. Psychiatry 69, 847–856. doi: 10.1016/j.biopsych.2010.10.029
PubMed Abstract | Full Text | CrossRef Full Text | Google Scholar
Dziobek, I., Bahnemann, M., Convit, A., and Heekeren, H. R. (2010). The role of the fusiform-amygdala system in the pathophysiology of autism. Arch. Gen. Psychiatry 67, 397–405. doi: 10.1001/archgenpsychiatry.2010.31
PubMed Abstract | Full Text | CrossRef Full Text | Google Scholar
Epstein, R., and Kanwisher, N. (1998). A cortical representation of the local visual environment. Nature 392, 598–601. doi: 10.1038/33402
PubMed Abstract | Full Text | CrossRef Full Text | Google Scholar
Filippini, N., MacIntosh, B. J., Hough, M. G., Goodwin, G. M., Frisoni, G. B., Smith, S. M., et al. (2009). Distinct patterns of brain activity in young carriers of the APOE-ε4 allele. Proc. Natl. Acad. Sci. U S A 106, 7209–7214. doi: 10.1073/pnas.0811879106
PubMed Abstract | Full Text | CrossRef Full Text | Google Scholar
Friedman, L., Glover, G. H., and The FBIRN Consortium. (2006). Reducing interscanner variability of activation in a multicenter fMRI study: controlling for Signal-to-Fluctuation-Noise-Ratio (SFNR) differences. Neuroimage 33, 471–481. doi: 10.1016/j.neuroimage.2006.07.012
PubMed Abstract | Full Text | CrossRef Full Text | Google Scholar
Friston, K. J. (2011). Functional and effective connectivity: a review. Brain Connect. 1, 13–36. doi: 10.1089/brain.2011.0008
PubMed Abstract | Full Text | CrossRef Full Text | Google Scholar
Gerdts, J., and Bernier, R. (2011). The broader autism phenotype and its implications on the etiology and treatment of autism spectrum disorders. Autism Res. Treat. 2011:545901. doi: 10.1155/2011/545901
PubMed Abstract | Full Text | CrossRef Full Text | Google Scholar
Greicius, M. D., Flores, B. H., Menon, V., Glover, G. H., Solvason, H. B., Kenna, H., et al. (2007). Resting-state functional connectivity in major depression: abnormally increased contributions from subgenual cingulate cortex and thalamus. Biol. Psychiatry 62, 429–437. doi: 10.1016/j.biopsych.2006.09.020
PubMed Abstract | Full Text | CrossRef Full Text | Google Scholar
Happé, F., Ronald, A., and Plomin, R. (2006). Time to give up on a single explanation for autism. Nat. Neurosci. 9, 1218–1220. doi: 10.1038/nn1770
PubMed Abstract | Full Text | CrossRef Full Text | Google Scholar
Hecht, E. E., Gutman, D. A., Preuss, T. M., Sanchez, M. M., Parr, L. A., and Rilling, J. K. (2013). Process versus product in social learning: comparative diffusion tensor imaging of neural systems for action execution-observation matching in macaques, chimpanzees and humans. Cereb. Cortex 23, 1014–1024. doi: 10.1093/cercor/bhs097
PubMed Abstract | Full Text | CrossRef Full Text | Google Scholar
Hyvärinen, A. (1999). Fast and robust fixed-point algorithms for independent component analysis. IEEE Trans. Neural Netw. 10, 626–634. doi: 10.1109/72.761722
PubMed Abstract | Full Text | CrossRef Full Text | Google Scholar
Jenkinson, M., Bannister, P., Brady, M., and Smith, S. (2002). Improved optimization for the robust and accurate linear registration and motion correction of brain images. Neuroimage 17, 825–841. doi: 10.1006/nimg.2002.1132
PubMed Abstract | Full Text | CrossRef Full Text | Google Scholar
Jenkinson, M., and Smith, S. (2001). A global optimisation method for robust affine registration of brain images. Med. Image Anal. 5, 143–156. doi: 10.1016/s1361-8415(01)00036-6
PubMed Abstract | Full Text | CrossRef Full Text | Google Scholar
Just, M. A., Cherkassky, V. L., Keller, T. A., Kana, R. K., and Minshew, N. J. (2007). Functional and anatomical cortical underconnectivity in autism: evidence from an FMRI study of an executive function task and corpus callosum morphometry. Cereb. Cortex 17, 951–961. doi: 10.1093/cercor/bhl006
PubMed Abstract | Full Text | CrossRef Full Text | Google Scholar
Just, M. A., Cherkassky, V. L., Keller, T. A., and Minshew, N. J. (2004). Cortical activation and synchronization during sentence comprehension in high-functioning autism: evidence of underconnectivity. Brain 127(Pt. 8), 1811–1821. doi: 10.1093/brain/awh199
PubMed Abstract | Full Text | CrossRef Full Text | Google Scholar
Kanwisher, N., McDermott, J., and Chun, M. M. (1997). The fusiform face area: a module in human extrastriate cortex specialized for face perception. J. Neurosci. 17, 4302–4311.
Kleinhans, N. M., Richards, T., Sterling, L., Stegbauer, K. C., Mahurin, R., Johnson, L. C., et al. (2008). Abnormal functional connectivity in autism spectrum disorders during face processing. Brain 131(Pt. 4), 1000–1012. doi: 10.1093/brain/awm334
PubMed Abstract | Full Text | CrossRef Full Text | Google Scholar
Koshino, H., Carpenter, P. A., Minshew, N. J., Cherkassky, V. L., Keller, T. A., and Just, M. A. (2005). Functional connectivity in an fMRI working memory task in high-functioning autism. Neuroimage 24, 810–821. doi: 10.1016/j.neuroimage.2004.09.028
PubMed Abstract | Full Text | CrossRef Full Text | Google Scholar
Kutner, M., Nachtsheim, C., and Neter, J. (2004). Applied Linear Regression Models. 4th Edn. New York: McGraw-Hill/Irwin.
Libedinsky, C., Smith, D. V., Teng, C. S., Namburi, P., Chen, V. W., Huettel, S. A., et al. (2011). Sleep deprivation alters valuation signals in the ventromedial prefrontal cortex. Front. Behav. Neurosci. 5:70. doi: 10.3389/fnbeh.2011.00070
PubMed Abstract | Full Text | CrossRef Full Text | Google Scholar
Little, A. C., Jones, B. C., Waitt, C., Tiddeman, B. P., Feinberg, D. R., Perrett, D. I., et al. (2008). Symmetry is related to sexual dimorphism in faces: data across culture and species. PLoS One 3:e2106. doi: 10.1371/journal.pone.0002106
PubMed Abstract | Full Text | CrossRef Full Text | Google Scholar
Lombardo, M. V., Chakrabarti, B., Bullmore, E. T., MRC AIMS Consortium, and Baron-Cohen, S. (2011). Specialization of right temporo-parietal junction for mentalizing and its relation to social impairments in autism. Neuroimage 56, 1832–1838. doi: 10.1016/j.neuroimage.2011.02.067
PubMed Abstract | Full Text | CrossRef Full Text | Google Scholar
Lyon, H. M., Startup, M., and Bentall, R. P. (1999). Social cognition and the manic defense: attributions, selective attention and self-schema in bipolar affective disorder. J. Abnorm. Psychol. 108, 273–282. doi: 10.1037/0021-843x.108.2.273
PubMed Abstract | Full Text | CrossRef Full Text | Google Scholar
Mars, R. B., Neubert, F. X., Noonan, M. P., Sallet, J., Toni, I., and Rushworth, M. F. (2012). On the relationship between the “default mode network” and the “social brain”. Front. Hum. Neurosci. 6:189. doi: 10.3389/fnhum.2012.00189
PubMed Abstract | Full Text | CrossRef Full Text | Google Scholar
Müller, R. A., Shih, P., Keehn, B., Deyoe, J. R., Leyden, K. M., and Shukla, D. K. (2011). Underconnected, but how? A survey of functional connectivity MRI studies in autism spectrum disorders. Cereb. Cortex 21, 2233–2243. doi: 10.1093/cercor/bhq296
PubMed Abstract | Full Text | CrossRef Full Text | Google Scholar
Murty, V. P., Shermohammed, M., Smith, D. V., Carter, R. M., Huettel, S. A., and Adcock, R. A. (2014). Resting state networks distinguish human ventral tegmental area from substantia nigra. Neuroimage 100, 580–589. doi: 10.1016/j.neuroimage.2014.06.047
PubMed Abstract | Full Text | CrossRef Full Text | Google Scholar
Oberman, L. M., and Ramachandran, V. S. (2007). The simulating social mind: the role of the mirror neuron system and simulation in the social and communicative deficits of autism spectrum disorders. Psychol. Bull. 133, 310–327. doi: 10.1037/0033-2909.133.2.310
PubMed Abstract | Full Text | CrossRef Full Text | Google Scholar
O’Reilly, J. X., Woolrich, M. W., Behrens, T. E., Smith, S. M., and Johansen-Berg, H. (2012). Tools of the trade: psychophysiological interactions and functional connectivity. Soc. Cogn. Affect. Neurosci. 7, 604–609. doi: 10.1093/scan/nss055
PubMed Abstract | Full Text | CrossRef Full Text | Google Scholar
Pelphrey, K., Adolphs, R., and Morris, J. P. (2004). Neuroanatomical substrates of social cognition dysfunction in autism. Ment. Retard. Dev. Disabil. Res. Rev. 10, 259–271. doi: 10.1002/mrdd.20040
PubMed Abstract | Full Text | CrossRef Full Text | Google Scholar
Power, J. D., Barnes, K. A., Snyder, A. Z., Schlaggar, B. L., and Petersen, S. E. (2012). Spurious but systematic correlations in functional connectivity mri networks arise from subject motion. Neuroimage 59, 2142–2154. doi: 10.1016/j.neuroimage.2011.10.018
PubMed Abstract | Full Text | CrossRef Full Text | Google Scholar
Rissman, J., Gazzaley, A., and D’Esposito, M. (2004). Measuring functional connectivity during distinct stages of a cognitive task. Neuroimage 23, 752–763. doi: 10.1016/j.neuroimage.2004.06.035
PubMed Abstract | Full Text | CrossRef Full Text | Google Scholar
Satterthwaite, T. D., Wolf, D. H., Loughead, J., Ruparel, K., Elliott, M. A., Hakonarson, H., et al. (2012). Impact of in-scanner head motion on multiple measures of functional connectivity: relevance for studies of neurodevelopment in youth. Neuroimage 60, 623–632. doi: 10.1016/j.neuroimage.2011.12.063
PubMed Abstract | Full Text | CrossRef Full Text | Google Scholar
Saxe, R. (2006). Uniquely human social cognition. Curr. Opin. Neurobiol. 16, 235–239. doi: 10.1016/j.conb.2006.03.001
PubMed Abstract | Full Text | CrossRef Full Text | Google Scholar
Sims, T. B., Neufeld, J., Johnstone, T., and Chakrabarti, B. (2014). Autistic traits modulate frontostriatal connectivity during processing of rewarding faces. Soc. Cogn. Affect. Neurosci. 9, 2010–2016. doi: 10.1093/scan/nsu010
PubMed Abstract | Full Text | CrossRef Full Text | Google Scholar
Smith, S. M. (2002). Fast robust automated brain extraction. Hum. Brain Mapp. 17, 143–155. doi: 10.1002/hbm.10062
PubMed Abstract | Full Text | CrossRef Full Text | Google Scholar
Smith, D. V., Clithero, J. A., Boltuck, S. E., and Huettel, S. A. (2014a). Functional connectivity with ventromedial prefrontal cortex reflects subjective value for social rewards. Soc. Cogn. Affect. Neurosci. 9, 2017–2025. doi: 10.1093/scan/nsu005
PubMed Abstract | Full Text | CrossRef Full Text | Google Scholar
Smith, S. M., Fox, P. T., Miller, K. L., Glahn, D. C., Fox, P. M., Mackay, C. E., et al. (2009). Correspondence of the brain’s functional architecture during activation and rest. Proc. Natl. Acad. Sci. U S A 106, 13040–13045. doi: 10.1073/pnas.0905267106
PubMed Abstract | Full Text | CrossRef Full Text | Google Scholar
Smith, S. M., Jenkinson, M., Woolrich, M. W., Beckmann, C. F., Behrens, T. E., Johansen-Berg, H., et al. (2004). Advances in functional and structural MR image analysis and implementation as FSL. Neuroimage 23(Suppl. 1), S208–S219. doi: 10.1016/j.neuroimage.2004.07.051
PubMed Abstract | Full Text | CrossRef Full Text | Google Scholar
Smith, D. V., Utevsky, A. V., Bland, A. R., Clement, N., Clithero, J. A., Harsch, A. E., et al. (2014b). Characterizing individual differences in functional connectivity using dual-regression and seed-based approaches. Neuroimage 95, 1–12. doi: 10.1016/j.neuroimage.2014.03.042
PubMed Abstract | Full Text | CrossRef Full Text | Google Scholar
Supekar, K., Uddin, L. Q., Khouzam, A., Phillips, J., Gaillard, W. D., Kenworthy, L. E., et al. (2013). Brain hyperconnectivity in children with autism and its links to social deficits. Cell Rep. 5, 738–747. doi: 10.1016/j.celrep.2013.10.001
PubMed Abstract | Full Text | CrossRef Full Text | Google Scholar
Tyszka, J. M., Kennedy, D. P., Paul, L. K., and Adolphs, R. (2014). Largely typical patterns of resting-state functional connectivity in high-functioning adults with autism. Cereb. Cortex 24, 1894–1905. doi: 10.1093/cercor/bht040
PubMed Abstract | Full Text | CrossRef Full Text | Google Scholar
Utevsky, A. V., and Platt, M. L. (2014). Status and the brain. PLoS Biol. 12:e1001941. doi: 10.1371/journal.pbio.1001941
PubMed Abstract | Full Text | CrossRef Full Text | Google Scholar
Utevsky, A. V., Smith, D. V., and Huettel, S. A. (2014). Precuneus is a functional core of the default-mode network. J. Neurosci. 34, 932–940. doi: 10.1523/JNEUROSCI.4227-13.2014
PubMed Abstract | Full Text | CrossRef Full Text | Google Scholar
Villalobos, M. E., Mizuno, A., Dahl, B. C., Kemmotsu, N., and Müller, R. A. (2005). Reduced functional connectivity between V1 and inferior frontal cortex associated with visuomotor performance in autism. Neuroimage 25, 916–925. doi: 10.1016/j.neuroimage.2004.12.022
PubMed Abstract | Full Text | CrossRef Full Text | Google Scholar
von dem Hagen, E. A. H., Nummenmaa, L., Yu, R., Engell, A. D., Ewbank, M. P., and Calder, A. J. (2011). Autism spectrum traits in the typical population predict structure and function in the posterior superior temporal sulcus. Cereb. Cortex 21, 493–500. doi: 10.1093/cercor/bhq062
PubMed Abstract | Full Text | CrossRef Full Text | Google Scholar
von dem Hagen, E. A. H., Stoyanova, R. S., Baron-Cohen, S., and Calder, A. J. (2013). Reduced functional connectivity within and between ‘social’ resting state networks in autism spectrum conditions. Soc. Cogn. Affect. Neurosci. 8, 694–701. doi: 10.1093/scan/nss053
PubMed Abstract | Full Text | CrossRef Full Text | Google Scholar
Vul, E., Harris, C., Winkielman, P., and Pashler, H. (2009). Puzzlingly high correlations in FMRI studies of emotion, personality and social cognition. Perspect. Psychol. Sci. 4, 274–290. doi: 10.1111/j.1745-6924.2009.01125.x
Wakabayashi, A., Baron-Cohen, S., and Wheelwright, S. (2006). Are autistic traits an independent personality dimension? A study of the Autism-Spectrum Quotient (AQ) and the NEO-PI-R. Pers. Individ. Dif. 41, 873–883. doi: 10.1016/j.paid.2006.04.003
Watson, K. K., Werling, D. M., Zucker, N. L., and Platt, M. L. (2010). Altered social reward and attention in anorexia nervosa. Front. Psychol. 1:36. doi: 10.3389/fpsyg.2010.00036
PubMed Abstract | Full Text | CrossRef Full Text | Google Scholar
Wheelwright, S., Baron-Cohen, S., Goldenfeld, N., Delaney, J., Fine, D., Smith, R., et al. (2006). Predicting Autism Spectrum Quotient (AQ) from the Systemizing Quotient-Revised (SQ-R) and Empathy Quotient (EQ). Brain Res. 1079, 47–56. doi: 10.1016/j.brainres.2006.01.012
PubMed Abstract | Full Text | CrossRef Full Text | Google Scholar
Woodbury-Smith, M. R., Robinson, J., Wheelwright, S., and Baron-Cohen, S. (2005). Screening adults for Asperger Syndrome using the AQ: a preliminary study of its diagnostic validity in clinical practice. J. Autism Dev. Disord. 35, 331–335. doi: 10.1007/s10803-005-3300-7
PubMed Abstract | Full Text | CrossRef Full Text | Google Scholar
Yarkoni, T. (2009). Big correlations in little studies: inflated fMRI correlations reflect low statistical power-commentary on Vul et al. (2009). Perspect. Psychol. Sci. 4, 294–298. doi: 10.1111/j.1745-6924.2009.01127.x
Zilles, K., and Amunts, K. (2010). Centenary of Brodmann’s map—conception and fate. Nat. Rev. Neurosci. 11, 139–145. doi: 10.1038/nrn2776
PubMed Abstract | Full Text | CrossRef Full Text | Google Scholar
Zucker, N. L., Losh, M., Bulik, C. M., Labar, K. S., Piven, J., and Pelphrey, K. A. (2007). Anorexia nervosa and autism spectrum disorders: guided investigation of social cognitive endophenotypes. Psychol. Bull. 133, 976–1006. doi: 10.1037/0033-2909.133.6.976
PubMed Abstract | Full Text | CrossRef Full Text | Google Scholar
Keywords: autism quotient, executive control network, dual regression, independent component analysis, functional connectivity, face processing
Citation: Young JS, Smith DV, Coutlee CG and Huettel SA (2015) Synchrony between sensory and cognitive networks is associated with subclinical variation in autistic traits. Front. Hum. Neurosci. 9:146. doi: 10.3389/fnhum.2015.00146
Received: 15 December 2014; Accepted: 02 March 2015;
Published online: 23 March 2015.
Edited by:
Leonhard Schilbach, Max-Planck Institute of Psychiatry, GermanyReviewed by:
Martin Walter, Otto-von-Guericke-Universität Magdeburg, GermanyChristian Sorg, Klinikum rechts der Isar Technische Universität München, Germany
Bhismadev Chakrabarti, University of Reading, UK
Copyright © 2015 Young, Smith, Coutlee and Huettel. This is an open-access article distributed under the terms of the Creative Commons Attribution License (CC BY). The use, distribution and reproduction in other forums is permitted, provided the original author(s) or licensor are credited and that the original publication in this journal is cited, in accordance with accepted academic practice. No use, distribution or reproduction is permitted which does not comply with these terms.
*Correspondence: Scott A. Huettel, Center for Cognitive Neuroscience and Department of Psychology and Neuroscience, Duke University, Box 90999, Durham, NC 27708, USA Tel: (919) 668-5286 scott.huettel@duke.edu
† Shared first authorship, with order determined arbitrarily.