Innervation zones of fasciculating motor units: observations by a linear electrode array
 Faezeh Jahanmiri-Nezhad
 Paul E. Barkhaus
 William Z. Rymer
 Ping Zhou
- 1Department of Bioengineering, University of Illinois at Chicago, Chicago, IL, USA
- 2Single Motor Unit Lab, Sensory Motor Performance Program, Rehabilitation Institute of Chicago, Chicago, IL, USA
- 3Department of Neurology, Medical College of Wisconsin and the Milwaukee Veterans Administration Medical Center, Milwaukee, WI, USA
- 4Department of Physical Medicine and Rehabilitation, Northwestern University, Chicago, IL, USA
- 5Department of Physical Medicine and Rehabilitation, University of Texas Health Science Center and TIRR Memorial Hermann Research Center, Houston, TX, USA
- 6Biomedical Engineering Program, University of Science and Technology of China, Hefei, China
This study examines the innervation zone (IZ) in the biceps brachii muscle in healthy subjects and those with amyotrophic lateral sclerosis (ALS) using a 20-channel linear electromyogram (EMG) electrode array. Raster plots of individual waveform potentials were studied to estimate the motor unit IZ. While this work mainly focused on fasciculation potentials (FPs), a limited number of motor unit potentials (MUPs) from voluntary activity of 12 healthy and seven ALS subjects were also examined. Abnormal propagation of MUPs and scattered IZs were observed in fasciculating units, compared with voluntarily activated MUPs in healthy and ALS subjects. These findings can be related to muscle fiber reinnervation following motor neuron degeneration in ALS and the different origin sites of FPs compared with voluntary MUPs.
Introduction
The IZ in a muscle refers to the site of the muscle and nerve’s connection, i.e., where motor neurons (MNs) and their axons innervate the muscle fibers. Muscle fibers synapse with nerve terminal branches from their MNs at their neuromuscular junctions (NMJs). NMJs are usually located near the mid-point of a muscle fiber, so that excited action potentials on either side travel an approximately equal distance toward the proximal or distal tendons. In this document, the collective site containing the NMJs of a motor unit is called motor unit IZ, and the collective site of all motor unit IZs in a muscle is called muscle IZ band (see Figure 1).
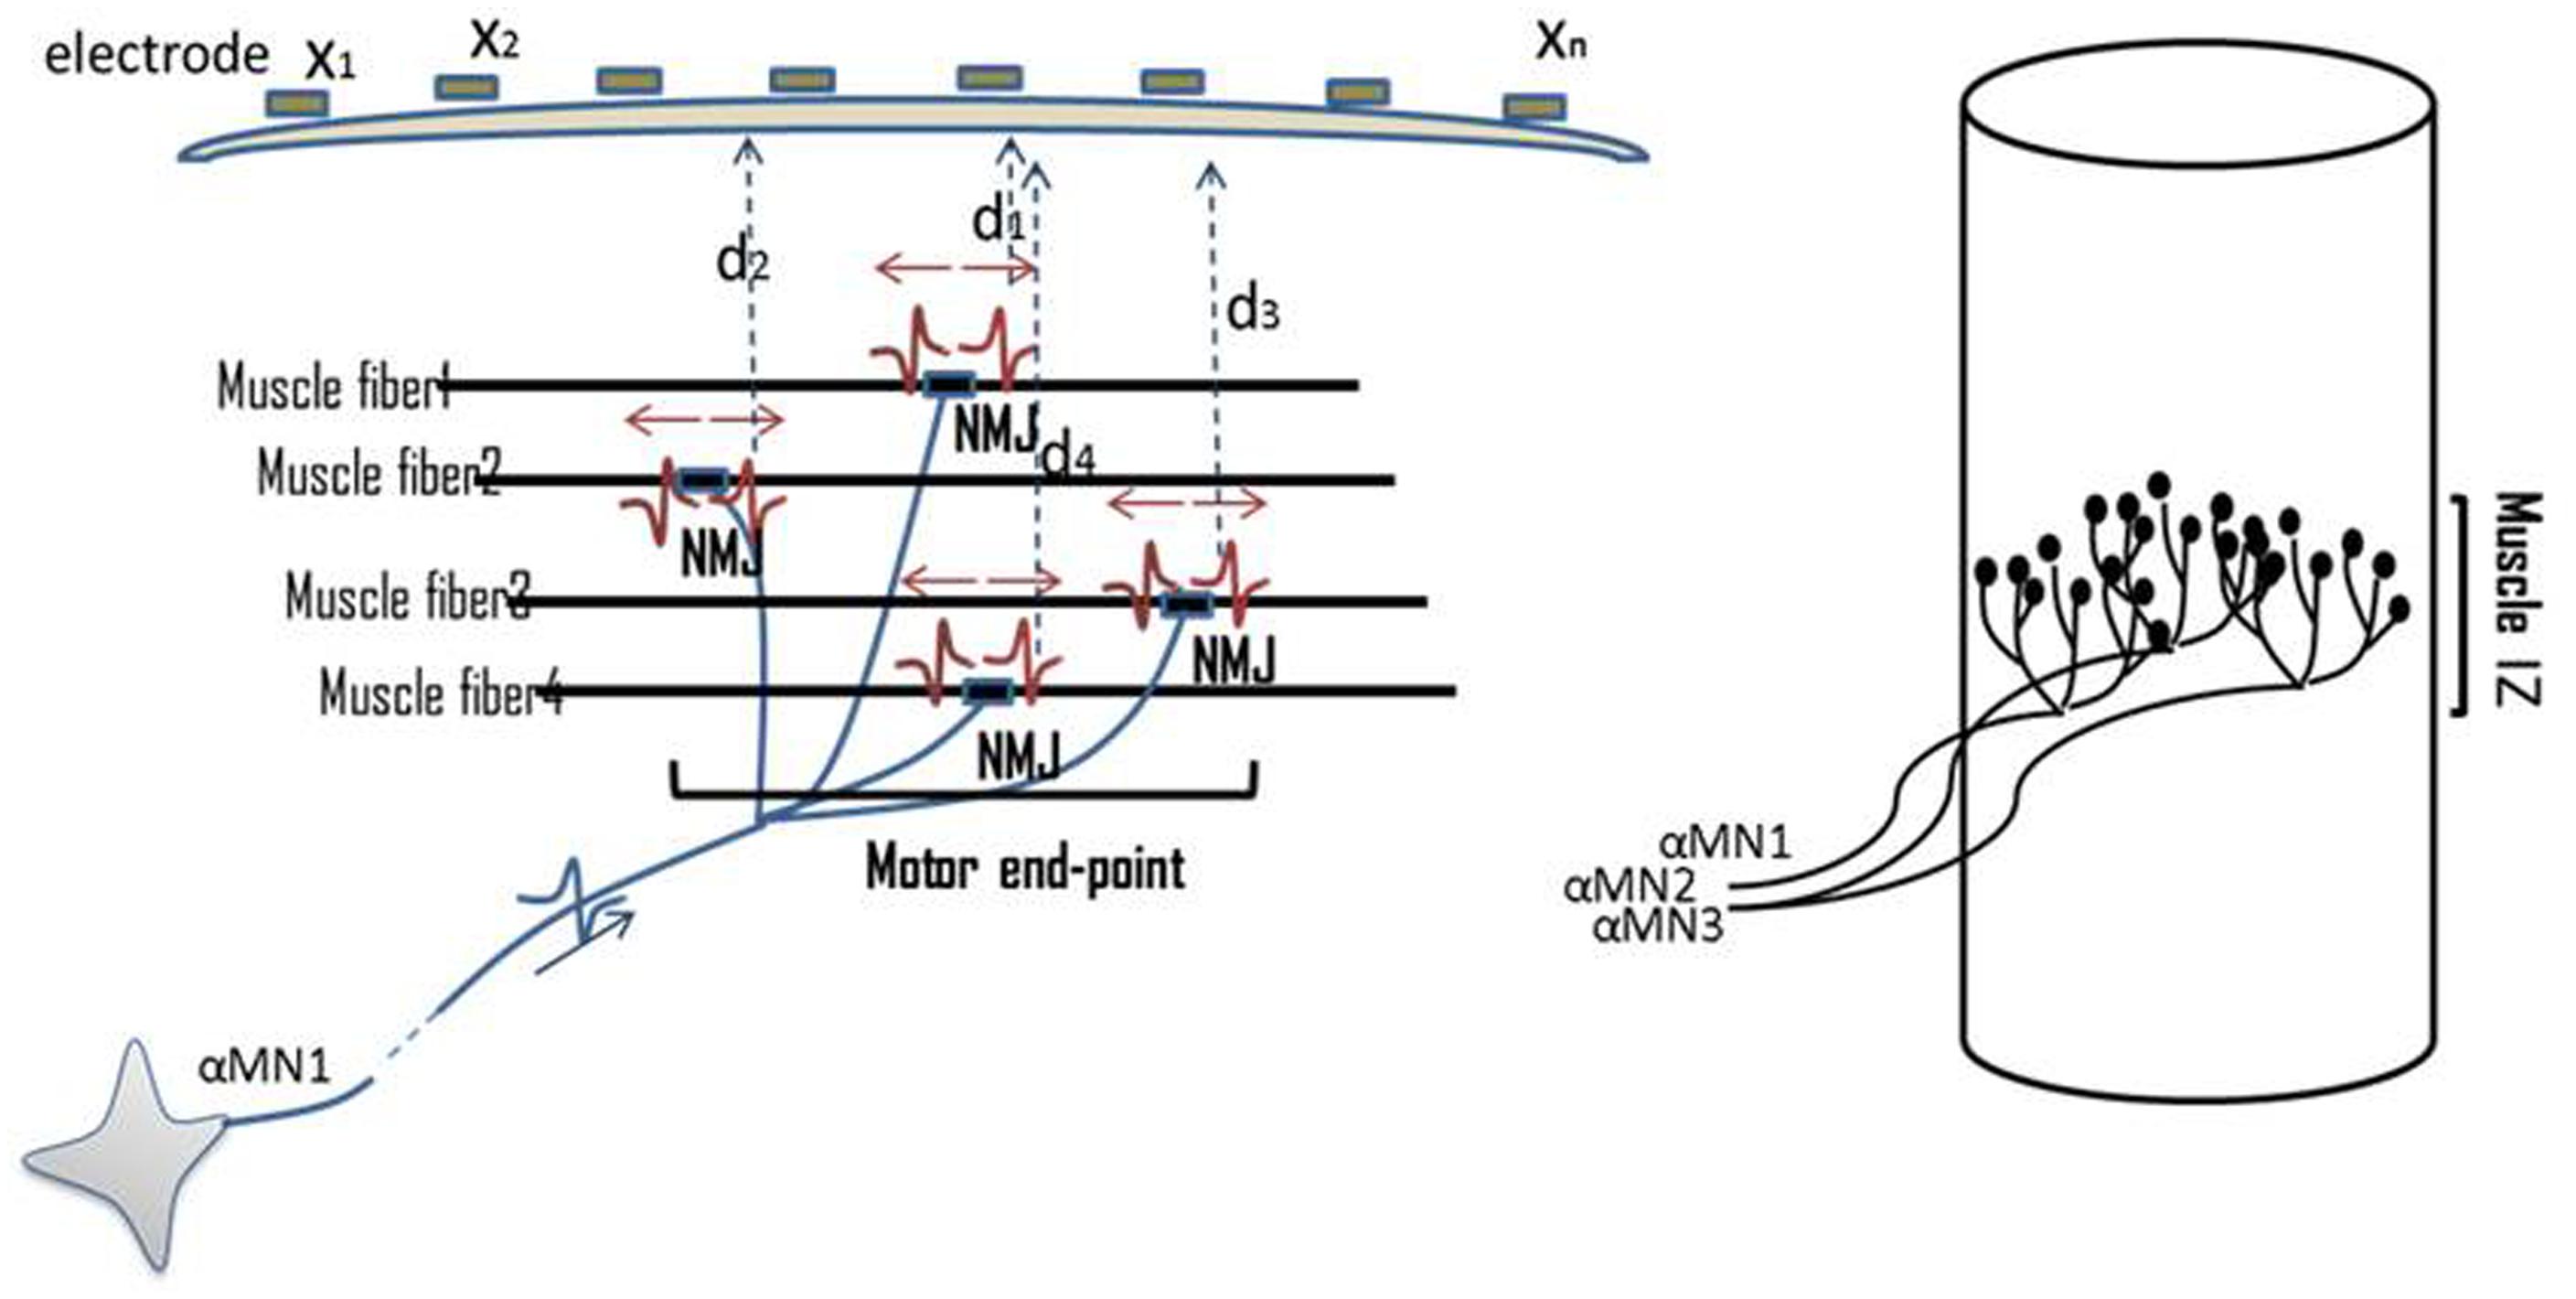
FIGURE 1. Illustration of NMJs, motor unit IZ, and muscle IZ band. Distribution of NMJs along muscle fibers is shown. On top of the skin surface, an array of tiny electrodes is located (x1–xn). MUPs are recorded simultaneously on multiple channels. The Multi-channel recording helps to locate the motor unit IZ. The collective IZs from all the motor units will form a muscle’s IZ band.
The IZ of a muscle can be detected using an array of EMG electrodes placed on the skin surface, such as over the biceps brachii muscle. The biceps IZ is found to have a narrow band at the approximately middle of its longitudinal axis. This has been reported in the 1950s in a healthy population (Coers, 1953; Buchthal et al., 1955). In some pathologic conditions, such as a progressive muscular dystrophy, an enlarged IZ band was reported (Hilfiker and Meyer, 1984). Detection of IZ location has been a subject of interest as an important factor in surface electrode positioning (Brown et al., 1988; Falla et al., 2002; Enck et al., 2004; Martin and MacIsaac, 2006; Mesin et al., 2009a,b), as well as in neurophysiology research to understand muscle morphology and its alterations in diseased states (Lateva et al., 2002).
In this study, we used a linear surface electrode array to record the spontaneous electrical activity of the biceps undergoing active denervation, as seen in patients with ALS, a progressive, degenerative MN disease. Denervation refers to loss of neural drive to a muscle, for example as a result of MN death in ALS. Early after onset of the process, denervation may be followed by the reinnervation process, where disconnected muscle fibers make new synapses with surviving MNs. Evidence of muscle fiber reinnervation is one of the key electrodiagnostic features of ALS.
Fasciculation potentials refer to spontaneous waveforms from a group of muscle fibers comprising a motor unit or multiple units. They may occur in many conditions, including a fatigued muscle or even a normal state muscle. Their occurrence may be prominent in ALS subjects before significant muscle atrophy or weakness has occurred. Detection of fasciculations (from a clinical point of view: muscle twitches) in an anatomic region, its progress in that region, followed by progression into other regions, is considered as a deleterious development for ALS (de Carvalho et al., 2008). While a MUP -initiated by the central drive in voluntary recruitment- originates from a MN in the anterior gray matter of the spinal cord, the site of origin of an FP can be anywhere from the MN’s soma, its axon, or its terminal branches.
The present work differs from previous studies which focused on the frequency of occurrence of FPs (Drost et al., 2007; Kleine et al., 2008, 2012). In this study, we examined the IZ alterations of fasciculating motor units. Technically, determining the location of motor unit IZ by means of multi-channel EMG recording has been used for more than 30 years (Masuda et al., 1983; Falla et al., 2002; Merletti et al., 2003; Mesin et al., 2009a,b).
This study seeks to understand two questions in ALS subjects: (1) whether evidence of scattered NMJs (versus close proximate NMJs seen in normal subjects) is reflected on the corresponding action potential waveform shape and propagation pattern, and (2) whether we can find abnormally enlarged muscle IZ bands in ALS. We addressed these questions by examining the fasciculating motor units from ALS subjects. We also examined MUPs manually extracted from the EMG signal of voluntary activation in both ALS and healthy subjects. As IZ detection is closely related to the pattern of propagation of MUPs along the muscle fibers, we also demonstrated waveforms with abnormal propagations in ALS subjects. In addition, we reported on a preliminary longitudinal study of three of our ALS subjects who had multiple visits.
Materials and Methods
Experiments
Electromyographic data were recorded from 12 neurologically intact subjects: six male and six female, aged 20–70 years (average age 43 ± 18 years). We also recruited seven ALS subjects: five male and two female, aged 48–71 years, (average age 56 ± 10 years). The ALS subjects were diagnosed as having “Definite ALS” or “Probable ALS with Laboratory Support” based on El Escorial criteria, (Brooks, 1994). Three ALS subjects had multiple visits, with a total of 15 datasets available from the ALS subjects. Table 1 provides demographic information about the ALS subjects. This study was approved by the local Human Studies Committee, and all participants gave informed consent before any experimental procedure.
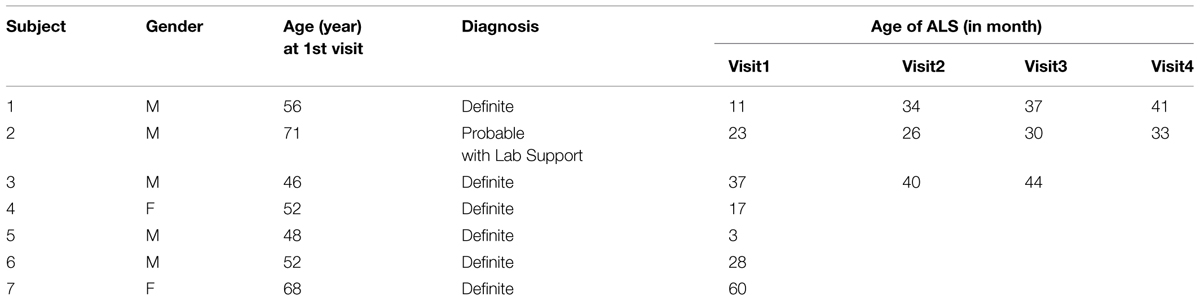
TABLE 1. Demographic information of the ALS subjects.
The biceps muscle was examined with the elbow partially flexed and forearm in semi-pronation. A custom-made 20-channel linear bar electrode array (schematic picture in Figure 2) was used for all experimental recordings. The IED was 5 mm. Each bar was 1 mm in width and 10 mm in length, arranged in a linear configuration. The electrode array was placed with its center on the belly of the muscle with the long side of the linear bar electrode overlying the long axis of muscle fibers. Channel 1 was on the proximal side and channel 20 covered the distal side. The signals were amplified by the Refa128 EMG Recording System (TMS International BV, The Netherlands). The reference electrode was placed on the ipsilateral elbow. Sampling rate was 2 kHz per channel, with a band pass filter setting at 20–500 Hz.
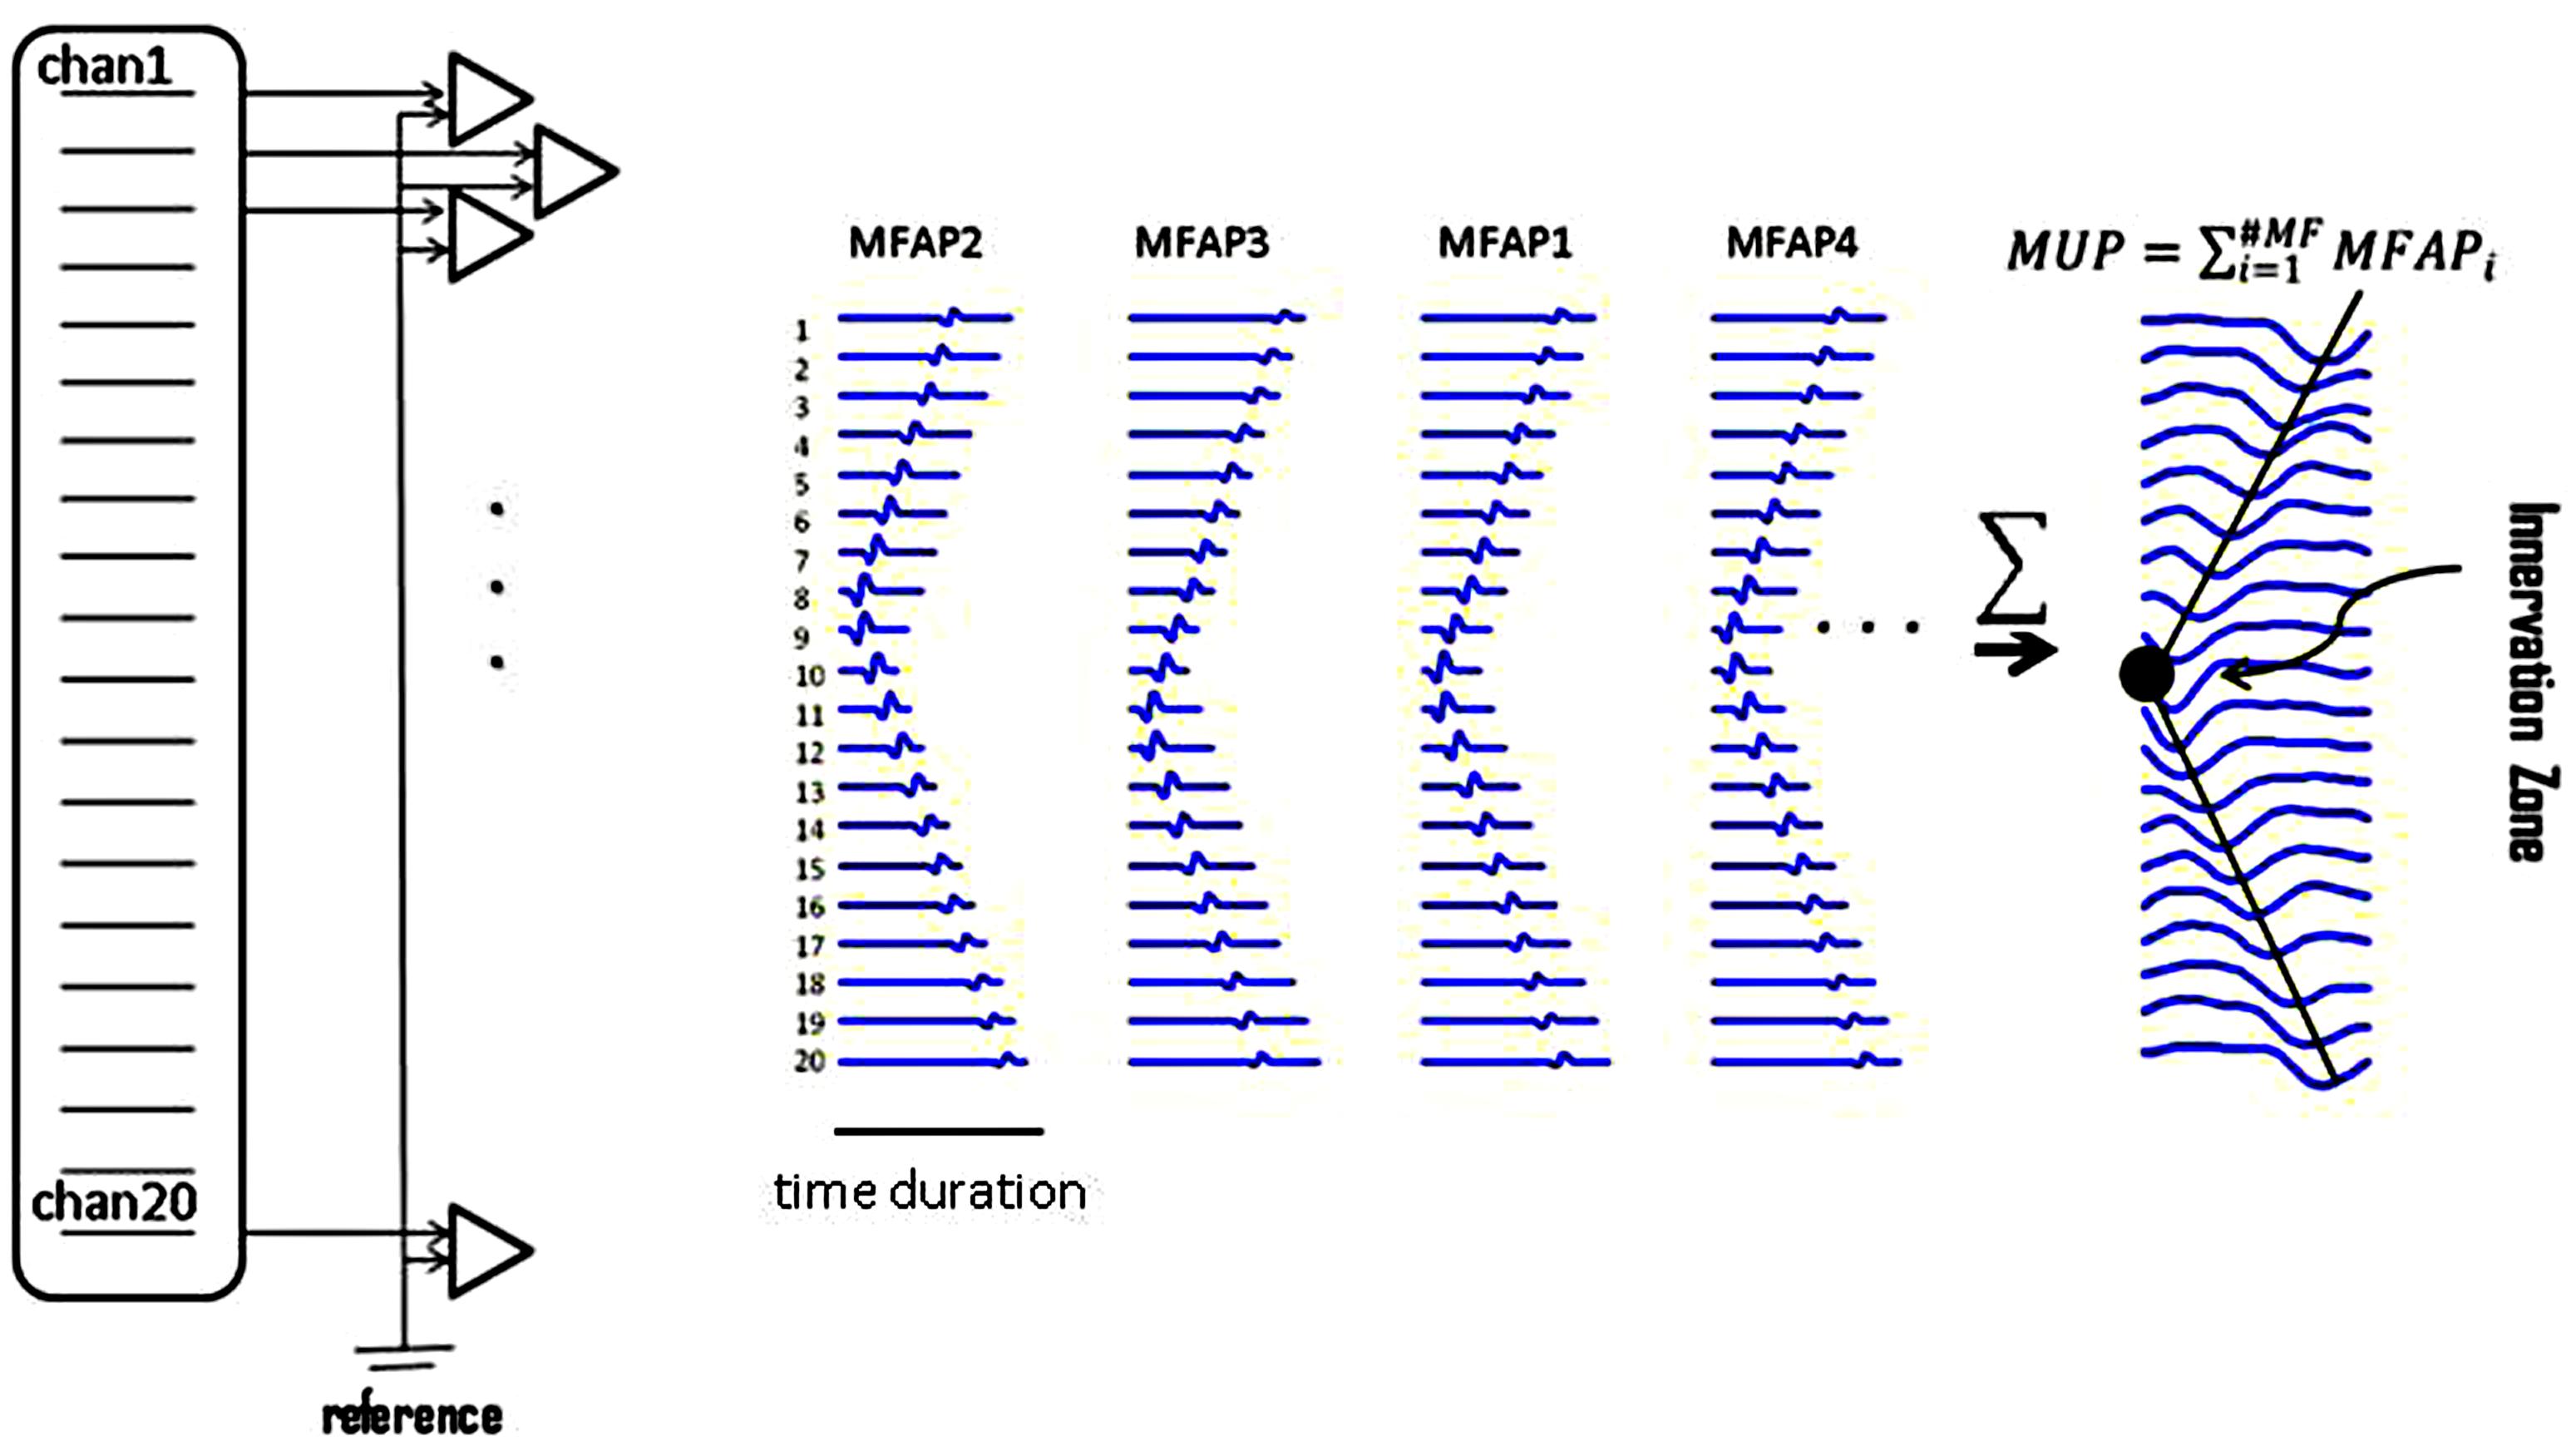
FIGURE 2. Raster plots of simulated muscle fiber action potentials (MFAPs) and a final MUP. This plot shows the concept of MUP generation obtained from summation of single MFAPs on multi-channel electrodes. MFAPs1–4 correspond to muscle fibers 1–4 in Figure 1. The IZ can be detected from the multi-channel MUP. In reality, it is difficult to detect single MFAPs from skin surface.
Extracting Action Potentials
Multi-channel MUPs were extracted manually from low force levels of voluntary contraction EMG. Irregularly firing FPs (which are less prone to phase interaction or superposition as is commonly seen in MUPs during voluntary activation), were detected automatically using software described by Jahanmiri-Nezhad et al. (2014b). The algorithm first transformed the 20-dimensional signal to a 1-dimensional trace, and applied amplitude thresholding to detect a potential by recording its timing occurrence. The temporal information was then used to extract the multi-channel waveforms from the 20-dimensional signal. Extracted FPs were stored in a database. These waveforms were afterward clustered into classes of similar waveform shapes, by means of the toolbox described by Jahanmiri-Nezhad et al. (2014c).
A waveform in bipolar electrode configuration is most appropriate for IZ analysis. Jahanmiri-Nezhad et al. (2014a) have recently shown that spatial filtering might reduce the sensitivity of FP detection. As a result in this study, many waveforms (especially FPs) were lost in background noise as would be expected; thus, it was impractical to locate their IZ for these motor units.
From voluntary EMG trials, 4–9 different MUPs were manually extracted, from each of the 12 healthy subjects (resulting in a total of 69 different MUPs). The waveforms from each subject were visually examined to ensure they represented different motor units. Ten MUPs were noisy and showed no clear IZ, and thus they were excluded from further analysis. Likewise, 3–9 voluntarily activated motor units (a total of 47 MUPs) were manually extracted from each of nine voluntary EMG recordings of ALS subjects (not all of the 15 recordings from the ALS subjects had voluntary trials). In the seven ALS subjects, 12630 FPs were automatically extracted from 15 trials of long duration recordings (10–30 min). FPs detected from each set of recordings were clustered into a total of 371 classes having similar shapes. Individual waveforms were examined with regard to their motor unit IZ location.
MUP Simulation; Study of the Effect of NMJ Sites
For illustrative purposes, single MUP waveforms were simulated assuming a 20-channel linear array electrode recording (mimicking our experimental electrode). Similar works can be found in Fuglevand et al. (1992), Roeleveld et al. (1997a,b), Stalberg and Karlsson (2001a,b), McGill (2004), Navallas and Stalberg (2009). The length of the simulated muscle was assumed to be 100 mm. Based on the previous works and the goal of this study, we specified these variables: number of muscle fiber in a motor unit (‘n’), the depth of each muscle fiber from the skin surface, its transverse distance from the center of the muscle, the site of its NMJs along the length of the muscle fiber, and longitudinal and radial muscle fiber conductivity. The motor axon and muscle fiber conduction velocities (vn and vm) were assumed 50 m/s and 4–6 m/s (random variable), respectively. The spatial distribution of NMJs in a 3D Cartesian space was modeled by a random variable using a random number generator (mean and SD were determined). Point zero [x0 = 0, y0 = 0, z0 = 0] referred to the single distal branching points on the motor axon. It takes ‘tnervei’ time for a single action potential to travel from point zero to point [xi, yi, zi], NMJi. Synaptic transmission time was not considered, assuming it had the same value for all NMJs (i = 1:n). A single action potential was assumed to last for 1 ms.
Variable ‘mfap0’ (muscle fiber action potential) denotes a postsynaptic action potential: a 20-sample dipole waveform modeled in Matlab with peak-to-peak amplitude of 17 arbitrary units (au) and a duration of 1 ms, equivalent to a 20 kHz sampling rate. This was later down-sampled to 2 kHz. The mfapiresembled the potential corresponding to the NMJi. The amplitude of mfapi decreased as it propagated throughout the volume conductor. The extinction rate was faster when the potential traveled transversely across the muscle, rather than longitudinally along the muscle fiber. Right above the surface of the skin, amplitude was attenuated by a power function of the depth of the muscle fiber from the skin surface. As it propagated along the muscle fiber, it was also attenuated following a power function of the distance traveled. This amplitude attenuation was accompanied with time delays according to muscle fiber conduction velocity, vm.
Muscle fiber potentials were all summed up to obtain a MUP. Random white noise (amplitude: ±5 au) was added to the signal. At the end, a ‘butterworth’ low pass filter was added as a model of the effect of connective tissue and skin on the signal, with a threshold low-pass frequency of 500 Hz.
Locating a Motor Unit IZ Based on its Action Potentials
Assume that an array of electrodes covers the longitudinal axis of the biceps. When a motor unit discharges, the channel located immediately over the top of the motor unit IZ site is the one in which the waveform will appear first. The adjacent channels will detect the waveform after a time lag. Propagation of the MUP continues until the amplitude of the MUP waveform attenuates within background noise (an indication that it has reached the end of the muscle fibers). This propagation of the MUP (accompanied with sequential time lags) forms a ‘<’ (letter “v” on its side) shape on the display of the multi-channel waveform, as shown in Figure 2. The left-oriented apex of the ‘<’ is considered to be the motor unit’s IZ. Usually, the waveform phase turns opposite around the IZ in bipolar mode.
To facilitate locating the motor unit IZ, a plot of Points of Extrema was provided: the points of maxima and minima – from each channel- were depicted in a single plot. Data in the plot of Points of Extrema can be divided into two ‘ascending’ and ‘descending’ sections. The point where these sections meet is the location of the IZ. On the waveform raster plot in bipolar mode, we usually see minimum waveform amplitude. We also see that the phase of waveforms across all channels has a turn at this point. For some waveforms, there may be no time-delay propagation around this point for several IEDs. We propose that such a mechanism may estimate the length of NMJ scatter within that motor unit (through counting the number of channels where no propagation was observed).
Data Analysis
Individual waveform potentials were visualized in their initial mode with bipolar layout as well as the plotting of Points of Extrema. The lengths of the motor unit IZs were estimated in the channels overlying the IZ. If no clear IZ point could be determined, yet there were ascending and descending lines in the plot of Extrema, then we estimated the IZ point by extrapolating the lines and locating the point they crossed each other. Muscle IZ band was calculated based on motor unit IZs within a dataset for an individual muscle. Muscle IZ dispersion was calculated as the SD of motor unit IZs within the muscle. To statistically compare the IZ among FPs and MUPs in ALS, and to compare MUPs in ALS and in healthy subjects, we used an un-paired student t-test. A Normality test (the Jarque–Bera test built in Matlab) was performed preceding any t-test comparison. Where the test of normality failed, Box–Cox transformation (, x is the array of positive data and λ is a scalar) was tried. Box–Cox attempts to remove skewness in a distribution, and make it approximately like a Normal distribution, by searching for a λ leading to the smallest SD in x. Nevertheless, a normally distributed x′ is not guaranteed, hence the output should always be re-tested.
Results
Motor Unit IZ Length and Evidence for Enlarged NMJs’ Scatter
Visual examination of the raster plot of a waveform, along with the Points of Extrema, helped to locate a motor unit IZ. Figure 3 includes raster plots of two simulated waveforms. The corresponding motor units are identical: they both have 500 innervated fibers and are most superficial to the skin. In Figure 3B the NMJs are distributed in a 15 mm segment along the longitudinal axis of the muscle; whereas in Figure 3A, they are in a 5 mm segment. The waveform peaks in Figure 3A turn a sharp corner, and in Figure 3B stay in the same position for approximately the distance between three IEDs, then propagate toward the muscle fiber endings. This simulation aims to illustrate how NMJs scatter affects the corresponding MUP waveform and conceptualize the possibility of measuring the IZ length from the waveform raster plot. It is noted that the resolution in the measurement in this study is one IED equals to 5 mm.
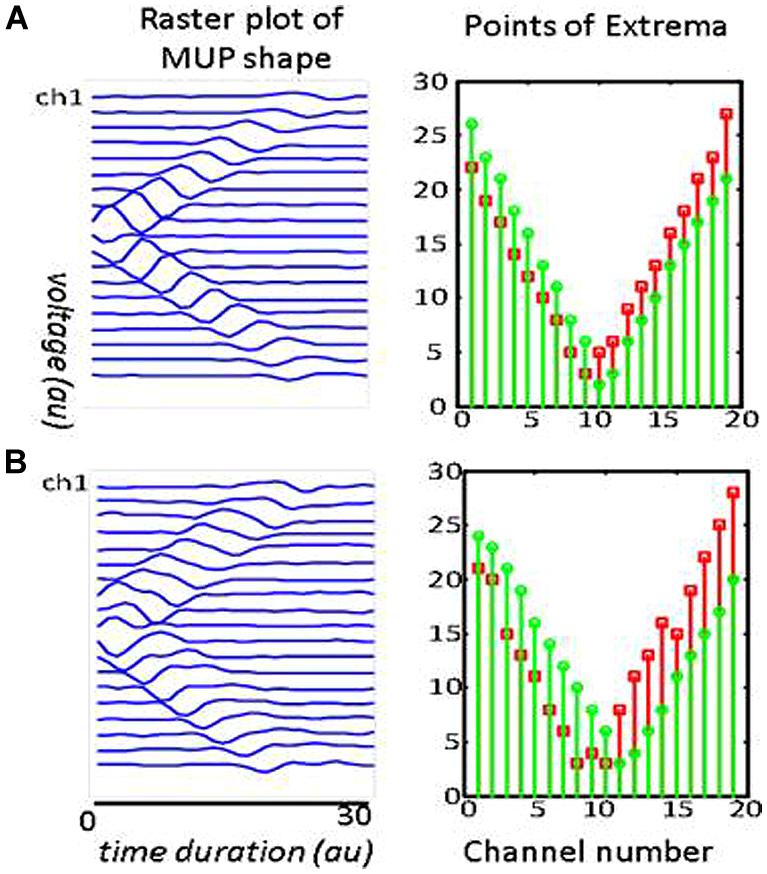
FIGURE 3. Two simulated MUPs. The raster plots are on the left, and corresponding points of extrema are on the right. The sites of minimum are marked with green circles and the maximum with red squares. In the raster plots, the IZ is located at the center (channel 10). The troughs on the right panels occur at x = 10. Each MUP is composed of 500 MFAPs. NMJ distribution in (A) was spread over a 5 mm range around the center of muscle. The distance between the trough of the points of minima and maxima is consistently about one inter-channel distance (5 mm). NMJ distribution in (B) was spread over a 15 mm range. The distance between the troughs’ length is consistently about three inter-channel distance (3 × 5mm = 15 mm).
Figure 4 depicts different types of propagation patterns observed from the experimental data. The first two panels (Figures 4A,B) are quite common among all our data sources (voluntary MUPs from healthy and ALS subjects, and FPs from ALS subjects). The waveform raster plots can be categorized into “<,” and “|” patterns as a sign of scattered NMJs in a motor unit, most likely due to reinnervation. We visually estimated motor unit IZ length among 200 fasciculation waveforms in 15 datasets. As shown in Figures 4A,B the motor unit IZ length is typically two IEDs. As summarized in Table 2, FPs have the largest motor unit IZ lengths, comparing to the MUPs from voluntary trials in healthy and ALS subjects. In comparing ALS and healthy subjects, the former also have larger motor unit IZ length.
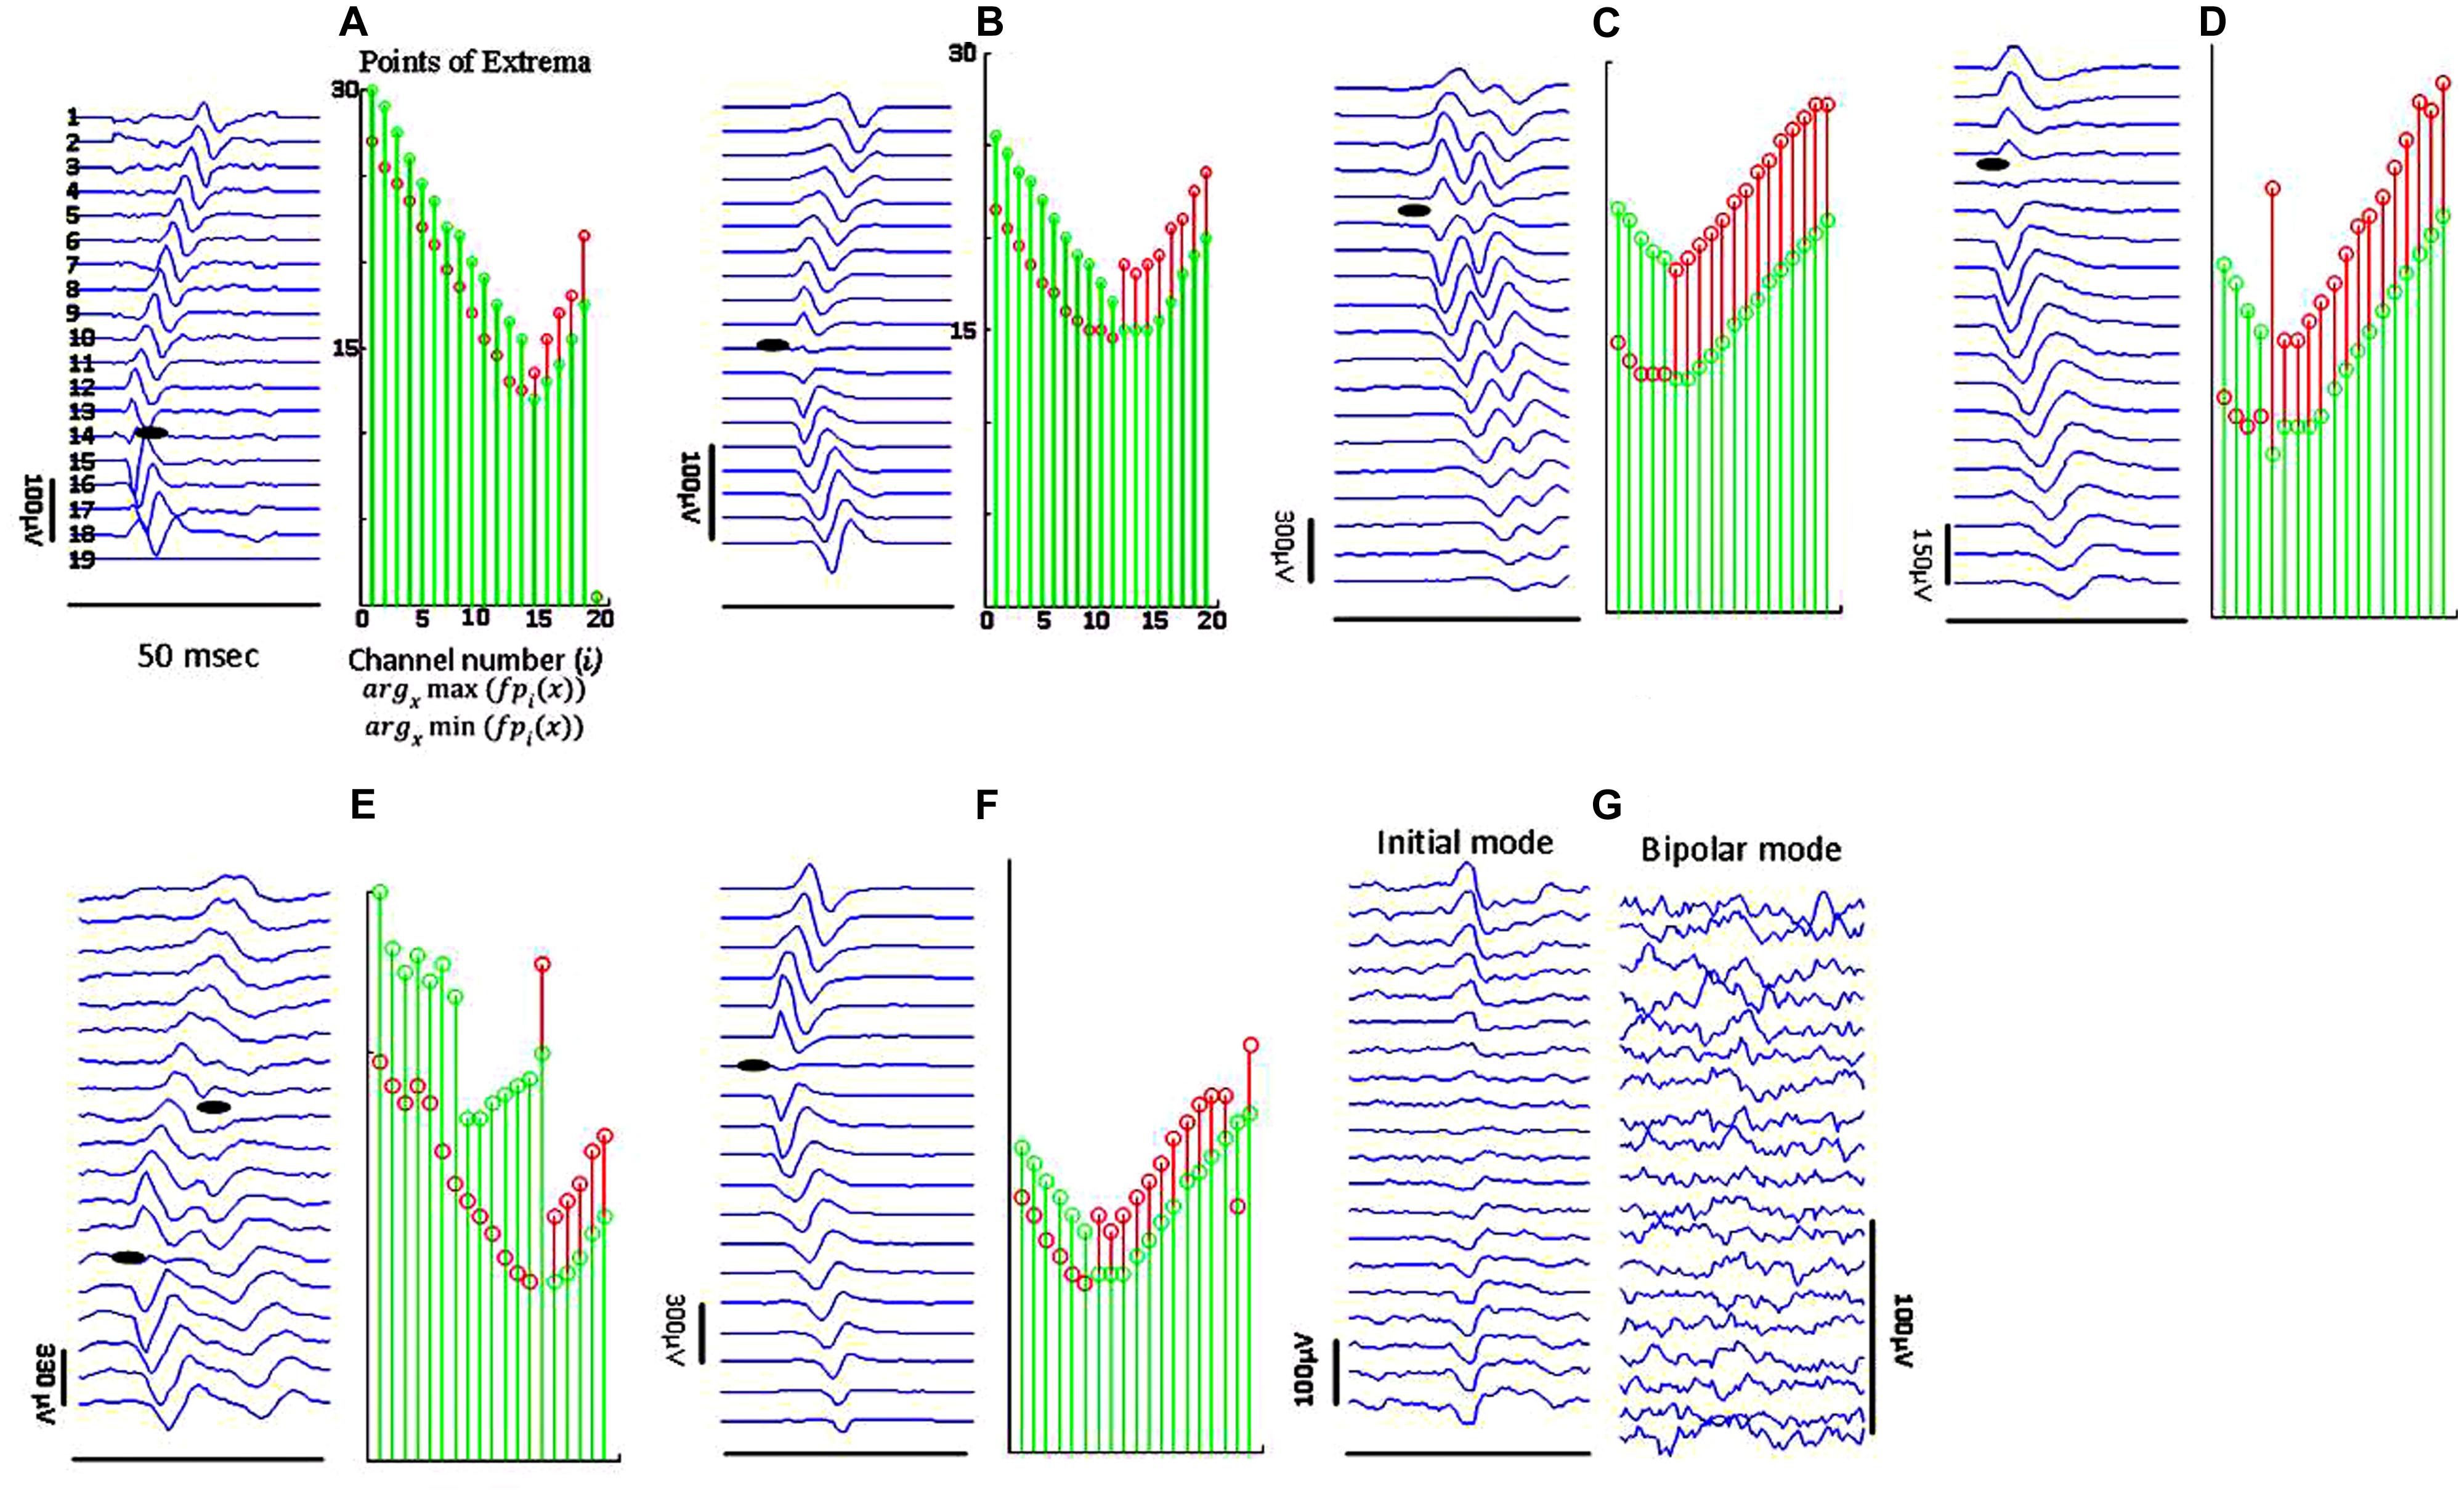
FIGURE 4. Sample raster plots (in bipolar mode, unless specified) of experimental data from different subjects, illustrating different propagation patterns with various motor unit IZ length. (A) Sharp narrow waveforms is likely to represent a superficial motor unit, with narrowly positioned NMJs. (B) Smoother waveforms, likely referring to either a motor unit deeper inside the muscle, or corresponding to a thicker subcutaneous layer (between the muscle and skin surface where the electrodes are located). (C) Double discharge (commonly observed in ALS subjects). The lines of points of minima to maxima in descending and ascending line meet at a single point, but they pause for at least four IEDs for the segments of maxima to minima. In (D) there is no time lag for waveforms on channels 3–8. The IZ center is on channel 5. (E) Waveform seemingly with two IZ points, most probably from superposition of two FPs. In (F) the waveform amplitude attenuates toward the distal channel. (G) Abnormal propagation pattern without any time delays across the channels; seen mostly in ALS.
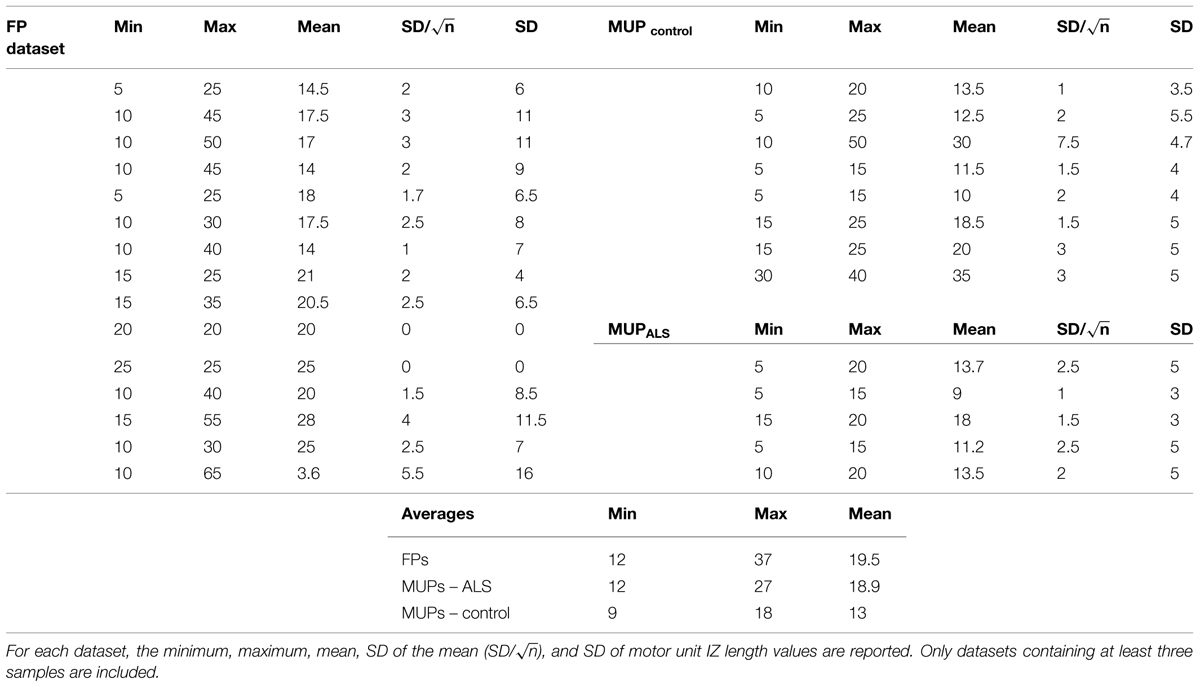
TABLE 2. Motor unit IZ Length -measured in millimeters (mm)- from three sources of data: FPs, and MUPs extracted from voluntary trials from healthy and ALS subjects.
Muscle IZ Band Length; Evidence of Increased Motor Unit IZ Scatter
Figure 5 shows 10 different FP waveforms from one dataset (one muscle, one trial of EMG recording). Motor unit IZs are marked in bold dark dashes. We define muscle ‘IZ length’ as: the distance between the farthest distal and most proximal points of NMJs located on the muscle fibers, as shown in Figure 5. Table 3 summarizes the result of muscle IZ band measure from our three study populations.
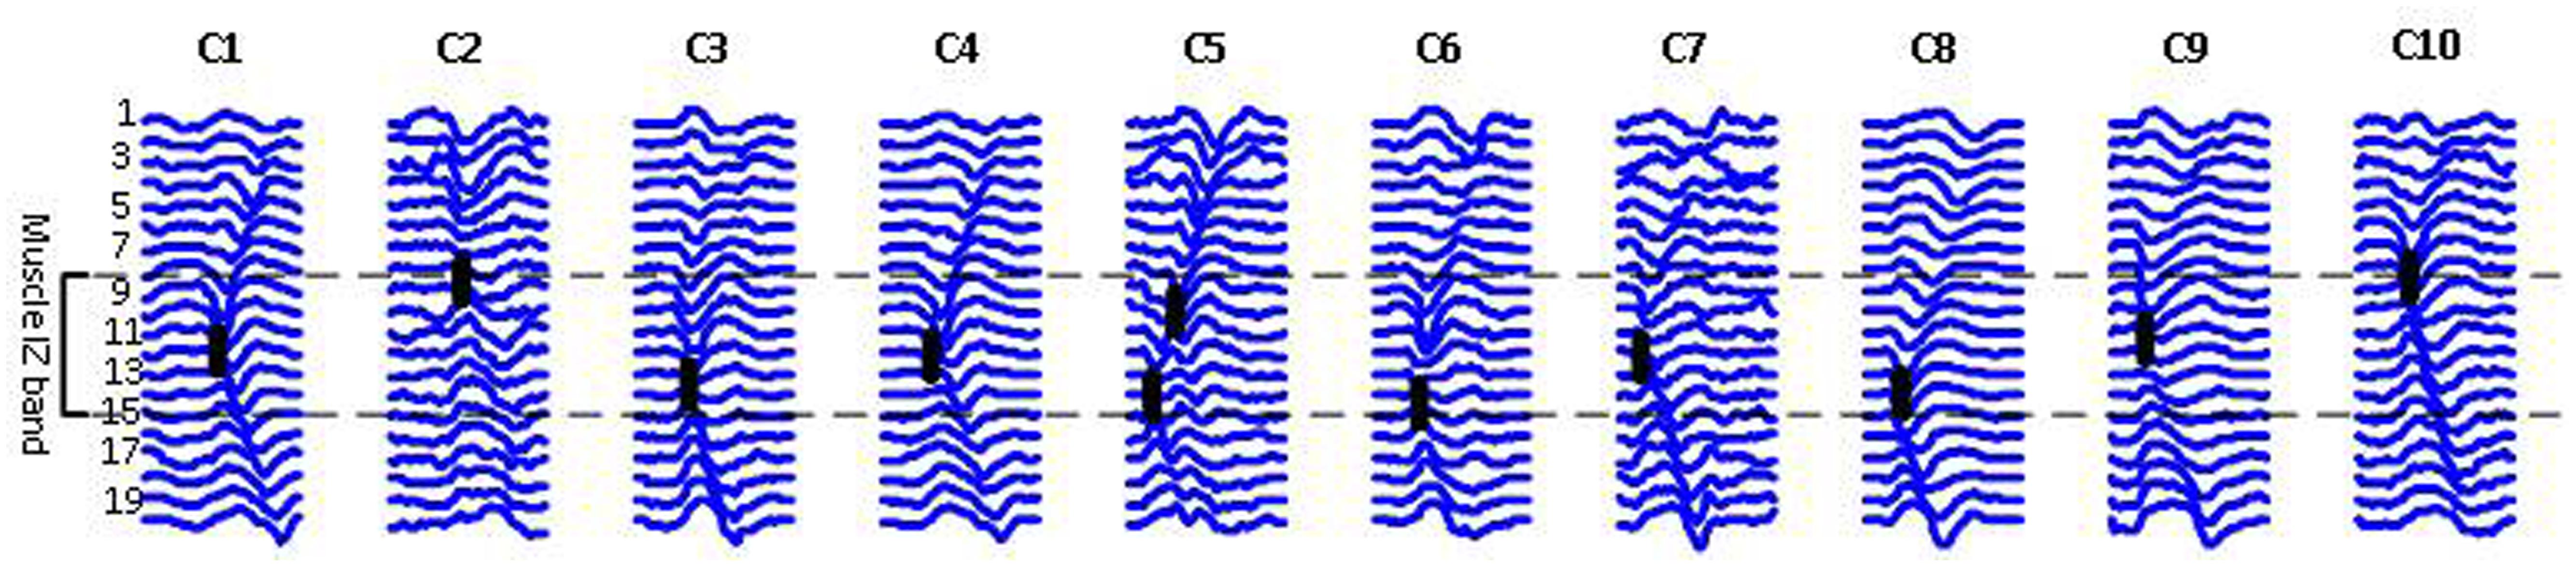
FIGURE 5. Raster plots of ten FPs belonging to one ALS subject, each representing a class of waveform shapes. Class index is reported on the top. C2 has an abnormal straight propagation, with no time lags between the channels. In C5, two IZs were detected, indicating for either two superimposed FPs or a doubly innervated unit as suggested by Lateva et al. (2002, 2010). The heavy black lines indicate IZs.
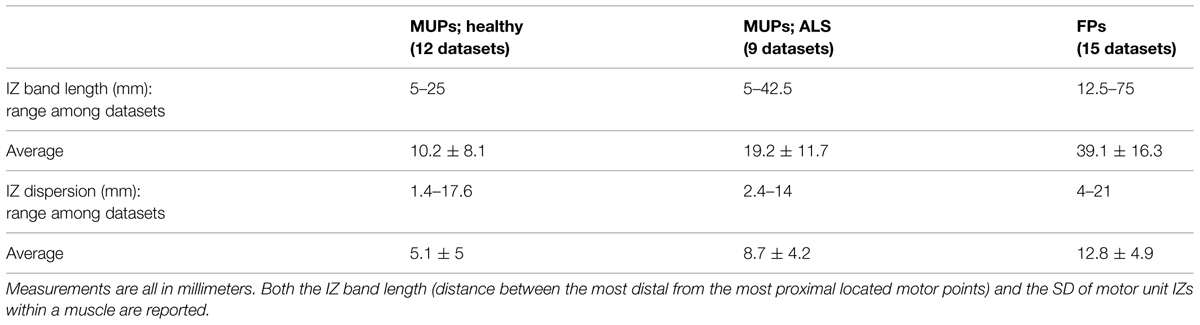
TABLE 3. Measures of muscle IZ band length from FPs compared with MUPs in healthy and ALS subjects.
As shown in Table 3, the scatter of muscle IZ length has larger values among MUPs in ALS subjects than in healthy controls. The statistical tests did not confirm its significance though. However, it showed that muscle IZ dispersion (STD) within a muscle in voluntary MUPs of ALS subjects is statistically larger than in healthy subjects (p = 6e-5); and that for FPs was larger than for voluntary MUPs from healthy controls and ALS subjects (p = 5e-6 and 0.052, respectively).
Longitudinal Study of Muscle IZ Band
Three subjects with ALS had multiple visits, as listed in Table 4. This allowed us to monitor the changes in their spontaneous discharge activities. Analysis of IZ distribution from these subjects is illustrated in Figure 6. In this figure, the bars indicate the extent of IZ band along the muscle. The statistical tests showed significant differences at least on one occasion for all three subjects. Box–cox transformation was needed for Subject 2, with ‘λ = 1.5.’ The not available (NA) length of IZ for the last visit of Subject 3, was the result of a very weakened muscle with only few classes of FPs that had no clear IZ.
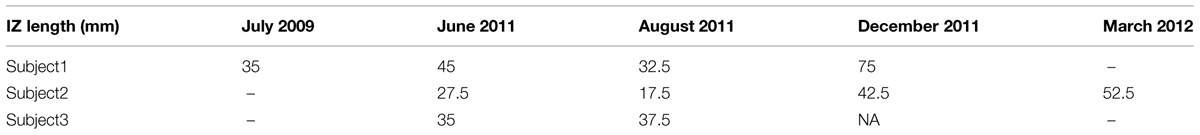
TABLE 4. Longitudinal data of muscle IZ band length (from FPs) in millimeters.
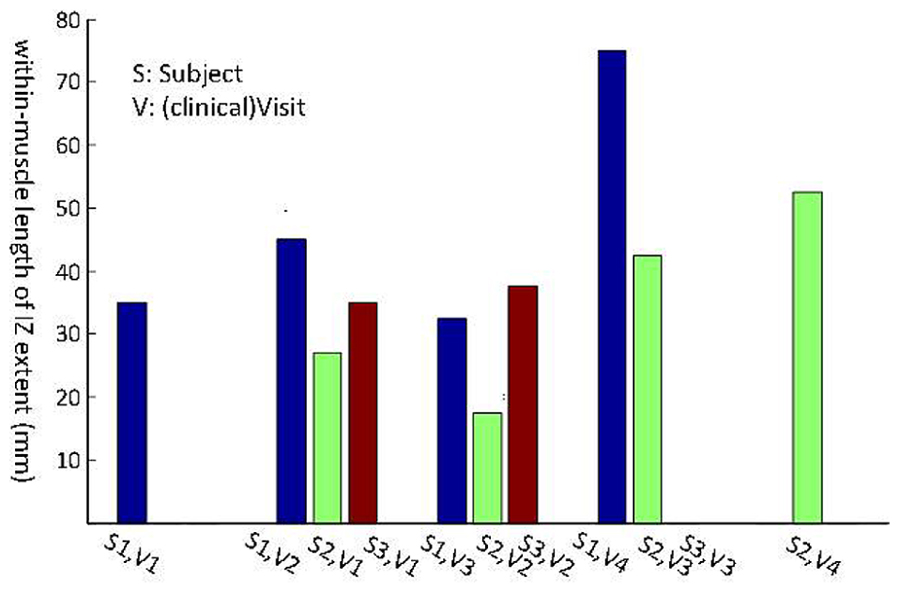
FIGURE 6. Longitudinal study of muscle IZ band (from FPs) for three ALS subjects. Statistical testing was performed on the IZ sites within a muscle. The x-axis is the index for each subject (S, Subject and V, Visit).
Discussion
This study aimed to investigate –in a non-invasive manner– the distribution of NMJs along the longitudinal axis of the fasciculating motor units of biceps in ALS. We specifically defined and measured motor unit IZ and muscle IZ band. Based on our definitions, we observed abnormally enlarged fasciculating motor unit IZ length and muscle IZ scatter than what has been previously published for neurologically intact biceps. Usually a waveform has a ‘<’ shape along muscle fibers on its raster plot. In a bipolar configuration, at the tip point –assumingly the IZ point– we can observe minimum amplitude waveform and a phase turn. We found that the dispersion of IZs within a muscle based on the FPs was larger than that of voluntary MUPs from ALS, and larger in ALS than in healthy control subjects. Scatter of IZ points within a muscle ranged 5–25 mm among control, 5–42.5 mm among ALS (from voluntary MUPs), and 12.5–75 mm among ALS (from FPs), which is larger than previously published values (10–20 mm reported in Masuda et al., 1983; 14 mm reported in Masuda and Sadoyama, 1986). We also examined the longitudinal data from the three ALS subjects, with multiple visits every 3 months on average. A significant increase of IZ dispersion was observed for at least once between the visits, for all the three subjects.
In this study, we hypothesized – based on a simulation study– that scatter of NMJs in a motor unit can be reflected on its waveform raster plot. The IZ turning point (or width) usually happens at around 1–3 IED(s). This value ranged on average 1.8–3.6 IEDs among MUPs of control subjects, 2.4–5.4 IEDs among MUPs of ALS subjects, and 2.4–7.4 IEDs among FPs in ALS. Therefore, we observed larger NMJs scatter in motor units of ALS subjects.
We defined motor unit IZ as the collective site of NMJs within a motor unit, and defined muscle IZ band as the collective site of motor unit IZs in a muscle. IZ and motor point both generally refer to the site of the motor nerve terminal connection to muscle fibers. The IZ has been traditionally defined physiologically using a surface recording electrode array or morphologically by histochemistry. The motor point of a muscle is conventionally determined as the focal point of supramaximal electrical stimulation of a motor nerve resulting in the largest evoked response (Guzman-Venegas et al., 2014).
Innervation zone distribution within biceps has been previously reported to have a narrow band in healthy subjects (Masuda et al., 1983; Masuda and Sadoyama, 1986; Brown et al., 1988; DeFreitas et al., 2010; Barbero et al., 2012). Aquilonius et al. (1984) applied cholinesterase staining and showed the NMJs forming distinct V shaped bands in the middle of biceps (<10 mm). The NMJs were also observed in more distal sites.
Increased variation of the location of IZs in subjects with ALS can be an indicator of ongoing reinnervation process in a muscle under denervation. When a MN dies, its corresponding muscle fibers become ‘orphaned,’ which may consequently be ‘adopted’ by surviving motor units. This results in a collateral sprouting from the terminal motor axon branches (reinnervation). More scattered IZ might be due to the reinnervation process where the added myoneural junctions expand the length of IZ.
The origin site of excitation of an FP might be another relevant factor contributing to the abnormal IZ locations observed in ALS. FPs might originate from anywhere of the MN soma, its axon, or at the terminal branches. Furthermore, FPs may be originated from a group of several motor units (de Carvalho and Swash, 2012). This may cause observation of enlarged motor unit IZs.
In estimating IZ site based on EMG, electrode location is a key factor. In this work, all the FPs were extracted from a single trial of EMG recording from a completely relaxed muscle. Hence, the possibility of a shift in IZ location due to muscle contraction (as described in Martin and MacIsaac, 2006; Piitulainen et al., 2009; Nishihara et al., 2010, 2013) was excluded. One limitation of the study was that only a 1-dimensional linear electrode array was used. Hence, analysis of medial–lateral IZ distribution was not available (which requires 2-dimensional electrode array recording). Furthermore, we analyzed IZ location and length partially based on visual examination versus a fully automated analysis. Currently, a fully automated software cannot achieve comparable performance to a human expert visual analysis due to the wide range of different cases of MUP and fasciculation propagation patterns. In our study, we observed that it is difficult to generalize a certain model of propagation applied to all the experimental data. Fully automated software may provide a more reproducible result, but not necessarily an more accurate one.
Finally, it is worth to mention that we measured motor unit IZ length by counting channels on which the initial waveform does not propagate, a means to measure NMJ scatter. However, parameters such as motor unit depth, subcutaneous layer thickness, and noise may complicate this measurement, as mentioned in Barkhaus and Nandedkar (1994) and Barkhaus et al. (2006). As the distance between the generator source and the sensor increases, the high frequency content of the signal is attenuated. Comparing the waveforms in Figure 4 is a relevant example where panel (Figure 4A) might represent a more superficial motor unit and (Figure 4B) a deeper one. One reason justifying this claim is the smoothed waveform shapes in panel (Figure 4B). We observed many of long IZ length (around 2–3 IEDs), belong to this category. Nonetheless, waveforms such as in same figure panel (Figure 4C), are likely to be from reinnervated units, and were observed more in ALS data as our results depicted. Further systematic simulation work is needed to investigate the effect of different (both physiologic and non-physiologic) factors that may affect waveform potentials, and to better understand the experimental recordings.
Conflict of Interest Statement
The authors declare that the research was conducted in the absence of any commercial or financial relationships that could be construed as a potential conflict of interest.
Acknowledgments
This study was supported by the National Institute on Disability and Rehabilitation Research of the U.S. Department of Education (Grant H133G 090093) and the National Institutes of Health (Grants R24HD050821 and R01NS080839).
Abbreviations
ALS, amyotrophic lateral sclerosis; EMG, electromyogram; FP, fasciculation potential; IED, inter electrode distance; IZ, innervation zone; MN, motor neuron; MUP, motor unit potential; NMJ, neuromuscular junction.
References
Aquilonius, S. M., Askmark, H., Gillberg, P. G., Nandedkar, S., Olsson, Y., and Stålberg, E. (1984). Topographical localization of motor endplates in cryosections of whole human muscles. Muscle Nerve 7, 287–293. doi: 10.1002/mus.880070406
Barbero, M., Merletti, R., and Rainoldi, A. (2012). “Generation, propagation, and extinction of single-fiber and motor unit action potentials,” in Atlas of Muscle Innervation Zones (Milan: Springer-Verlag), 20–38. doi: 10.1007/978-88-470-2463-2
Barkhaus, P. E., Collins, M. I., and Nandedkar, S. D. (2006). Influence of the surface EMG electrode on the compound muscle action potential. Electromyogr. Clin. Neurophysiol. 6, 235–239.
Barkhaus, P. E., and Nandedkar, S. D. (1994). Recording characteristics of the surface EMG electrodes. Muscle Nerve 17, 1317–1323. doi: 10.1002/mus.880171111
Buchthal, F., Guld, C., and Rosenfalck, P. (1955). Innervation zone and propagation velocity in human muscle. Acta Physiol. Scand. 35, 174–190. doi: 10.1111/j.1748-1716.1955.tb01276.x
Brooks, B. R. (1994). El Escorial World Federation of Neurology criteria for the diagnosis of amyotrophic lateral sclerosis. Subcommittee on motor neuron diseases/amyotrophic lateral sclerosis of the world federation of neurology research group on neuromuscular diseases and the El Escorial “clinical limits of amyotrophic lateral sclerosis” workshop contributors. J. Neurol. Sci. 124(Suppl.), 96–107. doi: 10.1016/0022-510X(94)90191-0
Brown, W. F., Strong, M. J., and Snow, R. (1988). Methods for estimating numbers of motor units in biceps-brachialis muscles and losses of motor units with aging. Muscle Nerve 11, 423–432. doi: 10.1002/mus.880110503
Coers, C. (1953). Contribution to the study of the myoneural junction. II. Zonal topography of the terminal motor innervation of striated muscles. Arch. Biol. (Liege) 64, 495–508.
de Carvalho, M., Dengler, R., Eisen, A., England, J. D., Kaji, R., Kimura, J., et al. (2008). Electrodiagnostic criteria for diagnosis of ALS. Clin. Neurophysiol. 119, 497–503. doi: 10.1016/j.clinph.2007.09.143
de Carvalho, M., and Swash, M. (2012). Fasciculation potentials: still mysterious. Clin. Neurophysiol. 123, 227–228. doi: 10.1016/j.clinph.2011.07.002
DeFreitas, J. M., Costa, P. B., Ryan, E. D., Herda, T. J., Cramer, J. T., and Beck, T. W. (2010). Innervation zone location of the biceps brachii, a comparison between genders and correlation with anthropometric measurements. J. Electromyogr. Kinesiol. 20, 76–80. doi: 10.1016/j.jelekin.2008.09.009
Drost, G., Kleine, B. U., Stegeman, D. F., van Engelen, B. G., and Zwarts, M. J. (2007). Fasciculation potentials in high-density surface EMG. J. Clin. Neurophysiol. 24, 301–307. doi: 10.1097/WNP.0b013e31803bba04
Enck, P., Franz, H., Azpiroz, F., Fernandez-Fraga, X., Hinninghofen, H., Kaske-Bretag, K., et al. (2004). Innervation zones of the external anal sphincter in healthy male and female subjects. Preliminary results. Digestion 69, 123–130. doi: 10.1159/000077878
Falla, D., Dall’Alba, P., Rainoldi, A., Merletti, R., and Jull, G. (2002). Location of innervation zones of sternocleidomastoid and scalene muscles–a basis for clinical and research electromyography applications. Clin. Neurophysiol. 113, 57–63. doi: 10.1016/S1388-2457(01)00708-8
Fuglevand, A. J., Winter, D. A., Patla, A. E., and Stashuk, D. (1992). Detection of motor unit action potentials with surface electrodes: influence of electrode size and spacing. Biol. Cybern. 67, 143–153. doi: 10.1007/BF00201021
Guzman-Venegas, R. A., Araneda, O. F., and Silvestre, R. A. (2014). Differences between motor point and innervation zone locations in the biceps brachii. An exploratory consideration for the treatment of spasticity with botulinum toxin. J Electromyogr. Kinesiol. 24, 923–927. doi: 10.1016/j.jelekin.2014.07.012
Hilfiker, P., and Meyer, M. (1984). Normal and myopathic propagation of surface motor unit action potentials. Electroencephalogr. Clin. Neurophysiol. 57, 21–31. doi: 10.1016/0013-4694(84)90004-X
Jahanmiri-Nezhad, F., Barkhaus, P. E., Rymer, W. Z., and Zhou, P. (2014a). Sensitivity of fasciculation potential detection is dramatically reduced by spatial filtering of surface electromyography. Clin. Neurophysiol. 125, 1498–1500. doi: 10.1016/j.clinph.2013.11.033
Jahanmiri-Nezhad, F., Li, X., Barkhaus, P. E., Rymer, W. Z., and Zhou, P. (2014b). A clinically applicable approach for detecting spontaneous action potential spikes in amyotrophic lateral sclerosis with a linear electrode array. J. Clin. Neurophysiol. 31, 35–40. doi: 10.1097/01.wnp.0000436896.02502.31
Jahanmiri-Nezhad, F., Barkhaus, E. P., Rymer, W. Z., and Zhou, P. (2014c). Spike sorting paradigm for classification of multi-channel recorded fasciculation potentials. Comput. Biol. Med. 55, 26–35.
Kleine, B. U., Boekestein, W. A., Arts, I. M., Zwarts, M. J., Schelhaas, H. J., and Stegeman, D. F. (2012). Fasciculations and their F-response revisited: high-density surface EMG in ALS and benign fasciculations. Clin. Neurophysiol. 123, 399–405. doi: 10.1016/j.clinph.2011.06.032
Kleine, B. U., Stegeman, D. F., Schelhaas, H. J., and Zwarts, M. J. (2008). Firing pattern of fasciculations in ALS: evidence for axonal and neuronal origin. Neurology 70, 353–359. doi: 10.1212/01.wnl.0000300559.14806.2a
Lateva, Z. C., McGill, K. C., and Johanson, M. E. (2002). Electrophysiological evidence of adult human skeletal muscle fibres with multiple endplates and polyneuronal innervation. J. Physiol. 544(Pt 2), 549–565. doi: 10.1113/jphysiol.2002.023267
Lateva, Z. C., McGill, K. C., and Johanson, M. E. (2010). The innervation and organization of motor units in a series-fibered human muscle: the brachioradialis. J Appl. Physiol. (1985), 108, 1530–1541. doi: 10.1152/japplphysiol.01163.2009
Martin, S., and MacIsaac, D. (2006). Innervation zone shift with changes in joint angle in the brachial biceps. J. Electromyogr. Kinesiol. 16, 144–148. doi: 10.1016/j.jelekin.2005.06.010
Masuda, T., Miyano, H., and Sadoyama, T. (1983). The distribution of myoneural junctions in the biceps brachii investigated by surface electromyography. Electroencephalogr. Clin. Neurophysiol. 56, 597–603. doi: 10.1016/0013-4694(83)90027-5
Masuda, T., and Sadoyama, T. (1986). The propagation of single motor unit action potentials detected by a surface electrode array. Electroencephalogr. Clin. Neurophysiol. 63, 590–598. doi: 10.1016/0013-4694(86)90146-X
McGill, K. C. (2004). Surface electromyogram signal modelling. Med. Biol. Eng. Comput. 42, 446–454. doi: 10.1007/BF02350985
Merletti, R., Farina, D., and Gazzoni, M. (2003). The linear electrode array: a useful tool with many applications. J. Electromyogr. Kinesiol. 13, 37–47. doi: 10.1016/S1050-6411(02)00082-2
Mesin, L., Gazzoni, M., and Merletti, R. (2009a). Automatic localisation of innervation zones: a simulation study of the external anal sphincter. J. Electromyogr. Kinesiol. 19, e413–e421. doi: 10.1016/j.jelekin.2009.02.002
Mesin, L., Merletti, R., and Rainoldi, A. (2009b). Surface EMG: the issue of electrode location. J. Electromyogr. Kinesiol. 19, 719–726. doi: 10.1016/j.jelekin.2008.07.006
Navallas, J., and Stalberg, E. (2009). Studying motor end-plate topography by means of scanning-electromyography. Clin. Neurophysiol. 120, 1335–1341. doi: 10.1016/j.clinph.2009.05.014
Nishihara, K., Chiba, Y., Suzuki, Y., Moriyama, H., Kanemura, N., Ito, T., et al. (2010). Effect of position of electrodes relative to the innervation zone onsurface EMG. J. Med. Eng. Technol. 34, 141–147. doi: 10.3109/03091900903480754
Nishihara, K., Kawai, H., Chiba, Y., Kanemura, N., and Gomi, T. (2013). Investigation of innervation zone shift with continuous dynamic muscle contraction. Comput. Math. Methods Med. 2013:174342. doi: 10.1155/2013/174342
Piitulainen, H., Rantalainen, T., Linnamo, V., Komi, P., and Avela, J. (2009). Innervation zone shift at different levels of isometric contraction in the biceps brachii muscle. J. Electromyogr. Kinesiol. 19, 667–675. doi: 10.1016/j.jelekin.2008.02.007
Roeleveld, K., Stegeman, D. F., Vingerhoets, H. M., and Van Oosterom, A. (1997a). Motor unit potential contribution to surface electromyography. Acta Physiol. Scand. 160, 175–183. doi: 10.1046/j.1365-201X.1997.00152.x
Roeleveld, K., Stegeman, D. F., Vingerhoets, H. M., and Van Oosterom, A. (1997b). The motor unit potential distribution over the skin surface and its use in estimating the motor unit location. Acta Physiol. Scand. 161, 465–472. doi: 10.1046/j.1365-201X.1997.00247.x
Stalberg, E., and Karlsson, L. (2001a). Simulation of EMG in pathological situations. Clin. Neurophysiol. 112, 869–878.
Keywords: innervation zone, ALS, fasciculation potentials, motor unit potentials, linear array EMG electrode, reinnervation
Citation: Jahanmiri-Nezhad F, Barkhaus PE, Rymer WZ and Zhou P (2015) Innervation zones of fasciculating motor units: observations by a linear electrode array. Front. Hum. Neurosci. 9:239. doi: 10.3389/fnhum.2015.00239
Received: 03 February 2015; Accepted: 13 April 2015;
Published online: 12 May 2015.
Edited by:
Guang H. Yue, Kessler Foundation Research Center, USACopyright © 2015 Jahanmiri-Nezhad, Barkhaus, Rymer and Zhou. This is an open-access article distributed under the terms of the Creative Commons Attribution License (CC BY). The use, distribution or reproduction in other forums is permitted, provided the original author(s) or licensor are credited and that the original publication in this journal is cited, in accordance with accepted academic practice. No use, distribution or reproduction is permitted which does not comply with these terms.
*Correspondence: Faezeh Jahanmiri-Nezhad, Single Motor Unit Lab, Sensory Motor Performance Program, Rehabilitation Institute of Chicago, Chicago, IL, USA, faezeh.jahanmiri@gmail.com