GRETNA: a graph theoretical network analysis toolbox for imaging connectomics
 Jinhui Wang
 Xindi Wang
 Mingrui Xia
 Xuhong Liao
 Alan Evans
 Yong He
- 1State Key Laboratory of Cognitive Neuroscience and Learning and IDG/McGovern Institute for Brain Research, Beijing Normal University, Beijing, China
- 2Center for Cognition and Brain Disorders, Hangzhou Normal University, Hangzhou, China
- 3Zhejiang Key Laboratory for Research in Assessment of Cognitive Impairments, Hangzhou, China
- 4McConnell Brain Imaging Center, Montreal Neurological Institute, McGill University, Montreal, QC, Canada
Recent studies have suggested that the brain’s structural and functional networks (i.e., connectomics) can be constructed by various imaging technologies (e.g., EEG/MEG; structural, diffusion and functional MRI) and further characterized by graph theory. Given the huge complexity of network construction, analysis and statistics, toolboxes incorporating these functions are largely lacking. Here, we developed the GRaph thEoreTical Network Analysis (GRETNA) toolbox for imaging connectomics. The GRETNA contains several key features as follows: (i) an open-source, Matlab-based, cross-platform (Windows and UNIX OS) package with a graphical user interface (GUI); (ii) allowing topological analyses of global and local network properties with parallel computing ability, independent of imaging modality and species; (iii) providing flexible manipulations in several key steps during network construction and analysis, which include network node definition, network connectivity processing, network type selection and choice of thresholding procedure; (iv) allowing statistical comparisons of global, nodal and connectional network metrics and assessments of relationship between these network metrics and clinical or behavioral variables of interest; and (v) including functionality in image preprocessing and network construction based on resting-state functional MRI (R-fMRI) data. After applying the GRETNA to a publicly released R-fMRI dataset of 54 healthy young adults, we demonstrated that human brain functional networks exhibit efficient small-world, assortative, hierarchical and modular organizations and possess highly connected hubs and that these findings are robust against different analytical strategies. With these efforts, we anticipate that GRETNA will accelerate imaging connectomics in an easy, quick and flexible manner. GRETNA is freely available on the NITRC website.1
Introduction
The human brain operates as an interconnected network that responds to various inputs from different sensory systems in real time. A substantial body of evidence suggests that the powerful performance arises from a highly optimized wiring layout embedded in our brains by coordinating neural activities among distributed neuronal populations and brain regions (Mesulam, 1990; McIntosh, 1999; Bressler and Menon, 2010). Mapping and characterization of the underlying structural and functional connectivity patterns of the human brain (i.e., connectomics; Sporns et al., 2005; Biswal et al., 2010) in both typical and atypical population is therefore fundamental since they provide invaluable insights into how the collective of the human brain elements is topologically organized to promote cognitive demands (Park and Friston, 2013) and how the topology dynamically reorganizes to respond to various brain disorders (Bullmore and Sporns, 2009; He and Evans, 2010; Rubinov and Bullmore, 2013).
Recent advances in the human connectomics have shown that human brain networks can be non-invasively obtained from a variety of neurophysiological and neuroimaging techniques, such as electroencephalography/magnetoencephalography (EEG/MEG), functional near infrared spectroscopy (fNIRS), structural MRI, diffusion MRI and functional MRI. Based on data from these modalities, the brain networks can be generally categorized into structural networks and functional networks. Structural brain networks can be constructed by calculating interregional morphological correlations (e.g., cortical thickness) based on structural MRI (He et al., 2007; Bassett et al., 2008; Tijms et al., 2012) or by tracing interregional fiber pathways based on diffusion MRI (Hagmann et al., 2007; Iturria-Medina et al., 2007; Gong et al., 2009). Functional brain networks can be derived by estimating interregional statistical dependences in the BOLD signal from functional MRI (Biswal et al., 1995; Salvador et al., 2005), regional cerebral blood flow from arterial spin labeling (Liang et al., 2014), oxygenated/deoxygenated hemoglobin concentrations from functional near-infrared spectroscopy (fNIRS; Niu et al., 2012) or electrophysiological signals from EEG/MEG (Stam, 2004; Stam et al., 2007). Once the brain networks are constructed, a common mathematical framework based on graph theory can be employed to topologically characterize the organizational principles that govern the networks. In graph theory, a network is abstracted as a graph composed of a collective of nodes linked by edges. For human brain networks, nodes typically represent structurally, functionally or randomly defined regions of interest (ROIs), and edges represent inter-nodal structural or functional connectivity that can be derived from the above-mentioned data modalities.
Recent years have witnessed a surge of interest in the study of human brain networks (Bullmore and Sporns, 2009; Xia and He, 2011; Filippi et al., 2013). In response, several freely available toolboxes have been developed to implement and visualize graph-based topological analyses of brain networks, such as the Brain Connectivity Toolbox (BCT; Rubinov and Sporns, 2010), eConnectome (He et al., 2011), CONN (Whitfield-Gabrieli and Nieto-Castanon, 2012), Graph-Analysis Toolbox (GAT; Hosseini et al., 2012) and GraphVar (Kruschwitz et al., 2015). Specifically, we have previously developed PANDA (Cui et al., 2013) for the construction of structural brain networks based on diffusion imaging data and BrainNet Viewer (Xia et al., 2013) toolkits for the visualization of brain networks. These toolboxes, with distinct advantages and unique scopes of application (Table 1), together tremendously accelerate the progress of brain connectome studies. However, these toolboxes either cover only single functions of network construction, analysis or statistics or are powerless or inflexible in the face of huge computational loads and complex and diverse processes (Table 1, we will return this issue in the “Discussion” Section). A complete, efficient and flexible pipeline toolbox for imaging connectomics is currently lacking.
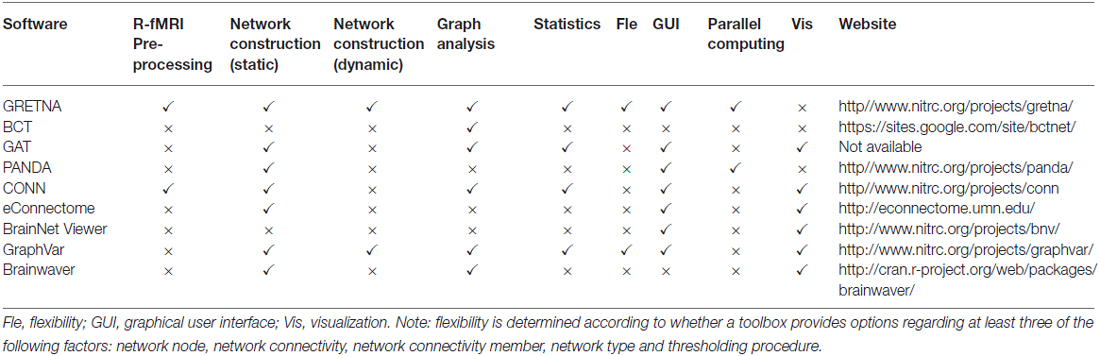
Table 1. Summary of neuroscience connectomics tools.
Here, we developed the GRaph thEoreTical Network Analysis (GRETNA) toolbox to perform comprehensive graph-based topological analyses of brain networks. The GRETNA is a Matlab-based, open-source package with a graphical user interface (GUI). Compared with previous toolboxes, the most impressive features of GRETNA are the combination of multiple functional modules, flexible manipulation and parallel computation (Table 1). Specifically, GRETNA incorporates network construction, analysis and comparison modules to provide a complete and automatic pipeline for connectomics. Given the popularity of resting-state functional MRI (R-fMRI) in mapping intrinsic brain connectivity patterns and studying the topological architecture of diseased brains (Biswal et al., 1995; Fox and Raichle, 2007; Van Dijk et al., 2010; Wang et al., 2010), GRETNA exclusively extends the capabilities for R-fMRI data preprocessing and subsequent network construction procedures. Moreover, GRETNA enables an easy, quick and flexible manner to manipulate different network analytical strategies, including structurally, functionally or randomly defined network nodes, positive or negative connectivity processing, binary or weighted network types and the choices of different thresholding procedures or ranges. Finally, GRETNA is capable of performing parallel computing in the network construction and analysis modules, an intriguing feature that can substantially shorten the duration of network analyses of large data sets. With these efforts, we anticipate that this toolbox will facilitate graph-based brain network studies, particularly those based on R-fMRI data. Currently, the Gretna has been successfully applied to many previous connectome studies (He et al., 2008; Wang et al., 2011, 2015; Cao et al., 2013; Zhong et al., 2015).
Materials and Methods
Overview of Functionality of GRETNA
GRETNA is an open-source, Matlab-based, cross-platform (Windows and UNIX OS) package under General Public License (GPL) that provides a GUI framework to implement comprehensive graph-based analyses of network topology, perform statistical comparisons of between-group differences in network metrics and examine the relationships between network properties and other variables of interest. It is worth emphasizing that these functionalities are applicable to any connectivity networks that are derived from various toolboxes (e.g., PANDA), data modalities (e.g., EEG/MEG, fNIRS and MRI), species (e.g., humans, monkey and cat) and research fields (e.g., social networks and transportation networks). In particular, GRETNA allows researchers to preprocess human R-fMRI data and construct intrinsic functional brain networks.
GRETNA is divided into three sections: network construction, network analysis and network comparisons (Figure 1). In the network construction section, GRETNA allows researchers to: (i) perform R-fMRI data preprocessing, including volume removal, slice timing, realignment, spatial normalization, spatial smoothing, detrend, temporal filtering and removal of confounding variables by regression; (ii) compute voxel-based degree centrality (i.e., functional connectivity density); and (iii) construct region-based connectivity matrices (Figure 2). In this section, GRETNA accepts two types of data: DICOM data or Neuroimaging Informatics Technology Initiative (NIfTI) images (3D/4D). In the network analysis section, GRETNA allows researchers to: (i) convert individual connectivity matrices into a series of sparse networks according to the pre-assigned parameters of the network type (binary or weighted), network connectivity member (absolute, positive or negative), threshold type (connectivity strength or sparsity) and threshold range; (ii) generate benchmark random networks that match real brain networks in the number of nodes and edges and degree distribution; and (iii) calculate graph-based global and nodal network metrics (Figure 3). In this section, GRETNA accepts two types of data: text files (i.e., .txt) or Matlab data files (i.e., .mat). In the final network comparison section, GRETNA allows researchers to: (i) perform statistical inference on global, nodal and connectional network parameters; and (ii) estimate network-behavior relationships (Figure 4). It is worth highlighting that GRETNA executes parallel computing throughout R-fMRI data pre-processing, network construction and network parameter calculation by allotting processing tasks to different computational cores. This was done by calling the PSOM toolbox (Bellec et al., 2012) in a single PC. Of note, the parallel computing can work not only for multiple subjects, but also for a single subject when computing multiple network metrics. Figure 5 presents the flowchart of brain network construction and topological characterization and explains how parallel computing works. Below we describe these procedures in detail.
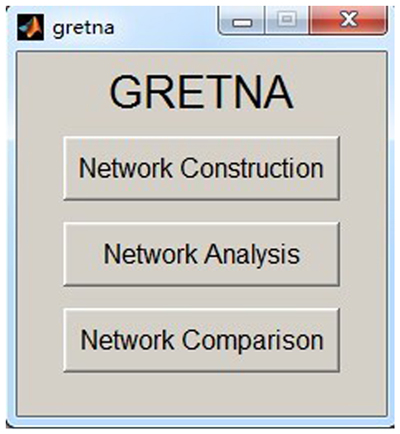
Figure 1. The graphical user interface (GUI) of GRETNA. The main window of GRETNA includes three panels: network construction, network analysis and network comparison.
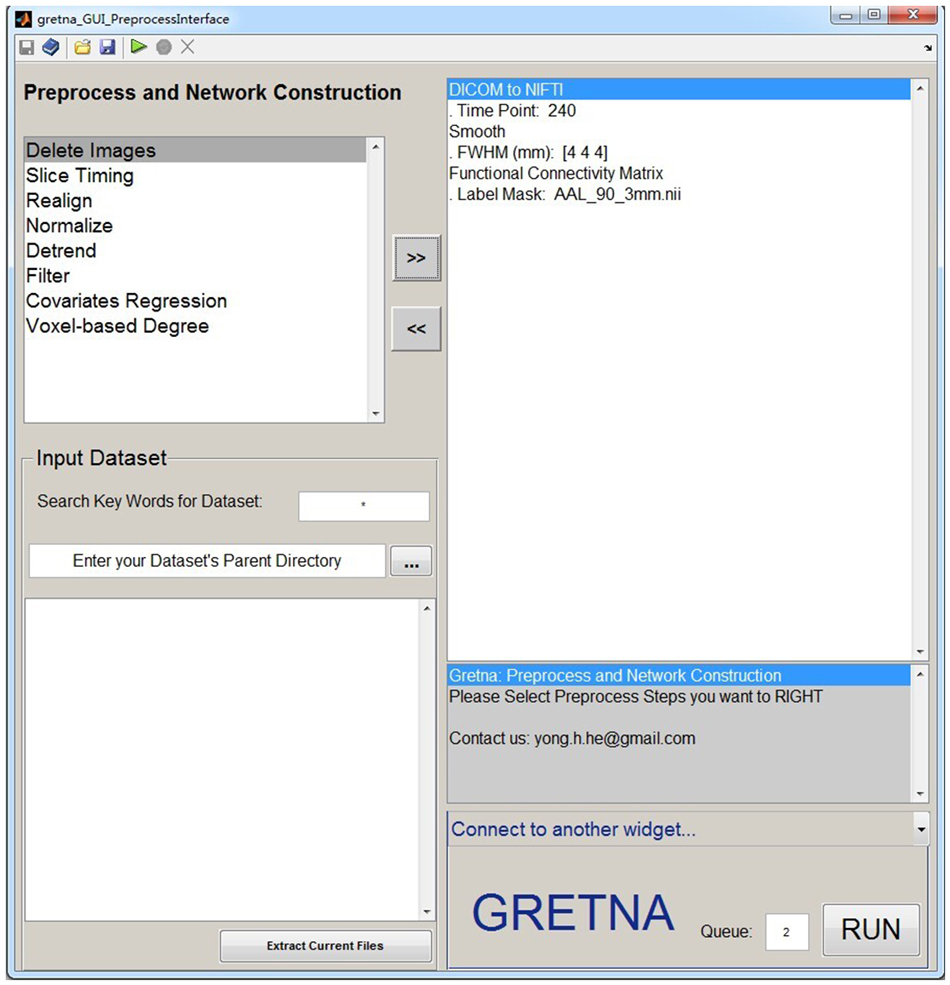
Figure 2. The GUI panel of network construction. In this panel, GRETNA allows researchers to perform all common preprocessing steps used by the R-fMRI community and construct large-scale functional brain networks using different region-based parcellations. Voxel-based degree centrality can also be computed here.
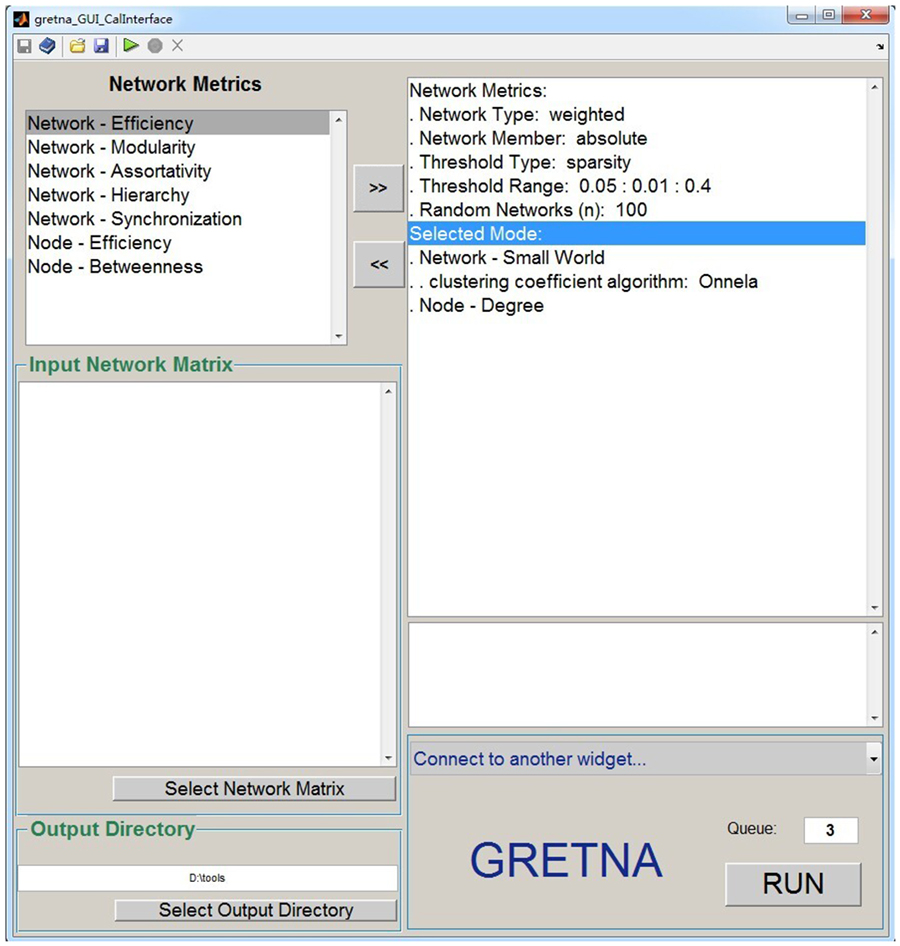
Figure 3. The GUI panel of network analysis. In this panel, GRETNA allows researchers to calculate many global and nodal graph-based metrics used in brain network studies. This panel provides flexible manipulations for researchers regarding the thresholding procedure, network type and network connectivity member. Notably, null random networks can be generated here to benchmark the results derived from brain networks.
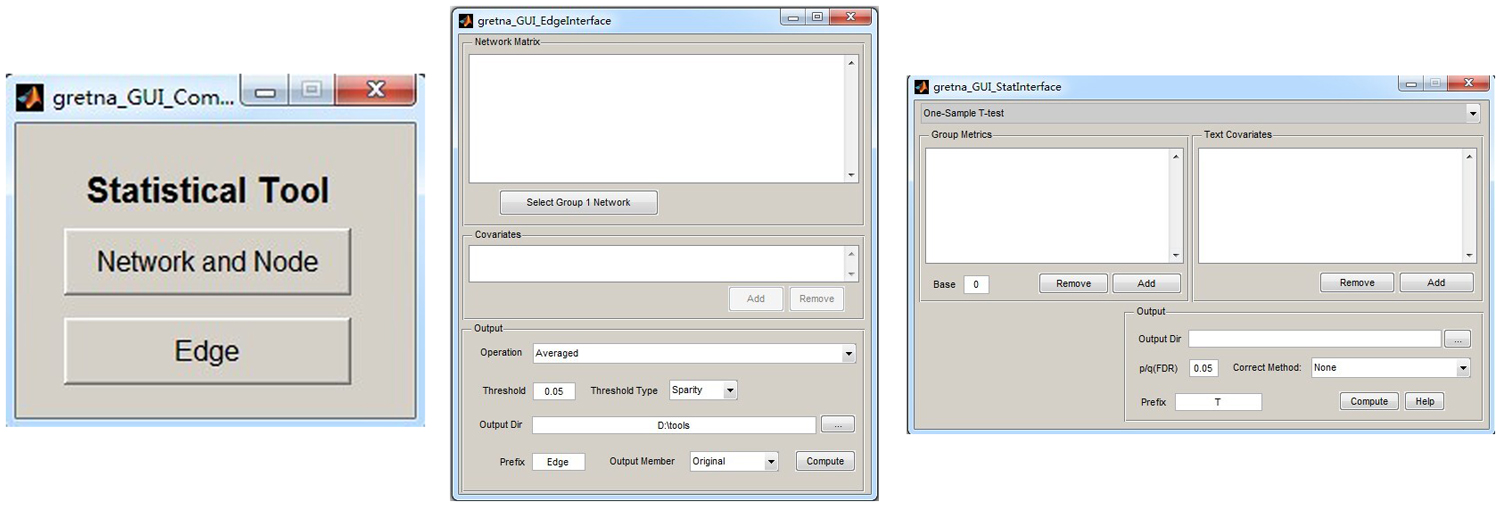
Figure 4. The GUI panel of network comparison. In this panel, GRETNA allows researchers to statistically infer effects of interest on network measures (global, nodal and connectional) using different parametric models and examine relationships between network measures and other variables (e.g., behavioral and clinical variables).
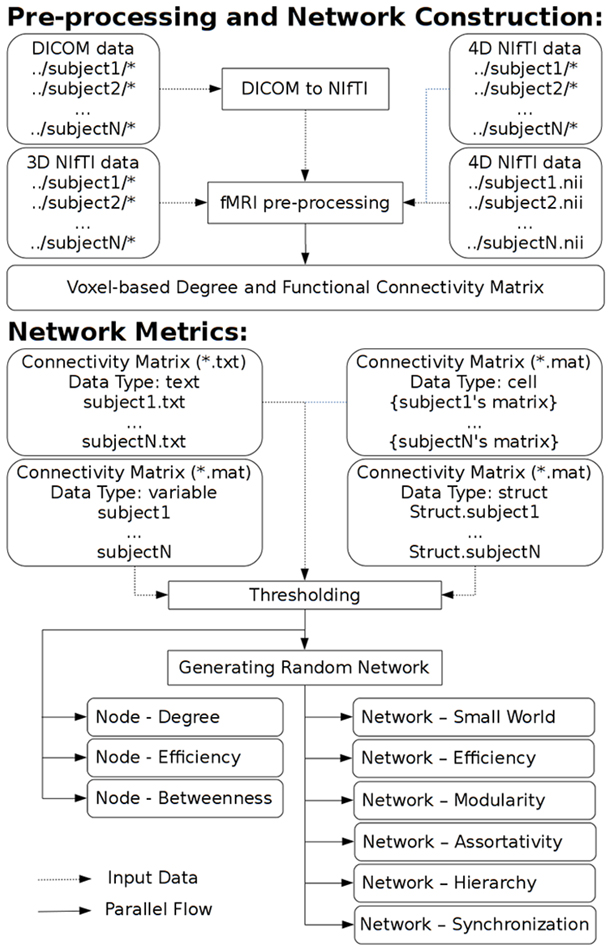
Figure 5. A flowchart to explain brain network construction, topological characterization and parallel computing.
Network Construction
In this section, GRETNA allows researchers to perform several preprocessing steps of R-fMRI data, that are commonly used in the community, and then construct large-scale brain networks by calculating the pairwise functional connectivity among a set of ROI according to a brain parcellation scheme. Notably, researchers can arbitrarily designate the order of preprocessing steps.
Data Format Conversion
Before formal data preprocessing, the DICOM data, a format output from most MRI scanners, is typically transformed into other formats, e.g., NIfTI format. Compared with the previous analyze file format, the NIfTI format contains new and important features, such as affine coordinate definitions that relate a voxel index to a spatial location, indicators of the spatial normalization type and records of the spatio-temporal slice ordering. This conversion is achieved in GRETNA by calling dcm2nii in the MRIcroN software.2
Removal of Volumes
The first several volumes of individual functional images are often discarded for magnetization equilibrium. GRETNA allows researchers to delete the first several volumes by specifying either the number of volumes to be deleted or the number of volumes to be retained. The latter is useful for across-datasets or across-center studies in which numbers of image volumes are usually different.
Slice Timing Correction
Currently, R-fMRI datasets are usually acquired using repeated 2D imaging methods, which leads to temporal offsets between slices. The slice-timing effects have been demonstrated to have prominent effects on study results and can be successfully compensated by the slice timing correction step (i.e., temporal data interpolation; Sladky et al., 2011). This is performed in GRETNA by calling the corresponding SPM8 functions. Of note, for a longer repeat time (e.g., > 3 s), within which a whole brain volume is acquired, it is advised to omit the slice time correction step because interpolation in this case becomes less accurate.
Realignment
During an MR scan, participants inevitably undergo various degrees of head movements even when foam pads are used. The movements break the spatial correspondence of the brain across volumes. This step realigns individual images so that each part of the brain in all volumes is in the same position. This is performed in GRETNA by calling relevant SPM8 functions.
Spatial Normalization
For group average and group comparison purposes, individual data are usually transformed into a standardized space to account for the variability in brain size, shape and anatomy. This can be accomplished in GRETNA by two methods based on the SPM8 functions: (i) directly warping individual functional images to standard MNI space by estimating their transformation to the echo-planar imaging (EPI) template (Ashburner and Friston, 1999); and (ii) warping individual functional images to standard MNI space by applying the transformation matrix that can be derived from registering the T1 image (co-registered with functional images) into the MNI template (Ashburner and Friston, 2005). The latter method tends to improve the accuracy of spatial normalization when the distortions of functional data are negligible, which is important to ensure effective cross-modality co-registration.
Spatial Smoothing
Smoothing, a common preprocessing step after spatial normalization, is used to improve the signal to noise ratio and attenuate anatomical variances due to inaccurate inter-subject registration. GRETNA performs spatial smoothing using a Gaussian filter with a shape that can be determined by a 3-value vector of full width at half maximum (FWHM) as implemented in SPM8.
Detrend
FMRI datasets may suffer from a systematic increase or decrease in the signal with time presumably due to long-term physiological shifts or instrumental instability (Lowe and Russell, 1999). GRETNA provides an option to reduce the effects of linear and non-linear drift or trend in the signal on the basis of relevant SPM8 functions. It should be noted that this step is still controversial (Smith et al., 1999) and researchers should interpret their results with caution if detrend is implemented.
Temporal Filtering
Previous studies have shown that spontaneous brain activity is predominantly subtended by the low-frequency components (0.01–0.1 Hz) of R-fMRI signals (Biswal et al., 1995; Lowe et al., 1998; Kiviniemi et al., 2000). Thus, R-fMRI data are typically band-pass filtered to reduce the effects of low frequency drift and high-frequency physiological noises. Notably, even in the typically used low-frequency intervals, accumulating evidence suggests that functional brain architectures are distinct across different frequency bands (Achard et al., 2006; Salvador et al., 2008; Zuo et al., 2010; Liao et al., 2013) and show frequency-specific alterations in neurological and psychiatric disorders, such as Alzheimer’s disease and mild cognitive impairment (Han et al., 2011; Wang et al., 2013; Liu et al., 2014). Moreover, recent studies highlight the physiological significance of high frequency fluctuations (Boubela et al., 2013; Liao et al., 2013). In GRETNA, we provide an option for researchers to easily choose the frequency ranges that the data will be filtered with an ideal box filter function. This is done by converting a time series into frequency domain using a Fast Fourier Transform (FFT), retaining amplitude spectrum for frequency components of interest and setting amplitude spectrum to 0 for other frequency components, and converting the new amplitude spectrum into time domain by an inverse FFT transform.
Removal of Confounding Variables
For R-fMRI datasets, several nuisance signals are typically removed from each voxel’s time series to reduce the effects of non-neuronal fluctuations, including head motion profiles, the cerebrospinal fluid (CSF) signal, the white matter (WM) signals and/or the global signal (Greicius et al., 2003; Fox et al., 2005). In GRETNA, researchers can assign any combination of these variables to be variables of no interest, which will be regressed out. By default, the global signal, CSF signal and WM signal are calculated within the BrainMask_05_61_73_61.img, the CsfMask_07_61_73_61.img and the WhiteMask_09_61_73_61.img, respectively. The three images are from the REST toolbox (Song et al., 2011) and separately correspond to brain masks of the whole brain, cerebral spinal fluid and WM in the standard MNI space. In addition, the first-order derivative of head motion profiles can also be removed.
Voxel-Based Degree
Degree is a measure that quantifies the importance/centrality of a node through the number and/or strength of connections to all other nodes in a network. Degree centrality has been widely used in brain network studies because it tends to have higher test-retest (TRT) reliability than other nodal centrality metrics (Wang et al., 2011; Cao et al., 2014), and it is well in line with physiological measures, such as the rates of cerebral blood flow and glucose metabolism (Liang et al., 2013; Tomasi et al., 2013). Three parameters are needed for voxel-based degree analysis based on R-fMRI data: (i) a brain mask to indicate the coverage of brain regions; (ii) a correlation threshold to exclude low-level correlations (e.g., 0.2); and (iii) a distance threshold to determine short/long connections. Using GRETNA, we can obtain a total of 18 voxel-based degree maps for each participant that vary across connectivity distance (i.e., short-, long- or full-range), sign (i.e., positive, negative or absolute) and type (i.e., binary or weighted). Researchers can choose these degree maps according to their research objectives.
Functional Connectivity Matrix
This option is used to construct individual interregional functional connectivity matrices in two major steps: regional parcellation (i.e., network node definition) and functional connectivity estimation (i.e., network edge definition). GRETNA provides options for several different parcellation schemes, including the structurally defined Anatomical Automatic Labeling atlas (AAL-90; Tzourio-Mazoyer et al., 2002) and Harvard-Oxford atlas (HOA-112; Kennedy et al., 1998; Makris et al., 1999) and the functionally defined Dos-160 (Dosenbach et al., 2006, 2010), Crad-200 (Craddock et al., 2012), Power-264 (Power et al., 2011) and Fair-34 (Fair et al., 2009). Additionally, GRETNA also contains functions that can be used to parcel the brain into an arbitrary number of ROIs with same or different sizes (Zalesky et al., 2010b). These parcellation approaches provide flexible choices to determine network nodes for specific research objectives and allow researchers to test the robustness of their findings across different regional parcellations (Wang et al., 2013). Once a parcellation scheme is chosen, a mean time series will be extracted from each parcellation unit, and pairwise functional connectivity is then estimated among the time series by calculating linear Pearson correlation coefficients. This will generate an N X N correlation matrix, with N being the number of regions included in the selected brain parcellation for each participant. Of note, this section also allows researchers to construct dynamic correlation matrix based on a sliding time-window approach.
Network Analysis
In this section, GRETNA can calculate various topological properties of a network or graph from both global and nodal aspects, which can be compared with counterparts of random networks to determine the non-randomness.
Thresholding
Prior to topological characterization, a thresholding procedure is typically applied to exclude the confounding effects of spurious relationships in interregional connectivity matrices. Two thresholding strategies are provided in GRETNA: the absolute connectivity strength threshold and relative sparsity threshold (He et al., 2009). Specifically, for the connectivity strength threshold, researchers can define a threshold value such that network connections with weights greater than the given threshold are retained and others are ignored (i.e., set to 0s). This connectivity strength threshold method allows for the examination of the absolute network organization. Note that the same connectivity strength threshold usually leads to a different number of edges in the resultant networks, which could confound between-group comparisons in network topology (van Wijk et al., 2010). To address this problem, GRETNA provides an alternative threshold method—sparsity or density threshold. Sparsity is defined as the ratio of the number of actual edges divided by the maximum possible number of edges in a network. For networks with the same number of nodes, the sparsity threshold ensures the same number of edges for each network by applying a subject-specific connectivity strength threshold and therefore allowing an examination of relative network organization (He et al., 2009). These two thresholding strategies are complementary and together provide a comprehensive method to test the network organization. Finally, given the absence of definitive way in selecting a single threshold, researchers can input a range of continuous threshold values to study network properties in GRETNA.
Network Type
Networks can be binarized or weighted depending on whether the connectivity strength is taken into account. Previous brain network studies have mainly focused on binary networks due to the reduction in computational complexity and clearness of network metric definitions. Notably, binary networks neglect the strength of connections above the threshold, and therefore fail to identify subtle network organizations (Cole et al., 2010). In GRETNA, all network analyses can be conducted for both binary and weighted networks. Briefly, a connectivity matrix Cij = [cij]can be converted into either a binary network
or a weighted network
where rthr is a connectivity strength threshold that is the same across all subjects for the connectivity strength thresholding procedure or a subject-specific connectivity strength threshold determined by the sparsity thresholding procedure. It should be emphasized that for weighted network analysis, the connectivity strength must reflect similarity (e.g., correlation coefficient) because the reciprocal of connectivity strength is used to calculate inter-nodal path length.
Network Connectivity Member
Previous R-fMRI studies have found that certain functional systems are anti-correlated (i.e., have a negative correlation) in their spontaneous brain activity (Greicius et al., 2003; Fox et al., 2005). However, negative correlations may also be introduced by global signal removal, a preprocessing step that is currently controversial (Fox et al., 2009; Murphy et al., 2009; Weissenbacher et al., 2009; Schölvinck et al., 2010). For network topology, negative correlations may have detrimental effects on TRT reliability (Wang et al., 2011) and exhibit organizations different from positive correlations (Schwarz and McGonigle, 2011). Accordingly, GRETNA provides options for researchers to determine the network connectivity members, based on which subsequent graph analyses are implemented: positive network (composed of only positive correlations), negative network (composed of only absolute negative correlations) or full network (composed of both positive correlations and the absolute values of the negative correlations).
Random Networks
Brain networks are typically compared with random networks to test whether they are configured with significantly non-random topology. In GRETNA, the random networks are generated by a Markov-chain algorithm (Maslov and Sneppen, 2002; Sporns and Zwi, 2004), which preserves the same number of nodes and edges and the same degree distribution as the real brain networks. Specifically, for a binary network, two edges (i1,j1) and (i2,j2), are first selected at random that is node i1 is connected to node j1 and node i2 is connected to node j2. If there are no edges between node i1 and node j2 and between node i2 and node j1, we then add two new edges, (i1,j2) and (i2,j1), to replace the original two edges, (i1,j1) and (i2,j2). This procedure is repeated 2 X the number of edges in the reference brain network to assure the randomized organization. For a weighted network the randomization is performed in a similar manner but in this case the weights are bound to the edges. It should be noted that how to generate random networks is an ongoing topic for brain network studies Zalesky et al. (2012); Hosseini and Kesler (2013). Therefore we also provide codes to generate random networks based on a time series randomization and correlation matrix randomization as introduced in Zalesky et al. (2012). Further studies are needed to produce null models that are more biologically meaningful as benchmarks for real brain networks.
Network Metrics
GRETNA can calculate several widely used network metrics in brain network studies for both binary and weighted networks. Generally, these measures can be categorized into global and nodal metrics. Global metrics include small-world parameters clustering coefficient and characteristic path length (Watts and Strogatz, 1998; Onnela et al., 2005), local efficiency and global efficiency (Latora and Marchiori, 2001, 2003), modularity (Newman, 2006), assortativity (Newman, 2002; Leung and Chau, 2007), synchronization (Barahona and Pecora, 2002; Motter et al., 2005) and hierarchy (Ravasz and Barabási, 2003). Nodal metrics include nodal degree, nodal efficiency (Achard and Bullmore, 2007) and nodal betweenness centrality (Freeman, 1977). Of note, during the calculation of the characteristic path length, local efficiency, global efficiency, nodal efficiency and betweenness, GRETNA computes the pairwise shortest path length matrix by calling functions from the MatlabBGL toolbox (version 4.0)3 (Floyd-Warshall algorithm for networks with density larger than 10% and Johnson’s algorithm otherwise). Additionally, GRETNA calculates the characteristic path length as the “harmonic mean” distance between all possible node pairs (Newman, 2003) to address the disconnected nodes. For the formula, usage and interpretation of these measures, see Rubinov and Sporns (2010) and Wang et al. (2011). Finally, GRETNA can also calculate the area under the curve (AUC) for each network measure to provide a scalar that does not depend on specific threshold selection (Wang et al., 2009; Zhang et al., 2011). It should be noted that this module can perform topological analysis of brain networks, independent of imaging modality and species. For example, the structural brain connectivity matrices in humans or macaques that are obtained from the PANDA software (Cui et al., 2013) or the CoCoMac database4 can be entered into the module for graph analysis.
Network Comparison
In this section, GRETNA allows researchers to perform statistical testing on global, nodal and connectional network measures. For global and nodal network measures, GRETNA provides several popular parametric models, including one-sample t-test, two-sample t-test, paired t-test, one-way analysis of variance (ANOVA) and repeated measures ANOVA. GRETNA also provides multiple comparison correction approaches, including the false discovery rate (FDR) and Bonferroni procedures. With respect to inter-nodal connection comparisons, one-sample t-test and two-sample t-test are provided, followed by multiple comparison correction procedures with FDR, Bonferroni or network-based statistic methods (Zalesky et al., 2010a). Finally, the statistical analysis of network-behavior correlation can be implemented in this section. In addition, covariates of no interests (e.g., age, gender and clinical variables) can be added into all of these statistical models.
Example R-fMRI Data to Illustrate the Usage of GRETNA
Participants and Data Acquisition
A publicly available TRT reliability dataset5 was employed to exemplify the usage of GRETNA. This dataset contains 57 healthy young volunteers in total (male/female: 30/27; age: 19–30 years) who completed two MRI scan sessions within an interval of approximately 6 weeks (40.94 ± 4.51 days). All participants were right-handed and had no history of neurological and psychiatric disorders. For the R-fMRI scans, participants were instructed to rest and relax with their eyes closed without falling asleep. Each R-fMRI scan includes 200 contiguous EPI functional volumes: time repetition (TR) = 2000 ms; time echo (TE) = 30 ms; flip angle (FA) = 90°; number of slices = 33; slice thickness = 3.5 mm; slice gap = 0.7 mm; matrix = 64 × 64; and field of view (FOV) = 200 × 200 mm2. Additionally, a high-resolution T1-weighted magnetization prepared gradient echo (MPRAGE) sequence was also obtained: TR = 2530 ms; TE = 3.39 ms; inversion time = 1100 ms; FA = 7°; number of slices = 144; slice thickness = 1.3 mm; slice gap = 0.65 mm; matrix = 256 × 192; and FOV = 256 × 256 mm2. Only the first session was used in the current study to explain the use of GRETNA. Of note, four participants were excluded due to excessive head motion or image quality (Dai et al., 2014).
Data Preprocessing
Data preprocessing included removal of the first 10 volumes, slice timing correction, head movement correction, spatial normalization (T1 segmentation), removal of linear trend, temporal band-pass filtering (0.01–0.1 Hz) and nuisance signal regression (24-parameter head motion profiles, global signal, CSF signal and WM signal).
Network Construction and Analysis
We first obtained 6 voxel-wise functional connectivity strength maps (i.e., voxel-based degree centrality maps) for each participant, which were combinations between network type (binary or weighted) and network connectivity member (positive, negative or absolute of both). We then constructed 6 inter-regional functional connectivity matrices for each participant according to the 6 different regional parcellation approaches provided in GRETNA (i.e., Power-264, Crad-200, Dos-160, Fair-34, AAL-90 and HOA-112). The order, location and name of each node under these parcellation atlases are provided in the toolbox (…\GRETNA\Templates)., These connectivity matrices were subsequently averaged across participants to derive 6 group-level mean connectivity matrices. These group-level matrices were further converted into a set of binary and weighted networks via connectivity strength (i.e., correlation) and sparsity thresholding procedures (both ranged from 0–1 with an interval of 0.04). Finally, we calculated various global (clustering coefficient, characteristic shortest path length, local efficiency, global efficiency, assortativity, hierarchy, synchronization and modularity) and nodal (nodal degree, nodal efficiency and nodal betweenness centrality) topological properties of these brain networks.
All imaging preprocessing, network construction and analyses were performed in the GRETNA toolbox. The results of the network analysis were visualized using the BrainNet Viewer toolbox (Xia et al., 2013).
Results
Voxel-Based Functional Connectivity Strength Maps
Figure 6 shows the mean voxel-based functional connectivity strength maps for all of the participants. We found that the functional connectivity strength was distributed heterogeneously over the brain with the most highly connected regions in the posterior cingulate gyrus, precuneus, medial prefrontal cortex, dorsolateral prefrontal cortex and subcortical structures (e.g., hippocampus, thalamus and amygdala). This pattern was generally robust across of network type (binary or weighted) and network connectivity member (absolute, positive or negative).
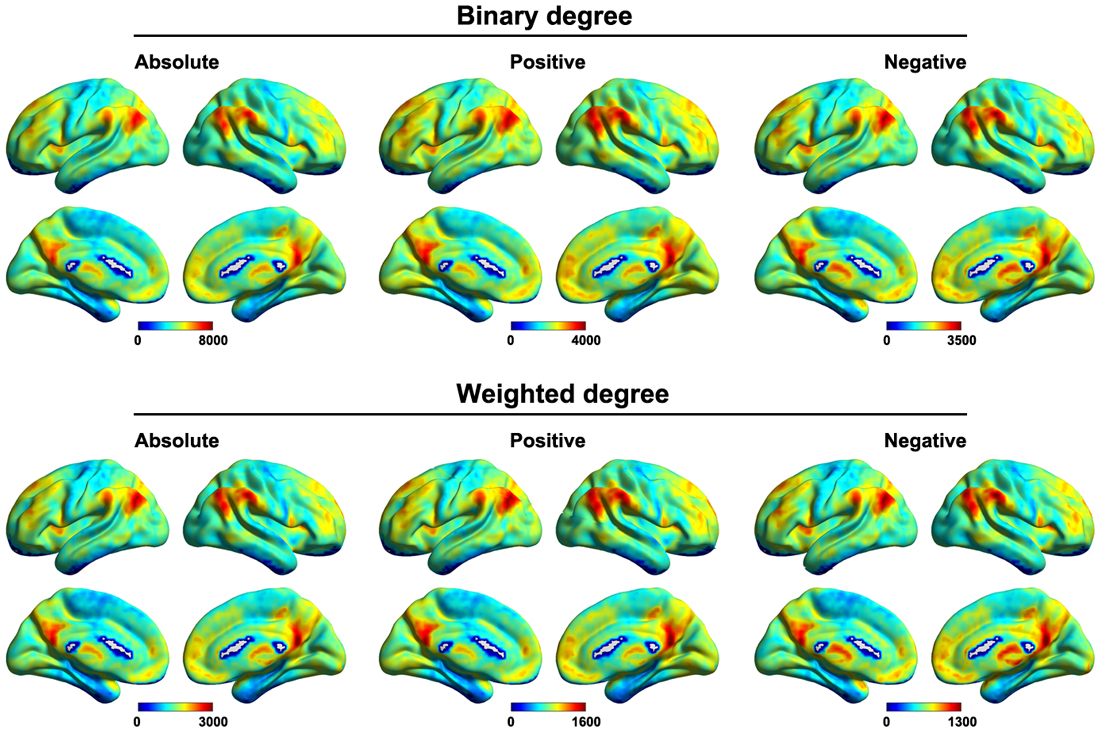
Figure 6. Mean voxel-based functional connectivity strength. Higher connectivity strength was observed primarily in the posterior cingulate gyrus, precuneus, medial prefrontal cortex, dorsolateral prefrontal cortex and subcortical structures. This pattern was generally robust across of network type (binary or weighted) and network connectivity member (absolute, positive or negative).
Region-based Brain Networks: Global Metrics
The mean interregional functional connectivity matrices derived under each regional parcellation scheme are shown in Figure 7. Given the fact that: (i) the R-fMRI data were mainly used to illustrate the usage of GRETNA; (ii) the analyzed network properties have been frequently studied under both healthy and pathological conditions (For relevant reviews, see Bullmore and Sporns, 2009; He and Evans, 2010; Stam, 2014); and (iii) our findings were largely comparable with previous studies and were qualitatively independent of the brain parcellation schemes used in the current study; we thus only took Power-264 as an example to present our findings since this parcellation provided the highest spatial resolution among the 6 atlases used. Figure 8 presents all global metrics (clustering coefficient, characteristic path length, local efficiency, global efficiency, assortativity, hierarchy, synchronization and modularity) for both the group-based brain network and the 100 matched random networks as a function of sparsity and correlation thresholds. The functional brain network exhibited different organization from random networks, as characterized by a higher clustering coefficient, characteristic path length, local efficiency, assortativity and modularity but lower global efficiency. Most of these findings were robust against the selection of network types and threshold procedures. Additionally, several network measures varied depending on the choices of network type or thresholding procedure. For example, only weighted network analysis revealed lower synchronization for the brain network than the random networks; a hierarchical structure was evident in the brain network only when the correlation-based thresholding method was used.
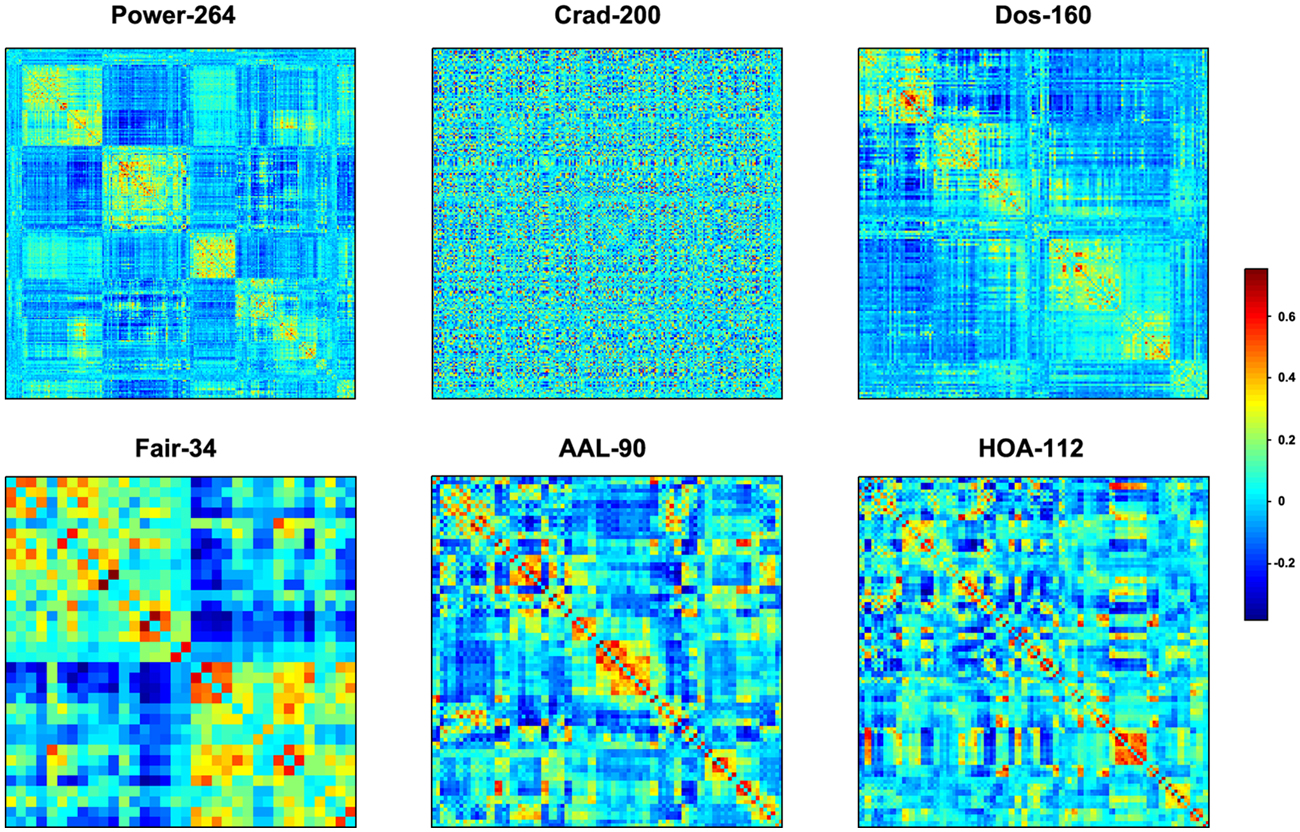
Figure 7. Mean inter-regional correlation matrices. Individual R-fMRI functional connectivity matrices were first transformed into z-score matrices (Fisher’s r-to-z transformation), then averaged across all participants, and finally inversely transformed into r-value matrices (Fisher’s r-to-z inverse transformation). Six different regional parcellation approaches were used, including four functionally defined parcellations (Power-264, Crad-200, Dos-160 and Fair-34) and two structurally defined parcellations (AAL-90 and HOA-112).
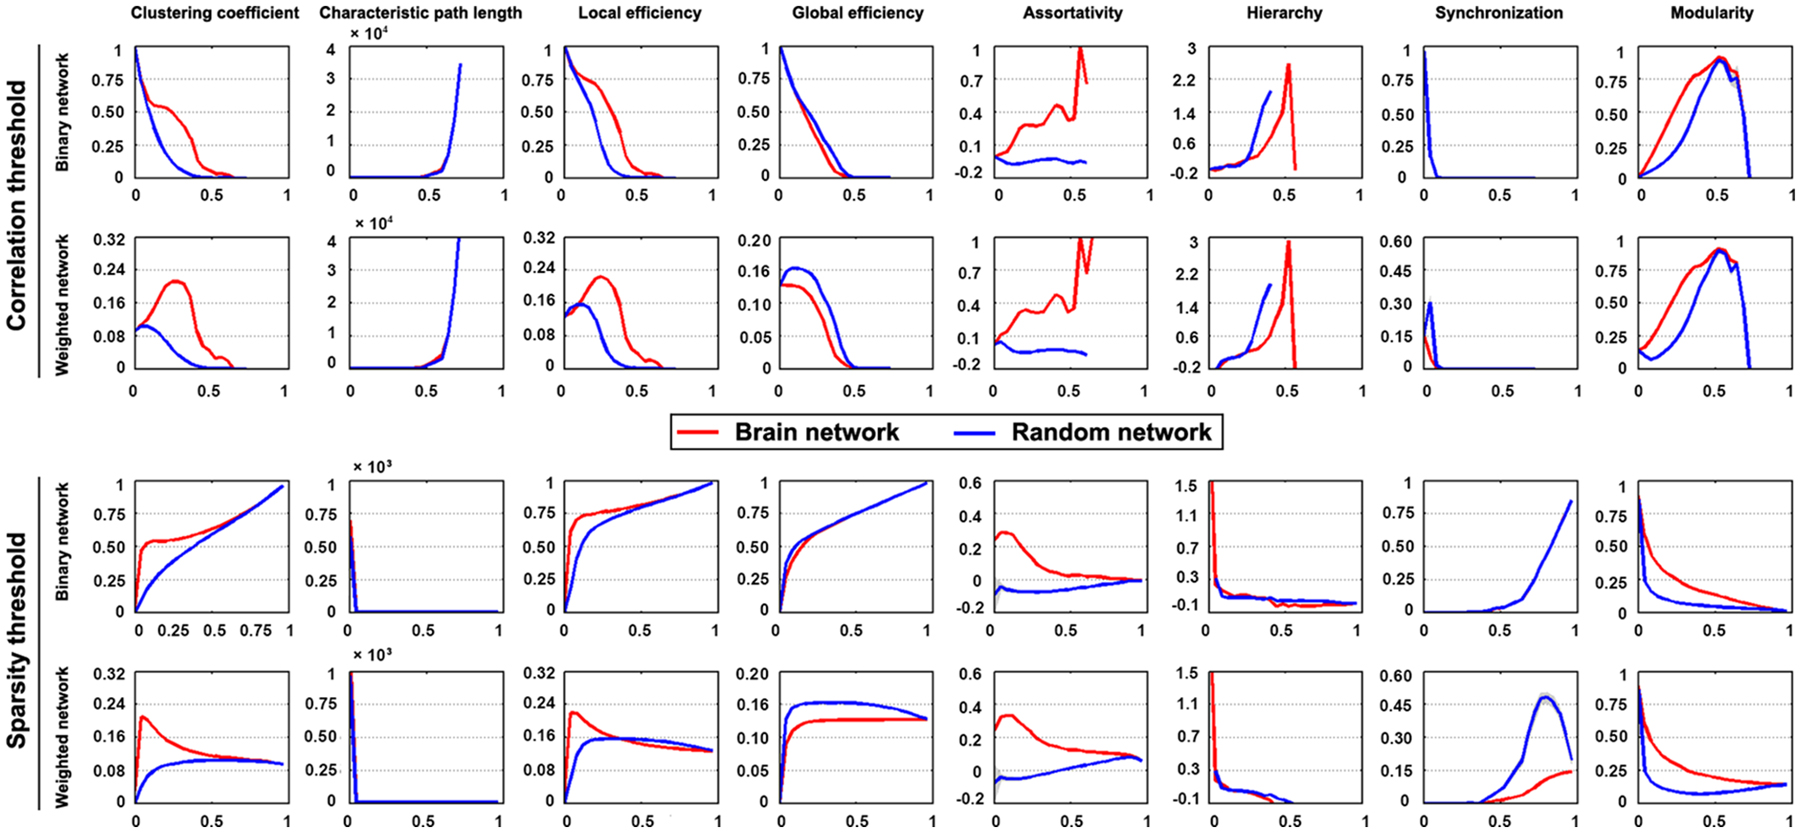
Figure 8. Global organization of group-based functional brain network. Significantly different organization was observed for R-fMRI brain networks from matched random networks, as characterized by a higher clustering coefficient, characteristic path length, local efficiency, assortativity and modularity but lower global efficiency. These findings were generally robust against the choices of network type and thresholding procedure.
Region-Based Brain Networks: Nodal Metrics
Figure 9A shows the spatial distributions of three nodal centralities (degree, efficiency and betweenness) for both binary and weighted brain networks under both correlation and sparsity thresholding procedures (the AUCs were used here). The spatial distributions of nodal degree and efficiency were highly similar regardless of network type and thresholding procedure. Specifically, the posterior parietal, medial and lateral prefrontal and lateral temporal cortices as well as several subcortical structures exhibited the highest values. However, nodal betweenness exhibited obviously different patterns in that only the posterior parietal cortex showed extremely high betweenness in the brain, a consistent finding across different network types and thresholding procedures. Further clustering analysis of the spatial similarity (i.e., correlation) matrix of nodal centrality distributions validated this observation that betweenness centrality was separated from nodal degree and efficiency, which were clustered together (Figure 9B).
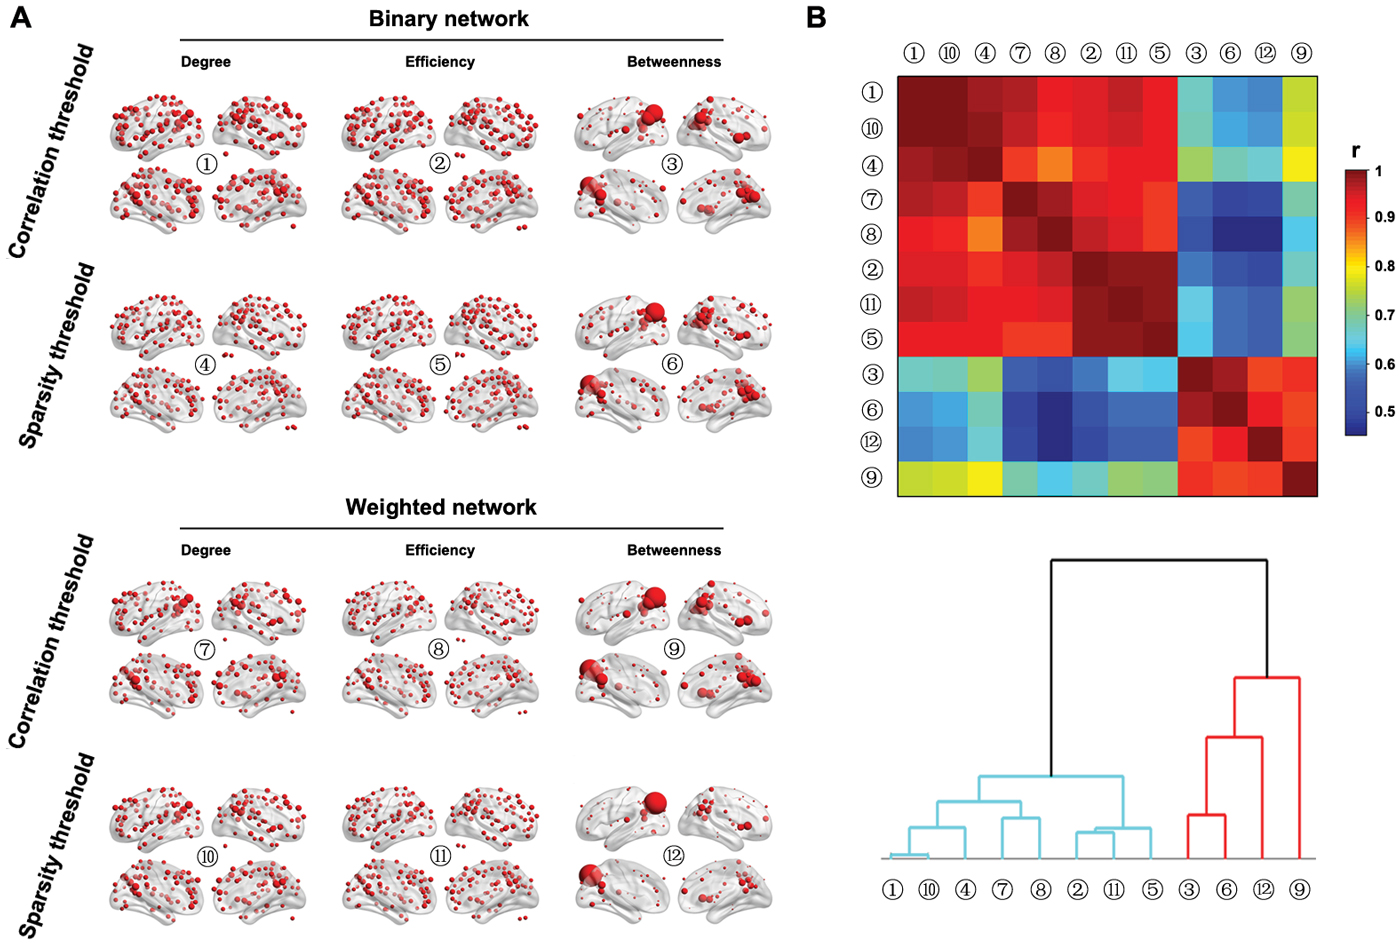
Figure 9. Nodal characteristics of group-based functional brain network. (A) Nodal degree, efficiency and betweenness were computed for both binary and weighted R-fMRI brain networks under both the correlation and sparsity thresholding procedures (only nodes with centralities larger than the mean of the whole brain network are shown). (B) Although significant correlations were observed in the spatial distributions among the three nodal centrality measures regardless of network type and threshold procedure, nodal betweenness revealed unique patterns compared to nodal degree and efficiency, which was demonstrated by the hierarchical clustering analysis.
Discussion
We developed a toolbox, GRETNA, to automatically analyze topological properties of brain networks that are not constrained by data modality and species. Specifically, GRETNA can perform R-fMRI data preprocessing, construct brain functional networks and calculate most commonly used global and nodal topological attributes with parallel computing ability. Moreover, GRETNA is flexible in dealing with several important methodological issues, such as network node definition, network types, thresholding procedure and treatment of negative correlations, all of which are great concerns in brain network studies. Finally, we utilized a publicly released R-fMRI dataset to demonstrate the capabilities of GRETNA.
Graph-based topological analysis of human brain networks is one of the most active domains in modern brain science. With the explosion of brain network studies, a growing number of toolboxes are being developed to facilitate the progress from brain network construction to topological characterization and result visualization (Table 1). For example, the PANDA toolbox has been developed to construct large-scale structural brain networks based on diffusion MRI data (Cui et al., 2013); the BCT toolbox allows topological analysis of networks based on Matlab codes (Rubinov and Sporns, 2010); and the BrainNet Viewer can visualize brain networks (Xia et al., 2013). For R-fMRI, toolboxes also exist with functionality in data preprocessing, network construction or descriptions, such as the REST (Song et al., 2011), CONN (Whitfield-Gabrieli and Nieto-Castanon, 2012) and GAT (Hosseini et al., 2012). Of note, the CONN toolbox can also calculate some topological attributes of networks. However, it is important to note that the majority of these toolboxes either can only address a single module of brain network construction (e.g., PANDA) or network metric calculation (e.g., BCT), or lack the ability to support parallel computing, therefore inconvenient for conducting a complete, efficient brain network study. In contrast, GRETNA combines parallel computing with a whole pipeline of R-fMRI data pre-processing, network construction and network topological characterization, which could significantly accelerate the research process during connectome studies. Specifically, compared with the recent developed GraphVar (Kruschwitz et al., 2015), GRETNA has distinct features in parallel computing, capability to preprocess R-fMRI data. In addition, connectome-based studies are of high complexity during their implementations as reflected by liberal choices in the analytical strategies, such as brain node and edge definition, thresholding procedure, network type and others. Due to the current lack of a gold standard in the determination of these options, GRETNA thus provides many options to address increasingly concerning issues in brain network analysis, such as the brain parcellation scheme, binary or weighted network type, thresholding procedure and treatment of negative correlations. This enables researchers to flexibly determine their analytical strategies and thus allow testing the robustness of their findings against different choices. Finally, the outputs from GRETNA are easily compatible with our previous connectome visualization tool, BrainNet Viewer (Xia et al., 2013).
Using a publicly released TRT dataset, we found that the most highly connected regions in the brain were predominantly in the posterior cingulate gyrus, precuneus, medial prefrontal cortex, dorsolateral prefrontal cortex and several subcortical structures. This finding is generally robust against the spatial resolutions (voxel- or region-level) and centrality measures (degree, efficiency or betweenness) used, particularly for the posterior parietal regions. These identified hubs are comparable with previous structural and functional brain network studies (Hagmann et al., 2008; Buckner et al., 2009; Gong et al., 2009; Tomasi and Volkow, 2010; Liang et al., 2013). Moreover, the hub topography was independent of several factors of network type, network connectivity member and thresholding procedure, indicating that hubs are a stable, intrinsic property of brain network architecture. Of note, despite high spatial correlations, nodal betweenness behaved differently from nodal degree and efficiency in capturing hub topography, presumably due to their differences in depending on only one graph property (i.e., first-order; degree and efficiency) or on more than one property or ratios of one property (i.e., second-order; betweenness; Wang et al., 2011).
At the global level, the human brain networks exhibit different organization from matched random networks as characterized by a higher clustering coefficient, characteristic path length, local efficiency, assortativity and modularity and lower global efficiency, which is indicative of the efficient small-world, assortative and modular organizations of functional brain networks. This is consistent with numerous previous brain networks studies (Park et al., 2008; Bullmore and Sporns, 2009; He and Evans, 2010; Meunier et al., 2010; Braun et al., 2012; Liang et al., 2012). Additionally, these findings were robust against the factors of network connectivity member and thresholding procedure, suggesting that these organizational principles are stable configurations embedded in the functional brain networks. Regarding hierarchy, positive values were observed, which indicates a hierarchical structure of functional brain networks. In hierarchical networks, highly connected hubs tend to link nodes that have a limited chance to interconnect with each other, which favors top-down routing among network nodes on the one hand and minimize wiring costs on the other hand (Ravasz and Barabási, 2003). The hierarchical structure observed here is consistent with previous brain network studies (Bassett et al., 2008; Braun et al., 2012; Liang et al., 2012). Additionally, we also noted positive synchronization for functional brain networks, a feature that has been relatively less studied in human brain networks than other measures. Notably, the behaviors of hierarchy and synchronization seemed to depend on the analytical strategies: that more obvious deviations of functional brain networks from matched random networks appeared when the weighted network analysis was used for synchronization and the correlation-based thresholding procedure was used for hierarchy. Taken together, GRETNA revealed largely comparable findings with previous brain network studies, therefore demonstrating its effectiveness.
It should be noted that while graph-based brain network studies are burgeoning, they are still in their infancy. There are many methodological challenges that remain elucidative, such as head motion correction (Muschelli et al., 2014; Patel et al., 2014), null model construction (Zalesky et al., 2012; Hosseini and Kesler, 2013), thresholding method selection (Toppi et al., 2012) and connectivity type determination (Salvador et al., 2007; Liang et al., 2012). Moreover, there are certain topological attributes that are not included in the current GRETNA, such as rich-club architecture (van den Heuvel and Sporns, 2011) and motif (Milo et al., 2002). Future versions of GRETNA will expand the functionality of these aspects. GRETNA can be further improved by integrating independent component analysis to allow exploring functional brain network topology among different brain components or subsystems (Yu et al., 2011, 2013) and sophisticated methods to characterize temporal evolution of functional brain networks (Liao et al., 2014; Zalesky et al., 2014) or both (Yu et al., 2015) In addition, the current GRETNA can only handle undirected networks (binary and weighted). Recent methodological advances have allowed researchers to infer large-scale directed brain networks with R-fMRI data (Liao et al., 2011; Yan and He, 2011). Hence, an important future extension of GRETNA is to add functionality to address directed networks. Finally, although the current GUI version of GRETNA includes several statistical functions, they are all parametric. Given the lack of statistical theory regarding the distribution of graph metrics for human brain networks, future versions could contain nonparametric inference of brain network metrics (Bullmore and Sporns, 2009), such as the permutation test (Wang et al., 2013), Functional Data Analysis (Bassett et al., 2012) or re-sampling approach (Gong et al., 2012).
In conclusion, we developed a user-friendly and easily navigable toolbox, GRETNA, to assist in conducting topological analysis of structural and functional brain networks. This toolbox has a highly compatible GUI with the widely used SPM toolbox. We hope that the toolbox contributes to facilitating and standardizing brain connectomics studies based on graph theory.
Author Contributions
Conceived and designed the study: JW, XW, AE and YH. Performed the study: JW, XW and YH. Analyzed the data: JW, XL and MX. Contributed reagents/materials/analysis tools: JW, XW, AE and YH. Wrote the paper: JW and YH.
Conflict of Interest Statement
The authors declare that the research was conducted in the absence of any commercial or financial relationships that could be construed as a potential conflict of interest.
Acknowledgments
We thank Prof Yanchao Bi for insightful comments and Miao Cao, Siqi Wang, Zhengjia Dai, Zhijiang Wang and Rui Hou for their important help in the software development and testing. We also thank the developers of the following softwares and toolboxes whose source codes were referenced during the development of GRETNA: Matlab (www.mathworks.com/products/matlab/), SPM (www.fil.ion.ucl.ac.uk/spm/), MatlabBGL (https://www.cs.purdue.edu/homes/dgleich/packages/matlab_bgl/), MRIcroN (http://www.mccauslandcenter.sc.edu/mricro/mricron/), Brain Connectivity Toolbox (https://sites.google.com/site/bctnet/) and REST (http://restfmri.net/forum/index.php). This work was supported by the National Science Fund for Distinguished Young Scholars (Grant No. 81225012), National Key Basic Research Program of China (973 project, Grant No. 2014CB846102), the Natural Science Foundation (Grant Nos. 81030028, 31221003, 30870667 and 81401479), Beijing Funding for Training Talents (No 2012D009012000003), Beijing Natural Science Foundation (Grant No. Z111107067311036 and 7102090), Zhejiang Provincial Natural Science Foundation of China (No LZ13C090001) and Open Research Fund of Zhejiang Key Laboratory for Research in Assessment of Cognitive Impairments (No. PD11001005002013).
Footnotes
- ^ http://www.nitrc.org/projects/gretna/
- ^ http://www.mccauslandcenter.sc.edu/mricro/mricron/
- ^ https://www.cs.purdue.edu/homes/dgleich/packages/matlab_bgl/
- ^ http://cocomac.g-node.org/
- ^ http://fcon_1000.projects.nitrc.org/indi/CoRR/html/bnu_1.html
References
Achard, S., and Bullmore, E. (2007). Efficiency and cost of economical brain functional networks. PLoS Comput. Biol. 3:e17. doi: 10.1371/journal.pcbi.0030017
Achard, S., Salvador, R., Whitcher, B., Suckling, J., and Bullmore, E. (2006). A resilient, low-frequency, small-world human brain functional network with highly connected. association cortical hubs. J Neurosci. 26, 63–72. doi: 10.1523/jneurosci.3874-05.2006
Ashburner, J., and Friston, K. J. (1999). Nonlinear spatial normalization using basis functions. Hum. Brain Mapp. 7, 254–266. doi: 10.1002/(sici)1097-0193(1999)7:4<254::aid-hbm4>3.3.co;2-7
Ashburner, J., and Friston, K. J. (2005). Unified segmentation. Neuroimage 26, 839–851. doi: 10.1016/j.neuroimage.2005.02.018
Barahona, M., and Pecora, L. M. (2002). Synchronization in small-world systems. Phys. Rev. Lett. 89:054101. doi: 10.1103/physrevlett.89.054101
Bassett, D. S., Bullmore, E., Verchinski, B. A., Mattay, V. S., Weinberger, D. R., and Meyer-Lindenberg, A. (2008). Hierarchical organization of human cortical networks in health and schizophrenia. J. Neurosci. 28, 9239–9248. doi: 10.1523/JNEUROSCI.1929-08.2008
Bassett, D. S., Nelson, B. G., Mueller, B. A., Camchong, J., and Lim, K. O. (2012). Altered resting state complexity in schizophrenia. Neuroimage 59, 2196–2207. doi: 10.1016/j.neuroimage.2011.10.002
Bellec, P., Lavoie-Courchesne, S., Dickinson, P., Lerch, J. P., Zijdenbos, A. P., and Evans, A. C. (2012). The pipeline system for Octave and Matlab (PSOM): a lightweight scripting framework and execution engine for scientific workflows. Front. Neuroinform. 6:7. doi: 10.3389/fninf.2012.00007
Biswal, B., Yetkin, F. Z., Haughton, V. M., and Hyde, J. S. (1995). Functional connectivity in the motor cortex of resting human brain using echo-planar MRI. Magn. Reson. Med. 34, 537–541. doi: 10.1002/mrm.1910340409
Biswal, B. B., Mennes, M., Zuo, X. N., Gohel, S., Kelly, C., Smith, S. M., et al. (2010). Toward discovery science of human brain function. Proc. Natl. Acad. Sci. U S A 107, 4734–4739. doi: 10.1073/pnas.0911855107
Boubela, R. N., Kalcher, K., Huf, W., Kronnerwetter, C., Filzmoser, P., and Moser, E. (2013). Beyond Noise: Using Temporal ICA to Extract Meaningful Information from High-Frequency fMRI Signal Fluctuations during Rest. Front. Hum. Neurosci. 7:168. doi: 10.3389/fnhum.2013.00168
Braun, U., Plichta, M. M., Esslinger, C., Sauer, C., Haddad, L., Grimm, O., et al. (2012). Test-retest reliability of resting-state connectivity network characteristics using fMRI and graph theoretical measures. Neuroimage 59, 1404–1412. doi: 10.1016/j.neuroimage.2011.08.044
Bressler, S. L., and Menon, V. (2010). Large-scale brain networks in cognition: emerging methods and principles. Trends Cogn. Sci. 14, 277–290. doi: 10.1016/j.tics.2010.04.004
Buckner, R. L., Sepulcre, J., Talukdar, T., Krienen, F. M., Liu, H., Hedden, T., et al. (2009). Cortical hubs revealed by intrinsic functional connectivity: mapping, assessment of stability and relation to Alzheimer’s disease. J. Neurosci. 29, 1860–1873. doi: 10.1523/JNEUROSCI.5062-08.2009
Bullmore, E., and Sporns, O. (2009). Complex brain networks: graph theoretical analysis of structural and functional systems. Nat. Rev. Neurosci. 10, 186–198. doi: 10.1038/nrn2575
Cao, Q., Shu, N., An, L., Wang, P., Sun, L., Xia, M. R., et al. (2013). Probabilistic diffusion tractography and graph-theory analysis reveal abnormal white-matter structural connectivity networks in drug-naïve boys with attention-deficit/hyperactivity disorder. J. Neurosci. 33, 10676–10687. doi: 10.1523/JNEUROSCI.4793-12.2013
Cao, H., Plichta, M. M., Schäfer, A., Haddad, L., Grimm, O., Schneider, M., et al. (2014). Test-retest reliability of fMRI-based graph theoretical properties during working memory, emotion processing and resting state. Neuroimage 84, 888–900. doi: 10.1016/j.neuroimage.2013.09.013
Cole, M. W., Pathak, S., and Schneider, W. (2010). Identifying the brain’s most globally connected regions. Neuroimage 49, 3132–3148. doi: 10.1016/j.neuroimage.2009.11.001
Craddock, R. C., James, G. A., Holtzheimer, P. E. III, Hu, X. P., and Mayberg, H. S. (2012). A whole brain fMRI atlas generated via spatially constrained spectral clustering. Hum. Brain Mapp. 33, 1914–1928. doi: 10.1002/hbm.21333
Cui, Z., Zhong, S., Xu, P., He, Y., and Gong, G. (2013). PANDA: a pipeline toolbox for analyzing brain diffusion images. Front. Hum. Neurosci. 7:42. doi: 10.3389/fnhum.2013.00042
Dai, Z., Yan, C., Li, K., Wang, Z., Wang, J., Cao, M., et al. (2014). Identifying and Mapping Connectivity Patterns of Brain Network Hubs in Alzheimer’s Disease. Cereb. Cortex doi: 10.1093/cercor/bhu246 [Epub ahead of print].
Dosenbach, N. U., Nardos, B., Cohen, A. L., Fair, D. A., Power, J. D., Church, J. A., et al. (2010). Prediction of individual brain maturity using fMRI. Science 329, 1358–1361. doi: 10.1126/science.1194144
Dosenbach, N. U., Visscher, K. M., Palmer, E. D., Miezin, F. M., Wenger, K. K., Kang, H. C., et al. (2006). A core system for the implementation of task sets. Neuron 50, 799–812. doi: 10.1016/j.neuron.2006.04.031
Fair, D. A., Cohen, A. L., Power, J. D., Dosenbach, N. U., Church, J. A., Miezin, F. M., et al. (2009). Functional brain networks develop from a “local to distributed” organization. PLoS Comput. Biol. 5:e1000381. doi: 10.1371/journal.pcbi.1000381
Filippi, M., van den Heuvel, M. P., Fornito, A., He, Y., Hulshoff Pol, H. E., Agosta, F., et al. (2013). Assessment of system dysfunction in the brain through MRI-based connectomics. Lancet Neurol. 12, 1189–1199. doi: 10.1016/s1474-4422(13)70144-3
Fox, M. D., and Raichle, M. E. (2007). Spontaneous fluctuations in brain activity observed with functional magnetic resonance imaging. Nat. Rev. Neurosci. 8, 700–711. doi: 10.1038/nrn2201
Fox, M. D., Snyder, A. Z., Vincent, J. L., Corbetta, M., Van Essen, D. C., and Raichle, M. E. (2005). The human brain is intrinsically organized into dynamic, anticorrelated functional networks. Proc. Natl. Acad. Sci. U S A 102, 9673–9678. doi: 10.1073/pnas.0504136102
Fox, M. D., Zhang, D., Snyder, A. Z., and Raichle, M. E. (2009). The global signal and observed anticorrelated resting state brain networks. J. Neurophysiol. 101, 3270–3283. doi: 10.1152/jn.90777.2008
Freeman, L. C. (1977). A set of measures of centrality based on betweenness.Sociometry 40, 35–41. doi: 10.2307/3033543
Gong, G., He, Y., Chen, Z. J., and Evans, A. C. (2012). Convergence and divergence of thickness correlations with diffusion connections across the human cerebral cortex. Neuroimage 59, 1239–1248. doi: 10.1016/j.neuroimage.2011.08.017
Gong, G., He, Y., Concha, L., Lebel, C., Gross, D. W., Evans, A. C., et al. (2009). Mapping anatomical connectivity patterns of human cerebral cortex using in vivo diffusion tensor imaging tractography. Cereb. Cortex 19, 524–536. doi: 10.1093/cercor/bhn102
Greicius, M. D., Krasnow, B., Reiss, A. L., and Menon, V. (2003). Functional connectivity in the resting brain: a network analysis of the default mode hypothesis. Proc. Natl. Acad. Sci. U S A 100, 253–258. doi: 10.1073/pnas.0135058100
Hagmann, P., Cammoun, L., Gigandet, X., Meuli, R., Honey, C. J., Wedeen, V. J., et al. (2008). Mapping the structural core of human cerebral cortex. PLoS Biol. 6:e159. doi: 10.1371/journal.pbio.0060159
Hagmann, P., Kurant, M., Gigandet, X., Thiran, P., Wedeen, V. J., Meuli, R., et al. (2007). Mapping human whole-brain structural networks with diffusion MRI. PLoS One 2:e597. doi: 10.1371/journal.pone.0000597
Han, Y., Wang, J., Zhao, Z., Min, B., Lu, J., Li, K., et al. (2011). Frequency-dependent changes in the amplitude of low-frequency fluctuations in amnestic mild cognitive impairment: a resting-state fMRI study. Neuroimage 55, 287–295. doi: 10.1016/j.neuroimage.2010.11.059
He, Y., Chen, Z., and Evans, A. (2008). Structural insights into aberrant topological patterns of large-scale cortical networks in Alzheimer’s disease. J. Neurosci. 28, 4756–4766. doi: 10.1523/JNEUROSCI.0141-08.2008
He, B., Dai, Y., Astolfi, L., Babiloni, F., Yuan, H., and Yang, L. (2011). eConnectome: A MATLAB toolbox for mapping and imaging of brain functional connectivity. J. Neurosci. Methods 195, 261–269. doi: 10.1016/j.jneumeth.2010.11.015
He, Y., and Evans, A. (2010). Graph theoretical modeling of brain connectivity. Curr. Opin. Neurol. 23, 341–350. doi: 10.1097/WCO.0b013e32833aa567
He, Y., Chen, Z. J., and Evans, A. C. (2007). Small-world anatomical networks in the human brain revealed by cortical thickness from MRI. Cereb. Cortex 17, 2407–2419. doi: 10.1093/cercor/bhl149
He, Y., Dagher, A., Chen, Z., Charil, A., Zijdenbos, A., Worsley, K., et al. (2009). Impaired small-world efficiency in structural cortical networks in multiple sclerosis associated with white matter lesion load. Brain 132, 3366–3379. doi: 10.1093/brain/awp089
Hosseini, S. M., and Kesler, S. R. (2013). Influence of choice of null network on small-world parameters of structural correlation networks. PLoS One 8:e67354. doi: 10.1371/journal.pone.0067354
Hosseini, S. M., Hoeft, F., and Kesler, S. R. (2012). GAT: a graph-theoretical analysis toolbox for analyzing between-group differences in large-scale structural and functional brain networks. PLoS One 7:e40709. doi: 10.1371/journal.pone.0040709
Iturria-Medina, Y., Canales-Rodríguez, E. J., Melie-García, L., Valdés-Hernández, P. A., Martínez-Montes, E., Alemán-Gómez, Y., et al. (2007). Characterizing brain anatomical connections using diffusion weighted MRI and graph theory. Neuroimage 36, 645–660. doi: 10.1016/j.neuroimage.2007.02.012
Kennedy, D. N., Lange, N., Makris, N., Bates, J., Meyer, J., and Caviness, V. S. Jr., et al. (1998). Gyri of the human neocortex: an MRI-based analysis of volume and variance. Cereb. Cortex 8, 372–384. doi: 10.1093/cercor/8.4.372
Kiviniemi, V., Jauhiainen, J., Tervonen, O., P ä äkkö, E., Oikarinen, J., Vainionp ä ä, V., et al. (2000). Slow vasomotor fluctuation in fMRI of anesthetized child brain. Magn. Reson. Med. 44, 373–378. doi: 10.1002/1522-2594(200009)44:3<373::aid-mrm5>3.3.co;2-g
Kruschwitz, J. D., List, D., Waller, L., Rubinov, M., and Walter, H. (2015). GraphVar: A user-friendly toolbox for comprehensive graph analyses of functional brain connectivity. J. Neurosci. Methods 245, 107–115. doi: 10.1016/j.jneumeth.2015.02.021
Latora, V., and Marchiori, M. (2001). Efficient behavior of small-world networks. Phys. Rev. Lett. 87:198701. doi: 10.1103/physrevlett.87.198701
Latora, V., and Marchiori, M. (2003). Economic small-world behavior in weighted networks. The European Physical Journal B-Condensed Matter and Complex Systems 32, 249–263. doi: 10.1140/epjb/e2003-00095-5
Leung, C., and Chau, H. F. (2007). Weighted assortative and disassortative networks model. Physica A 378, 591–602. doi: 10.1016/j.physa.2006.12.022
Liang, X., Connelly, A., and Calamante, F. (2014). Graph analysis of resting-state ASL perfusion MRI data: nonlinear correlations among CBF and network metrics. Neuroimage 87, 265–275. doi: 10.1016/j.neuroimage.2013.11.013
Liang, X., Wang, J., Yan, C., Shu, N., Xu, K., Gong, G., et al. (2012). Effects of different correlation metrics and preprocessing factors on small-world brain functional networks: a resting-state functional MRI study. PLoS One 7:e32766. doi: 10.1371/journal.pone.0032766
Liang, X., Zou, Q., He, Y., and Yang, Y. (2013). Coupling of functional connectivity and regional cerebral blood flow reveals a physiological basis for network hubs of the human brain. Proc. Natl. Acad. Sci. U S A 110, 1929–1934. doi: 10.1073/pnas.1214900110
Liao, W., Ding, J., Marinazzo, D., Xu, Q., Wang, Z., Yuan, C., et al. (2011). Small-world directed networks in the human brain: multivariate Granger causality analysis of resting-state fMRI. Neuroimage 54, 2683–2694. doi: 10.1016/j.neuroimage.2010.11.007
Liao, W., Wu, G. R., Xu, Q., Ji, G. J., Zhang, Z., Zang, Y. F., et al. (2014). DynamicBC: a MATLAB toolbox for dynamic brain connectome analysis. Brain Connect. 4, 780–790. doi: 10.1089/brain.2014.0253
Liao, X. H., Xia, M. R., Xu, T., Dai, Z. J., Cao, X. Y., Niu, H. J., et al. (2013). Functional brain hubs and their test-retest reliability: a multiband resting-state functional MRI study. Neuroimage 83, 969–982. doi: 10.1016/j.neuroimage.2013.07.058
Liu, X., Wang, S., Zhang, X., Wang, Z., Tian, X., and He, Y. (2014). Abnormal amplitude of low-frequency fluctuations of intrinsic brain activity in Alzheimer’s disease. J. Alzheimers Dis. 40, 387–397. doi: 10.3233/JAD-131322
Lowe, M. J., and Russell, D. P. (1999). Treatment of baseline drifts in fMRI time series analysis. J. Comput. Assist. Tomogr. 23, 463–473. doi: 10.1097/00004728-199905000-00025
Lowe, M. J., Mock, B. J., and Sorenson, J. A. (1998). Functional connectivity in single and multislice echoplanar imaging using resting-state fluctuations. Neuroimage 7, 119–132. doi: 10.1006/nimg.1997.0315
Makris, N., Meyer, J. W., Bates, J. F., Yeterian, E. H., Kennedy, D. N., and Caviness, V. S. (1999). MRI-Based topographic parcellation of human cerebral white matter and nuclei II. Rationale and applications with systematics of cerebral connectivity. Neuroimage 9, 18–45. doi: 10.1006/nimg.1998.0384
Maslov, S., and Sneppen, K. (2002). Specificity and stability in topology of protein networks. Science 296, 910–913. doi: 10.1126/science.1065103
McIntosh, A. R. (1999). Mapping cognition to the brain through neural interactions. Memory 7, 523–548. doi: 10.1080/096582199387733
Mesulam, M. M. (1990). Large-scale neurocognitive networks and distributed processing for attention, language and memory. Ann. Neurol. 28, 597–613. doi: 10.1002/ana.410280502
Meunier, D., Lambiotte, R., and Bullmore, E. T. (2010). Modular and hierarchically modular organization of brain networks. Front. Neurosci. 4:200. doi: 10.3389/fnins.2010.00200
Milo, R., Shen-Orr, S., Itzkovitz, S., Kashtan, N., Chklovskii, D., and Alon, U. (2002). Network motifs: simple building blocks of complex networks. Science 298, 824–827. doi: 10.1126/science.298.5594.824
Motter, A. E., Zhou, C., and Kurths, J. (2005). Enhancing complex-network synchronization. Europhys. Lett. (EPL) 69, 334–340. doi: 10.1209/epl/i2004-10365-4
Murphy, K., Birn, R. M., Handwerker, D. A., Jones, T. B., and Bandettini, P. A. (2009). The impact of global signal regression on resting state correlations: are anti-correlated networks introduced? Neuroimage 44, 893–905. doi: 10.1016/j.neuroimage.2008.09.036
Muschelli, J., Nebel, M. B., Caffo, B. S., Barber, A. D., Pekar, J. J., and Mostofsky, S. H. (2014). Reduction of motion-related artifacts in resting state fMRI using aCompCor. Neuroimage 96, 22–35. doi: 10.1016/j.neuroimage.2014.03.028
Newman, M. E. (2002). Assortative mixing in networks. Phys. Rev. Lett. 89:208701. doi: 10.1103/physrevlett.89.208701
Newman, M. E. (2003). The structure and function of complex networks. SIAM Rev. 45, 167–256. doi: 10.1137/S003614450342480
Newman, M. E. (2006). Finding community structure in networks using the eigenvectors of matrices. Phys. Rev. E Stat. Nonlin. Soft Matter Phys. 74:036104. doi: 10.1103/physreve.74.036104
Niu, H., Wang, J., Zhao, T., Shu, N., and He, Y. (2012). Revealing topological organization of human brain functional networks with resting-state functional near infrared spectroscopy. PLoS One 7:e45771. doi: 10.1371/journal.pone.0045771
Onnela, J. P., Saramäki, J., Kertész, J., and Kaski, K. (2005). Intensity and coherence of motifs in weighted complex networks. Phys. Rev. E Stat. Nonlin. Soft Matter Phys. 71:065103. doi: 10.1103/physreve.71.065103
Park, C.-H., Kim, S. Y., Kim, Y.-H., and Kim, K. (2008). Comparison of the small-world topology between anatomical and functional connectivity in the human brain. Physica A 387, 5958–5962. doi: 10.1016/j.physa.2008.06.048
Park, H. J., and Friston, K. (2013). Structural and functional brain networks: from connections to cognition. Science 342:1238411. doi: 10.1126/science.1238411
Patel, A. X., Kundu, P., Rubinov, M., Jones, P. S., Vértes, P. E., Ersche, K. D., et al. (2014). A wavelet method for modeling and despiking motion artifacts from resting-state fMRI time series. Neuroimage 95, 287–304. doi: 10.1016/j.neuroimage.2014.03.012
Power, J. D., Cohen, A. L., Nelson, S. M., Wig, G. S., Barnes, K. A., Church, J. A., et al. (2011). Functional network organization of the human brain. Neuron 72, 665–678. doi: 10.1016/j.neuron.2011.09.006
Ravasz, E., and Barabási, A. L. (2003). Hierarchical organization in complex networks. Phys. Rev. E Stat. Nonlin. Soft Matter Phys. 67:026112. doi: 10.1103/physreve.67.026112
Rubinov, M., and Bullmore, E. (2013). Fledgling pathoconnectomics of psychiatric disorders. Trends Cogn. Sci. 17, 641–647. doi: 10.1016/j.tics.2013.10.007
Rubinov, M., and Sporns, O. (2010). Complex network measures of brain connectivity: uses and interpretations. Neuroimage 52, 1059–1069. doi: 10.1016/j.neuroimage.2009.10.003
Salvador, R., Martínez, A., Pomarol-Clotet, E., Gomar, J., Vila, F., Sarró, S., et al. (2008). A simple view of the brain through a frequency-specific functional connectivity measure. Neuroimage 39, 279–289. doi: 10.1016/j.neuroimage.2007.08.018
Salvador, R., Martínez, A., Pomarol-Clotet, E., Sarró, S., Suckling, J., and Bullmore, E. (2007). Frequency based mutual information measures between clusters of brain regions in functional magnetic resonance imaging. Neuroimage 35, 83–88. doi: 10.1016/j.neuroimage.2006.12.001
Salvador, R., Suckling, J., Coleman, M. R., Pickard, J. D., Menon, D., and Bullmore, E. (2005). Neurophysiological architecture of functional magnetic resonance images of human brain. Cereb. Cortex 15, 1332–1342. doi: 10.1093/cercor/bhi016
Schölvinck, M. L., Maier, A., Ye, F. Q., Duyn, J. H., and Leopold, D. A. (2010). Neural basis of global resting-state fMRI activity. Proc. Natl. Acad. Sci. U S A 107, 10238–10243. doi: 10.1073/pnas.0913110107
Schwarz, A. J., and McGonigle, J. (2011). Negative edges and soft thresholding in complex network analysis of resting state functional connectivity data. Neuroimage 55, 1132–1146. doi: 10.1016/j.neuroimage.2010.12.047
Sladky, R., Friston, K. J., Tröstl, J., Cunnington, R., Moser, E., and Windischberger, C. (2011). Slice-timing effects and their correction in functional MRI. Neuroimage 58, 588–594. doi: 10.1016/j.neuroimage.2011.06.078
Smith, A. M., Lewis, B. K., Ruttimann, U. E., Ye, F. Q., Sinnwell, T. M., Yang, Y., et al. (1999). Investigation of low frequency drift in fMRI signal. Neuroimage 9, 526–533. doi: 10.1006/nimg.1999.0435
Song, X. W., Dong, Z. Y., Long, X. Y., Li, S. F., Zuo, X. N., Zhu, C. Z., et al. (2011). REST: a toolkit for resting-state functional magnetic resonance imaging data processing. PLoS One 6:e25031. doi: 10.1371/journal.pone.0025031
Sporns, O., and Zwi, J. D. (2004). The small world of the cerebral cortex. Neuroinformatics 2, 145–162. doi: 10.1385/ni:2:2:145
Sporns, O., Tononi, G., and Kötter, R. (2005). The human connectome: A structural description of the human brain. PLoS Comput. Biol. 1:e42. doi: 10.1371/journal.pcbi.0010042
Stam, C. J. (2014). Modern network science of neurological disorders. Nat. Rev. Neurosci. 15, 683–695. doi: 10.1038/nrn3801
Stam, C. J. (2004). Functional connectivity patterns of human magnetoencephalographic recordings: a ’small-world’ network? Neurosci. Lett. 355, 25–28. doi: 10.1016/j.neulet.2003.10.063
Stam, C. J., Jones, B. F., Nolte, G., Breakspear, M., and Scheltens, P. (2007). Small-world networks and functional connectivity in Alzheimer’s disease. Cereb. Cortex 17, 92–99. doi: 10.1093/cercor/bhj127
Tijms, B. M., Seriès, P., Willshaw, D. J., and Lawrie, S. M. (2012). Similarity-based extraction of individual networks from gray matter MRI scans. Cereb. Cortex 22, 1530–1541. doi: 10.1093/cercor/bhr221
Tomasi, D., and Volkow, N. D. (2010). Functional connectivity density mapping. Proc. Natl. Acad. Sci. U S A 107, 9885–9890. doi: 10.1073/pnas.1001414107
Tomasi, D., Wang, G. J., and Volkow, N. D. (2013). Energetic cost of brain functional connectivity. Proc. Natl. Acad. Sci. U S A 110, 13642–13647. doi: 10.1073/pnas.1303346110
Toppi, J., De Vico Fallani, F., Vecchiato, G., Maglione, A. G., Cincotti, F., Mattia, D., et al. (2012). How the statistical validation of functional connectivity patterns can prevent erroneous definition of small-world properties of a brain connectivity network. Comput. Math. Methods Med. 2012:130985. doi: 10.1155/2012/130985
Tzourio-Mazoyer, N., Landeau, B., Papathanassiou, D., Crivello, F., Etard, O., Delcroix, N., et al. (2002). Automated anatomical labeling of activations in SPM using a macroscopic anatomical parcellation of the MNI MRI single-subject brain. Neuroimage 15, 273–289. doi: 10.1006/nimg.2001.0978
van den Heuvel, M. P., and Sporns, O. (2011). Rich-club organization of the human connectome. J. Neurosci. 31, 15775–15786. doi: 10.1523/JNEUROSCI.3539-11.2011
Van Dijk, K. R., Hedden, T., Venkataraman, A., Evans, K. C., Lazar, S. W., and Buckner, R. L. (2010). Intrinsic functional connectivity as a tool for human connectomics: theory, properties and optimization. J. Neurophysiol. 103, 297–321. doi: 10.1152/jn.00783.2009
van Wijk, B. C., Stam, C. J., and Daffertshofer, A. (2010). Comparing brain networks of different size and connectivity density using graph theory. PLoS One 5:e13701. doi: 10.1371/journal.pone.0013701
Wang, J., Wang, X., He, Y., Yu, X., Wang, H., and He, Y. (2015). Apolipoprotein E ε4 modulates functional brain connectome in Alzheimer’s disease. Hum. Brain Mapp. 36, 1828–1846. doi: 10.1002/hbm.22740
Wang, J., Wang, L., Zang, Y., Yang, H., Tang, H., Gong, Q., et al. (2009). Parcellation-dependent small-world brain functional networks: a resting-state fMRI study. Hum. Brain Mapp. 30, 1511–1523. doi: 10.1002/hbm.20623
Wang, J., Zuo, X., and He, Y. (2010). Graph-based network analysis of resting-state functional MRI. Front. Syst. Neurosci. 4:16. doi: 10.3389/fnsys.2010.00016
Wang, J., Zuo, X., Dai, Z., Xia, M., Zhao, Z., Zhao, X., et al. (2013). Disrupted functional brain connectome in individuals at risk for Alzheimer’s disease. Biol. Psychiatry 73, 472–481. doi: 10.1016/j.biopsych.2012.03.026
Wang, J. H., Zuo, X. N., Gohel, S., Milham, M. P., Biswal, B. B., and He, Y. (2011). Graph theoretical analysis of functional brain networks: test-retest evaluation on short- and long-term resting-state functional MRI data. PLoS One 6:e21976. doi: 10.1371/journal.pone.0021976
Watts, D. J., and Strogatz, S. H. (1998). Collective dynamics of ’small-worldp networks. Nature 393, 440–442. doi: 10.1038/30918
Weissenbacher, A., Kasess, C., Gerstl, F., Lanzenberger, R., Moser, E., and Windischberger, C. (2009). Correlations and anticorrelations in resting-state functional connectivity MRI: a quantitative comparison of preprocessing strategies. Neuroimage 47, 1408–1416. doi: 10.1016/j.neuroimage.2009.05.005
Whitfield-Gabrieli, S., and Nieto-Castanon, A. (2012). Conn: a functional connectivity toolbox for correlated and anticorrelated brain networks. Brain Connect. 2, 125–141. doi: 10.1089/brain.2012.0073
Xia, M., and He, Y. (2011). Magnetic resonance imaging and graph theoretical analysis of complex brain networks in neuropsychiatric disorders. Brain Connect. 1, 349–365. doi: 10.1089/brain.2011.0062
Xia, M., Wang, J., and He, Y. (2013). BrainNet Viewer: a network visualization tool for human brain connectomics. PLoS One 8:e68910. doi: 10.1371/journal.pone.0068910
Yan, C., and He, Y. (2011). Driving and driven architectures of directed small-world human brain functional networks. PLoS One 6:e23460. doi: 10.1371/journal.pone.0023460
Yu, Q., Erhardt, E. B., Sui, J., Du, Y., He, H., Hjelm, D., et al. (2015). Assessing dynamic brain graphs of time-varying connectivity in fMRI data: application to healthy controls and patients with schizophrenia. Neuroimage 107, 345–355. doi: 10.1016/j.neuroimage.2014.12.020
Yu, Q., Sui, J., Liu, J., Plis, S. M., Kiehl, K. A., Pearlson, G., et al. (2013). Disrupted correlation between low frequency power and connectivity strength of resting state brain networks in schizophrenia. Schizophr. Res. 143, 165–171. doi: 10.1016/j.schres.2012.11.001
Yu, Q., Sui, J., Rachakonda, S., He, H., Gruner, W., Pearlson, G., et al. (2011). Altered topological properties of functional network connectivity in schizophrenia during resting state: a small-world brain network study. PLoS One 6, e25423. doi: 10.1371/journal.pone.0025423
Zalesky, A., Fornito, A., and Bullmore, E. T. (2010a). Network-based statistic: identifying differences in brain networks. Neuroimage 53, 1197–1207. doi: 10.1016/j.neuroimage.2010.06.041
Zalesky, A., Fornito, A., Harding, I. H., Cocchi, L., Yücel, M., Pantelis, C., et al. (2010b). Whole-brain anatomical networks: does the choice of nodes matter? Neuroimage 50, 970–983. doi: 10.1016/j.neuroimage.2009.12.027
Zalesky, A., Fornito, A., and Bullmore, E. (2012). On the use of correlation as a measure of network connectivity. Neuroimage 60, 2096–2106. doi: 10.1016/j.neuroimage.2012.02.001
Zalesky, A., Fornito, A., Cocchi, L., Gollo, L. L., and Breakspear, M. (2014). Time-resolved resting-state brain networks. Proc. Natl. Acad. Sci. U S A 111, 10341–10346. doi: 10.1073/pnas.1400181111
Zhang, J., Wang, J., Wu, Q., Kuang, W., Huang, X., He, Y., et al. (2011). Disrupted brain connectivity networks in drug-naive, first-episode major depressive disorder. Biol. Psychiatry 70, 334–342. doi: 10.1016/j.biopsych.2011.05.018
Zhong, S., He, Y., and Gong, G. (2015). Convergence and divergence across construction methods for human brain white-matter networks: an assessment based on individual differences. Hum. Brain Mapp. 36, 1995–2013. doi: 10.1002/hbm.22751
Keywords: network, graph theory, connectome, resting fMRI, small-world, hub
Citation: Wang J, Wang X, Xia M, Liao X, Evans A and He Y (2015) GRETNA: a graph theoretical network analysis toolbox for imaging connectomics. Front. Hum. Neurosci. 9:386. doi: 10.3389/fnhum.2015.00386
Received: 13 April 2015; Accepted: 16 June 2015;
Published: 30 June 2015.
Edited by:
Wei Gao, University of North Carolina at Chapel Hill, USAReviewed by:
Qingbao Yu, The Mind Research Network, USAFumihiko Taya, National University of Singapore, Singapore
Copyright © 2015 Wang, Wang, Xia, Liao, Evans and He. This is an open-access article distributed under the terms of the Creative Commons Attribution License (CC BY). The use, distribution and reproduction in other forums is permitted, provided the original author(s) or licensor are credited and that the original publication in this journal is cited, in accordance with accepted academic practice. No use, distribution or reproduction is permitted which does not comply with these terms.
*Correspondence: Alan Evans, McConnell Brain Imaging Center, Montreal Neurological Institute, McGill University, Montreal, QC H3A2B4, Canada, alan@bic.mni.mcgill.ca;
Yong He, State Key Laboratory of Cognitive Neuroscience and Learning and IDG/McGovern Institute for Brain Research, Beijing Normal University, Beijing 100875, China, yong.he@bnu.edu.cn
† These authors have contributed equally to this work.