Bicycling and Walking are Associated with Different Cortical Oscillatory Dynamics
 Lena Storzer1*
  Markus Butz1
  Jan Hirschmann1
  Omid Abbasi1,2
  Maciej Gratkowski3
  Dietmar Saupe3
  Alfons Schnitzler1
  Sarang S. Dalal4
- 1Institute of Clinical Neuroscience and Medical Psychology, Medical Faculty, Heinrich Heine University Düsseldorf, Düsseldorf, Germany
- 2Department of Medical Engineering, Ruhr-University Bochum, Bochum, Germany
- 3Department of Computer and Information Science, University of Konstanz, Konstanz, Germany
- 4Zukunftskolleg and Department of Psychology, University of Konstanz, Konstanz, Germany
Although bicycling and walking involve similar complex coordinated movements, surprisingly Parkinson’s patients with freezing of gait typically remain able to bicycle despite severe difficulties in walking. This observation suggests functional differences in the motor networks subserving bicycling and walking. However, a direct comparison of brain activity related to bicycling and walking has never been performed, neither in healthy participants nor in patients. Such a comparison could potentially help elucidating the cortical involvement in motor control and the mechanisms through which bicycling ability may be preserved in patients with freezing of gait. The aim of this study was to contrast the cortical oscillatory dynamics involved in bicycling and walking in healthy participants. To this end, EEG and EMG data of 14 healthy participants were analyzed, who cycled on a stationary bicycle at a slow cadence of 40 revolutions per minute (rpm) and walked at 40 strides per minute (spm), respectively. Relative to walking, bicycling was associated with a stronger power decrease in the high beta band (23–35 Hz) during movement initiation and execution, followed by a stronger beta power increase after movement termination. Walking, on the other hand, was characterized by a stronger and persisting alpha power (8–12 Hz) decrease. Both bicycling and walking exhibited movement cycle-dependent power modulation in the 24–40 Hz range that was correlated with EMG activity. This modulation was significantly stronger in walking. The present findings reveal differential cortical oscillatory dynamics in motor control for two types of complex coordinated motor behavior, i.e., bicycling and walking. Bicycling was associated with a stronger sustained cortical activation as indicated by the stronger high beta power decrease during movement execution and less cortical motor control within the movement cycle. We speculate this to be due to the more continuous nature of bicycling demanding less phase-dependent sensory processing and motor planning, as opposed to walking.
Introduction
Walking abilities are severely impaired in patients suffering from freezing of gait, a common phenomenon in advanced Parkinson’s disease (for a review, see Nutt et al., 2011). Surprisingly, bicycling abilities are apparently preserved in the very same patients (Snijders et al., 2011b, 2012). Moreover, bicycling has been put forward as a therapy for Parkinson’s disease, improving motor control, cognitive performance, tremor, and bradykinesia (Ridgel et al., 2009, 2011, 2012). Consequently, contrasting cortical activation during bicycling and walking starting in healthy participants may offer valuable insights into extent and aspects of cortical involvement in motor control of these two distinct types of movement. In addition, it may help to understand why Parkinsonian patients with severe freezing of gait retain the ability to bicycle and it may lead to improved therapeutic applications of bicycling in this patient population.
Vertical ergometer bicycling and walking are characterized by the alternating extension and flexion of the lower limbs that are suggested to be controlled by a shared subset of co-exited muscles (Raasch and Zajac, 1999). Moreover, both are complex movements that recruit a network of motor associated brain regions. Using near-infrared spectroscopy (NIRS; Miyai et al., 2001) and single-photon emission computed tomography (SPECT; Fukuyama et al., 1997), walking was associated with activity in sensorimotor regions, the supplementary motor area (SMA), and cerebellum. Activity within these movement-related brain areas was also reported during recumbent bicycling using functional magnetic resonance imaging (fMRI; Mehta et al., 2009) and positron emission tomography (PET; Christensen et al., 2000). Interestingly, imagination of bicycling compared to rest led to activation in the SMA, while active bicycling compared to passive bicycling was accompanied by a stronger recruitment of the primary motor cortex (Christensen et al., 2000). Furthermore, brain activity was shown to be influenced by exercise intensity and preference (Christensen et al., 2000; Brümmer et al., 2011a,b). This illustrates that the specific functional involvement of movement-related brain areas varies substantially with the task. In this sense, we can expect bicycling and walking to induce different cortical activities as both movements differ, e.g., in the requirement of postural control and coordination. In line with this, a behavioral study by Yogev-Seligmann et al. (2013) indicated that walking depends more on cognitive resources than bicycling. This was indicated by higher interference caused by the additional demand of a secondary task. It remains an open question, however, how exactly walking and bicycling differ on the electrophysiological level.
Previous work in this field using EEG has mainly focused on investigating neural oscillations underlying walking movements and resulted in two main findings.
First, alpha (8–12 Hz) and beta band (13–30 Hz) activity over the sensorimotor cortex are decreased during active motor execution compared to rest or passive movement (Wieser et al., 2010; Presacco et al., 2011; Severens et al., 2012; Wagner et al., 2012, 2014; Seeber et al., 2014). This tallies with previous findings of power decrease during motor execution, preparation and even during passive and imagined movements (Stančák and Pfurtscheller, 1996; Alegre et al., 2002; Müller-Putz et al., 2007). The decrease is followed by a beta power increase (rebound) after movement termination (Pfurtscheller et al., 1996; Parkes et al., 2006; Solis-Escalante et al., 2012). In this sense, beta power is modulated dependent on a change of the movement state, i.e., it decreases during the switch from rest to movement and rebounds after the reverse switch from movement to rest.
Second, power modulations are locked to the phase of the gait cycle in the 24–40 Hz and 70–90 Hz range, respectively (Wagner et al., 2012, 2014; Seeber et al., 2014, 2015). Gwin et al. (2011) were the first to show that power is modulated in a cyclic fashion during the gait cycle. Notably, Petersen et al. (2012) found activity at the Cz electrode and the TA muscle to be coherent in the 24–40 Hz range before the heel strike during walking. Although sustained beta decrease and transient power modulation in the 24–40 Hz range overlap in the frequency domain, they are thought to be two separate phenomena (Seeber et al., 2014). While sustained beta decrease is linked to a sustained active state of the sensorimotor cortex (Seeber et al., 2014; for a review, see Neuper and Pfurtscheller, 2001), phase-dependent power modulation in the 24–40 Hz range is associated with phasic gait cycle-dependent sensorimotor processing and motor planning (Wagner et al., 2012, 2014; Seeber et al., 2014).
Notably, cortical involvement in motor control has also been studied with EEG during recumbent bicycling on a stationary bicycle (Jain et al., 2013). This approach revealed similar findings to the results obtained in the context of walking studies. Active lower leg movements as opposed to passive movements led to a stronger power decrease in the beta band over the sensorimotor cortex. Additionally, bicycling was associated with alternating positive and negative cortical potentials, occurring twice in the pedal cycle and correlated with EMG activity of the leg muscles.
In the present study, we contrasted cortical activity underlying bicycling and walking to address the extent and aspects of cortical involvement in motor control. Furthermore, we aimed to clarify which aspects differ across these two distinct types of movement. We investigated movement state-dependent EEG power changes, i.e., the switch from rest to movement and back again. Moreover, we studied movement phase-dependent EEG power changes, i.e., power modulations that are locked to specific phases within the movement cycle.
Materials and Methods
Participants
Fifteen healthy right-handed volunteers participated in this study. One participant was excluded from the analyses because of severe contamination of the EEG by muscle artifacts. Thus, data are presented from the remaining 14 participants (24.9 ± 3.0 years, six females). The study was approved by the local ethics committee of the Medical Faculty of the Heinrich Heine University Düsseldorf (study number: 4294) and was performed in accordance with the Declaration of Helsinki. All participants gave their prior written informed consent.
Experimental Design and Procedure
Participants started either in the bicycling or in the walking condition (Figure 1A). The order of conditions was pseudorandomized and counterbalanced across subjects. Each condition started with a baseline rest period of 2 min, i.e., sitting on the bicycle or standing, respectively. In order to investigate movement initiation and termination, subjects performed an alternating sequence containing 10 s of movement, i.e., bicycling or walking, and 10 s of rest. The sequence was repeated 50 times. Subjects started with one additional rest phase before continuing with the alternating sequence to capture each of the 50 initiations and terminations. Start and end of the movement phase was indicated by an acoustic signal (beep of 500 ms duration with a frequency of 1000 Hz for start and 1500 Hz for end). Participants were allowed to start with their preferred leg but asked to keep this constant across trials and conditions. Finally, participants engaged in continuous movement for 2 min. The definition of number of repetitions and recording times was based on pilot recordings. Thus, we could ensure to acquire a sufficient data quantity for power analyses. Participants were instructed to bicycle or to walk at a comfortable slow cadence of 40 revolutions per minute (rpm) or strides per minute (spm), respectively. Prior to the experiment, they were given a short trial period to get accustomed to the intended cadence.
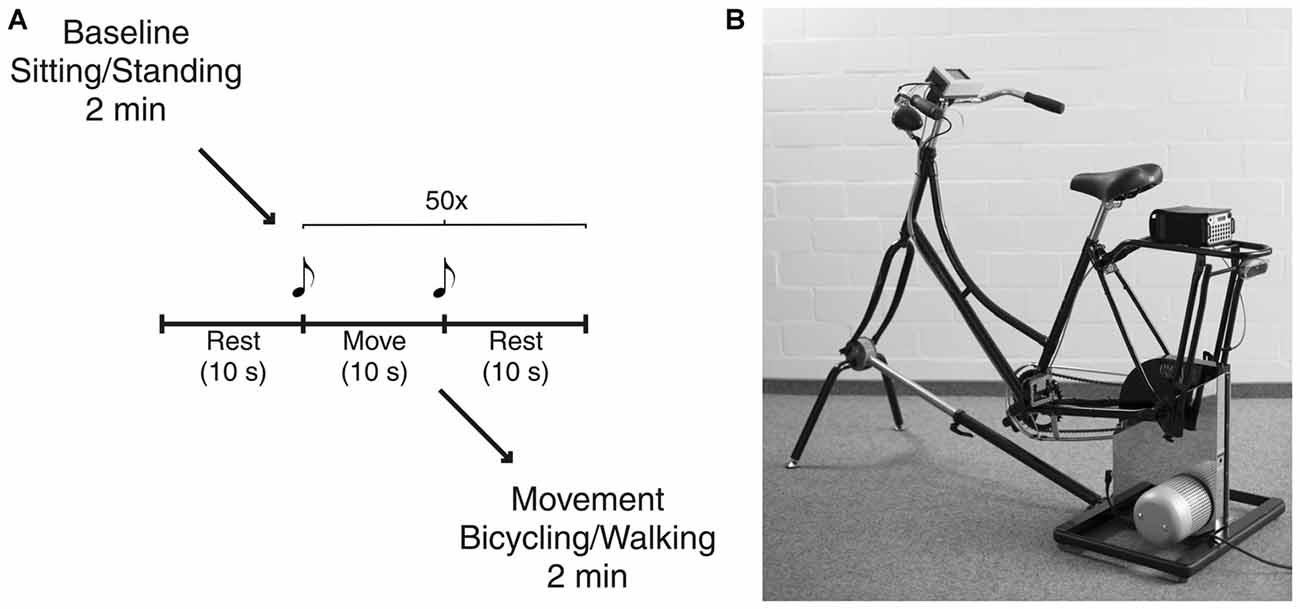
Figure 1. Experimental setup. (A) Schematic illustration of the experimental paradigm. Each condition started with a baseline rest period of 2 min, i.e., sitting on the bicycle or standing, respectively. After further 10 s of rest participants performed an alternating sequence containing 10 s of movement, i.e., bicycling or walking, and 10 s of rest. This was repeated 50 times. Start and end of the movement phase were indicated by an acoustic signal. Finally, participants engaged in continuous movement for 2 min. (B) The bicycle simulator compromises a Dutch-style bicycle frame mounted on an ergometer. Custom-made software electronics and optical sensors tracked pedal position that was recorded simultaneously with all electrophysiological signals.
Bicycling took place on a basic version of the stationary bicycle simulator originally developed to analyze bicycling performance parameters (Dahmen et al., 2011; Figure 1B). This simulator combines a common bicycle frame with a commercial Cyclus 2 ergometer (RBM Elektronik-Automation GmbH, Leipzig, Germany) based on an eddy current brake. The brake force of the ergometer, controlled by custom-made PC-based software, was kept constant over participants. Bicycling with 40 rpm at a pedal force of 30 N resulted in a power of 23 W. Furthermore, custom Arduino-based electronics and optical sensors tracked pedal position that was recorded simultaneously with all electrophysiological signals. The bicycle simulator was the same for all participants with the saddle height adapted to the individual body height, i.e., the fully stretched leg was matching the distance from the saddle to the lowest pedal position. The walking condition was conducted in a 50 m long hallway with no obstacles or additional cues. Turnings made during continuous walking for 2 min were excluded from the analysis.
Data Acquisition
Data were recorded with the maximum sampling rate of 2048 Hz using a portable EEG amplifier (Porti amplifier, TMSi, Enschede, Netherlands) and controlled by a combination of the open source software packages OpenBCI and Svarog (Durka et al., 2012). EEG was acquired with an 18-electrode cap (TMSi, Enschede, Netherlands) attached according to the international 10–20 system. EEG signals were referenced against an average reference and a water-based ground electrode integrated in a wristband was used. Bipolar surface EMG activity of three leg muscles (TA, tibialis anterior; BF, biceps femoris; and RF, rectus femoris) was recorded bilaterally using the EEG amplifier and disposable Ag/AgCl electrodes (Covidien, Dublin, Ireland). Electrodes were placed 2 cm apart on the belly of each muscle. Electrode placement was instructed by an expert neurologist in line with the SENIAM guidelines (Hermens et al., 1999). EMG and scalp EEG were recorded with actively shielded cables attenuating movement artifacts. The knee angle was continuously tracked by bilateral electronic goniometers. Footswitches placed under both feet monitored stepping (TMSi, Enschede, Netherlands).
Artifact Rejection
Data were analyzed with the Matlab-based FieldTrip toolbox (Oostenveld et al., 2011) using Matlab R2014a (The Mathworks, Natick, MA, USA). EEG signals were band-pass filtered offline (1–100 Hz). A band-stop filter was applied (49–51 Hz) to remove power line noise. To account for movement and muscle artifacts contaminating the EEG, the following steps were taken: first, data were visually inspected and times including artifacts such as jumps or transient high frequency activity excluded from further analysis. Second, data were decomposed using independent component analysis (ICA) with the extended Infomax algorithm implemented in the FieldTrip toolbox. The Infomax algorithm has been shown to be superior to two other ICA algorithms, SOBI and FastICA (Delorme et al., 2007). Components showing the spatial or temporal signatures of eye blinks were rejected (1.93 ± 0.47 components per participant; range 1–3) and the remaining components projected back to the scalp channels. Finally, data were re-referenced against the common average of nine central electrodes (F3, Fz, F4, C3, Cz, C4, P3, Pz, P4). By restricting the average reference to these electrodes we were able to minimize the influence of artifacts arising from neck muscles.
Continuous Movement, Initiation, and Termination of Movement
Power changes during continuous movement were expressed as the relative power change in dB to the baseline rest condition, i.e., sitting and standing, respectively. This was assessed by dividing data into 1 s segments with an overlap of 50% and calculating the fast Fourier transform (FFT) for each segment. Subsequently, spectra were averaged over segments.
The goniometer signal was used to determine movement initiation and termination. The relevant events were defined by the following procedure. First, goniometer amplitude range during movement was determined and set to 100%. Next, baseline levels were calculated for each 2 s period before the acoustic signal which indicated start. A threshold was defined at 2% above the respective baseline level. Movement initiation was then defined as crossing of the predefined threshold. An analogous threshold was defined for movement termination based on the period from 3 to 5 s after the acoustic signal which indicated stop. The accuracy of the selected initiations as well as terminations were verified visually afterwards and adapted if necessary (0% of initiations and 11.60% of terminations).
Movement initiation and termination were analyzed by performing time-frequency decomposition with a sliding Hanning window of 1 s duration and a step size of 0.05 s. Again, power changes were expressed as the relative power change in dB to the baseline rest condition. In order to draw conclusions about differences in relative power between bicycling and walking we checked that baselines were not significantly different using the non-parametric cluster-based permutation test implemented in the FieldTrip toolbox (Maris and Oostenveld, 2007).
Movement Cycle
The movement cycle was defined as the interval between two consecutive maximum knee flexions of the right knee. The maximum knee flexion is an event occurring both in bicycling and in walking. Therefore, this approach facilitates the comparison between the two types of movement. However, this definition deviates from previous walking studies which used the heel strike as the boundary of the gait cycle (Gwin et al., 2011; Wagner et al., 2012; Seeber et al., 2014). The maximum knee flexion occurs between toe off and heel strike. Power modulations locked to the movement cycle based on the knee flexion precede the ones based on the heel strike by approximately 30% of the movement cycle.
To avoid confounds due to acceleration or deceleration, we solely incorporated cycles deriving from the continuous movement condition and from the period between 2 s after movement start and 2 s before movement stop. This resulted in an average of 202.1 ± 22.2 movement cycles (range 160–240). Time-frequency spectra were calculated per movement cycle with a sliding Hanning window. The window had a length of 0.5 s and was moved in steps of 0.01 s. Individual spectra were interpolated to the length of the longest cycle and subsequently averaged. This procedure standardized the same time frame for all subjects and conditions. Power within the movement cycle was normalized by the temporal average of the entire cycle for each frequency.
Rhythmicity of power modulations within the movement cycle was quantified by the gait phase modulation measure introduced by Seeber et al. (2014) and modified by Trenado (2015). This index can take values between 0 and 1 reflecting the similarity of the power modulation within the movement cycle with a sinusoid. The calculation is based on two periods of the sinusoid representing the modulation with every single leg movement within the movement cycle. The frequency and peak value of maximal sinusoidal modulation within the 24–40 Hz range was computed for every subject and condition. The choice of the frequency range of interest was based on prior studies (Wagner et al., 2012; Seeber et al., 2014). Peak values of the modulation measure did not differ between conditions, i.e., power modulation within the movement cycle had the same similarity with a sinusoid in bicycling and walking (Bicycling: M = 0.78, SD = 0.13, Walking: M = 0.83, SD = 0.10, paired t-test, p > 0.05). The resulting frequency was further used for fitting a sine wave to the corresponding power modulation. Again, a two-period pattern of the sine wave was assumed. This allowed comparing both phase and amplitude of rhythmic power modulations between bicycling and walking.
EMG Analysis
One of the 14 subjects had to be excluded from the EMG analysis for all muscles and a further subject for one muscle (BF) due to poor data quality. EMG data was band-pass filtered (20–450 Hz) and full-wave rectified. These filter cut-off frequencies were chosen in order to maintain the relevant information and avoiding artifact contamination, especially at lower frequencies (van Boxtel, 2001; De Luca et al., 2010). Average EMG activity was obtained by computing the sum per unit of time. As we did not observe a power difference between body sides in any of the muscles (Bicycling: TA_left M = 18.18, SD = 15.03, TA_right M = 13.93, SD = 6.03, BF_left M = 19.77, SD = 8.34, BF_right M = 18.42, SD = 8.21, RF_left M = 23.41, SD = 10.97, RF_right M = 21.84, SD = 9.50, Walking: TA_left M = 49.04, SD = 15.26, TA_right M = 47.52, SD = 10.08, BF_left M = 30.70, SD = 16.32, BF_right M = 31.34, SD = 13.32, RF_left M = 39.09, SD = 23.70, RF_right M = 34.47, SD = 20.55; paired t-tests, all p > 0.05; for bicycling TA and walking RF Wilcoxon signed-rank test, all p > 0.05), we averaged EMG activity over sides.
Muscle activity within the movement cycle was analyzed as described in Jain et al. (2013). EMG activity was smoothed using a 4th order low-pass Butterworth filter with a cut-off at 5 Hz. EMG activity was summed over left and right muscles, yielding the composite EMG. In contrast to Jain et al. (2013), we interpolated EMG cycles in line with the EEG and computed grand average composite EMG as well as EEG on z-score transformed EEG and EMG data. Z-score transformed data were obtained by subtracting the mean and dividing by the standard deviation in order to account for scaling differences between subjects. Then, the correlation coefficient was determined between EEG power and EMG activity within the movement cycle.
Statistics
All analyses were focused on the Cz electrode overlying the leg area of both motor cortices and the SMA. We restricted the analysis to the Cz electrode as previous studies in the context of bicycling and walking were able to demonstrate movement-related activity especially in central sensorimotor areas (Wieser et al., 2010; Gwin et al., 2011; Wagner et al., 2012; Jain et al., 2013; Seeber et al., 2014). Changes of spectral power during continuous movement relative to the baseline rest period were evaluated in three different frequency bands: 8–12 Hz (alpha), 13–22 Hz (low beta), and 23–35 Hz (high beta) based on previous studies (López-Azcárate et al., 2010; Singh et al., 2013; Toledo et al., 2014). The frequency of maximal decrease was obtained for each frequency band and average power at the peak frequency (±1 Hz) compared between bicycling and walking using paired-samples t-tests implemented in IBM SPSS statistics, version 22 (IBM Deutschland GmbH, Ehningen, Germany). Differences in time-frequency spectra were evaluated by non-parametric cluster-based permutation testing implemented in the FieldTrip toolbox (Maris and Oostenveld, 2007). The calculation of mean and standard deviation of phase values were performed using the circular variants of these operations using the Circular Statistics Toolbox (Berens, 2009). For evaluation of phase differences between power modulations within the movement cycle we applied a non-parametric permutation test based on Watson’s U2 statistic (Zar, 1999). All other variables were tested with SPSS. We tested for normality using the Kolmogorov-Smirnov test. Two-sided paired-samples t-tests were performed in case of normally distributed data. Otherwise, we used the non-parametric Wilcoxon signed-rank test. For all tests, the significance level was set to 0.05. We corrected for multiple comparisons using the adaptive Bonferroni correction (Holm, 1979).
Results
Movement-Related Power Changes
The average cadence across participants was 40.9 rpm (SD = 1.72) for bicycling and 41.5 spm (SD = 2.88) for walking. Both bicycling and walking led to a broadband decrease of oscillatory activity relative to the baseline rest condition with minima in the alpha (8–12 Hz), low beta (13–22 Hz) and high beta band (23–35 Hz; Figure 2). For bicycling relative to sitting, alpha power decreased about 1.81 dB (SD = 1.99) at 10.00 Hz (SD = 1.30), low beta power about 1.63 dB (SD = 1.27) at 18.21 Hz (SD = 2.49), and high beta power about 3.58 dB (SD = 2.27) at 26.71 Hz (SD = 2.13). For walking relative to standing, alpha power decreased about 4.49 dB (SD = 4.06) at 10.14 Hz (SD = 1.29), low beta power about 1.95 dB (SD = 1.98) at 17.71 Hz (SD = 1.98), and high beta power about 2.30 dB (SD = 1.95) at 27.36 Hz (SD = 2.84). Frequencies of maximal decrease in the alpha, low and high beta range didn’t differ between bicycling and walking (all p > 0.05), but the pattern of power decreases during movement relative to baseline rest condition was different between the two conditions. While alpha power decrease was stronger for walking than for bicycling (p = 0.031), the power decrease in the high beta band was stronger for bicycling (p = 0.046).
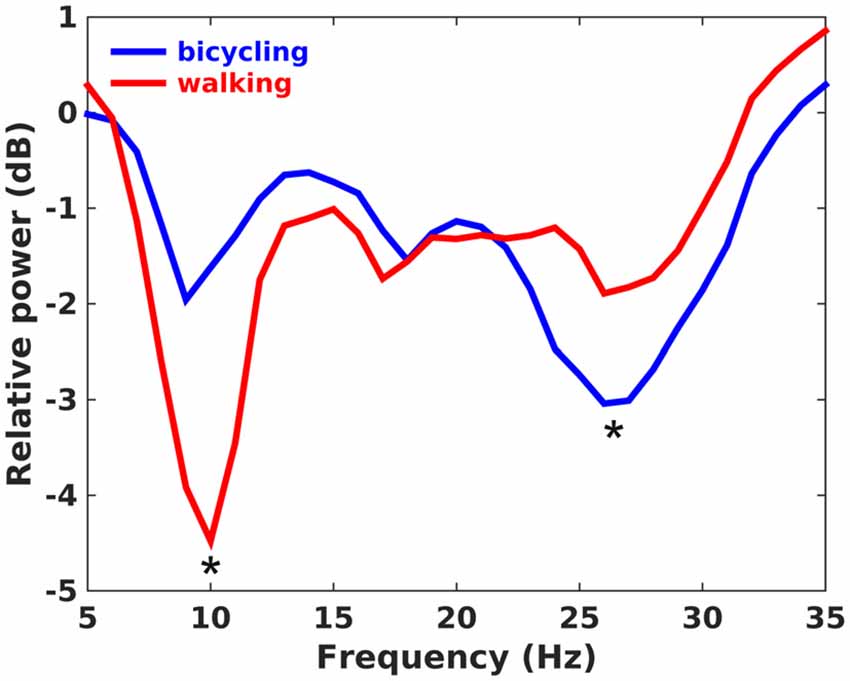
Figure 2. Power ratio. Grand average plot showing changes of spectral power in dB during continuous movement relative to the baseline rest period. Positive values indicate a power increase during movement relative to baseline, whereas negative values indicate a power decrease. Alpha power decrease was stronger in walking, whereas high beta power decrease was stronger in bicycling as indicated by the asterisks.
Power decreases relative to the baseline rest condition could be observed in the alpha, low, and high beta band at movement initiation in bicycling and walking (Figure 3, upper panel). Furthermore, theta power (4–7 Hz) increased both in bicycling and walking relative to the baseline rest condition before movement initiation. For the walking condition, this was followed by a prompt alpha power decrease immediately after movement initiation, whereas alpha power decreased approximately 500 ms after movement initiation in the bicycling condition. Contrasting relative power between bicycling and walking revealed two significant clusters (Figure 3, upper right panel). One cluster was found in the high beta band starting approximately 110 ms before movement start and indicating a stronger power decrease in bicycling compared to walking (p = 0.044). Additionally, we observed a significant cluster in the theta-alpha range (5–14 Hz, p = 0.003) during movement initiation, reflecting a stronger theta power increase and weaker subsequent alpha power decrease in bicycling compared to walking.
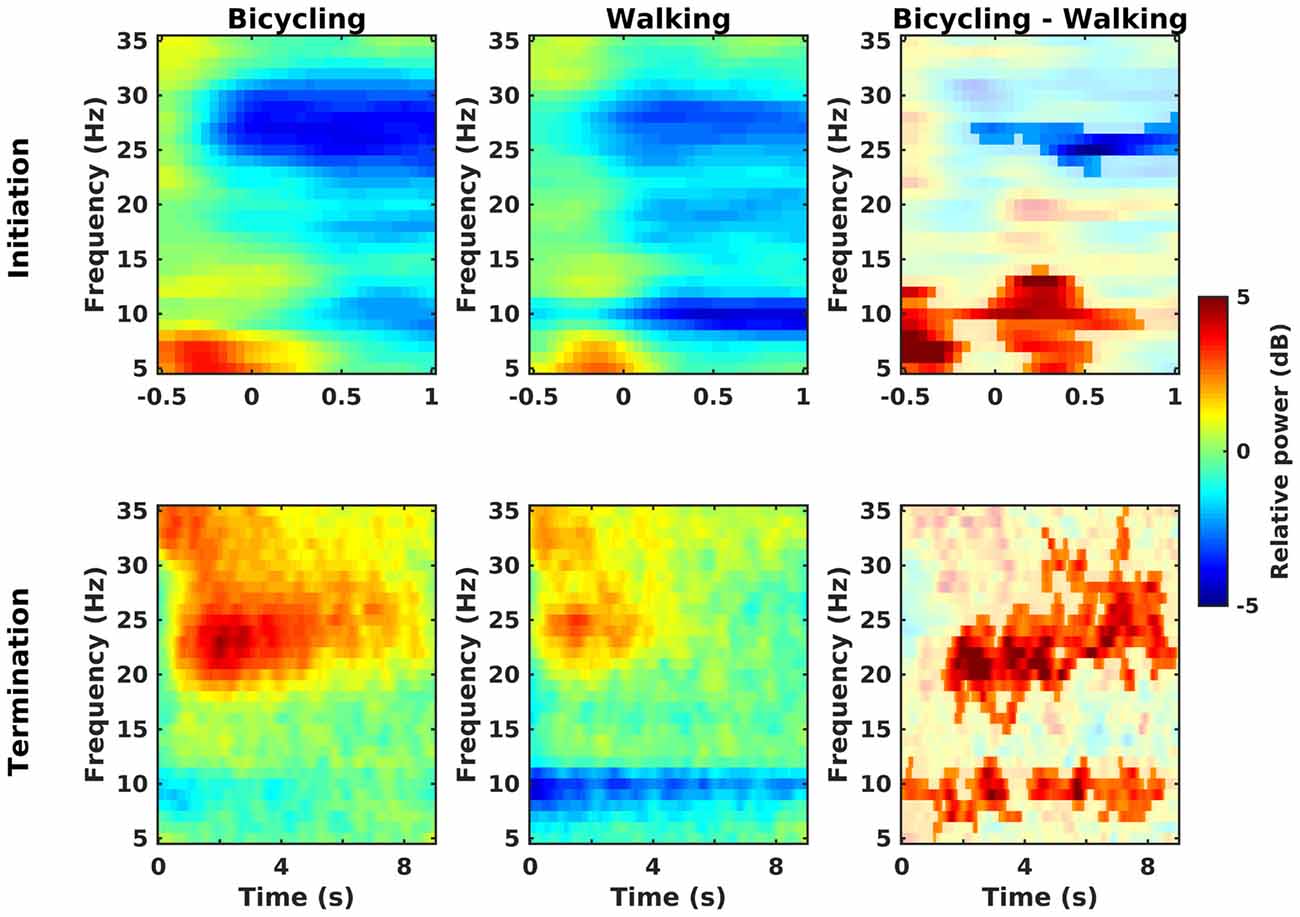
Figure 3. Initiation and termination of movement. Grand average time-frequency representations of power changes locked to a change of the movement state relative to the baseline rest period (in dB) for bicycling, walking, and the difference between both (non-significant differences masked). Upper row: Movement initiation is at t = 0. In both conditions power decreases (blue) occur in the alpha, low and high beta band, but with a stronger high beta power decrease in bicycling and a stronger alpha power decrease in walking. Lower row: Movement termination is at t = 0. In both conditions power increase (red) occurs in the beta band. Contrasting bicycling and walking revealed a difference in the temporal evolution both of the beta rebound and of the alpha power recovery.
Post-movement beta power increase relative to the baseline rest condition could be observed in both conditions about 500 ms after movement termination covering the low and high beta range (Figure 3, lower panel). Furthermore, relative alpha power recovered immediately after movement stop in bicycling whereas it recovered only gradually after walking. Contrasting relative power between bicycling and walking (Figure 3, lower right panel) showed the post-movement beta power increase to be more pronounced and prolonged in bicycling compared to walking (p < 0.001). Furthermore, we observed two significant clusters in the alpha range (earlier cluster around 0–3.5 s, p = 0.036; later cluster around 4–8.5 s, p = 0.042) reflecting the persistent post-movement alpha power decrease in walking.
Movement-Cycle Locked Modulations
Time-frequency spectra clearly showed movement cycle-dependent power modulation in the 24–40 Hz range for both bicycling and walking, but with a phase lag between conditions (Figure 4A). There was a significant difference in amplitude (Bicycling: M = 0.42, SD = 0.17, Walking: M = 0.63, SD = 0.36, p = 0.026) and phase (Bicycling: M = −1.09 rad, SD = 0.74, Walking: M = 1.55 rad, SD = 1.06, p < 0.001) of the sine wave fitted to the strongest power modulation within the movement cycle (Figure 4B). Power decreases occurred at 29.80% (SD = 13.79) and 79.10% (SD = 9.71) of the gait cycle when the leading foot was touching the ground and the trailing foot was pushing off. Within the pedal cycle, power decreases occurred shortly before top and bottom pedal positions at 48.87% (SD = 12.92) and 92.12% (SD = 8.44) of the pedal cycle.
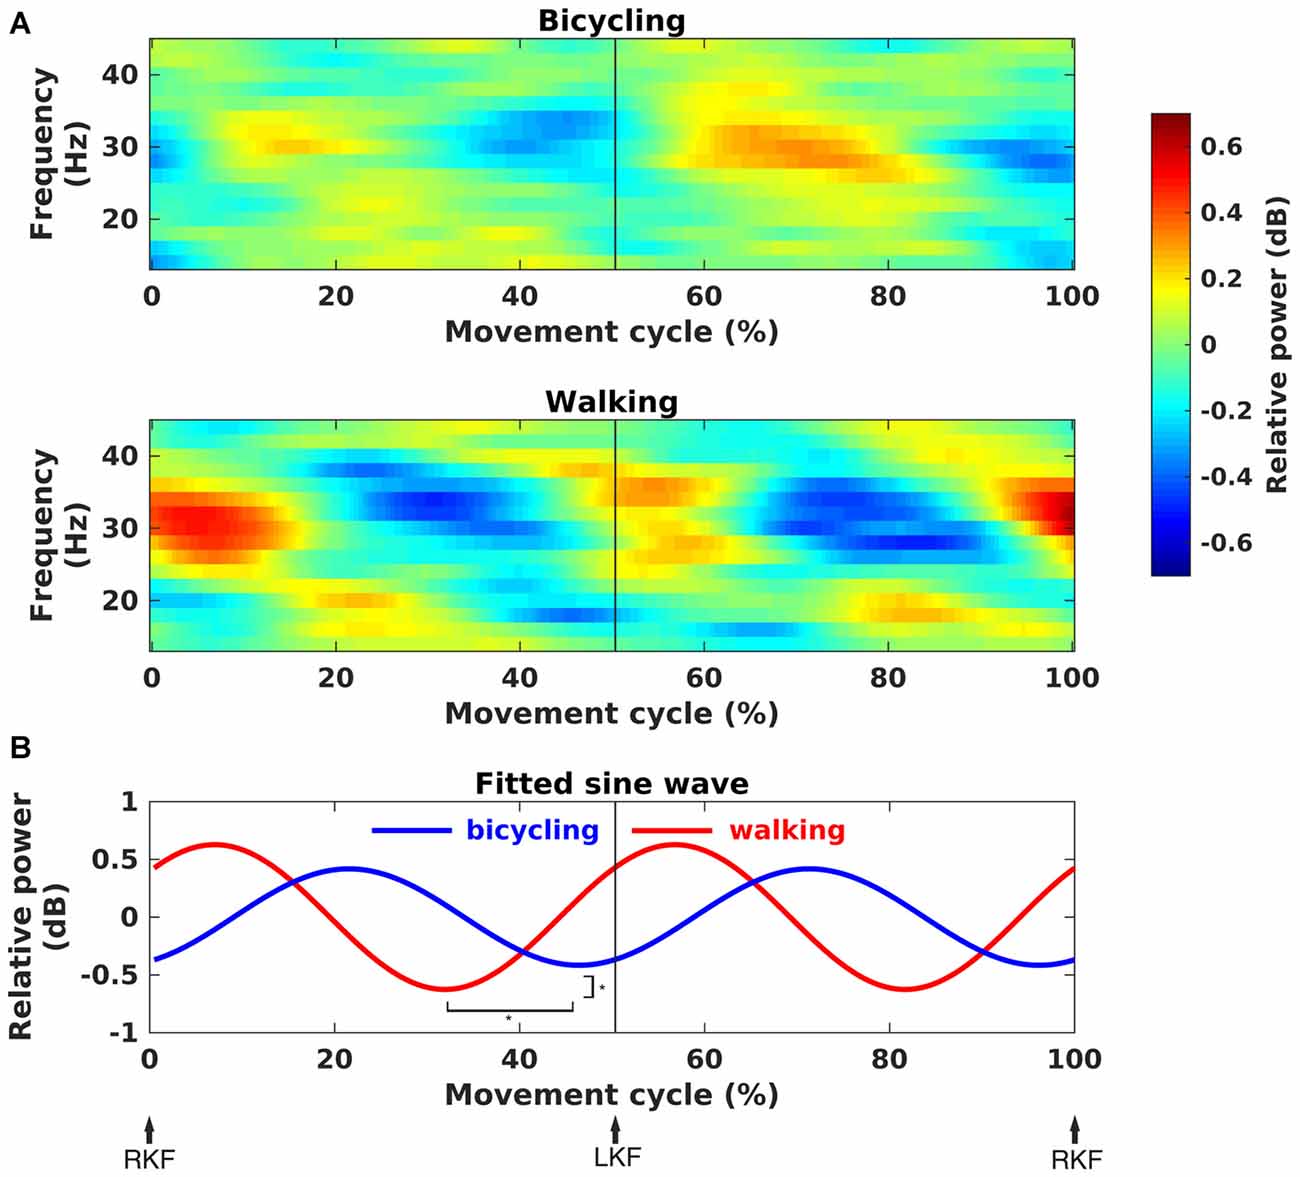
Figure 4. Movement phase-dependent power modulations. (A) Grand average time-frequency representations of power changes within the movement cycle relative to the movement cycle mean power (in dB). Sinusoidal power modulations can be observed in the frequency range 24–40 Hz in bicycling (upper panel) and walking (lower panel). (B) Grand average sine wave fitted to the power modulation within the movement cycle. The fit was performed for the frequency of maximal movement phase modulation in each individual. It was based on a two-period pattern representing the power modulation with every single leg movement, i.e., right knee flexion (RKF) to left knee flexion (LKF) and LKF to RKF. Sine waves differed significantly in phase and amplitude as indicated by the asterisks.
As can been seen in Figure 5, the time points of EEG power decreases coincided with the maximum EMG activity for both conditions. Testing a temporal relationship between the grand average composite bilateral EMG and EEG revealed a negative correlation for all muscles in the bicycling condition (TA: r = −0.92, p < 0.001; RF: r = −0.95, p < 0.001; BF: r = −0.89, p < 0.001). For the walking condition, the TA (r = −0.45, p < 0.001) and the BF (r = −0.44, p < 0.001) were correlated with the cortical power envelope. Walking relative to bicycling was accompanied by a stronger average EMG activity of the TA (Bicycling: M = 16.06, SD = 9.82, Walking: M = 48.28, SD = 11.40, p = 0.006) and the BF (Bicycling: M = 19.10, SD = 7.76, Walking: M = 31.02, SD = 12.43, p = 0.012). No difference was observed for the average EMG activity of the RF (Bicycling: M = 22.62, SD = 9.91, Walking: M = 36.78, SD = 19.46, p > 0.05).
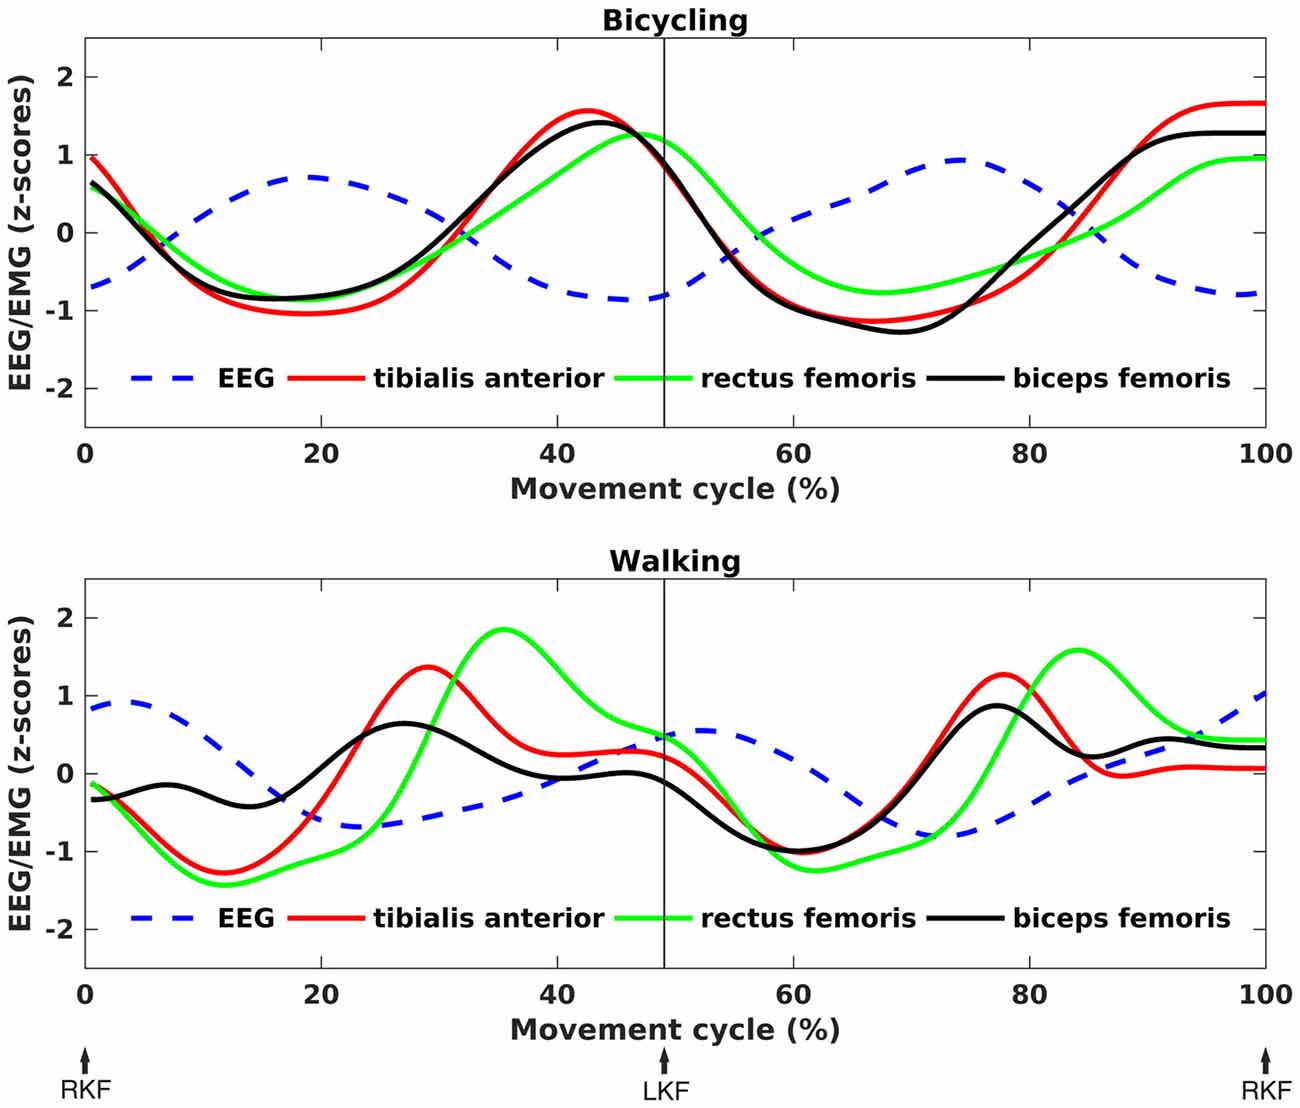
Figure 5. Correlation between EEG power and EMG activity. Grand average z-score transformed, time-resolved EEG power and EMG activity for bicycling (upper panel) and walking (lower panel). The frequency was subject-specific, i.e., the frequency of maximal movement phase modulation in each individual. An anti-phasic relationship between EEG and EMG can be seen, with EMG activity peaks coinciding with EEG power troughs.
Discussion
Our data demonstrate different cortical oscillatory dynamics subserving bicycling and walking, giving rise to movement specific aspects of cortical involvement in motor control. Bicycling was marked by movement state-dependent power modulations in the beta range (13–35 Hz), whereas walking exhibited stronger movement phase-dependent power modulations in the 24–40 Hz range.
Stronger Movement State-Dependent Beta Power Modulation in Bicycling
Beta decrease during movement execution as well as beta rebound at movement termination was stronger in bicycling than in walking. This is particularly interesting as beta power decrease is related to an active state of the sensorimotor cortex associated with increased cortical excitability (Seeber et al., 2014; for a review, see Neuper and Pfurtscheller, 2001), and beta rebound to the shift from an active to an idling or even inhibited state of the motor cortex (Pfurtscheller et al., 1996; Solis-Escalante et al., 2012). Overall, beta activity is believed to represent maintenance of the current motor state (Engel and Fries, 2010). In this sense, the oscillatory profile of bicycling seems to be dominated by the switch from a resting state to a dynamic state and vice versa.
What are the potential reasons for the difference in beta power between bicycling and walking? During bicycling, pedals are locked to each other and hence, both legs are moving continuously. In contrast, in walking, each leg is independent with alternating stance and swing phases; i.e., the movement is divided into short and distinct independent entities. In fact, beta power was shown to remain suppressed during continuous movements (Erbil and Ungan, 2007; Gwin and Ferris, 2012), whereas it recovered during isometric and sustained movements (Cassim et al., 2000; Gwin and Ferris, 2012). The more continuous motor output in bicycling may therefore result in the stronger beta power decrease during movement execution and in a stronger inhibition process at movement termination. Moreover, differences in sensory feedback accompanying motor output might also affect movement state-dependent beta power modulation in bicycling (Cassim et al., 2001; van Ede and Maris, 2013).
Alternatively, differences in movement kinematics could have accounted for the difference in beta power decrease. Cadence was kept constant across conditions. Still, we were not able to control for differences in velocity, as walking velocity can change at constant cadence by adapting step length. However, central beta power decrease was found not to be affected by movement velocity (Stančák and Pfurtscheller, 1996; Bulea et al., 2015). Investigations on the effect of muscular effort on brain activity yielded inconsistent results (Stančák et al., 1997; Christensen et al., 2000; Gwin and Ferris, 2012; Pistohl et al., 2012). In the present study, muscular effort of the TA and the BF were stronger in walking while beta decrease was stronger in bicycling. Accordingly, it is quite unlikely that the stronger beta decrease in bicycling resulted from stronger muscular effort.
Alpha Power Modulations
Bicycling and walking were associated with different oscillatory dynamics in the alpha band. Walking, as opposed to bicycling, was associated with a stronger alpha power decrease. Furthermore, alpha decrease occurred earlier during initiation of walking, but it was also found to recover later after movement termination. In line with this, Leocani et al. (1997) investigated self-paced finger movements and found cortical areas showing fast alpha suppression to be the ones showing late recovery. Alpha decrease was shown to persist after movement termination and localized to the postcentral gyrus (Salmelin and Hari, 1994; Salmelin et al., 1995; Leocani et al., 1997; Jurkiewicz et al., 2006). Consequently, alpha decrease is assumed to be closely linked to somatosensory processing. This tallies with the findings by Wagner et al. (2012) who showed alpha power to decrease during active compared to passive walking in the sensory cortex, probably related to the increased sensory feedback from the muscles. Interestingly, alpha power was also reported to decrease in parietal areas during walking with interactive movement related feedback compared to movement unrelated feedback (Wagner et al., 2014). This difference in alpha power decrease was suggested to be related to sensorimotor integration during visually guided walking in a virtual environment. Moreover, Presacco et al. (2011) found alpha power to decrease during precision walking, i.e., when participants were required to control their foot placement based on visual feedback. As alpha band activity is generally associated with attention and information processing (for a review, see Klimesch, 2012), this may point to enhanced sensory and attentional demands in walking.
Stronger Movement Phase-Dependent Power Modulation in the 24–40 Hz Range in Walking
We report movement phase-dependent power modulation in the 24–40 Hz range for the first time in bicycling and overground walking. Within-cycle power modulation in walking agrees with previous results and has been related to motor planning and sensorimotor processing (Wagner et al., 2012, 2014; Seeber et al., 2014, 2015). However, the exact role remained elusive.
Here, we provide further evidence for cortical oscillatory activity being involved in motor control. For both movement types, power decreases occurred during movement transition phases, i.e., transition between stance and swing phase in walking and flexion and extension in bicycling. Since transition phases occur at different time points in the movement cycle in bicycling and walking if defined according to the maximum right knee flexion (RKF), the corresponding power modulation significantly differed between conditions. This adds to previous results demonstrating strongest negative movement-evoked potentials during transition phases in bicycling and walking, emphasizing highest cortical control during changes of movement direction (Wieser et al., 2010; Jain et al., 2013; Knaepen et al., 2015). In line with this idea, negative potentials have been associated with activity in the cingulate and prefrontal cortex and subsequent positive potentials with activity in sensorimotor regions, thought to reflect processing of afferent feedback (Knaepen et al., 2015). Interestingly, Petersen et al. (2012) found corticomuscular coherence in the 24–40 Hz range between Cz and the TA muscle before the heel strike during walking. Importantly, cortical activity was leading muscular activity, as indicated by the negative sign of the imaginary part of coherency. Together, this may indicate power modulations in the 24–40 Hz range to reflect movement phase-dependent planning processes as an aspect of cortical motor control.
Although bicycling and walking both exhibited movement phase-dependent power modulation with power decreases occurring during movement transition phases, power modulation was found to be stronger in walking. This suggests that bicycling and walking differ in cortical involvement in motor control within the movement cycle. Two factors may contribute to this difference. First, the restricted movement pattern in bicycling with symmetrically moving pedals at fixed circumference may demand less motor planning within the pedal cycle. This assumption is strengthened by the finding of higher interference during walking compared to bicycling in a dual task situation in Parkinson’s disease patients (Yogev-Seligmann et al., 2013). The authors reasoned bilateral coordination making movement vulnerable to cognitive load. Indeed, the SMA has been shown to be involved in interlimb coordination and to be affected in Parkinson’s disease (Wu et al., 2010). Hence, the present difference in cortical activity recorded at the Cz electrode might reflect differences in motor planning due to differing coordination demands.
Second, stronger power modulation in walking might result from stronger muscle recruitment or the integration of related sensory feedback. We found EEG power and EMG activity to be closely correlated in the present study with EEG power decreases coinciding with maximal muscle recruitment of the TA and BF. Notably, average EMG activity of the TA and BF was stronger in walking compared to bicycling. This may be directly related to the difference in cortical power modulation between the two movement types. Moreover, afferent input of the leg muscles was shown to affect cortical activation. Williamson et al. (1997) found passive bicycling to lead to less activation of the motor cortex as compared to active bicycling. However, passive bicycling with additional electrical stimulation of the leg muscles increased the cortical activation in the direction of the level during active bicycling. Somatosensory integration was also suggested to lead to phase specific power increases in the 30–50 Hz range in posterior parietal areas during a speed tracking task on a treadmill when participants had to drive the treadmill speed by themselves, as opposed to a predetermined treadmill speed (Bulea et al., 2015). In agreement with this, integration of sensory information into the motor command was proposed to shift the corticomuscular coherence from the range of 15–30 Hz to higher frequencies, i.e., 30–35 Hz, during dynamic movements (Omlor et al., 2007). Importantly, the huge contribution of sensory afferents to sensorimotor activity was also emphasized by almost identical activation patterns in passive and active bicycling and walking (Wagner et al., 2012; Jain et al., 2013). Interestingly, Wagner et al. (2012) observed a trend for stronger power decreases in active compared to passive walking, whereas Jain et al. (2013) found active compared to passive bicycling to lead to an attenuation of the movement-evoked potentials. They assumed this to be due to sensory gating by efferent corticospinal output. Based on this, phasic sensory input may be more inhibited in bicycling because of the continuous movement pattern and stronger corticospinal drive, respectively.
Methodological Considerations
Artifact contamination is a major issue in EEG studies on movement (Gwin et al., 2011; Castermans et al., 2014; Kline et al., 2015). Recently, several artifact rejection methods, e.g., ICA in combination with dipole analysis, have been applied to study oscillatory activity during walking (Gwin et al., 2011; Wagner et al., 2012). We decided to use ICA solely for rejecting components clearly reflecting eye blinks and not components potentially related to muscle artifacts. Due to the small number of electrodes ICA cannot be expected to isolate muscle artifacts completely, i.e., many of the components will be a mixture of artifacts and brain activity, and should not be discarded. Moreover, we restricted the average reference to the nine central electrodes in order to minimize muscular artifact contamination especially from the neck muscles which mostly affected the lateral and occipital electrodes. However, we cannot rule out that we thereby changed signal localization and power or artifacts remaining in the data. Notably, the similarity between our data and prior results suggests that our conservative procedure yielded comparable data quality. This point is additionally supported by intra-cycle power modulations occurring in a physiologically limited frequency band (24–40 Hz) and not as broadband activity. This would be expected in case of movement artifact contamination (Castermans et al., 2014) and in particular muscular artifact contamination from the neck muscles (Gwin et al., 2011; Severens et al., 2012).
Interpreting the differences in cortical activity underlying bicycling and walking one has to keep in mind that several factors as e.g., exercise intensity and preference influence brain activity (Brümmer et al., 2011a,b). We controlled for a difference in cadence as Christensen et al. (2000) have shown that cortical activation correlates with cadence but not with pedal resistance during recumbent bicycling. However, as we did not measure heart beat or direct calorimetry, we cannot directly control the influence of physiological load on the power difference between bicycling and walking.
Furthermore, participants had to bicycle and walk with a predetermined cadence of 40 rpm and 40 spm, respectively. The imposed cadence might have deviated from the self-preferred cadence which could have influenced brain activity during both movements, especially cortical control within the movement cycle. A relationship between cortical control and walking cadence is suggested by the findings of slowed walking cadence in the elderly under dual-task load (for a review, see Al-Yahya et al., 2011). Not controlling for a difference in cadence, however, would have caused an obvious mismatch in motor output between bicycling and walking. Furthermore, Gwin et al. (2011) did not find any significant difference comparing gait phase-dependent EEG power modulation for 0.8 and 1.25 m/s walking.
Implications for Freezing of Gait in Parkinson’s Disease
The finding of different cortical oscillatory dynamics in bicycling and walking may shed some light on the puzzling finding of preserved bicycling abilities in Parkinson’s patients suffering from severe freezing of gait (FOG; Snijders et al., 2011b, 2012). FOG has been associated with impaired temporal and spatial gait control (Nieuwboer et al., 2001; Hausdorff et al., 2003), decreased activity of the SMA (Snijders et al., 2011a), and increased resting state high beta power within the subthalamic nucleus (Toledo et al., 2014). Parkinson’s disease is generally associated with abnormally increased beta band activity in the corticobasal ganglia loop (for a review, see Oswal et al., 2013). Therefore, one may speculate that bicycling may be less hampered in FOG because the more continuous nature of this movement promotes beta suppression and demands less sensorimotor processing. Furthermore, the more continuous movement in bicycling may be less vulnerable to interruptions than the independent movement entities in walking. A study specifically addressing this hypothesis is in progress.
Conclusion
The present study provides insight into oscillatory dynamics being involved in motor control during both bicycling and walking. We found stronger movement state-dependent high beta power modulation but less movement phase-dependent power modulation in the 24–40 Hz range in bicycling as opposed to walking. Our data suggest that, relative to walking, bicycling is characterized by a stronger cortical activation. This may be the result of the more continuous movement pattern, precluding a regular rest period. In contrast, phases of rest and movement alternate all the time in walking and may therefore demand more phase-dependent sensory processing and motor planning.
Author Contributions
All authors contributed to the design of the experiment and revised the manuscript. LS, MB, JH, OA, and SSD were involved in data analysis and interpretation and LS further in data acquisition. All authors approved the final version of the manuscript, agreed to be accountable for all aspects of the work and qualify for authorship.
Conflict of Interest Statement
The authors declare that the research was conducted in the absence of any commercial or financial relationships that could be construed as a potential conflict of interest.
Acknowledgments
We thank Dr. Carlos Trenado (HHU Düsseldorf) for his support with data analysis and for helpful discussions and comments and Nitin Sharma (University of Konstanz) for assistance with constructing and programming the bicycle simulator.
This work was generously supported by a grant from the Jacques and Gloria Gossweiler Foundation. Further support was received from the Zukunftskolleg of the University of Konstanz [SSD], Heinrich Heine University Strategic Research Funds [MB], the Open Access Publication Fund of the University of Konstanz, and the research commission of the medical faculty of the Heinrich Heine University [9772562 to MB]. LS was supported by a travel grant from the Boehringer Ingelheim Foundation (BIF).
References
Alegre, M., Labarga, A., Gurtubay, I. G., Iriarte, J., Malanda, A., and Artieda, J. (2002). Beta electroencephalograph changes during passive movements: sensory afferences contribute to beta event-related desynchronization in humans. Neurosci. Lett. 331, 29–32. doi: 10.1016/s0304-3940(02)00825-x
Al-Yahya, E., Dawes, H., Smith, L., Dennis, A., Howells, K., and Cockburn, J. (2011). Cognitive motor interference while walking: a systematic review and meta-analysis. Neurosci. Biobehav. Rev. 35, 715–728. doi: 10.1016/j.neubiorev.2010.08.008
Berens, P. (2009). CircStat: a MATLAB toolbox for circular statistics. J. Stat. Softw. 31, 1–21. doi: 10.18637/jss.v031.i10
Brümmer, V., Schneider, S., Abel, T., Vogt, T., and Strüder, H. K. (2011a). Brain cortical activity is influenced by exercise mode and intensity. Med. Sci. Sport. Exerc. 43, 1863–1872. doi: 10.1249/mss.0b013e3182172a6f
Brümmer, V., Schneider, S., Strüder, H. K., and Askew, C. D. (2011b). Primary motor cortex activity is elevated with incremental exercise intensity. Neuroscience 181, 150–162. doi: 10.1016/j.neuroscience.2011.02.006
Bulea, T. C., Kim, J., Damiano, D. L., Stanley, C. J., and Park, H.-S. (2015). Prefrontal, posterior parietal and sensorimotor network activity underlying speed control during walking. Front. Hum. Neurosci. 9:247. doi: 10.3389/fnhum.2015.00247
Cassim, F., Monaca, C., Szurhaj, W., Bourriez, J. L., Defebvre, L., Derambure, P., et al. (2001). Does post-movement beta synchronization reflect an idling motor cortex? Neuroreport 12, 3859–3863. doi: 10.1097/00001756-200112040-00051
Cassim, F., Szurhaj, W., Sediri, H., Devos, D., Bourriez, J. L., Poirot, I., et al. (2000). Brief and sustained movements: differences in event-related (de)synchronization (ERD/ERS) patterns. Clin. Neurophysiol. 111, 2032–2039. doi: 10.1016/s1388-2457(00)00455-7
Castermans, T., Duvinage, M., Cheron, G., and Dutoit, T. (2014). About the cortical origin of the low-delta and high-gamma rhythms observed in EEG signals during treadmill walking. Neurosci. Lett. 561, 166–170. doi: 10.1016/j.neulet.2013.12.059
Christensen, L. O. D., Johannsen, P., Sinkjaer, T., Petersen, N., Pyndt, H. S., and Nielsen, J. B. (2000). Cerebral activation during bicycle movements in man. Exp. Brain Res. 135, 66–72. doi: 10.1007/s002210000493
Dahmen, T., Byshko, R., Saupe, D., Röder, M., and Mantler, S. (2011). Validation of a model and a simulator for road cycling on real tracks. Sport Eng. 14, 95–110. doi: 10.1007/s12283-011-0076-1
De Luca, C. J., Donald Gilmore, L., Kuznetsov, M., and Roy, S. H. (2010). Filtering the surface EMG signal: movement artifact and baseline noise contamination. J. Biomech. 43, 1573–1579. doi: 10.1016/j.jbiomech.2010.01.027
Delorme, A., Sejnowski, T., and Makeig, S. (2007). Enhanced detection of artifacts in EEG data using higher-order statistics and independent component analysis. Neuroimage 34, 1443–1449. doi: 10.1016/j.neuroimage.2006.11.004
Durka, P. J., Kuś, R., Żygierewicz, J., Michalska, M., Milanowski, P., Łabecki, M., et al. (2012). User-centered design of brain-computer interfaces: open BCI.pl and BCI appliance. Bull. Polish Acad. Sci. Tech. Sci. 60, 427–431. doi: 10.2478/v10175-012-0054-1
Engel, A. K., and Fries, P. (2010). Beta-band oscillations—signalling the status quo? Curr. Opin. Neurobiol. 20, 156–165. doi: 10.1016/j.conb.2010.02.015
Erbil, N., and Ungan, P. (2007). Changes in the alpha and beta amplitudes of the central EEG during the onset, continuation and offset of long-duration repetitive hand movements. Brain Res. 1169, 44–56. doi: 10.1016/j.brainres.2007.07.014
Fukuyama, H., Ouchi, Y., Matsuzaki, S., Nagahama, Y., Yamauchi, H., Ogawa, M., et al. (1997). Brain functional activity during gait in normal subjects: a SPECT study. Neurosci. Lett. 228, 183–186. doi: 10.1016/s0304-3940(97)00381-9
Gwin, J. T., and Ferris, D. P. (2012). An EEG-based study of discrete isometric and isotonic human lower limb muscle contractions. J. Neuroeng. Rehabil. 9:35. doi: 10.1186/1743-0003-9-35
Gwin, J. T., Gramann, K., Makeig, S., and Ferris, D. P. (2011). Electrocortical activity is coupled to gait cycle phase during treadmill walking. Neuroimage 54, 1289–1296. doi: 10.1016/j.neuroimage.2010.08.066
Hausdorff, J. M., Schaafsma, J. D., Balash, Y., Bartels, A. L., Gurevich, T., and Giladi, N. (2003). Impaired regulation of stride variability in Parkinson’s disease subjects with freezing of gait. Exp. Brain Res. 149, 187–194. doi: 10.1007/s00221-002-1354-8
Hermens, H. J., Freriks, B., Merletti, R., Stegeman, D., Blok, J., Rau, G., et al. (1999). European Recommendations for Surface ElectroMyoGraphy. Enschede: Roessingh Research and Development.
Jain, S., Gourab, K., Schindler-Ivens, S., and Schmit, B. D. (2013). EEG during pedaling: evidence for cortical control of locomotor tasks. Clin. Neurophysiol. 124, 379–390. doi: 10.1016/j.clinph.2012.08.021
Jurkiewicz, M. T., Gaetz, W. C., Bostan, A. C., and Cheyne, D. (2006). Post-movement beta rebound is generated in motor cortex: evidence from neuromagnetic recordings. Neuroimage 32, 1281–1289. doi: 10.1016/j.neuroimage.2006.06.005
Klimesch, W. (2012). Alpha-band oscillations, attention and controlled access to stored information. Trends Cogn. Sci. 16, 606–617. doi: 10.1016/j.tics.2012.10.007
Kline, J. E., Huang, H. J., Snyder, K. L., and Ferris, D. P. (2015). Isolating gait-related movement artifacts in electroencephalography during human walking. J. Neural Eng. 12:046022. doi: 10.1088/1741-2560/12/4/046022
Knaepen, K., Mierau, A., Tellez, H. F., Lefeber, D., and Meeusen, R. (2015). Temporal and spatial organization of gait-related electrocortical potentials. Neurosci. Lett. 599, 75–80. doi: 10.1016/j.neulet.2015.05.036
Leocani, L., Toro, C., Manganotti, P., Zhuang, P., and Hallett, M. (1997). Event-related coherence and event-related desynchronization/synchronization in the 10 Hz and 20 Hz EEG during self-paced movements. Electroencephalogr. Clin. Neurophysiol. Potentials Sect. 104, 199–206. doi: 10.1016/s0168-5597(96)96051-7
López-Azcárate, J., Tainta, M., Rodríguez-Oroz, M. C., Valencia, M., González, R., Guridi, J., et al. (2010). Coupling between beta and high-frequency activity in the human subthalamic nucleus may be a pathophysiological mechanism in Parkinson’s disease. J. Neurosci. 30, 6667–6677. doi: 10.1523/JNEUROSCI.5459-09.2010
Maris, E., and Oostenveld, R. (2007). Nonparametric statistical testing of EEG- and MEG-data. J. Neurosci. Methods 164, 177–190. doi: 10.1016/j.jneumeth.2007.03.024
Mehta, J. P., Verber, M. D., Wieser, J. A., Schmit, B. D., and Schindler-Ivens, S. M. (2009). A novel technique for examining human brain activity associated with pedaling using fMRI. J. Neurosci. Methods 179, 230–239. doi: 10.1016/j.jneumeth.2009.01.029
Miyai, I., Tanabe, H. C., Sase, I., Eda, H., Oda, I., Konishi, I., et al. (2001). Cortical mapping of gait in humans: a near-infrared spectroscopic topography study. Neuroimage 14, 1186–1192. doi: 10.1006/nimg.2001.0905
Müller-Putz, G. R., Zimmermann, D., Graimann, B., Nestinger, K., Korisek, G., and Pfurtscheller, G. (2007). Event-related beta EEG-changes during passive and attempted foot movements in paraplegic patients. Brain Res. 1137, 84–91. doi: 10.1016/j.brainres.2006.12.052
Neuper, C., and Pfurtscheller, G. (2001). Event-related dynamics of cortical rhythms: frequency-specific features and functional correlates. Int. J. Psychophysiol. 43, 41–58. doi: 10.1016/s0167-8760(01)00178-7
Nieuwboer, A., Dom, R., De Weerdt, W., Desloovere, K., Fieuws, S., and Broens-Kaucsik, E. (2001). Abnormalities of the spatiotemporal characteristics of gait at the onset of freezing in Parkinson’s disease. Mov. Disord. 16, 1066–1075. doi: 10.1002/mds.1206
Nutt, J. G., Bloem, B. R., Giladi, N., Hallett, M., Horak, F. B., and Nieuwboer, A. (2011). Freezing of gait: moving forward on a mysterious clinical phenomenon. Lancet Neurol. 10, 734–744. doi: 10.1016/s1474-4422(11)70143-0
Omlor, W., Patino, L., Hepp-Reymond, M. C., and Kristeva, R. (2007). Gamma-range corticomuscular coherence during dynamic force output. Neuroimage 34, 1191–1198. doi: 10.1016/j.neuroimage.2006.10.018
Oostenveld, R., Fries, P., Maris, E., and Schoffelen, J.-M. (2011). Fieldtrip: open source software for advanced analysis of MEG, EEG and invasive electrophysiological data. Comput. Intell. Neurosci. 2011:156869. doi: 10.1155/2011/156869
Oswal, A., Brown, P., and Litvak, V. (2013). Synchronized neural oscillations and the pathophysiology of Parkinson’s disease. Curr. Opin. Neurol. 26, 662–670. doi: 10.1097/WCO.0000000000000034
Parkes, L. M., Bastiaansen, M. C. M., and Norris, D. G. (2006). Combining EEG and fMRI to investigate the post-movement beta rebound. Neuroimage 29, 685–696. doi: 10.1016/j.neuroimage.2005.08.018
Petersen, T. H., Willerslev-Olsen, M., Conway, B. A., and Nielsen, J. B. (2012). The motor cortex drives the muscles during walking in human subjects. J. Physiol. 590, 2443–2452. doi: 10.1113/jphysiol.2012.227397
Pfurtscheller, G., Stancák, A., Jr., and Neuper, C. (1996). Post-movement beta synchronization. A correlate of an idling motor area? Electroencephalogr. Clin. Neurophysiol. 98, 281–293. doi: 10.1016/0013-4694(95)00258-8
Pistohl, T., Schulze-Bonhage, A., Aertsen, A., Mehring, C., and Ball, T. (2012). Decoding natural grasp types from human ECoG. Neuroimage 59, 248–260. doi: 10.1016/j.neuroimage.2011.06.084
Presacco, A., Goodman, R., Forrester, L., and Contreras-Vidal, J. L. (2011). Neural decoding of treadmill walking from noninvasive electroencephalographic signals. J. Neurophysiol. 106, 1875–1887. doi: 10.1152/jn.00104.2011
Raasch, C. C., and Zajac, F. E. (1999). Locomotor strategy for pedaling: muscle groups and biomechanical functions. J. Neurophysiol. 82, 515–525.
Ridgel, A. L., Kim, C., Fickes, E. J., Muller, M. D., and Alberts, J. L. (2011). Changes in executive function after acute bouts of passive cycling in Parkinson ’s disease. J. Aging Phys. Act. 19, 87–98.
Ridgel, A. L., Peacock, C. A., Fickes, E. J., and Kim, C.-H. (2012). Active-assisted cycling improves tremor and bradykinesia in Parkinson’s disease. Arch. Phys. Med. Rehabil. 93, 2049–2054. doi: 10.1016/j.apmr.2012.05.015
Ridgel, A. L., Vitek, J. L., and Alberts, J. L. (2009). Forced, not voluntary, exercise improves motor function in Parkinson’s disease patients. Neurorehabil. Neural Repair 23, 600–608. doi: 10.1177/1545968308328726
Salmelin, R., and Hari, R. (1994). Spatiotemporal characteristics of sensorimotor neuromagnetic rhythms related to thumb movement. Neuroscience 60, 537–550. doi: 10.1016/0306-4522(94)90263-1
Salmelin, R., Hämäläinen, M., Kajola, M., and Hari, R. (1995). Functional segregation of movement-related rhythmic activity in the human brain. Neuroimage 2, 237–243. doi: 10.1006/nimg.1995.1031
Seeber, M., Scherer, R., Wagner, J., Solis-Escalante, T., and Müller-Putz, G. R. (2014). EEG beta suppression and low gamma modulation are different elements of human upright walking. Front. Hum. Neurosci. 8:485. doi: 10.3389/fnhum.2014.00485
Seeber, M., Scherer, R., Wagner, J., Solis-Escalante, T., and Müller-Putz, G. R. (2015). High and low gamma EEG oscillations in central sensorimotor areas are conversely modulated during the human gait cycle. Neuroimage 112, 318–326. doi: 10.1016/j.neuroimage.2015.03.045
Severens, M., Nienhuis, B., Desain, P., and Duysens, J. (2012). Feasibility of measuring event Related Desynchronization with electroencephalography during walking. Conf. Proc. IEEE Eng. Med. Biol. Soc. 2764–2767. doi: 10.1109/EMBC.2012.6346537
Singh, A., Plate, A., Kammermeier, S., Mehrkens, J. H., Ilmberger, J., and Bötzel, K. (2013). Freezing of gait-related oscillatory activity in the human subthalamic nucleus. Basal Ganglia 3, 25–32. doi: 10.1016/j.baga.2012.10.002
Snijders, A. H., Leunissen, I., Bakker, M., Overeem, S., Helmich, R. C., Bloem, B. R., et al. (2011a). Gait-related cerebral alterations in patients with Parkinson’s disease with freezing of gait. Brain 134, 59–72. doi: 10.1093/brain/awq324
Snijders, A. H., Toni, I., Ružička, E., and Bloem, B. R. (2011b). Bicycling breaks the ice for freezers of gait. Mov. Disord. 26, 367–371. doi: 10.1002/mds.23530
Snijders, A. H., van Kesteren, M., and Bloem, B. R. (2012). Cycling is less affected than walking in freezers of gait. J. Neurol. Neurosurg. Psychiatry 83, 575–576. doi: 10.1136/jnnp-2011-300375
Solis-Escalante, T., Müller-Putz, G. R., Pfurtscheller, G., and Neuper, C. (2012). Cue-induced beta rebound during withholding of overt and covert foot movement. Clin. Neurophysiol. 123, 1182–1190. doi: 10.1016/j.clinph.2012.01.013
Stančák, A., Jr., and Pfurtscheller, G. (1996). Event-related desynchronisation of central beta-rhythms during brisk and slow self-paced finger movements of dominant and nondominant hand. Brain Res. Cogn. Brain Res. 4, 171–183. doi: 10.1016/s0926-6410(96)00031-6
Stančák, A., Jr., Riml, A., and Pfurtscheller, G. (1997). The effects of external load on movement-related changes of the sensorimotor EEG rhythms. Electroencephalogr. Clin. Neurophysiol. 102, 495–504. doi: 10.1016/s0013-4694(96)96623-0
Toledo, J. B., López-Azcárate, J., Garcia-Garcia, D., Guridi, J., Valencia, M., Artieda, J., et al. (2014). High beta activity in the subthalamic nucleus and freezing of gait in Parkinson’s disease. Neurobiol. Dis. 64, 60–65. doi: 10.1016/j.nbd.2013.12.005
Trenado, C. (2015). Commentary: EEG beta suppression and low gamma modulation are different elements of human upright walking. Front. Hum. Neurosci. 9:380. doi: 10.3389/fnhum.2015.00380
van Boxtel, A. (2001). Optimal signal bandwidth for the recording of surface EMG activity of facial, jaw, oral and neck muscles. Psychophysiology 38, 22–34. doi: 10.1111/1469-8986.3810022
van Ede, F., and Maris, E. (2013). Somatosensory demands modulate muscular beta oscillations, independent of motor demands. J. Neurosci. 33, 10849–10857. doi: 10.1523/JNEUROSCI.5629-12.2013
Wagner, J., Solis-Escalante, T., Grieshofer, P., Neuper, C., Müller-Putz, G., and Scherer, R. (2012). Level of participation in robotic-assisted treadmill walking modulates midline sensorimotor EEG rhythms in able-bodied subjects. Neuroimage 63, 1203–1211. doi: 10.1016/j.neuroimage.2012.08.019
Wagner, J., Solis-Escalante, T., Scherer, R., Neuper, C., and Müller-Putz, G. (2014). It’s how you get there: walking down a virtual alley activates premotor and parietal areas. Front. Hum. Neurosci. 8:93. doi: 10.3389/fnhum.2014.00093
Wieser, M., Haefeli, J., Bütler, L., Jäncke, L., Riener, R., and Koeneke, S. (2010). Temporal and spatial patterns of cortical activation during assisted lower limb movement. Exp. Brain Res. 203, 181–191. doi: 10.1007/s00221-010-2223-5
Williamson, J. W., Nobrega, A. C. L., McColl, R., Mathews, D., Winchester, P., Friberg, L., et al. (1997). Activation of the insular cortex during dynamic exercise in humans. J. Physiol. 503, 277–283. doi: 10.1111/j.1469-7793.1997.277bh.x
Wu, T., Wang, L., Hallett, M., Li, K., and Chan, P. (2010). Neural correlates of bimanual anti-phase and in-phase movements in Parkinson’s disease. Brain 133, 2394–2409. doi: 10.1093/brain/awq151
Yogev-Seligmann, G., Giladi, N., Gruendlinger, L., and Hausdorff, J. M. (2013). The contribution of postural control and bilateral coordination to the impact of dual tasking on gait. Exp. Brain Res. 226, 81–93. doi: 10.1007/s00221-013-3412-9
Keywords: EEG, bicycling, walking, motor control, oscillations, sensorimotor cortex
Citation: Storzer L, Butz M, Hirschmann J, Abbasi O, Gratkowski M, Saupe D, Schnitzler A and Dalal SS (2016) Bicycling and Walking are Associated with Different Cortical Oscillatory Dynamics. Front. Hum. Neurosci. 10:61. doi: 10.3389/fnhum.2016.00061
Received: 23 November 2015; Accepted: 08 February 2016;
Published: 19 February 2016.
Edited by:
Klaus Gramann, Berlin Institute of Technology, GermanyReviewed by:
Johanna Wagner, Graz University of Technology, AustriaPedro M. R. Reis, Friedrich-Alexander Universität Erlangen-Nürnberg, Germany
Helen Jingi Huang, University of Michigan, USA
Copyright © 2016 Storzer, Butz, Hirschmann, Abbasi, Gratkowski, Saupe, Schnitzler and Dalal. This is an open-access article distributed under the terms of the Creative Commons Attribution License (CC BY). The use, distribution and reproduction in other forums is permitted, provided the original author(s) or licensor are credited and that the original publication in this journal is cited, in accordance with accepted academic practice. No use, distribution or reproduction is permitted which does not comply with these terms.
*Correspondence: Lena Storzer, lena.storzer@hhu.de