Digital atlas of anatomical subdivisions and boundaries of the rat hippocampal region
- 1 Centre for Molecular Biology and Neuroscience, Institute of Basic Medical Sciences, University of Oslo, Oslo, Norway
- 2 Centre for the Biology of Memory, The Kavli Institute for Systems Neuroscience, Norwegian University of Science and Technology, Trondheim, Norway
- 3 Department of Anatomy and Neuroscience, VU University Medical Center, Amsterdam, Netherlands
The rat hippocampal region is frequently studied in relation to learning and memory processes and brain diseases. The region is complex, consisting of multiple subdivisions that are challenging to delineate anatomically. Published atlases of the rat brain typically lack the underlying histological criteria necessary to identify boundaries, and textbooks descriptions of the region are often inadequately illustrated and thus difficult to relate to experimental data. An overview of both anatomical features and criteria used to delineate boundaries is required to assign location to experimental material from the hippocampal region. To address this issue, we have developed a web-based atlas application in which images of histological sections are integrated with new and up-to-date criteria for subdividing the rat hippocampus formation, fasciola, and associated parahippocampal regions. The atlas application consists of an interactive image viewer with high-resolution images of an extensive series of sections stained for NeuN, calbindin, and parvalbumin, and an index of structures with detailed descriptions of the criteria used to define the boundaries. Images can be inspected with a graphical overlay of selected subregions. Bi-directional links between images and the index of structures are provided. In summary, we provide a novel content-rich digital atlas resource facilitating identification of morphological features relevant for delineating the anatomical subdivisions of the rat hippocampal region. The atlas application is available at http://www.rbwb.org.
Introduction
The rat hippocampal region is a frequently used research model for exploring both normal and pathological conditions, including the processes involved in memory and learning (Kesner and Hopkins, 2006; Manns and Eichenbaum, 2009; Deshmukh et al., 2010) and neurodegenerative diseases (de la Monte et al., 1988; Spargo et al., 1993; Shelbourne et al., 2007). Due to the anatomical complexity of this region and increased knowledge about its structure, chemoarchitecture, and connections, several schemes to subdivide the region have been introduced together with different nomenclatures (see e.g., Witter and Amaral, 2004; Andersen et al., 2007; Bota and Swanson, 2010). The complexity increases over time, since anatomical and functional definitions of the rat hippocampal and parahippocampal regions and their subdivisions require more and more detailed descriptions, in view of for example complex functional gradients and increased usage in different ages of the experimental animals (Petrovich et al., 2001; Hafting et al., 2005; Kjelstrup et al., 2008; Bast et al., 2009; van Strien et al., 2009; Boccara et al., 2010; Langston et al., 2010). Overall, this poses a challenge for communicating information about location in the region. Hence, comparison of results across different studies, as well as analysis and planning of experiments require access to updated, detailed, and accurate definitions of the hippocampal subdivisions.
To aid the identification of subdivisions and boundaries of the rat hippocampal region, several different atlases and textbooks are currently available. The most commonly used atlases of the rodent brain provide annotated two-dimensional diagrams with boundaries and names of areas and regions, but with limited information about the criteria used to set the boundaries (Swanson, 2004; Paxinos and Watson, 2007). Textbooks and articles may provide more in-depth information on criteria used to subdivide the region, including cyto- and chemoarchitectonic features, but typically provide fewer illustrations (Witter and Amaral, 2004; Andersen et al., 2007). In addition, several web-based atlas resources, both two- and three-dimensional, have been initiated, providing valuable additions to the conventional atlases (Bai et al., 2006; Hjornevik et al., 2007; Lein et al., 2007; Jones et al., 2009). To our knowledge, however, none of the currently available atlases provide precise descriptions of subdivisions and boundaries combined with an extensive visualization of the whole region at a microscopical level.
To amend this, we have developed an online atlas application, referred to as the Rat Hippocampus Atlas, providing integrated access to detailed anatomical definitions of hippocampal structures and boundaries and a comprehensive histological atlas in which the region has been subdivided according to the same criteria (Figure 1). The combined framework of text and images allows researchers to easily look up the criteria needed to identify hippocampal boundaries and subdivisions in their own histological material. High-resolution images of coronal histological sections stained for NeuN, calbindin, and parvalbumin are presented through an interactive viewer. The selected staining methods are established markers of borders in the hippocampal region (Celio, 1990; Mullen et al., 1992; Wouterlood et al., 1995; Freund and Buzsáki, 1996).
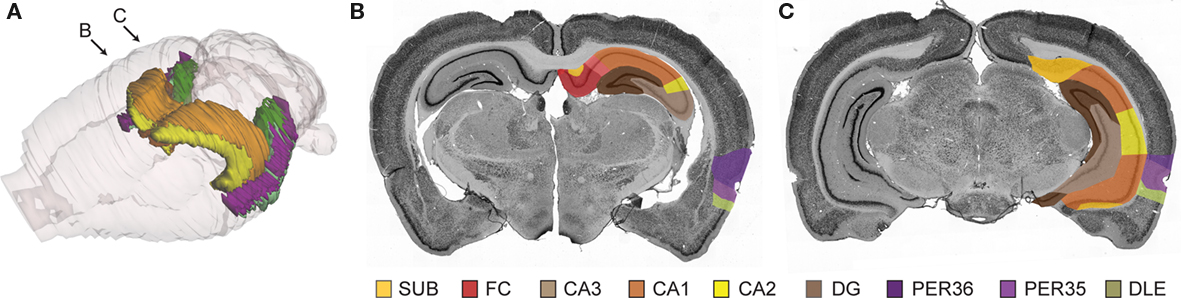
Figure 1. The hippocampal region in 3-D and examples of atlas images from the Rat Hippocampal Atlas. (A) 3-D reconstruction showing color-coded surface representations of hippocampal structures (based on the atlas presented in Hjornevik et al., 2007). Arrows indicate locations of images shown in B and C. (B,C) Atlas images of NeuN stained sections with graphical overlay showing color-coded segmentation of the hippocampal region, as presented in the Rat Hippocampal Atlas.
In this paper, we describe the architecture of the online system, as well as the content and functionality, and examples of use. The system is prepared for future additions of more data and alternative parcellation schemes with boundary definitions. In conjunction with the present report, we release version 1.1 of the Rat Hippocampus Atlas available through a web portal for atlases and tools, the Rodent Brain Workbench1.
Histological Material
The present version of the Rat Hippocampus Atlas (version 1.1) contains histological material from an adult male Long–Evans rat (Harlan, UK, 3 months of age, 350 gram body weight). Experimental procedures were locally approved at the Norwegian University of Science and Technology (NTNU) and the VU University Medical Center (VUmc) and were in compliance with National Institute of Health and European Community guidelines for the use and care of laboratory animals. In brief, the rat was deeply anesthetized by sodium pentobarbital (50 mg/kg body weight) and transcardially perfused with 200 ml saline (38°C), followed by 300 ml of 4% freshly prepared paraformaldehyde in 0.1 M phosphate buffer (pH 7.4). The brain was removed and 30 μm thick sections cut in the coronal plane using a cryostat. All sections were collected in six equally spaced series, three of which were immunostained for NeuN, parvalbumin, and calbindin, respectively. All sections were rinsed three times for 10 min in 125 nM phosphate buffer (pH 7.4) and preincubated for 1.5 h in 5% normal goat serum in a solution of 50 mM Tris, 0.87% sodium chloride, and 0.5% Triton X-100 (TBS-TX). All rinses in between incubation steps were with TBS-TX. Subsequent to rinsing, individual series of sections were incubated with monoclonal mouse primary antibodies against parvalbumin (Sigma-Aldrich P3088, 1:2000 in TBS-TX) or against calbindin D-28K (Swant, 1:4000 in TBS-TX), or against NeuN (Chemicon, 1:1000) for 24–48 h at 4°C. After rinsing, sections were incubated in a secondary goat anti mouse antibody coupled to biotin (Sigma-Aldrich B7151, 1:100 in TBS-TX for 90 min at room temperature), followed by an incubation with the Vector ABC kit according to specifications of the manufacturer (Vector Laboratories Inc., Peroxidase standard PK-Vectastain ABC kit 400). For visualization, sections were rinsed in Tris/HCl solution and subsequently reacted with diaminobenzidine (Wouterlood et al., 1995). Sections were mounted on glass slides from a 0.2% gelatin solution and dried. Sections on slides were dehydrated through increasing concentrations of ethanol to xylene and coverslipped with Entellan (Merck, Darmstadt, Germany).
Image Acquisition
High-resolution digital images of the stained sections were obtained using an automated Olympus BX52 microscope equipped with a 20× objective (Olympus Uplan Apo, NA 0.70), a motorized stage (LEP MAC5000, LUDL Electronic Products Ltd, Hawthorne, NY, USA), an Optronics MicroFire digital camera (Optronics Goleta, CA, USA), and Neurolucida 7.0 Virtual Slice software (MBF Bioscience, Inc, Williston, VT, USA). A total of 104 TIFF images, each image ∼1.5 GB with a resolution of 1.4 pixels/μm, were acquired. The TIFF-images were cropped, rotated and adjusted manually, and centered in a pre-defined canvas area using Adobe Photoshop CS3 (Adobe Systems Inc., San Jose, CA, USA). Low-resolution JPEG thumbnail and preview images were exported from Photoshop. The processed TIFF images were converted to a Zoomify PFF-format using the Zoomify Enterprise software (Zoomify Inc., Santa Cruz, CA, USA). The acquired PFF- and JPEG-images were uploaded to the database of the Rat Hippocampus Atlas and presented through the online application, as outlined below.
Application Architecture
The web application uses a three-layered architecture comprising a data storage layer, a middle layer, and a presentation layer (Figure 2). The data storage layer has the same foundation as that used in our previous applications based on the Oracle relational database management system (Bjaalie et al., 2005; Boy et al., 2006; Moene et al., 2007; Holmseth et al., 2009; Odeh et al., 2011). In the present application, the primary input data are the images of the histological sections throughout the hippocampal region, organized according to spatial coordinates. The fundamental entities of the atlas framework are represented as tables in the database. The middle layer contains rules for preparing data from the data storage layer for display in the presentation layer. The presentation layer provides three user interfaces for the atlas: an image viewer functioning as a virtual microscope, an index of structures with definitions of subdivisions and boundaries, and supplementary data. The image viewer displays the images of histological sections with an annotation layer as a graphical overlay superimposed on each NeuN-image. All graphical user interface (GUI) pages, including the supplementary data, are generated as dynamic html pages.
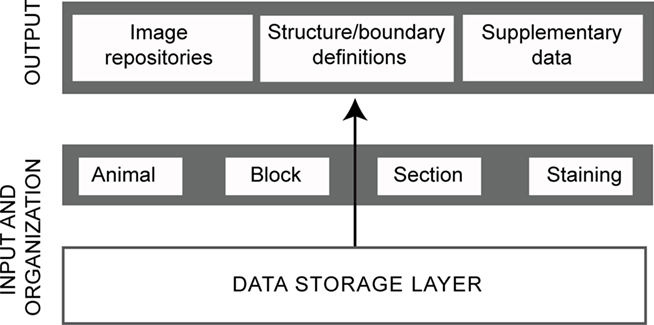
Figure 2. Overview of database architecture. The diagram shows the logical three-layer architecture employed for the database application with main entities indicated. The data storage layer consists of the actual database holding persistent data and tables. The middle layer provides process management necessary for display of data in the presentation layer. The presentation layer (top) provides the user interfaces for the three atlas entities.
Graphical User Interface
The GUI was constructed using JSP and Struts (a Model-View-Controller implementation) and Flash/Actionscript within an Oracle JDeveloper (Oracle Corporation, Redwood Shores, CA, USA) Integrated Development Environment (IDE). The virtual microscopy viewer tool used in the image viewer is customized from the Zoomify Enterprise application (Zoomify Inc., Santa Cruz, CA, USA) using Flash (Macromedia, Inc., San Francisco, CA, USA). The graphical overlay of the NeuN images was drawn using the Zoomify Enterprise application. Each area was delineated by closed contours (Figure 3) and color-coded in correspondence with a previously published connectional database of the same region (van Strien et al., 2009). The GUI was tested and reviewed at different stages of the project and will be further developed on the basis of interactions with users.
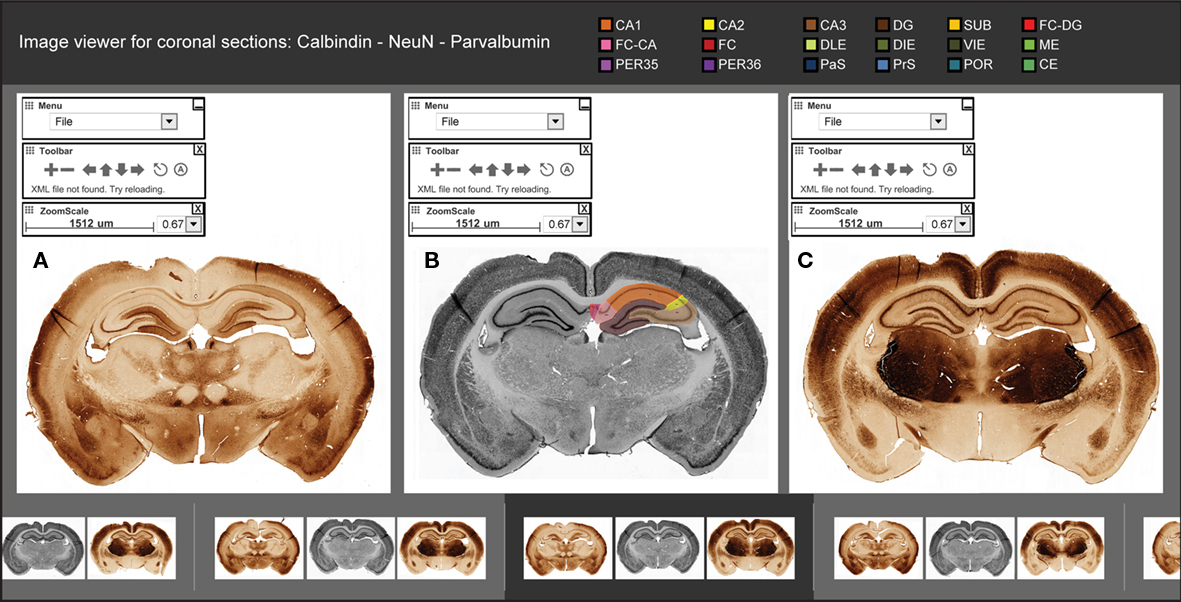
Figure 3. Graphical user interface of the atlas image viewer. The image viewer consists of three viewer panels (A–C), a row of thumbnail images for selecting levels (bottom row), and color-coded links to relevant structure and boundary descriptions (top row). Each of the viewer panels has navigation tools for interactive inspection of triplet images stained for calbindin (A), NeuN (B), and parvalbumin (C). Anatomical segmentations are provided as a color-coded graphical overlay on one side of the NeuN stained sections (B). The graphical overlay can be rendered active (visible) or deactive. Images can be individually zoomed and panned in each viewer panel, or synchronized to corresponding positional and zoom scale values facilitate comparison across the viewer panels.
Main Content of the Atlas
We here describe the main content of the three parts of the atlas: the index of structures, the image viewer, and the supplementary pages. The index of structures currently holds 18 structures with 63 corresponding boundaries. It contains precise descriptions of subdivisions and boundaries based on features visible in the NeuN, parvalbumin, and calbindin stained sections. The criteria used to parcel the region are defined in accordance with previously published accounts (Insausti et al., 1997; Burwell, 2001; Naber et al., 2001; Witter and Amaral, 2004), complemented with new observations, e.g., for the pre- and parasubiculum (summarized in Boccara et al., 2010). The text is supplied with illustrations and references, and each structure and boundary description is directly linked to relevant parts of the image repository. Links to the NIF Navigator system (provided by the Neuroscience Information Framework2), allow users to compare definitions with other relevant parcellation schemes.
The image viewer gives access to high-resolution images of 104 coronal sections (Figure 3). The sections are organized according to serial numbers and stereotaxic coordinate values (bregma level) taken from a commonly used stereotaxic atlas (Paxinos and Watson, 2007). Anatomical landmarks are used to assign coordinate values to each section. The images are organized in triplets of sections stained for NeuN, parvalbumin, and calbindin. Some of the images of the parvalbumin stained sections were fragmented and thus not suitable for visualization in the image viewer. (The section fragments were nevertheless of sufficient quality for defining structure and boundary definitions.) The NeuN sections reveal cytoarchitectonic features, whereas the accompanying sections showing the distribution of the two calcium binding proteins, parvalbumin and calbindin, demonstrate complementary chemoarchitectonic features. Taken together, the image triplets clearly reveal the boundaries between all subdivisions of the rat hippocampal region. Each image can be zoomed and panned, and the individual viewing panels for each of the images in the image triplet can be synchronized to facilitate comparison of the features shown with the different staining methods. Navigation to pre-defined places of interest is provided. Each NeuN-image has a superimposed layer showing color-coded graphically segmented overlays for each subdivision. Links to relevant structure and boundary descriptions are provided.
The supplementary pages include a reference list and a tutorial for user interaction.
Atlas Functionality and User Interactions
To analyze the hippocampal region and assign locations to a given experimental material with use of the Rat Hippocampus Atlas, users can navigate through the image viewer, either by looking up sections at specific bregma coordinate levels, or by browsing the spatially ordered images to identify relevant levels (Figure 4). To explore a given structure or boundary, users may also choose to navigate through the index of structures, using either the alphabetical structure list, or the hierarchical list which is based on a defined ontology of the rat hippocampal region. The two entry points create a versatile bi-directionally linked atlas system, in which images and text are integrated.
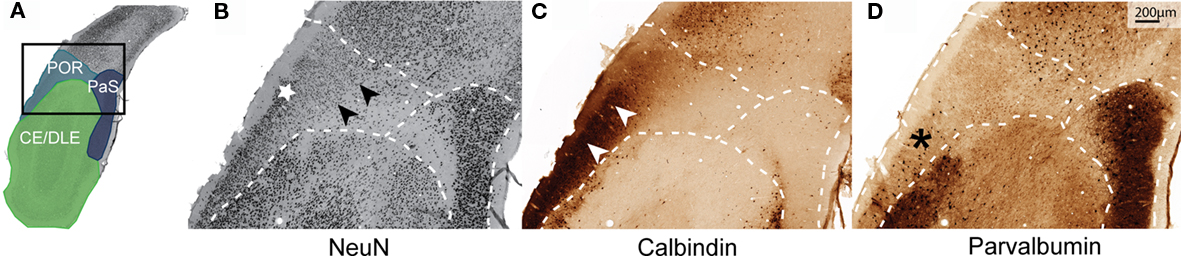
Figure 4. Example of use: delineation of the postrhinal cortex. Illustration of how the atlas application can be used to identify the complex boundaries of the postrhinal cortex in relation to those of the parasubiculum in a posterior coronal section. (A) Overview image of a coronal NeuN stained section from the posterior cortex, with a graphical overlay showing the boundaries of the tangentially cut postrhinal cortex and surrounding subregions. (B) Magnification of a part of (A), at position indicated by the frame, showing the anatomical boundaries (dotted lines) in relation to the underlying cytoarchitecture. (C,D) Images from positions corresponding to (B) in neighboring sections stained for calbindin (C) and parvalbumin (D). The postrhinal cortex is characterized by absence of a lamina dissecans (black arrowheads in B), presence of homogeneously packed, small, and lightly stained neurons in layers II–III, with layer II cells having a somewhat clustered appearance with an irregular border with layer I (white star in B), presence of calbindin positive cells and neuropil in superficial layers (white arrowheads in C), and relatively weak staining for parvalbumin (asterisk in D). Scale bar, 200 μm.
As an example on how this property of the atlas is instrumental for preparing and documenting an experiment, we will address the positioning and interpretation of data from the postrhinal cortex, using coronal sections. There are several pitfalls in performing this task, since a substantial part of the postrhinal cortex is presented in a limited number of posteriorly positioned coronal sections. Thus, in these sections, the postrhinal cortex is cut almost tangential to its surface, and since the same holds true for the medially adjacent parasubiculum and the ventrally adjacent medial entorhinal cortex, differentiation of these subregions is difficult without use of explicit morphological criteria. The semantic-based index of structures of the present atlas system provides a rapid overview of descriptive data of the postrhinal cortex and relevant boundary definitions. The distinguishing features of the postrhinal cortex, which are absence of a lamina dissecans, presence of homogeneously packed, small and lightly stained neurons in layers II–III, a clustered appearance of layer II cells with an irregular border with layer I, and presence of calbindin positive cells and neuropil in superficial layers (Figure 4), can be looked up in the corresponding sections, displayed in the image viewer. The striking differences between the architectonic features of the postrhinal cortex in comparison to the adjacent parasubiculum, entorhinal cortex, and the dorsally adjacent visual cortex are easily identified in the images. Several examples of use of the atlas material for assigning location to experimental data in these regions are provided by Kjelstrup et al. (2008) and Boccara et al. (2010).
Discussion
We have presented the Rat Hippocampus Atlas, a web-based atlas application containing an index of the structures of the hippocampal region and an image viewer demonstrating cyto- and chemoarchitectonic boundaries in histological sections. Textual descriptions and annotated images of histological sections are linked, providing an integrated presentation of the criteria used to parcel the hippocampal region. The system is prepared for continuous updating of the information provided. As an online service for the community, it represents a supplement to digital atlas resources in general (Bjaalie, 2002; Hawrylycz et al., 2009) and a foundation for hippocampal research in particular.
The atlas system makes use of an existing framework based on Oracle technology (Bjaalie et al., 2005; Moene et al., 2007) and a Zoomify-based viewer system (Boy et al., 2006). This choice of technology ensured robust, well-established solutions with sufficient flexibility to implement customized specifications and functions. The system is prepared to accommodate additional histological material with different spatial orientations. A flexible atlas resource is particularly relevant in context of ongoing functional (Boccara et al., 2010) and gene-expression studies (Lein et al., 2004, 2005; Thompson et al., 2008) which expectedly will elucidate new aspects of the structural and functional subdivisions of the hippocampus.
A variety of histochemical and immunocytochemical staining methods have traditionally been used to assist the delineations of the hippocampal subregions. The methods include Timm stain for heavy metals (Haug, 1976; Naber, 1999; Burwell, 2001; Naber et al., 2001), staining for acetyl cholinesterase (Storm-Mathisen and Blackstad, 1964; Naber, 1999; Naber et al., 2001) as well as different stains for myelin (Witter et al., 1989). The boundary descriptions of the present atlas, however, builds on three well-established markers for parcellation of the region: NeuN, parvalbumin, and calbindin (Celio, 1990; Mullen et al., 1992; Wouterlood et al., 1995; Freund and Buzsáki, 1996). The current descriptions are in accordance with recent studies and include the first clear definition of the deep layers of the pre- and parasubiculum (Boccara et al., 2010). A more extensive description of the subdivisions of the hippocampal region, including also horizontal and sagittal sections (in addition to coronal sections) as well as supplemental staining methods, will be published separately.
All definitions in the current atlas resource have been corroborated also in horizontal and sagittal sections (Boccara et al., 2010), which will be added to the image repository. Other possible directions for further development of the atlas include implementation of a three-dimensional reference framework and inclusion of other data modalities, such as diffusion based magnetic resonance imaging data. A suite of tools and systems relevant for brain atlasing are currently being developed, including lexical systems for ontologies (Gardner et al., 2008), spatial reference frameworks (Hawrylycz et al., 2009; Johnson et al., 2010), tools for 3-D brain atlasing (Hjornevik et al., 2007; see, also the Brain Navigator System3), and digital atlases with specific content of experimental data (Boy et al., 2006; Bohland et al., 2009; Holmseth et al., 2009; Zakiewicz et al., 2009; Odeh et al., 2011). Other digital brain atlas systems include variable amounts of anatomical specifications of the hippocampus, but not detailed anatomical criteria used to determine boundaries (MacKenzie-Graham et al., 2004; Ma et al., 2005; Ma et al., 2008; Jones et al., 2009).
Further development of the Rat Hippocampus Atlas system and other similar systems will expectedly benefit from coordination with other initiatives, in particular Waxholm space (WHS) and the Neuroscience Information Framework. At the level of a common coordinate-based reference space for mapping and registration of neuroanatomical data to the rodent brain, WHS (Hawrylycz et al., 2009; Johnson et al., 2010) is likely to contribute to increased interoperability among atlas systems. WHS is already incorporated into existing atlasing tools such as the Scalable Brain Atlas (Bakker et al., 2010), Whole Brain Catalog (Larson et al., 2010) and the Mouse BIRN Atlasing Toolkit4. With future use of WHS as a standard for mapping of spatial information in the brain, the present atlas system could be made interoperable with other shared resources and be more readily accessible for use of shared tools for registration of experimental data to standardized atlas space followed by data analysis. At the level of nomenclature and ontology for neuroscience in general, The Neuroscience Information Framework (NIF) initiative seeks to address inconsistencies by providing a common information framework and linking information to atlas resources (Gardner et al., 2008). Taken together, these efforts suggest an increasing future capability to navigate the information domain, assign location to data in the brain, and efficiently exchange information. Several of the atlas initiatives in the field of neuroinformatics thus have the potential of being linked together and integrated, paving the way for more powerful and efficient structure-function analysis of the nervous system.
Conflict of Interest Statement
The authors declare that the research was conducted in the absence of any commercial or financial relationships that could be construed as a potential conflict of interest.
Acknowledgments
We thank the NeSys neuroinformatics development team (Ivar A. Moene, Dmitri A. Darine, and Muthuraja Ramachandran) for the establishment and maintenance of infrastructure and tools underlying the atlas application, Ingvild Hammer and Kyrre Haugen for expert technical assistance with histological processing and Ylva Lillberg for helpful comments regarding usability testing. Financial support was provided by the University of Oslo, the Research Council of Norway (STORFORSK to Jan G. Bjaalie, equipment grants to Menno P. Witter) and the Norwegian Node of the International Neuroinformatics Coordinating Facility (INCF).
Footnotes
References
Andersen, P., Morris, R., Amaral, D., Bliss, T., and O’Keefe, J. (2007). The Hippocampus Book. Oxford: Oxford University Press.
Bai, X., Yu, L., Liu, Q., Zhang, J., Li, A., Han, D., Luo, Q., and Gong, H. (2006). A high-resolution anatomical rat atlas. J. Anat. 209, 707–708.
Bakker, R., Larson, S. D., Strobelt, S., Hess, A., Wòjcik, D., Majka, P., and Kötter, R. (2010). Scalable brain atlas: from stereotaxic coordinate to delineated brain region. Front. Neurosci. Conference Abstract: Neuroinformatics 2010. doi: 10.3389/conf.fnins.2010.13.00028
Bast, T., Wilson, I. A., Witter, M. P., and Morris, R. G. (2009). From rapid place learning to behavioral performance: a key role for the intermediate hippocampus. PLoS Biol. 7, e1000089. doi: 10.1371/journal.pbio.1000089
Bjaalie, J. G. (2002). Localization in the brain: new solutions emerging. Nat. Rev. Neurosci. 3, 322–325.
Bjaalie, J. G., Leergaard, T. B., Lillehaug, S., Odeh, F., Moene, I. A., Kjode, J. O., and Darin, D. (2005). Database and tools for analysis of topographic organization and map transformations in major projection systems of the brain. Neuroscience 136, 681–695.
Boccara, C. N., Sargolini, F., Thoresen, V. H., Solstad, T., Witter, M. P., Moser, E. I., and Moser, M. B. (2010). Grid cells in pre- and parasubiculum. Nat. Neurosci. 13, 987–994.
Bohland, J. W., Wu, C., Barbas, H., Bokil, H., Bota, M., Breiter, H. C., Cline, H. T., Doyle, J. C., Freed, P. J., Greenspan, R. J., Haber, S. N., Hawrylycz, M., Herrera, D. G., Hilgetag, C. C., Huang, Z. J., Jones, A., Jones, E. G., Karten, H. J., Kleinfeld, D., Kötter, R., Lester, H. A., Lin, J. M., Mensh, B. D., Mikula, S., Panksepp, J., Price, J. L., Safdieh, J., Saper, C. B., Schiff, N. D., Schmahmann, J. D., Stillman, B. W., Svoboda, K., Swanson, L. W., Toga, A. W., Van Essen, D. C., Watson, J. D., and Mitra, P. P. (2009). A proposal for a coordinated effort for the determination of brainwide neuroanatomical connectivity in model organisms at a mesoscopic scale. PLoS Comput. Biol. 5, e1000334. doi: 10.1371/journal.pcbi.1000334
Bota, M., and Swanson, L. W. (2010). Collating and curating neuroanatomical nomenclatures: principles and use of the Brain Architecture Knowledge Management System (BAMS). Front. Neuroinform. 4:3. doi: 10.3389/fninf.2010.00003
Boy, J., Leergaard, T. B., Schmidt, T., Odeh, F., Bichelmeier, U., Nuber, S., Holzmann, C., Wree, A., Prusiner, S. B., Bujard, H., Riess, O., and Bjaalie, J. G. (2006). Expression mapping of tetracycline-responsive prion protein promoter: digital atlasing for generating cell-specific disease models. Neuroimage 33, 449–462.
Burwell, R. D. (2001). Borders and cytoarchitecture of the perirhinal and postrhinal cortices in the rat. J. Comp. Neurol. 437, 17–41.
Celio, M. R. (1990). Calbindin D-28k and parvalbumin in the rat nervous system. Neuroscience 35, 375–475.
de la Monte, S. M., Vonsattel, J. P., and Richardson, E. P. Jr. (1988). Morphometric demonstration of atrophic changes in the cerebral cortex, white matter, and neostriatum in Huntington’s disease. J. Neuropathol. Exp. Neurol. 47, 516–525.
Deshmukh, S. S., Yoganarasimha, D., Voicu, H., and Knierim, J. J. (2010). Theta modulation in the medial and the lateral entorhinal cortices. J. Neurophysiol. 104, 994–1006.
Gardner, D., Akil, H., Ascoli, G. A., Bowden, D. M., Bug, W., Donohue, D. E., Goldberg, D. H., Grafstein, B., Grethe, J. S., Gupta, A., Halavi, M., Kennedy, D. N., Marenco, L., Martone, M. E., Miller, P. L., Müller, H. M., Robert, A., Shepherd, G. M., Sternberg, P. W., Van Essen, D. C., and Williams, R. W. (2008). The neuroscience information framework: a data and knowledge environment for neuroscience. Neuroinformatics 6, 149–160.
Hafting, T., Fyhn, M., Molden, S., Moser, M. B., and Moser, E. I. (2005). Microstructure of a spatial map in the entorhinal cortex. Nature 436, 801–806.
Hawrylycz, M., Boline, J., Burger, A., Hashikawa, T., Johnson, G. A., Martone, M., Ng, L., Nissanov, J., Puelles, L., Ruffins, S., Verbeek, F., and Zaslavsky, I. (2009). The INCF Digital Atlasing Program: Report on Digital Atlasing Standards in the Rodent Brain. Nature Precedings, doi: 10.1038/npre.2009.4000.1
Hawrylycz, M., Boline, J., Burger, A., Hashikawa, T., Johnson, G. A., Martone, M., Ng, L., Nissanov, J., Puelles, L., Ruffins, S., Verbeek, F., and Zaslavsky, I. (2009). The INCF Digital Atlasing Program: Report on Digital Atlasing Standards in the Rodent Brain.
Hjornevik, T., Leergaard, T. B., Darine, D., Moldestad, O., Dale, A. M., Willoch, F., and Bjaalie, J. G. (2007). Three-dimensional atlas system for mouse and rat brain imaging data. Front. Neuroinformatics 1:4. doi: 10.3389/neuro.11/004.2007
Holmseth, S., Scott, H. A., Real, K., Lehre, K. P., Leergaard, T. B., Bjaalie, J. G., and Danbolt, N. C. (2009). The concentrations and distributions of three C-terminal variants of the Glt1 (Eaat2; Slc1A2) glutamate transporter protein in rat brain tissue suggest differential regulation. Neuroscience 162, 1055–1071.
Insausti, R., Herrero, M. T., and Witter, M. P. (1997). Entorhinal cortex of the rat: cytoarchitectonic subdivisions and the origin and distribution of cortical efferents. Hippocampus 7, 146–183.
Johnson, G. A., Badea, A., Brandenburg, J., Cofer, G., Fubara, B., Liu, S., and Nissanov, J. (2010). Waxholm space: an image-based reference for coordinating mouse brain research. Neuroimage 53, 365–372.
Jones, A. R., Overly, C. C., and Sunkin, S. M. (2009). The Allen Brain Atlas: 5 years and beyond. Nat. Rev. Neurosci. 10, 821–828.
Kesner, R. P., and Hopkins, R. O. (2006). Mnemonic functions of the hippocampus: a comparison between animals and humans. Biol. Psychol. 73, 3–18.
Kjelstrup, K. B., Solstad, T., Brun, V. H., Hafting, T., Leutgeb, S., Witter, M. P., Moser, E. I., and Moser, M. B. (2008). Finite scale of spatial representation in the hippocampus. Science 321, 140–143.
Langston, R. F., Ainge, J. A., Couey, J. J., Canto, C. B., Bjerknes, T. L., Witter, M. P., Moser, E. I., and Moser, M. B. (2010). Development of the spatial representation system in the rat. Science 328, 1576–1580.
Larson, S. D., Aprea, C., Martinez, J., Little, D., Astakhov, V., Kim, H. S., Zaslavsky, I., Martone, M., and Ellisman, M. (2010). An open Google Earth for neuroinformatics: the Whole Brain Catalog. Front. Neurosci. Conference Abstract: Neuroinformatics 2010. doi: 10.3389/conf.fnins.2010.13.00137.
Lein, E. S., Callaway, E. M., Albright, T. D., and Gage, F. H. (2005). Redefining the boundaries of the hippocampal CA2 subfield in the mouse using gene expression and 3-dimensional reconstruction. J. Comp. Neurol. 485, 1–10.
Lein, E. S., Hawrylycz, M. J, Ao, N., Ayres, M., Bensinger, A., Bernard, A., Boe, A. F., Boguski, M. S., Brockway, K. S., Byrnes, E. J., Chen, L., Chen, L., Chen, T. M., Chin, M. C., Chong, J., Crook, B. E., Czaplinska, A., Dang, C. N., Datta, S., Dee, N. R., Desaki, A. L., Desta, T., Diep, E., Dolbeare, T. A., Donelan, M. J., Dong, H. W., Dougherty, J. G., Duncan, B. J., Ebbert, A. J., Eichele, G., Estin, L. K., Faber, C., Facer, B. A., Fields, R., Fischer, S. R., Fliss, T. P., Frensley, C., Gates, S. N., Glattfelder, K. J., Halverson, K. R., Hart, M. R., Hohmann, J. G., Howell, M. P., Jeung, D. P., Johnson, R. A., Karr, P. T., Kawal, R., Kidney, J. M., Knapik, R. H., Kuan, C. L., Lake, J. H., Laramee, A. R., Larsen, K. D., Lau, C., Lemon, T. A., Liang, A. J., Liu, Y., Luong, L. T., Michaels, J., Morgan, J. J., Morgan, R. J., Mortrud, M. T., Mosqueda, N. F., Ng, L. L., Ng, R., Orta, G. J., Overly, C. C., Pak, T. H., Parry, S. E., Pathak, S. D., Pearson, O. C., Puchalski, R. B., Riley, Z. L., Rockett, H. R., Rowland, S. A., Royall, J. J., Ruiz, M. J., Sarno, N. R., Schaffnit, K., Shapovalova, N. V., Sivisay, T., Slaughterbeck, C. R., Smith, S. C., Smith, K. A., Smith, B. I., Sodt, A. J., Stewart, N. N., Stumpf, K. R., Sunkin, S. M., Sutram, M., Tam, A., Teemer, C. D., Thaller, C., Thompson, C. L., Varnam, L. R., Visel, A., Whitlock, R. M., Wohnoutka, P. E., Wolkey, C. K., Wong, V. Y., Wood, M., Yaylaoglu, M. B., Young, R. C., Youngstrom, B. L., Yuan, X. F., Zhang, B., Zwingman, T. A., and Jones, A. R. (2007). Genome-wide atlas of gene expression in the adult mouse brain. Nature 445, 168–176.
Lein, E. S., Zhao, X., and Gage, F. H. (2004). Defining a molecular atlas of the hippocampus using DNA microarrays and high-throughput in situ hybridization. J. Neurosci. 24, 3879–3889.
Ma, Y., Hof, P. R., Grant, S. C., Blackband, S. J., Bennett, R., Slatest, L., McGuigan, M. D., and Benveniste, H. (2005). A three-dimensional digital atlas database of the adult C57BL/6J mouse brain by magnetic resonance microscopy. Neuroscience 135, 1203–1215.
Ma, Y., Smith, D., Hof, P. R., Foerster, B., Hamilton, S., Blackband, S. J., Yu, M., and Benveniste, H. (2008). In vivo 3D digital atlas database of the adult C57BL/6J mouse brain by magnetic resonance microscopy. Front. Neuroanat. 2:1. doi: 10.3389/neuro.05.001.2008
MacKenzie-Graham, A., Lee, E. F., Dinov, I. D., Bota, M., Shattuck, D. W., Ruffins, S., Yuan, H., Konstantinidis, F., Pitiot, A., Ding, Y., Hu, G., Jacobs, R. E., and Toga, A. W. (2004). A multimodal, multidimensional atlas of the C57BL/6J mouse brain. J. Anat. 204, 93–102.
Manns, J. R., and Eichenbaum, H. (2009). A cognitive map for object memory in the hippocampus. Learn. Mem. 16, 616–624.
Moene, I. A., Subramaniam, S., Darin, D., Leergaard, T. B., and Bjaalie, J. G. (2007). Toward a workbench for rodent brain image data: systems architecture and design. Neuroinformatics 5, 35–58.
Mullen, R. J., Buck, C. R., and Smith, A. M. (1992). NeuN, a neuronal specific nuclear protein in vertebrates. Development 116, 201–211.
Naber, P. A. (1999). The Hippocampal Memory System. Functional Analysis of Parallel Pathways Through the Subiculum. Thesis VU University Amsterdam, Netherlands.
Naber, P. A., Witter, M. P., and Lopes da Silva, F. H. (2001). Evidence for a direct projection from the postrhinal cortex to the subiculum in the rat. Hippocampus 11, 105–117.
Odeh, F., Leergaard, T. B., Boy, J., Schmidt, T., Riess, O., and Bjaalie, J. G. (2011). Atlas of transgenic Tet-Off Ca2+/calmodulin-dependent protein kinase II and prion protein promoter activity in the mouse brain. Neuroimage 54, 2603–2611.
Paxinos, G., and Watson, C. (2007). The Rat Brain in Stereotaxic Coordinates. Amsterdam: Elsevier/AP.
Petrovich, G. D., Canteras, N. S., and Swanson, L. W. (2001). Combinatorial amygdalar inputs to hippocampal domains and hypothalamic behavior systems. Brain Res. Brain Res. Rev. 38, 247–289.
Shelbourne, P., Coote, E., Dadak, S., and Cobb, S. R. (2007). Normal electrical properties of hippocampal neurons modelling early Huntington disease pathogenesis. Brain Res. 1139, 226–234.
Spargo, E., Everall, I. P., and Lantos, P. L. (1993). Neuronal loss in the hippocampus in Huntington’s disease: a comparison with HIV infection. J. Neurol. Neurosurg. Psychiatry 56, 487–491.
Storm-Mathisen, J., and Blackstad, T. W. (1964). Cholinesterase in the hippocampal region. Distribution and relation to architectonics and afferent systems. Acta Anat. (Basel) 56, 216–253.
Swanson, L. W. (2004). Brain Maps III Structure of the Rat Brain: An Atlas with Printed and Electronic Templates for Data, Models, and Schematics. Amsterdam: Elsevier.
Thompson, C. L., Pathak, S. D., Jeromin, A., Ng, L. L., MacPherson, C. R., Mortrud, M. T., Cusick, A., Riley, Z. L., Sunkin, S. M., Bernard, A., Puchalski, R. B., Gage, F. H., Jones, A. R., Bajic, V. B., Hawrylycz, M. J., and Lein, E. S. (2008). Genomic anatomy of the hippocampus. Neuron 60, 1010–1021.
van Strien, N. M., Cappaert, N. L., and Witter, M. P. (2009). The anatomy of memory: an interactive overview of the parahippocampal–hippocampal network. Nat. Rev. Neurosci. 10, 272–282.
Witter, M. P., and Amaral, D. G. (2004). “Hippocampal formation,” in The Rat Nervous System, ed. G. Paxinos (Amsterdam: Elsevier), 637–703.
Witter, M. P., Groenewegen, H. J., Lopes da Silva, F. H., and Lohman, A. H. (1989). Functional organization of the extrinsic and intrinsic circuitry of the parahippocampal region. Prog. Neurobiol. 33, 161–253.
Wouterlood, F. G., Härtig, W., Brückner, G., and Witter, M. P. (1995). Parvalbumin-immunoreactive neurons in the entorhinal cortex of the rat: localization, morphology, connectivity and ultrastructure. J. Neurocytol. 24, 135–153.
Keywords: anatomy, digital brain atlas, hippocampus, immunohistochemistry, parahippocampus, rat, segmentation, histology
Citation: Kjonigsen LJ, Leergaard TB, Witter MP and Bjaalie JG (2011) Digital atlas of anatomical subdivisions and boundaries of the rat hippocampal region. Front. Neuroinform. 5:2. doi: 10.3389/fninf.2011.00002
Received: 11 November 2010; Paper pending published: 18 December 2010;
Accepted: 26 March 2011; Published online: 08 April 2011.
Edited by:
Maryann E. Martone, University of California at San Diego, USAReviewed by:
Mihail Bota, University of Southern California, USAFons J. Verbeek, Leiden University, Netherlands
Seth Ruffins, California Institute of Technology, USA
Copyright: © 2011 Kjonigsen, Leergaard, Witter and Bjaalie. This is an open-access article subject to a non-exclusive license between the authors and Frontiers Media SA, which permits use, distribution and reproduction in other forums, provided the original authors and source are credited and other Frontiers conditions are complied with.
*Correspondence: Jan G. Bjaalie, Centre for Molecular Biology and Neuroscience, Institute of Basic Medical Sciences, University of Oslo, P.O. Box 1105 Blindern, N-0317 Oslo, Norway. e-mail: j.g.bjaalie@medisin.uio.no