Potential synaptic connectivity of different neurons onto pyramidal cells in a 3D reconstruction of the rat hippocampus
- 1 Center for Neural Informatics, Structures and Plasticity, Krasnow Institute for Advanced Study, George Mason University, Fairfax, VA, USA
- 2 Molecular Neuroscience Department, Krasnow Institute for Advanced Study, George Mason University, Fairfax, VA, USA
Most existing connectomic data and ongoing efforts focus either on individual synapses (e.g., with electron microscopy) or on regional connectivity (tract tracing). An individual pyramidal cell (PC) extends thousands of synapses over macroscopic distances (∼cm). The contrasting requirements of high-resolution and large field of view make it too challenging to acquire the entire synaptic connectivity for even a single typical cortical neuron. Light microscopy can image whole neuronal arbors and resolve dendritic branches. Analyzing connectivity in terms of close spatial appositions between axons and dendrites could thus bridge the opposite scales, from synaptic level to whole systems. In the mammalian cortex, structural plasticity of spines and boutons makes these “potential synapses” functionally relevant to learning capability and memory capacity. To date, however, potential synapses have only been mapped in the surrounding of a neuron and relative to its local orientation rather than in a system-level anatomical reference. Here we overcome this limitation by estimating the potential connectivity of different neurons embedded into a detailed 3D reconstruction of the rat hippocampus. Axonal and dendritic trees were oriented with respect to hippocampal cytoarchitecture according to longitudinal and transversal curvatures. We report the potential connectivity onto PC dendrites from the axons of a dentate granule cell, three CA3 PCs, one CA2 PC, and 13 CA3b interneurons. The numbers, densities, and distributions of potential synapses were analyzed in each sub-region (e.g., CA3 vs. CA1), layer (e.g., oriens vs. radiatum), and septo-temporal location (e.g., dorsal vs. ventral). The overall ratio between the numbers of actual and potential synapses was ∼0.20 for the granule and CA3 PCs. All potential connectivity patterns are strikingly dependent on the anatomical location of both pre-synaptic and post-synaptic neurons.
Introduction
Mammalian brains have complex network architectures (Sporns, 2010), with each neuron connecting to thousands of others. Connectivity must be characterized at both synaptic and regional levels to advance our knowledge of cognitive and computational functions of nervous systems (Sporns et al., 2005; Buzsaki, 2007). Numerous studies recently explored structural and functional connectivity with different experimental modalities, including non-invasive imaging (Bullmore and Sporns, 2009; Honey et al., 2009; Bressler and Menon, 2010), electrophysiology (Kalisman et al., 2005), light microscopy (Ishizuka et al., 1990; Sik et al., 1993; Li et al., 1994; Wittner et al., 2007), and electron microscopy (Mishchenko et al., 2010). Non-invasive imaging such as DTI allows investigation of the whole human brain, but is only amenable to analyzing regional connectivity. Electron microscopy has complementary strengths and limitations, as it can unambiguously identify all synapses, but only in a narrow region of interest. Unfortunately, neither technique is suitable to acquire the whole synaptic connectivity of a typical cortical neuron. Light microscopy provides an optimal balance of resolution and field of view for this neuronal connectomic level bridging the micro- and macro-scale.
In particular, the connectivity maps of entire neurons can be investigated computationally based on light-level digital reconstructions of axonal and dendritic morphologies in simplified (Amirikian, 2005) or detailed (Stepanyants and Chklovskii, 2005; Escobar et al., 2008; Stepanyants et al., 2008) geometrical representations. In most such studies, putative connectivity is established on the basis of the close proximity between a pair of pre-synaptic (axonal) and post-synaptic (dendritic) segments (Kalisman et al., 2003; Stepanyants et al., 2004). These spatial overlaps have been defined as “potential synapses” because of strong evidence of spine and bouton motility and their essential role for synapse formation and memory consolidation (Lendvai et al., 2000; Chklovskii et al., 2004; Knott et al., 2006). This conceptual framework is appropriate for the mammalian hippocampus, as this region displays structural plasticity throughout adulthood and is clearly involved in learning (Squire and Zola-Morgan, 1991; Eichenbaum and Cohen 2001). To date, however, potential synapses have only been mapped in the surrounding of a neuron and relative to its local orientation rather than in a system-level anatomical reference. This limitation is particularly evident in the hippocampus, because of its peculiarly curved and laminar organization.
The methodology presented here applies an existing mathematical framework to estimate potential synaptic connectivity (Stepanyants and Chklovskii, 2005) to detailed arbor geometries embedded into a 3D reconstruction of the rat hippocampus. The hippocampal model was built by assembling the cyto-architectonic layers segmented from high-resolution histological images of thin cryostatic brain sections, and transforming the resulting space into a volumetric representation with uniformly sized voxels (Ropireddy et al., 2008). A custom-designed computational framework was developed to embed digital neuromorphological reconstructions with respect to the natural hippocampal axes (Ropireddy et al., 2011). The key advantage of this methodological extension is the ability to analyze potential synaptic maps of different neurons within the proper anatomical frame of reference. As the principal neurons of the hippocampus have long-range projections (Tamamaki et al., 1988; Li et al., 1994) forming synapses across different sub-regions and layers, this framework provides a unique opportunity to quantify potential synaptic patterns across the entire hippocampal extent.
The present analysis is based on all publicly available digital reconstructions of hippocampal pyramidal cell (PC) dendrites (Ascoli et al., 2007) and a representative sample of complete 3D axonal tracings. In particular, the pre-synaptic neuronal selection consists of a dentate granule cell (GC), 4 PCs (with somata in proximal CA3c, distal CA3c, CA3b, and CA2, respectively), and 13 CA3b radiatum and lacunosum-moleculare (LM) interneurons. For each case, we analyzed the numbers, densities, and distributions of potential synapses in every sub-region (e.g., CA3 vs. CA1), layer (e.g., oriens vs. radiatum), and septo-temporal location (e.g., dorsal vs. ventral).
Materials and Methods
Previous work described in detail our high-resolution 3D reconstruction of the rat hippocampus from thin histological sections (Ropireddy et al., 2008) and the embedding of digitally traced neuronal morphologies (Ropireddy et al., 2011). Here, we only present a brief overview emphasizing just the procedures that specifically pertain to the present analysis.
Digital 3D Reconstruction of the Rat Hippocampus
A 45-day-old, male, Long–Evans hooded rat (226–237 g; Harlan, Indianapolis, IN, USA) was sacrificed by guillotine and its brain quickly removed and stored air-tight at −80°C. The brain was sectioned coronally at 16 μm in the dorso-ventral direction with a cryostat at −18°C. The 290 sections encompassing the entire hippocampus were mounted on slides and cover-slipped after Nissl staining. Slices were imaged at 3200 dpi with an EPSON scanner and contrast enhanced by the Matlab routine “imcontrast.” The image stack was loaded into “Reconstruct” (Fiala, 2005) with a pixel/μm conversion factor (4.28) accounting for the measured planar shrinkage. Images were initially registered by mid-line guided manual alignment. Seven clearly identifiable cyto-architectonic layers were manually segmented (Figure 1A): hilus, GC, and molecular layer (ML) in the dentate gyrus (DG); and oriens (OR), PC, radiatum (RAD), and LM layers in CA3 and CA1. Serial tracing produced sets of pixels representing layer contours as closed polygons. All locations inside the boundaries of a given layer were identified by triangulation, extending a previous algorithm to yield 3D voxels from neighboring slices. Cubic voxels were thus defined with side corresponding to the inter-slice distance (16 μm). The initial registration was refined by iterative three-point average of the centroids through the longest hippocampal axis until reaching geometric convexity.
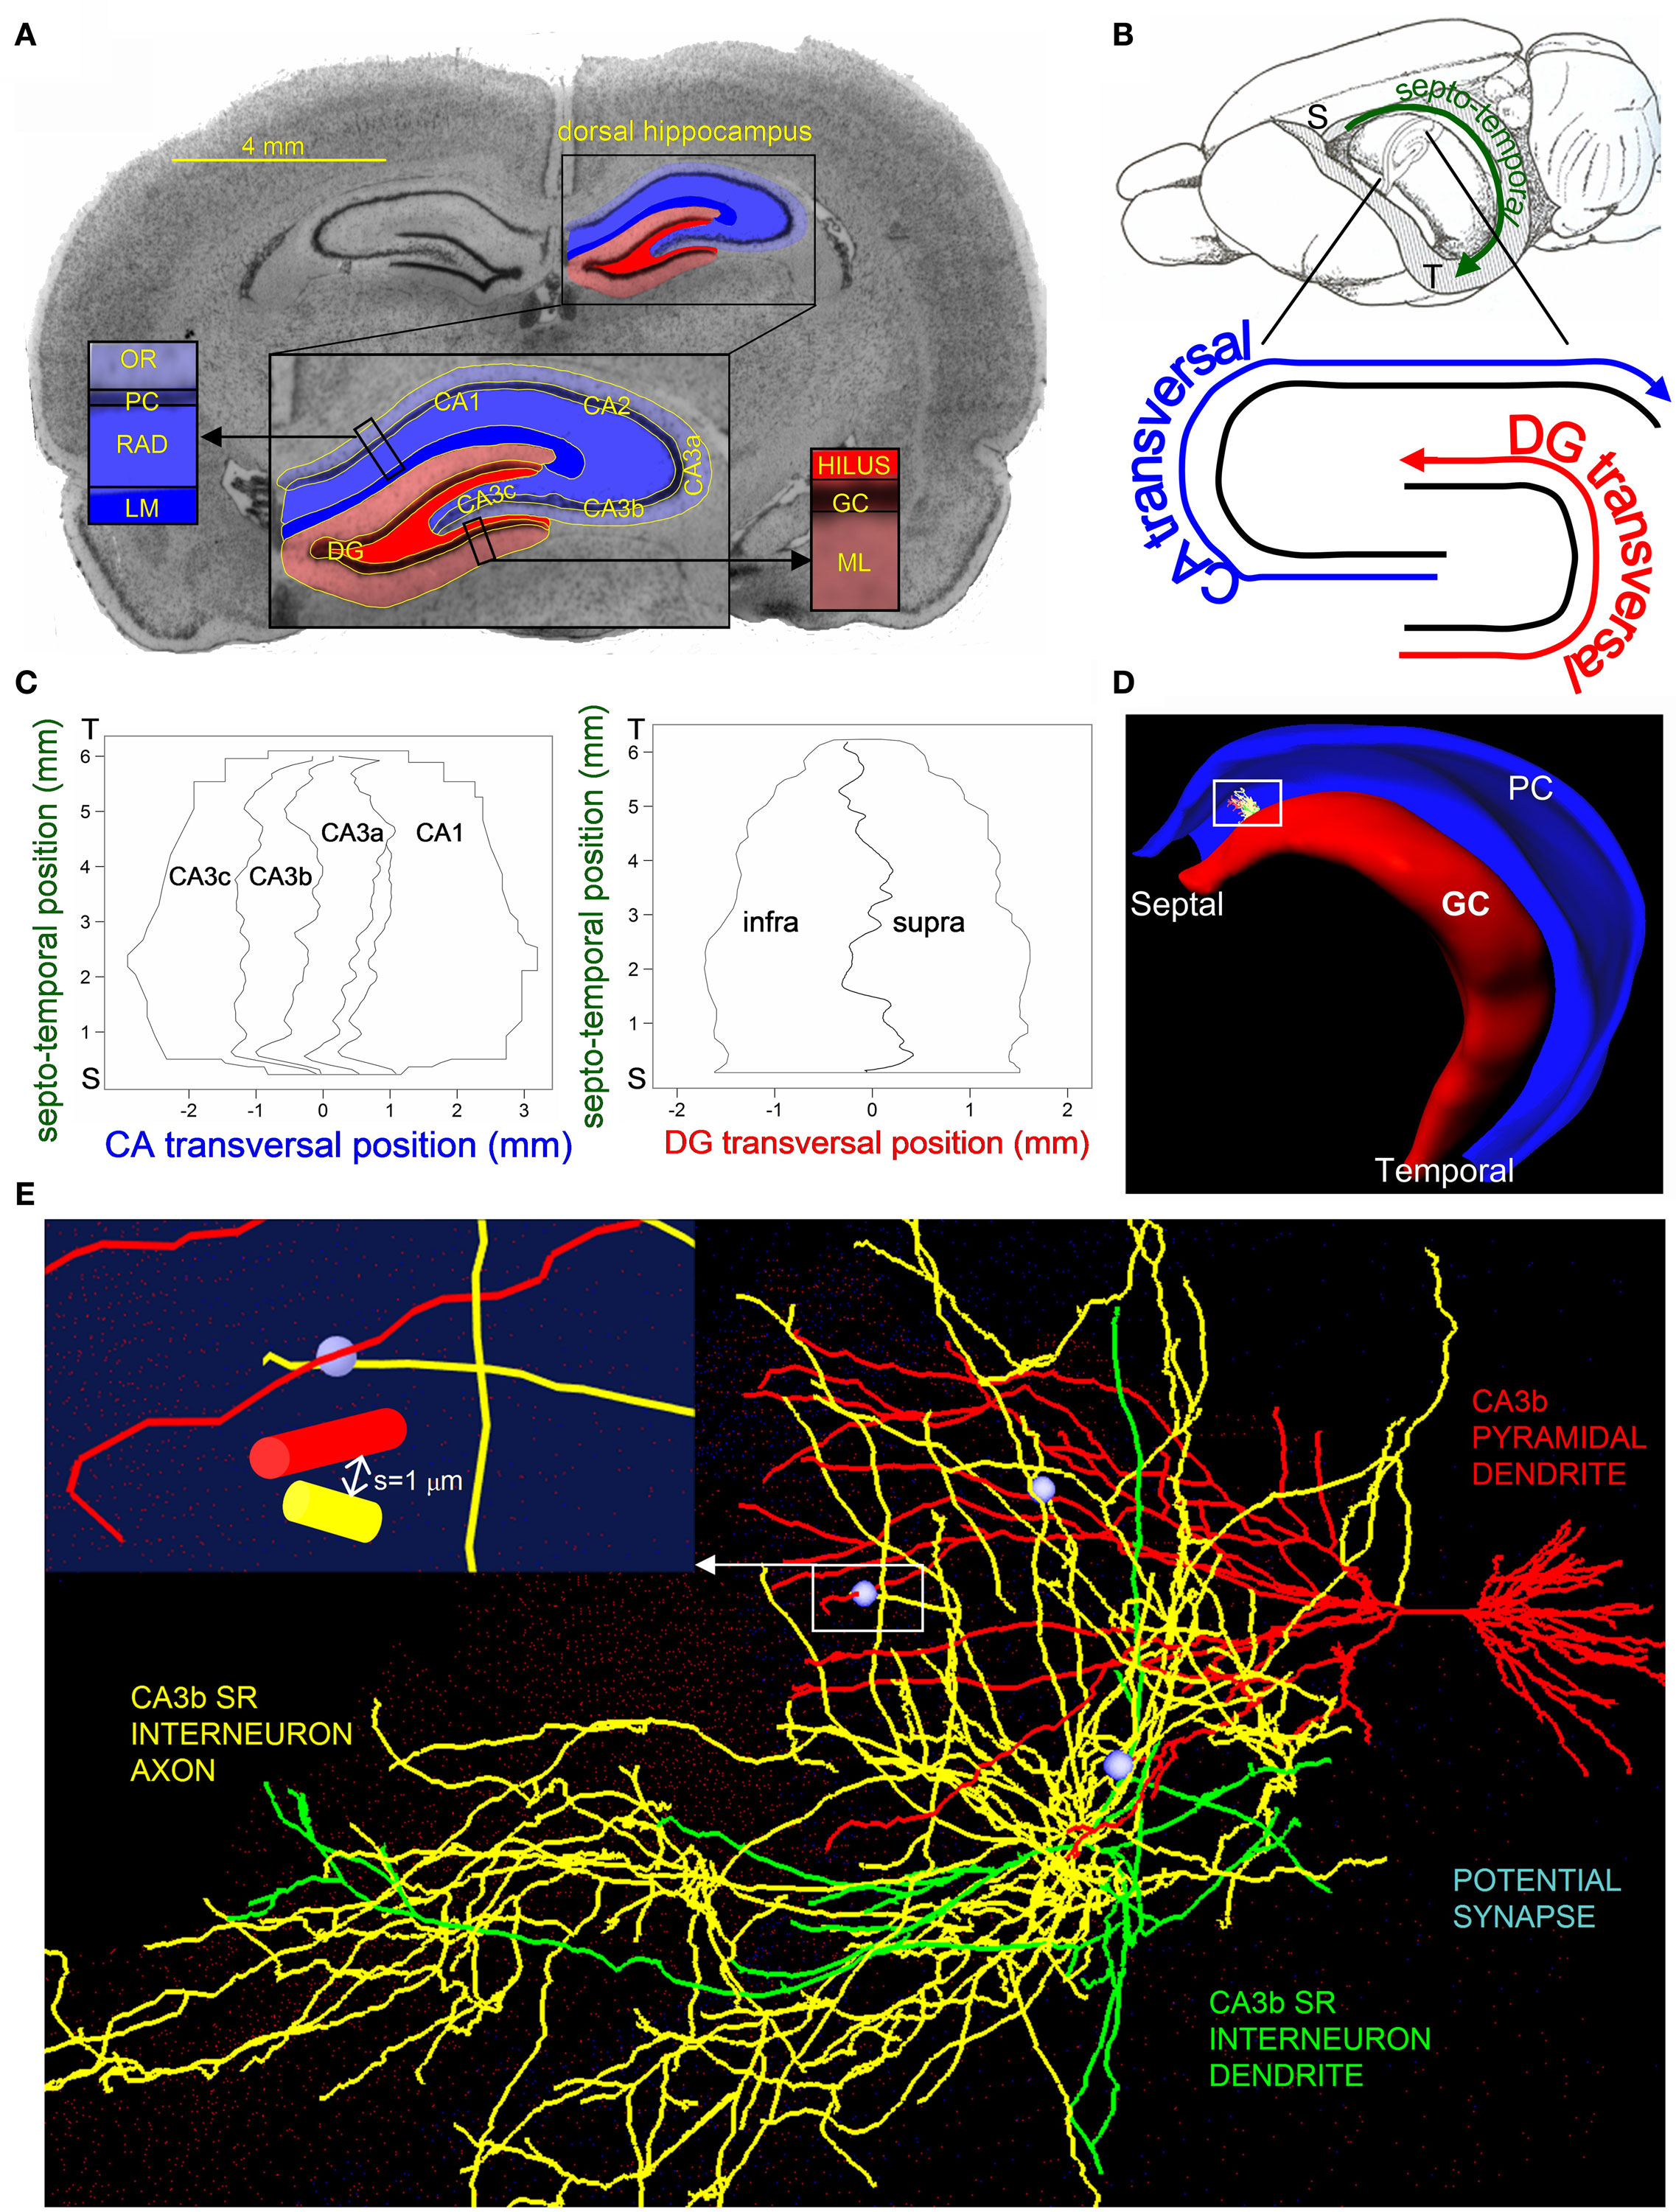
Figure 1. Hippocampus 3D template and potential synapse illustration. (A) Nissl-stained coronal section with CA (blue) and DG (red) cyto-architectonic layers segmented in the dorsal hippocampus. The inset shows an enlarged view of the segmentation labeling the CA (CA1 and CA3a,b,c) and DG (infra and supra) sub-regions and layers. Layer abbreviations: GC, granule cell; ML, molecular; PC, pyramidal cell; RAD, radiatum; LM, lacunosum-moleculare; OR, oriens. (B) The septo-temporal and transversal axes of the hippocampus (“S” and “T” mark the septal and temporal poles). The rat brain depiction in lateral-medial orientation is adapted from Amaral and Witter (1989) with permission from Elsevier. (C) Maps marking the CA and DG sub-region borders with respect to the septo-temporal and transversal axes. (D) Representation of the DG (red) and CA (blue) principal layers of the hippocampus 3D reconstruction, with an embedded CA3bSR interneuron and a CA3b pyramidal cell dendritic tree. (E) Enlarged view of the CA3bSR interneuron (axon: yellow, dendrite: green) and the CA3b pyramidal cell (red), illustrating three potential synapses (light blue). Inset shows a further zoom-in on one of the potential synapses, identifying a location where the interneuron axon is within 1 μm of the CA3b pyramidal cell dendrite.
The 3D location of each voxel was mapped both onto canonical brain planes (coronal, sagittal, and horizontal), and in a natural hippocampus reference frame denoting longitudinal and transversal positions. Longitudinal coordinates were calculated as path distances from the septal to the temporal poles (Figure 1B). Transversal coordinates were computed by first virtually generating 60 cross-sectional planes, which displayed the classic double “C” shape corresponding to the principal cell layers. The medial axes of these granular and pyramidal contours defined the DG and CA transversal positions as the distances from the infra-pyramidal tip and from the CA3c end, respectively (Figure 1B). Additionally, each voxel was assigned appropriate stereotactic coordinates and tagged by its sub-region, namely DG infra- (“I”) and supra-pyramidal (“S”) blades, and CA3c, CA3b, CA3a, CA2, and CA1 (Figure 1C).
Embedding of Digital Neuronal Morphologies
A selection of 18 fully 3D traced axons from different sub-regions of the hippocampus was obtained from NeuroMorpho.Org (Ascoli et al., 2007): 1 GC, 4 pyramidal neurons, and 13 interneurons. The somata of these pre-synaptic neurons were positioned according to the stereotactic coordinates reported in the original reports. The dentate GC and the distal CA3c pyramidal neuron were at AP = 2.5–3 mm and ML = 2.5 mm from bregma (Tamamaki and Nojyo, 1991). The proximal CA3c pyramidal neuron was at AP = 3.5 mm and ML = 2.5 mm (Wittner et al., 2007). The CA3b pyramidal neuron was at AP = 2.4 mm and ML = 3.5 mm (Li et al., 1994). The CA2 pyramidal neuron was at AP = 2–2.5 mm and ML = 2.5 mm (Tamamaki et al., 1988). All interneurons had somata in CA3b, six in the radiatum layer, and seven in LM. The range of their stereotactic coordinates were AP = 1.95–3.85 mm and ML = 2.4–2.6 mm (Ascoli et al., 2009). Since all these somatic locations for the pre-synaptic neurons are reported with a precision of 0.1 mm, they identify a range of six locations in the hippocampus reconstruction, each corresponding to voxels with 16 μm side (16 μm × 6 ≈ 0.1 mm). Cells were positioned in the location closest to the center of this range. In one case (GC) the entire range of 5 × 5 adjacent locations was tested (see Results).
The dendritic reconstructions of PCs were embedded as potential post-synaptic targets. For CA3, 54 pyramidal neurons were pooled from 5 different studies (Ishizuka et al., 1995; Turner et al., 1995; Henze et al., 1996; Carnevale et al., 1997; Jaffe and Carnevale, 1999). For CA1, 103 pyramidal neurons were pooled from 2 of the above studies and 5 additional ones (Pyapali and Turner, 1994, 1996; Ishizuka et al., 1995; Carnevale et al., 1997; Pyapali et al., 1998; Megias et al., 2001; Brown et al., 2005). In all cases, the somata were positioned based on the location ranges reported in the respective papers. As for the pre-synaptic neurons just discussed, the range of suitable voxels in the hippocampus 3D reconstruction was extended to account for the limited precision of the published positional information. Altogether, the location spans of these 10 datasets covered the entire hippocampal space invaded by the 18 selected axons. The pyramidal layers were densely packed by stochastically re-sampling the above 157 post-synaptic neurons, each within its appropriate voxel range. The PC layer was packed with CA3 and CA1 neurons with appropriate somatic densities so as to reflect the known total number of cells in these regions (Rapp and Gallagher, 1996).
Pyramidal and GCs were oriented in the 3D hippocampal reconstruction (Figure 1D) such that the principal axis of their dendritic arborization was perpendicular to the cellular layer and the secondary axis lay on the transversal plane (Scorcioni et al., 2002). To account for the natural variability observed in this general alignment (Claiborne et al., 1990; Ishizuka et al., 1995), the initial orientations were stochastically tilted between 0° and 5° around a random 0°–360° rotation. Principal and secondary axes were computed relative to the soma by single value decomposition of the digital reconstructions (Scorcioni et al., 2002) using standard numerical recipes (Press, 1988). Dendritic trees were scaled so as to reach the appropriate cyto-architectonic boundaries (ML for granule, LM for pyramidal apical, and, OR for basal trees). To ensure that the entire axonal arbors of the pre-synaptic cells fell within the 3D boundaries of the hippocampus, the orientations of these neurons were further manually fine-tuned within ±30° relative to their automatic embedding using quaternions (Hanson, 2006).
Potential Synaptic Connectivity Measurement
A potential synapse occurs when a pre-synaptic segment comes in close proximity of a post-synaptic segment (Figure 1E). For excitatory synapses, the interaction distance is generally considered as a spine length or ∼2 μm (Spacek and Hartmann, 1983; Harris and Stevens, 1989; Harris, 1999; Kalisman et al., 2003). For inhibitory synapses, the interaction distance can be approximated as the sum of the radii of the dendritic and axonal segments, typically 1 μm (Wierenga et al., 2008). The number of potential synapses can be derived from the geometry of pre- and post-synaptic neurons based on a published mathematical formula (Stepanyants and Chklovskii, 2005):
This equation defines the number of potential synapses between the axons of one neuron and the dendrites of a second neuron,  as a function of their position in space, whereas the somata of the two cells are placed at coordinates
  and
and  respectively. In the right hand side, s is the axo-dendritic interaction distance (in our case, 2 and 1 μm for principal cells and interneurons, respectively),
  and
and  represent the unit-volume lengths of the axonal and dendritic segments along the unit vectors
  and
and  and
and  is the absolute value of the sine of the angle between unit vectors
  and
and  These neuronal reconstructions are taken to represent the morphology of a class of similar, but non-identical, neurons. Thus, a Gaussian filter with SD σ is applied around the centers of the axonal and dendritic segments with vectors
  and
and  The parameter σ was fixed at 10 μm, corresponding to the average length of all segments. This equation is iteratively applied to all of the axonal and dendritic segments (indicated with i and j, respectively). Thus, the diameter measurements of the axon and dendrite segments are not used in computing the number of potential synapses.
Computational Details and Data Analysis
The core computational framework was written in C/C++ and compiled with the GNU compiler under UNIX. Potential connectivity computations were executed on an SGI cluster of 80 Altix 8200 nodes, each containing two quad core Intel Xeon E5440 2.83 GHz processors with 16 GB of RAM. Instead of parallelizing the C/C++ code, we maximized the number of available nodes by submitting to the server a number of PBS (Portable Batch System) scripts that split the job into independent tasks1. At the same time, the code was optimized using pthreads (Silberschatz et al., 2009) to capitalize on the multi-processors of each node. As expected, the computing time decreased sub-linearly on the cluster machine compared to a single CPU. For instance, computing the potential connectivity for the proximal CA3c axon took ∼24 h on a single computer vs. ∼2 h on the cluster.
The program returns the number of potential contacts between a pre-synaptic neuron and all post-synaptic targets. Moreover, it records the anatomical locations of every potential synapse both within the hippocampus (in each of the coordinate systems described above) and in terms of distances from the somata of the pre- and post-synaptic neurons along the axonal and dendritic paths, respectively. Two-dimensional color maps (e.g., Figure 2) were generated using the R package “ggplot2”2. Linear dependencies were computed from these potential connectivity maps as regression fits of the septo-temporal positions weight-averaged by the corresponding numbers of potential synapses at a given transversal position. Virtual Reality Modeling Language files were generated with the freeware viewer “view3dscene”3.
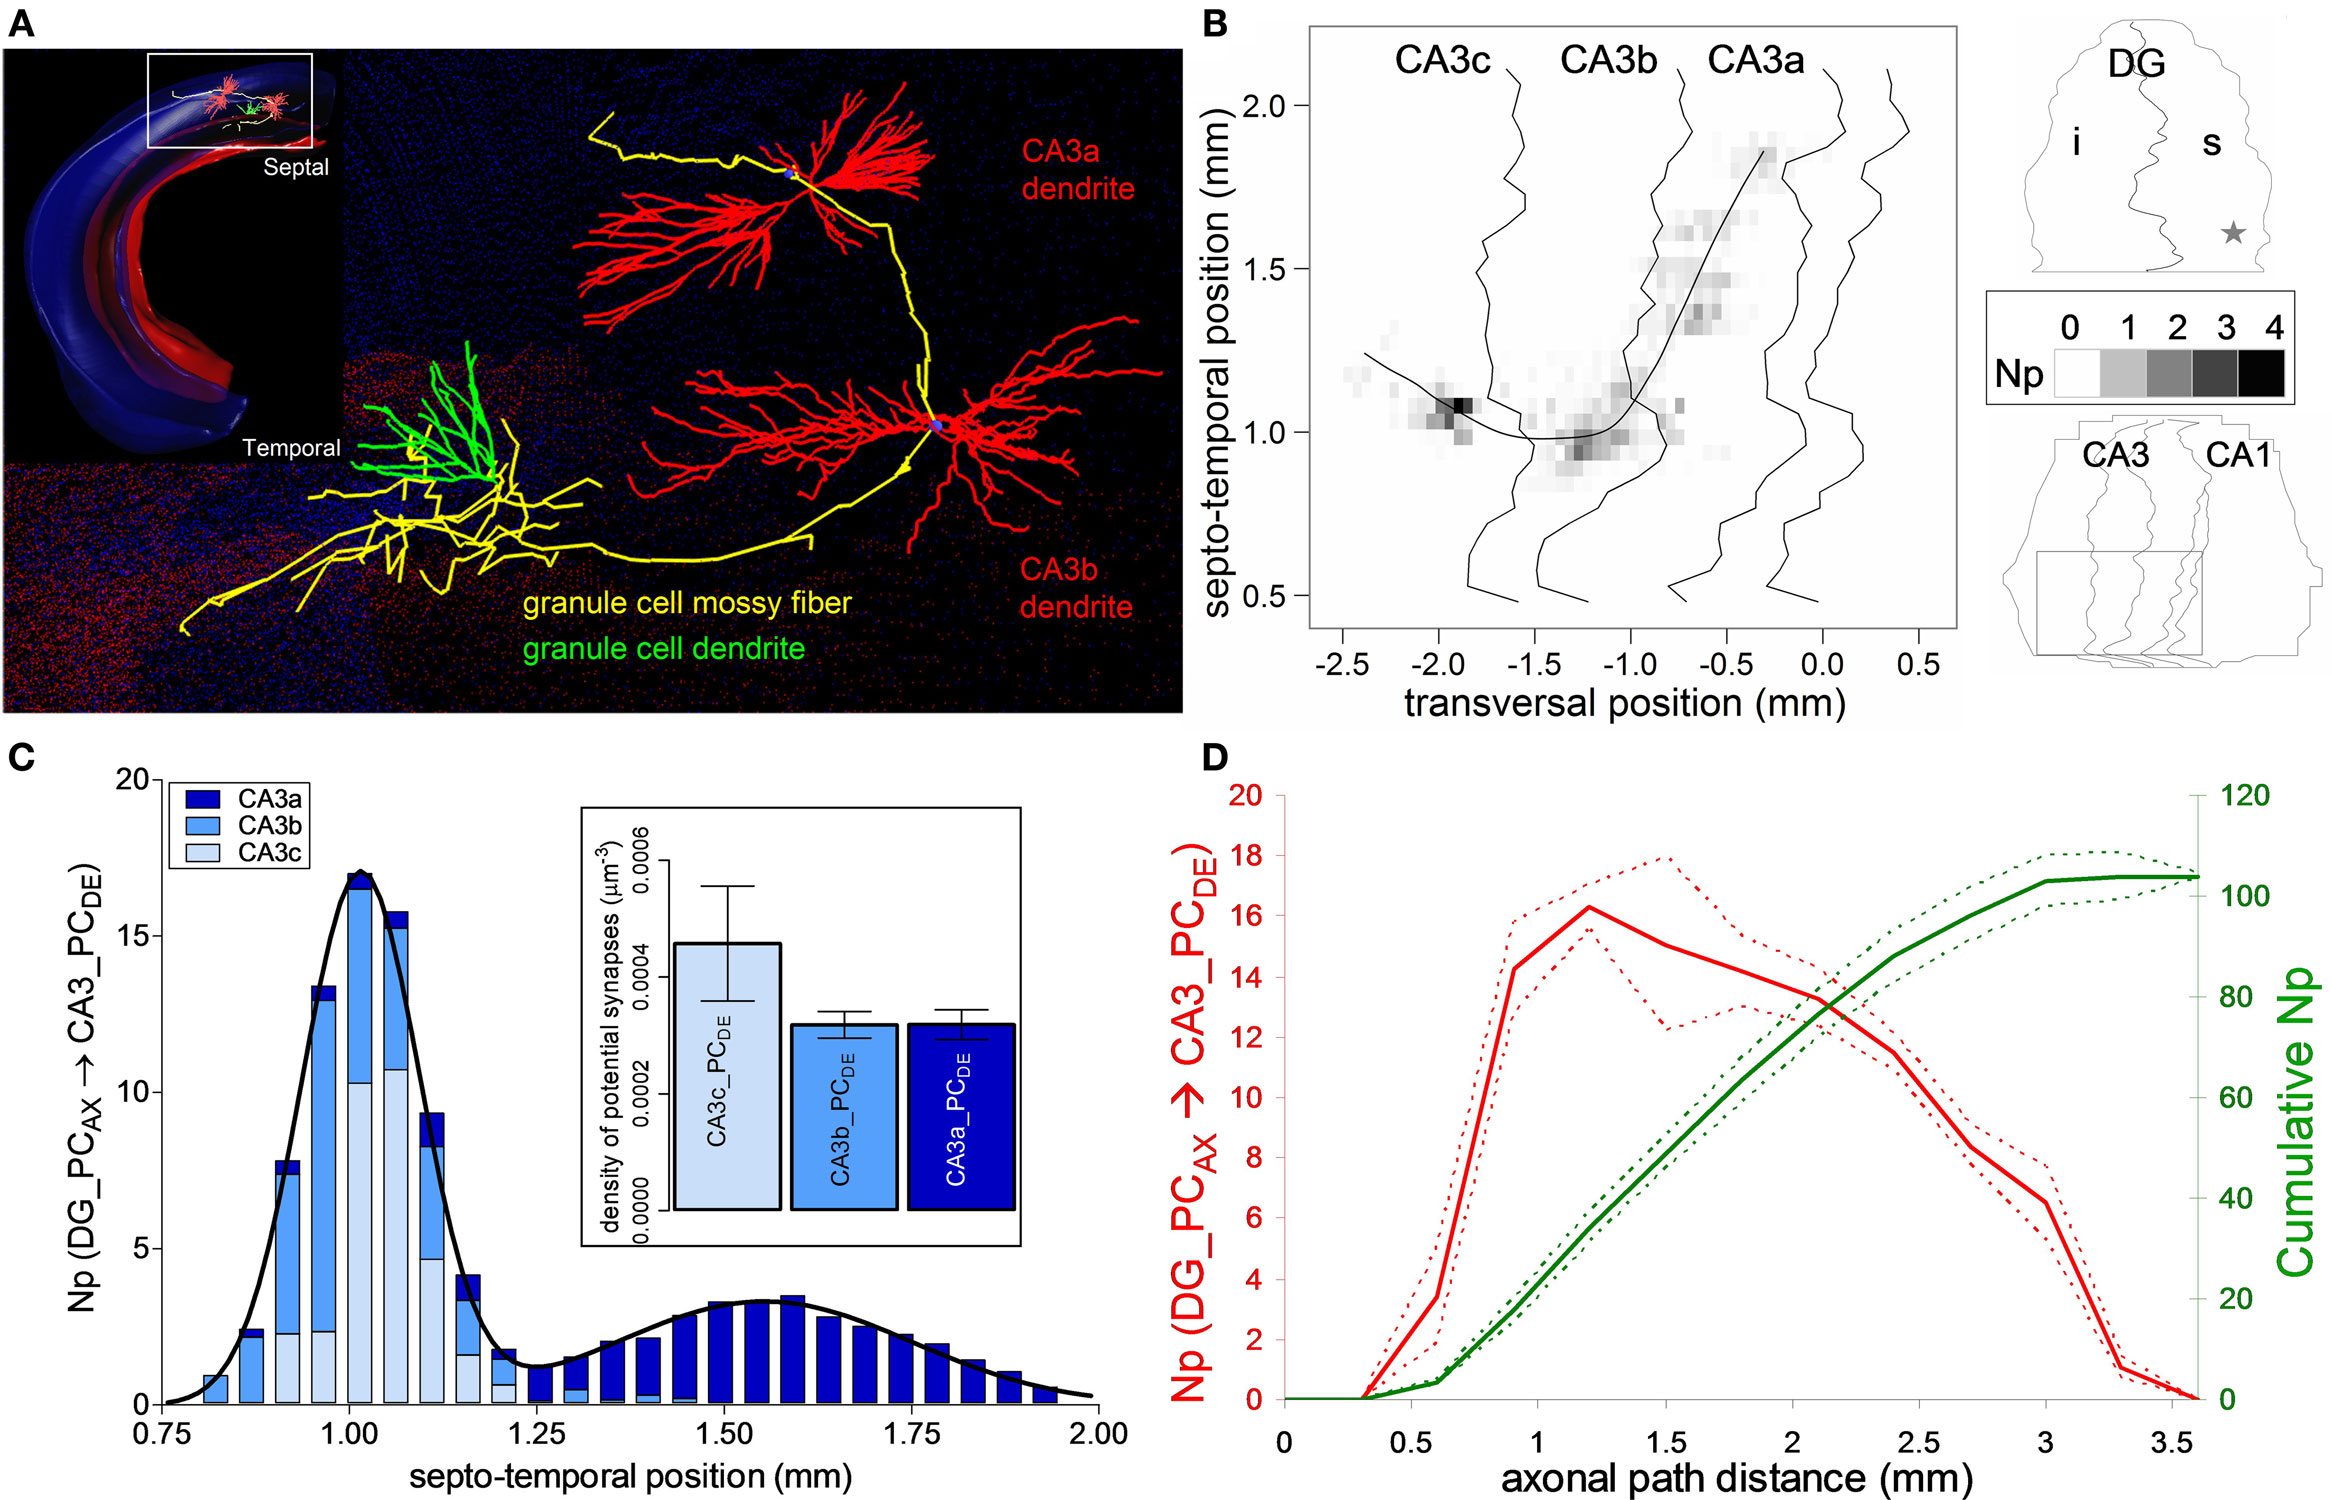
Figure 2. Potential connectivity analysis for DG mossy fiber onto CA3 pyramidal cells. (A) Relative orientation of a dentate granule cell (axon: yellow, dendrite: green) and of the dendritic trees of two pyramidal cells from CA3b and CA3a. Inset shows the arbor embeddings within the 3D hippocampus reconstruction. (B) Potential synapse map: The average number (Np) of potential contacts (gray scale) is based on simulations of 25 pre-synaptic positions around the central granule cell location, which is marked by a star in the top (DG) right panel. The bottom (CA3/CA1) right panel demarcates the sub-regions invaded by the axon (square box), corresponding to the main panel. The fitting line is a cubic spline function (r2 = 0.85) of septo-temporal vs. transversal positions weight-averaged by the potential synapse numbers. (C) Average number of potential contacts in each of the CA3 sub-regions, fitted with two Gaussian curves. Inset shows the density of potential synapses. (D) Number (left axis, red) and cumulative count (right axis, green) of potential synapses along axonal path distance. The solid and dashed colored lines correspond to averages and 95% confidence interval around the mean.
Results
The results presented here are intended as a proof-of-concept of the 3D framework in computing the full potential connectivity of single neurons throughout system-level regional maps. As such, the research design was data-rather than hypothesis-driven.
We named the various neurons with a region_cell-type nomenclature convention, using subscripts AX and DE for pre- and post-synaptic cells, respectively and superscripts to specify sub-regions as needed. Thus, the dentate GC is labeled DG_GCAX. The pre-synaptic PCs in various sub-regions are referred to as CA3cprox_PCAX, CA3cdist_PCAX, CA3b_PCAX, and CA2_PCAX. The interneurons with somata in the radiatum and LM layers are distinguished as CA3bR_INAX and CA3bLM_INAX, respectively. The post-synaptic PC targets are referred to as CA3_PCDE and CA1_PCDE.
Potential Synaptic Framework Illustration
The dentate mossy fibers exemplify a well-known axonal arbor system within the hippocampus, with projections to all three sub-regions of the CA3 pyramidal network (Figure 2A). The axons of dentate GCs contact both PCs and interneurons in CA3 stratum lucidum (Acsady et al., 1998). Here we only considered PCs as the potential post-synaptic targets. Previous research on the organization of the dentate mossy fiber pathway revealed that the main axonal path initially traverses the CA3 region in a septal direction. Then at the CA3b/CA3a border it abruptly changes course to a temporal/caudal orientation relative to the soma position of the GC (Acsady et al., 1998). This peculiar shape of the mossy fibers is evident from the visualization of the axonal embedding within the 3D hippocampal reconstruction (Figure 2A) and the potential synaptic map in CA3 (Figure 2B). The map is built from 25 GC somatic positions around the center of the spatial range in the supra-pyramidal region corresponding to the reported stereotactic coordinates (star in the DG schematic of Figure 2B).
The total number of potential synapses made by the GC on pyramidal dendrites is 103.8 ± 4.1 (mean ± SD, N = 25), with an almost equal distribution among the three sub-regions of CA3: 32.2 ± 2.3 in CA3c, 36.6 ± 2.1 in CA3b, and 35.0 ± 1.1 in CA3a. However, both the number of potential contacts and the proportions among the sub-fields vary non-uniformly along the longitudinal axis. In particular, the distribution along the septo-temporal axis follows a double Gaussian (Figure 2C). The first peak is centered around the somatic septo-temporal position of the GC, and largely consists of potential synapses in areas CA3c and CA3b. The second peak (displaced ∼0.6 mm temporally) is twice as wide but of smaller (∼1:5) amplitude, and almost entirely corresponds to potential contacts in CA3a. In contrast to the absolute numbers of potential contacts, the potential synaptic density is significantly higher in CA3c compared to CA3b and CA3a (Figure 2C inset, p < 0.0001, unpaired two-tailed t-test). The uneven density can be explained by analyzing the number of potential synapses with respect to the axonal path distance (Figure 2D). The potential synaptic count rises sharply and peaks at ∼1 mm within CA3c, but then decreases farther along the path in correspondence to the CA3b and CA3a sub-regions. These results parallel the empirical observations on mossy bouton and actual synapse counts within each CA3 sub-region (Acsady et al., 1998; Henze et al., 2000).
Distinct Potential Synaptic Connectivity Patterns in the Pyramidal Cell Network
The axonal trees of the four examined pyramidal neurons share common general characteristics, at the same time exhibiting exquisitely distinct potential synaptic maps onto the CA3/CA1 principal neuronal network (Figure 3). All four arbors project to large portions of the CA3 and CA1 sub-regions, with ∼3 mm longitudinal coverage. The numbers of potential synapses, however, vary widely from ∼176 K for CA3cprox_PCAX and ∼160 K for CA2_PCAX, to ∼100 K for CA3cdist_PCAX and ∼80 K for CA3b_PCAX. These differences, considerable even within sub-region, largely reflect variation in axonal length (Ropireddy et al., 2011).
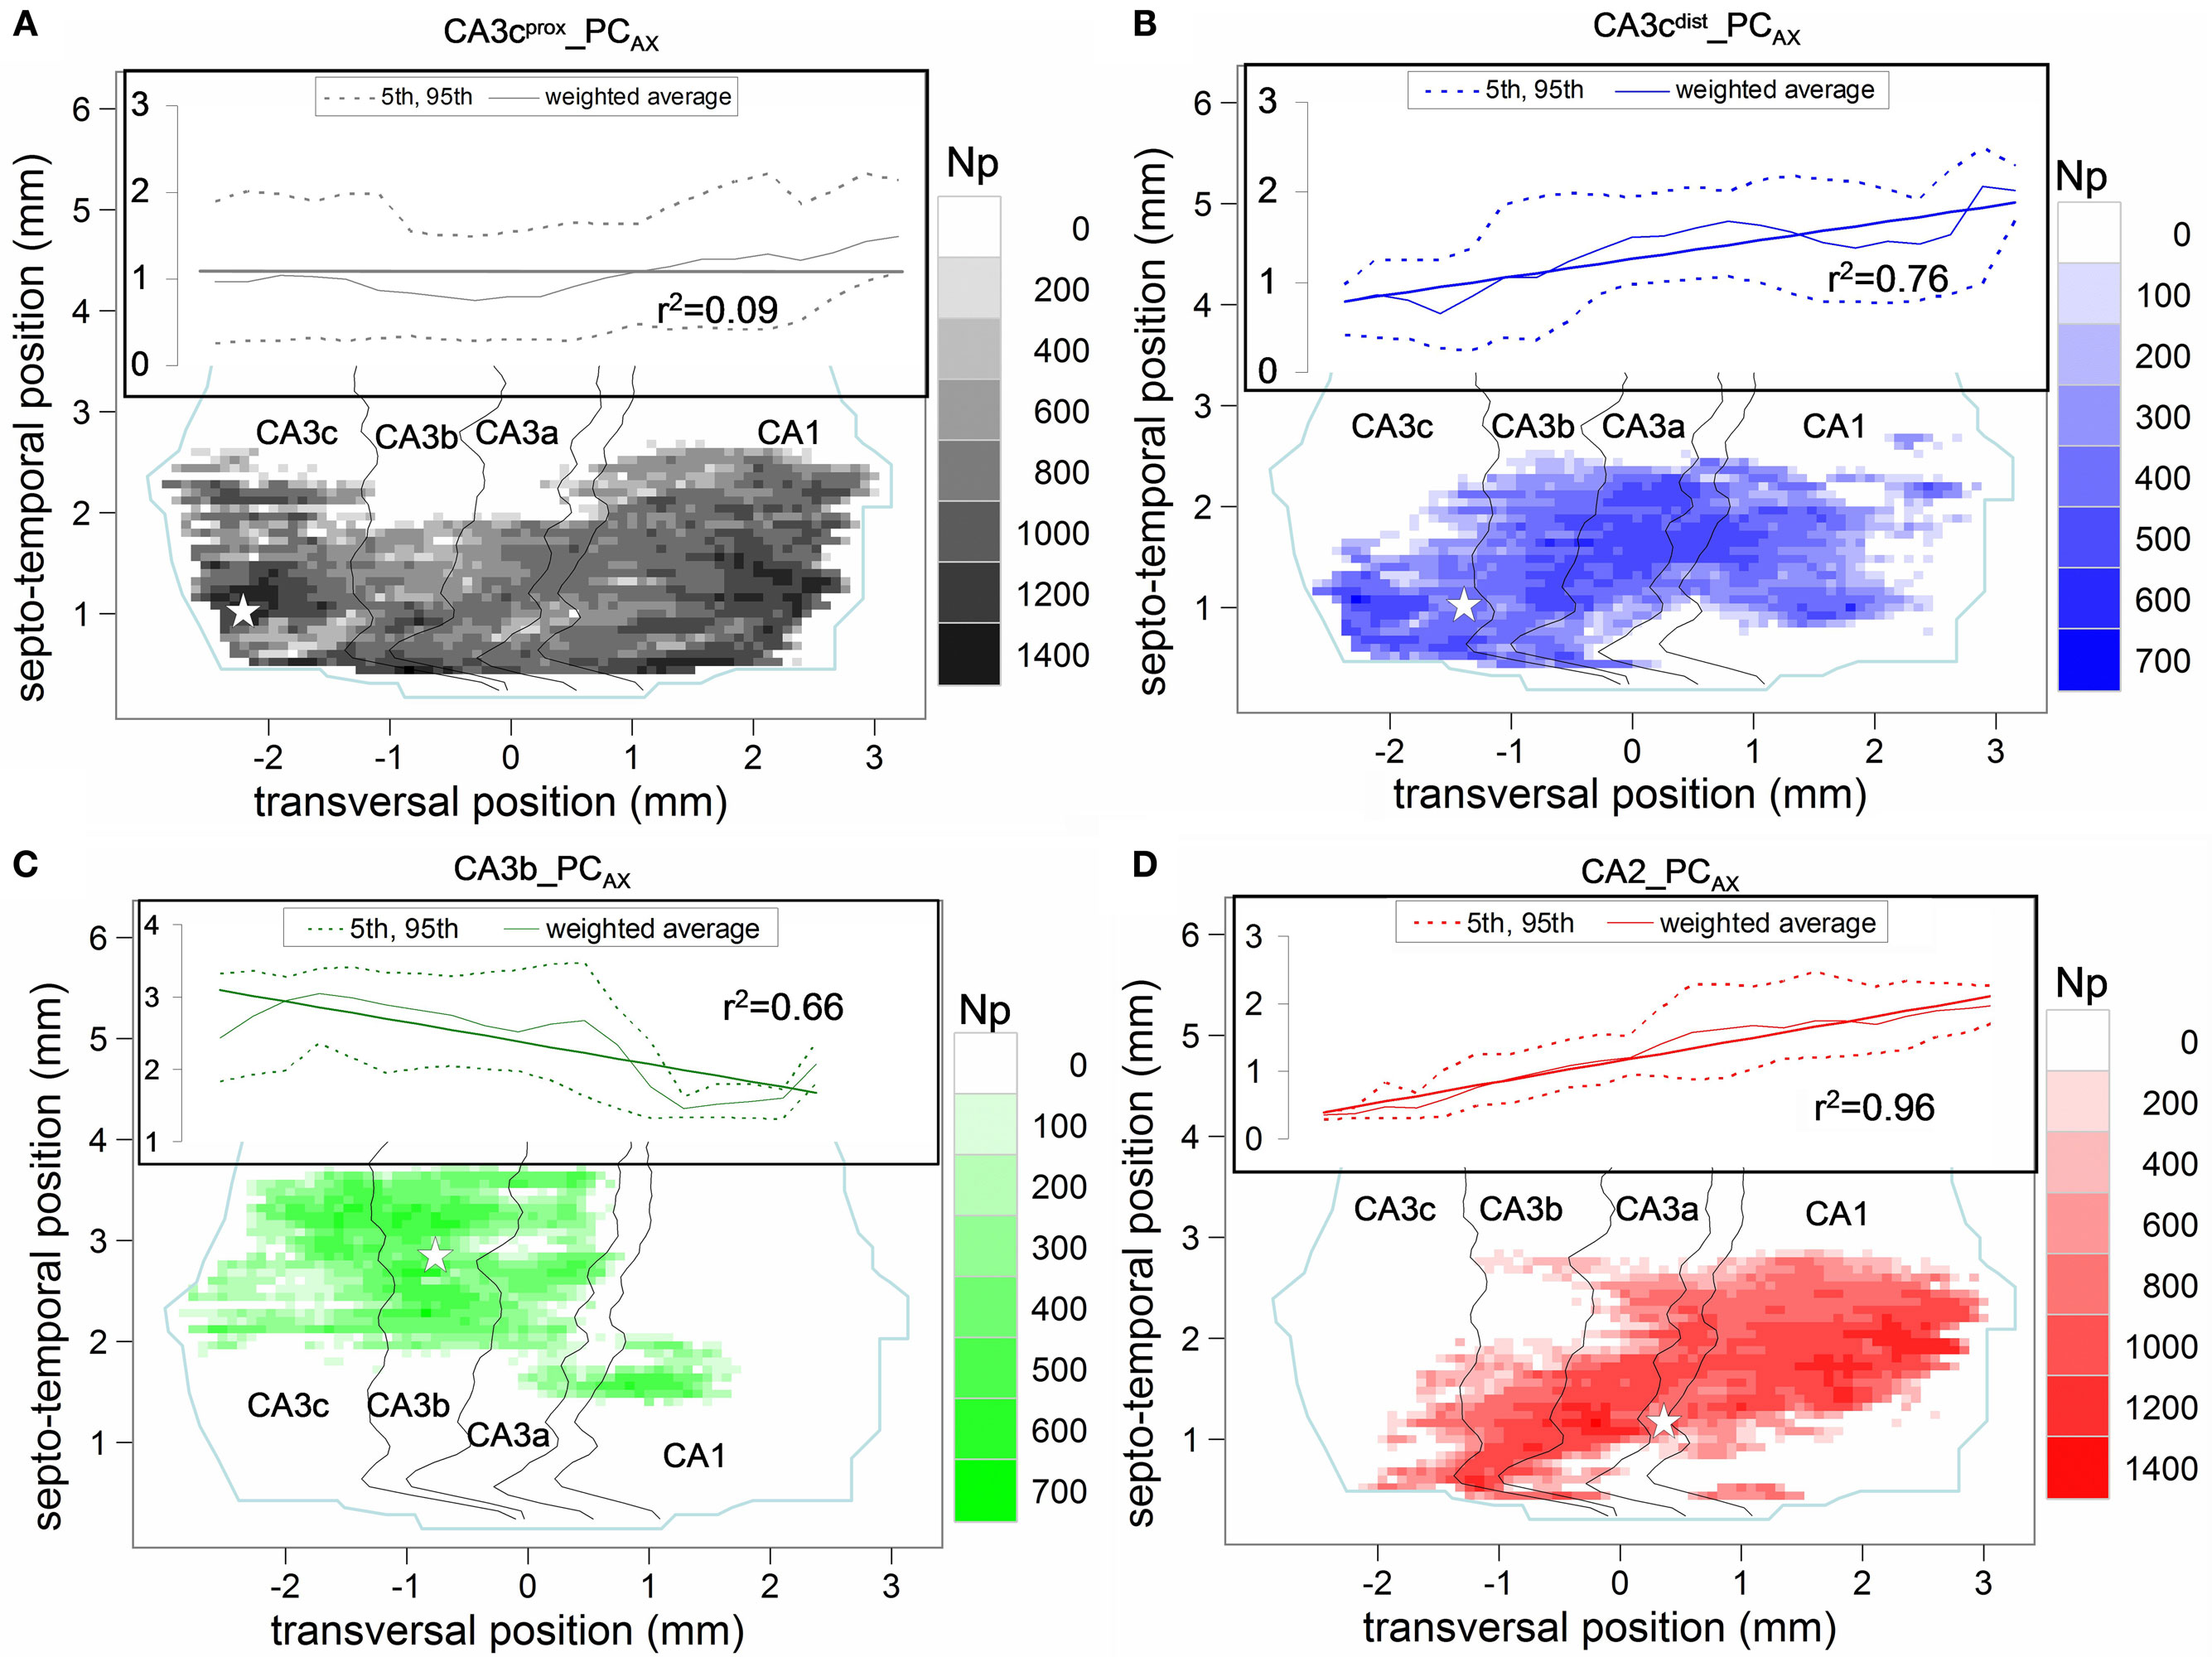
Figure 3. Potential connectivity maps of four pre-synaptic CA3/2 principal neurons onto pyramidal cells. (A) CA3cprox_PCAX (gray), (B) CA3cdist_PCAX (blue), (C) CA3b_PCAX (green), and (D) CA2_PCAX (red). In all maps, the white star denotes the transversal and septo-temporal coordinates of the pre-synaptic soma. Insets show the linear regression and 95% confidence interval of the septo-temporal vs. transversal positions weight-averaged by the potential synapse numbers.
Except for CA3b_PCAX, all other three neurons have potential synapses across every CA sub-field, with relative differences in their count of potential contacts between CA3 and CA1. A prominent difference among the maps concerns their orientations with respect to the two natural axes of the hippocampus, reflected by the linear regressions of the weighted averages (Figure 3 insets). Specifically, no particular trend is apparent for CA3cprox_PCAX (Figure 3A). In contrast, CA3cdist_PCAX (Figure 3B) and CA2_PCAX (Figure 3D) clearly favor septal locations in the proximal transversal regions (CA3 toward the DG), and temporal locations in the distal transversal regions (CA1 toward the subiculum), with a significantly positive correlation (r = 0.87 and r = 0.98, respectively). Conversely, CA3b_PCAX displays the opposite tendency (Figure 3C) due to a fairly uniform spread of CA3 contacts around the somatic position and a ∼1 mm septal shift in CA1 (r = −0.81).
The distinct patterns of potential connectivity are particularly evident along the transversal axis (Figure 4A,B). The CA3cprox_PCAX bimodal distribution peaks in CA3c and in mid-CA1. The multi-modal shape of CA3cdist_PCAX reveals a preference for the CA3c and CA3a sub-regions, but tails off within proximal CA1. These contrasting tendencies are summarized in the counts of potential contacts within CA3 (and its sub-fields) and CA1 (bar plots of Figure 4A). To quantify the opposite differences statistically, we repeated the embedding of all post-synaptic PCs 10 times with different random seeds for the exact positions and orientations. For the CA3cprox_PCAX, the potential synaptic count is 1.5 times larger in CA1 than in CA3, whereas for CA3cdist_PCAX this ratio is 0.45 (both p < 0.0001, unpaired two-tailed t-test). Moreover, CA3cprox_PCAX makes three-fourth of its potential synapses in CA3c, while half of the CA3cdist_PCAX potential contacts is in CA3a. The CA3b_PCAX neuron exhibits the most localized potential connectivity, peaking around the somatic position in CA3b and extending nearly an order of magnitude fewer potential synapses in CA1 than in CA3. The CA2_PCAX transversal distribution is bimodal with peaks in CA3a and mid-CA1. The total number of CA1 potential contacts is twice that in CA3 (p < 0.0001).
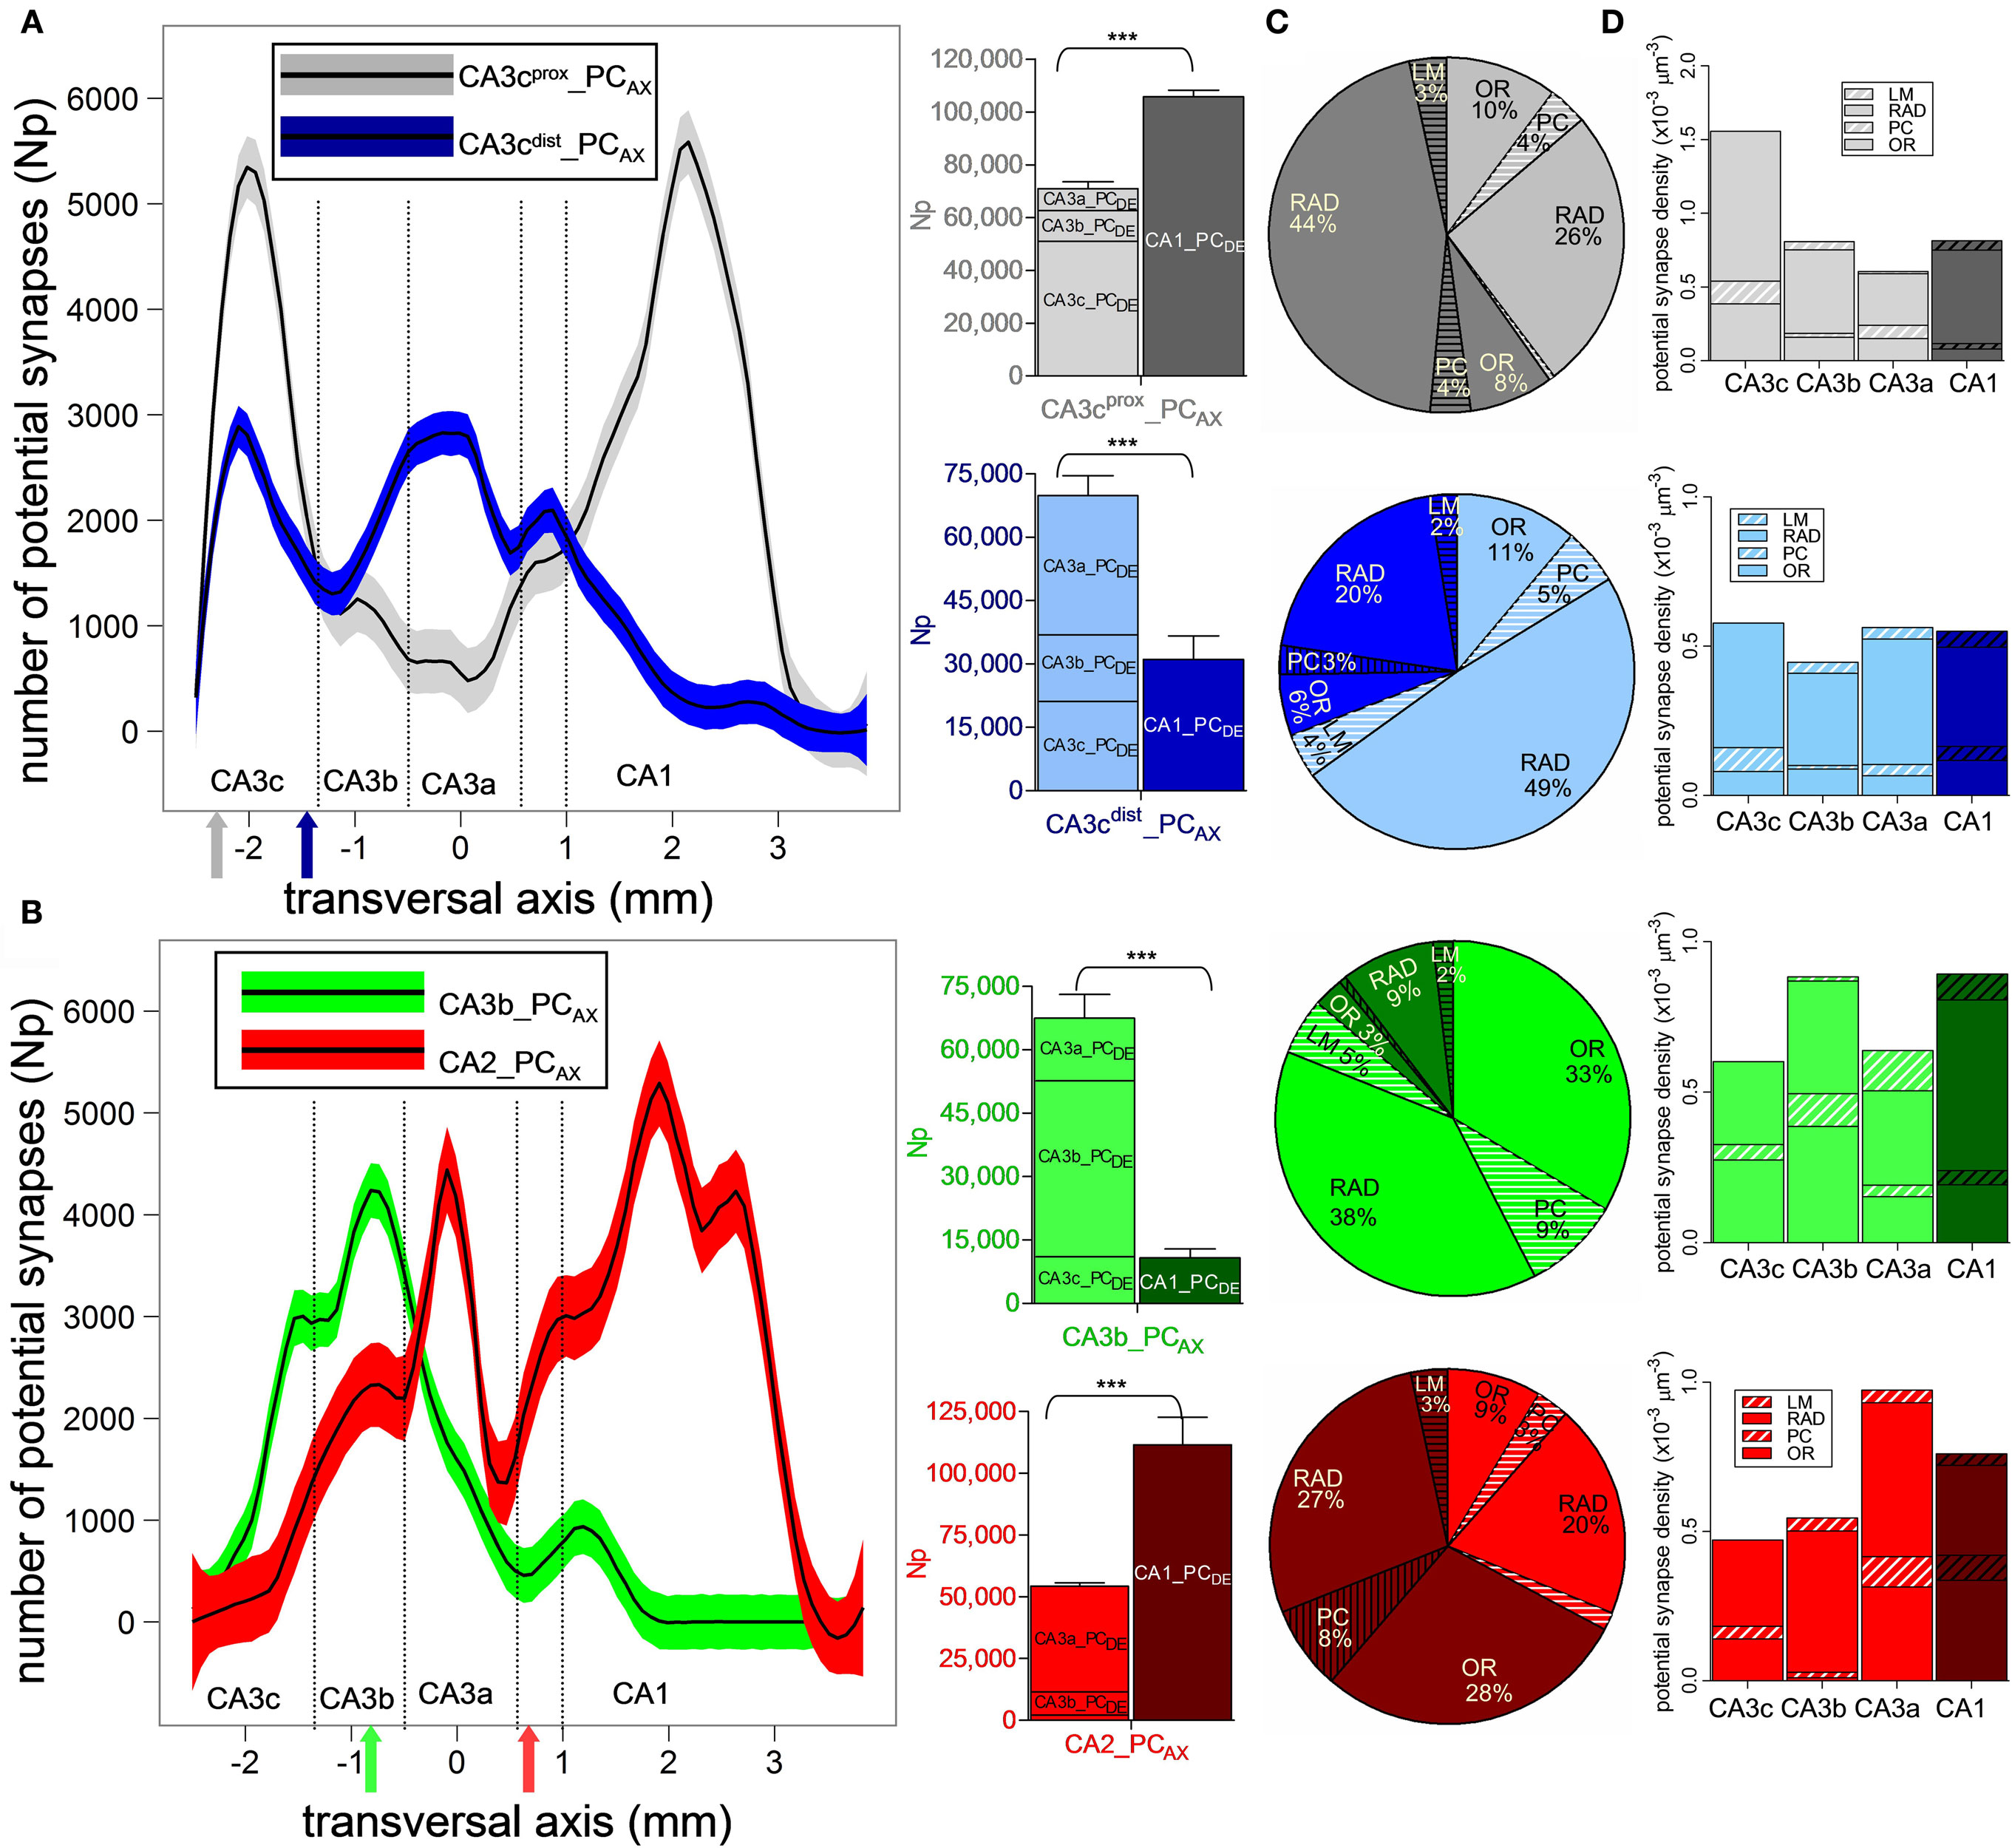
Figure 4. Sub-region and layer specificity of pyramidal cell potential connectivity. (A,B) Potential synapse distributions along the transversal axis for CA3cprox_PCAX (A, gray), CA3cdist_PCAX (A, blue), CA3b_PCAX (B, green), and CA2_PCAX (B, red). The solid colored arrows indicate the soma transversal positions. For each of the four axonal arbors, bar plots summarize the total counts in each CA3 sub-region and in CA1. (C) Proportion of potential contacts in CA3 (light) and CA1 (dark) layers. The layers not primarily targeted by these axons (PC and LM) are striped. (D) Density of potential synapses in the layers of each CA3 sub-region (light) and CA1 (dark).
The four PCs also display general similarities and distinct differences in potential connectivity across layers (Figure 4C). As expected, the vast majority of potential synapses are always found in radiatum (RAD) and oriens (OR), with only small fractions in the pyramidal (PC) and LM layers. The CA3 and CA1 radiatum proportions notably differentiate the four pre-synaptic neurons. For CA3cprox_PCAX, the RAD potential contacts are 1.7 times more abundant in CA1 than in CA3, while the inverse ratio (0.4) applied to CA3cdist_PCAX. In both neurons, only less than or close to one-tenth of potential synapses are contributed by OR, as opposed to more than two-thirds by RAD. For CA3b_PCAX, radiatum is still dominant in the minor CA1 component, but for the major CA3 contribution, oriens and radiatum provide an approximately even number of potential synapses. A mirror situation occurs in CA2_PCAX, where radiatum has greater representation in the minor CA3 component, but oriens claims an equal split in the synaptically richer CA1 field. For both CA3b_PCAX and CA2_PCAX, less than 50% of potential synapses are found in RAD, and more than a third in OR.
In addition to the count of potential contacts, the potential synapse densities also vary across sub-regions and layers among the four axons (Figure 4D). For CA3cprox_PCAX, the highest density of potential synapses occurs in CA3c even though the total count is greater in CA1. In contrast, CA3cdist_PCAX shows similar potential synapse densities in all CA3 and CA1 sub-regions. For CA3b_PCAX, the potential synapse density is highest in CA3b and CA1, again in spite of the lower CA1 total count, indicating a focal concentration of potential connectivity within a smaller area (cf. Figure 4B). The CA2_PCAX potential synapse density is maximal in CA3a followed by CA1, where more than two-thirds of the potential contacts are made. Thus, each of the four neurons displays unique patterns of preferred density domains. Conversely, in all cases and for each sub-field, the potential synaptic density is substantially greater in radiatum than in oriens with only three exceptions in which the two values are similar: CA3c and CA3a for CA3b_PCAX, and CA1 for CA2_PCAX.
Potential Synapse Distributions along the Axonal and Dendritic Paths
The distance from the soma of a pre-synaptic terminal along the axonal path may affect spike propagation delay and reliability. Thus, we investigated how the dependence on axonal distance of potential connectivity varies among neurons (Figure 5A). The four PCs exhibit linear increases with similar slopes in the cumulative count of potential synapses up to ∼1.5 mm, indicating a uniform distribution of potential pre-synaptic contacts in the first part of the axonal path. Beyond this distance, the neuron with the longest axon (CA3cprox_PCAX) has a shallow accumulation of potential contacts (mostly in CA3) within the more proximal one-third of path (the initial ∼7 mm), and makes progressively more CA1 potential synapses in the next ∼7 mm. The neuron with the fewest potential contacts (CA3b_PCAX) is also essentially confined within CA3 and in fact ends shortly after the initial 7 mm of path, though it displays a faster potential synapse increase reaching a plateau in the first ∼5 mm. Within this same path, the other two neurons have the steepest (and very similar) accumulation of potential contacts. The neuron with the shortest path (CA3cdist_PCAX) synapses mostly in CA3 for the first half of its path and only in CA1 for the second half. CA2_PCAX also forms potential contacts exclusively in CA3 for the first ∼2.5 mm, but then continues for ∼10 mm after switching to CA1.
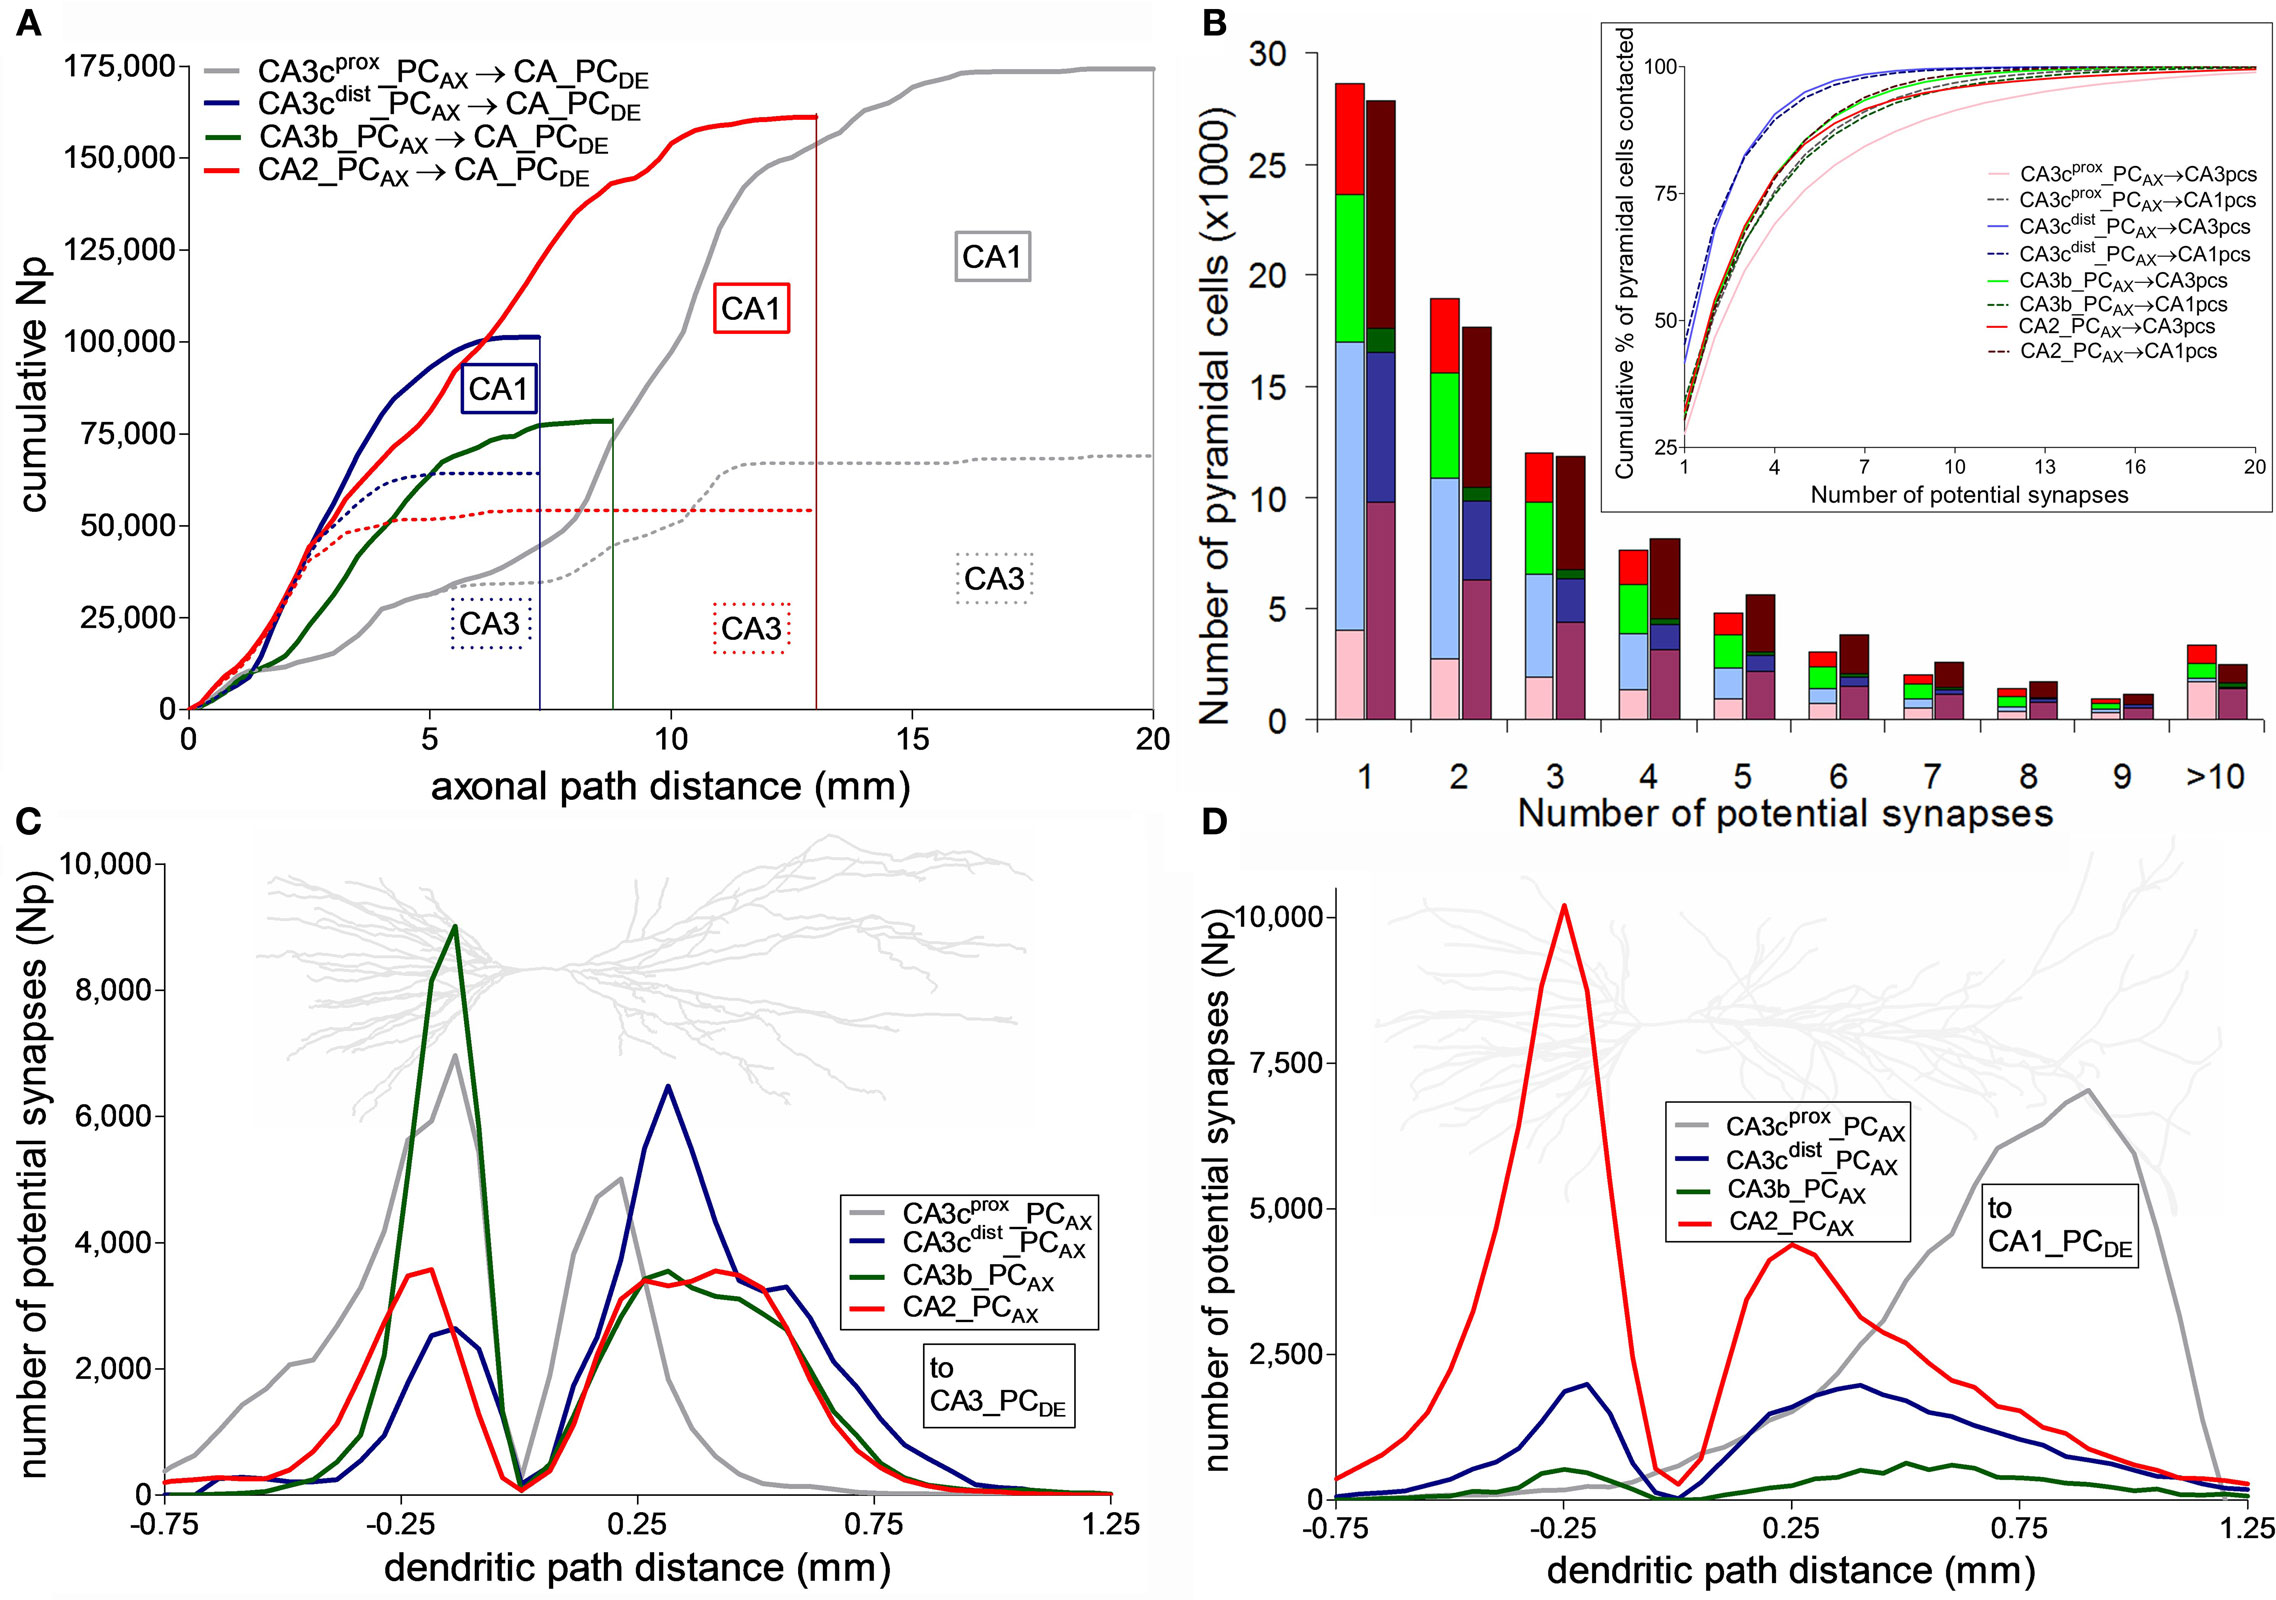
Figure 5. Distribution of potential synapses along axonal and dendritic paths. (A) Cumulative count of potential synapses made by the four CA3/2 pyramidal cells as a function of their axonal path distances from the soma. The dotted colored lines correspond to the potential contacts onto CA3 pyramidal cells. The difference between the solid and dotted lines represent the cumulative potential synapse numbers onto the CA1 network. (B) Distribution of the number of potential synapses received by the CA3 (light) and CA1 (dark) pyramidal cells contacted by any of the four axonal arbors. Inset shows the cumulative proportion of pyramidal cells contacted with up to a given number of potential synapses. (C,D) Potential synapse distributions for the four CA3/2 axonal arbors along the dendrites of CA3 (C) and CA1 (D) pyramidal cells. Negative and positive path distances correspond to basal and apical dendrites, respectively. The background neuron images are representative dendritic arbors of CA3 and CA1 pyramidal cells from NeuroMorpho.Org.
The four axonal arbors also differ in terms of the proportion of post-synaptic targets they contact, either out of all (225,000 CA3 and 390,000 CA1) PCs or only considering those with dendrites within the spatial reach of each axon (Table 1). These numbers vary widely among neurons and between CA3 and CA1. In contrast, the spatial coverage is similar among the four axons in CA3 (∼40%) and CA1 (∼25%). The average number of potential contacts per post-synaptic neuron ranged from ∼2.2 to 5.6, with small coefficients of variation (typically below 0.1). Thus, most neurons receiving potential synapses tended to be contacted multiple times. In fact, individual connections only accounted for one-third of the cases. However, the distributions of the number of potential synapses per contacted PC varied dramatically depending on the pre-synaptic axon (Figure 5B). Interestingly, the grand average of potential synapses per PC over the whole post-synaptic pool (the product of overall % PCs contacted by their averaged received contacts) is similar for all axonal arbors on CA3 pyramidal dendrites (∼0.3) but not on CA1 pyramidal dendrites, where it spans an order of magnitude from 0.29 for CA2_PCAX to 0.03 for CA3b_PCAX. These divergence ratios are consistent with previous findings (Li et al., 1994).
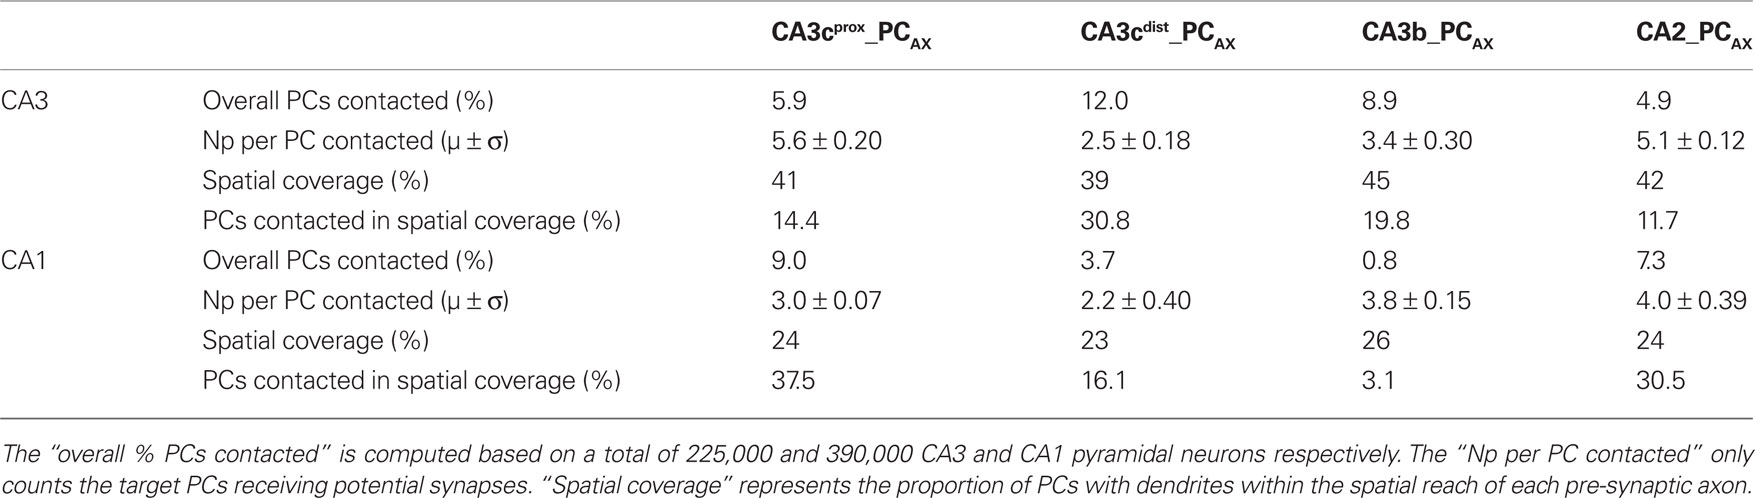
Table 1. Percentage of pyramidal cells contacted by the four axonal CA3/CA2pc arbors and number of potential synapses they receive.
The distance of a synapse from the soma along the dendritic path can affect signal integration both by cable filtering and active membrane properties. The distributions of potential synapses in the apical and basal dendrites of PCs reflect the patterns observed in the oriens and radiatum layers, respectively, in CA3 (Figure 5C) and CA1 (Figure 5D). All four neurons have a peak of potential synapses on the basal dendrites at a similar distance along the path (∼200 μm). However, CA3b_PCAX and CA3cprox_PCAX have the largest number of basal potential contacts in CA3 and the smallest in CA1. In contrast, CA2_PCAX is dominant in CA1, and CA3cdist_PCAX has a similar number in both regions. The four neurons display more similar distributions of potential contacts along the CA3 apical paths, except for the more proximal peak of CA3cprox_PCAX. The patterns along the CA1 apical paths, in contrast, are completely distinct in the four cases. CA3cprox_PCAX and CA2_PCAX have the largest and second largest peaks, but are located at opposite extremes (distal and proximal, respectively) of the apical dendrites, almost 750 μm apart. The remaining two CA3 neurons have smaller peaks (especially CA3b_PCAX) at intermediate path distances.
Potential Synapse Distributions of Radiatum and Lacunosum-Moleculare CA3b Interneurons
Interneurons with somata in CA3b radiatum and LM layers have distinct electrophysiology and synaptic plasticity, yet similar axonal morphology (Ascoli et al., 2009). The collective potential synaptic map for the 13 interneurons (6 CA3bR_INAX and 7 CA3bLM_INAX) depicts localized CA3 distributions spanning approximately the same spatial extent in the septo-temporal and longitudinal dimensions (Figure 6A). CA3bR_INAX and CA3bLM_INAX make approximately 50,000 and 40,000 potential contacts, respectively, with CA3 PC dendrites. The difference between these mean values was not statistically significantly (p > 0.5, unpaired two-tailed t-test). The spatial extent in the septo-temporal and transversal axes were 0.60 ± 0.09 mm and 2.91 ± 0.55 mm (mean ± SD, N = 13), respectively. The potential synaptic map area was 1.38 ± 0.23 mm2. The coefficient of variation for these three parameters is thus under 0.2. We also computed the mean square deviation (MSD) for the same three parameters by comparing the connectivity map of each neuron with the convolved map (shown in Figure 6A). The corresponding measurements were 0.02 mm, 0.31 mm, and 0.09 mm2, demonstrating a modest variation among these 13 CA3b interneurons.
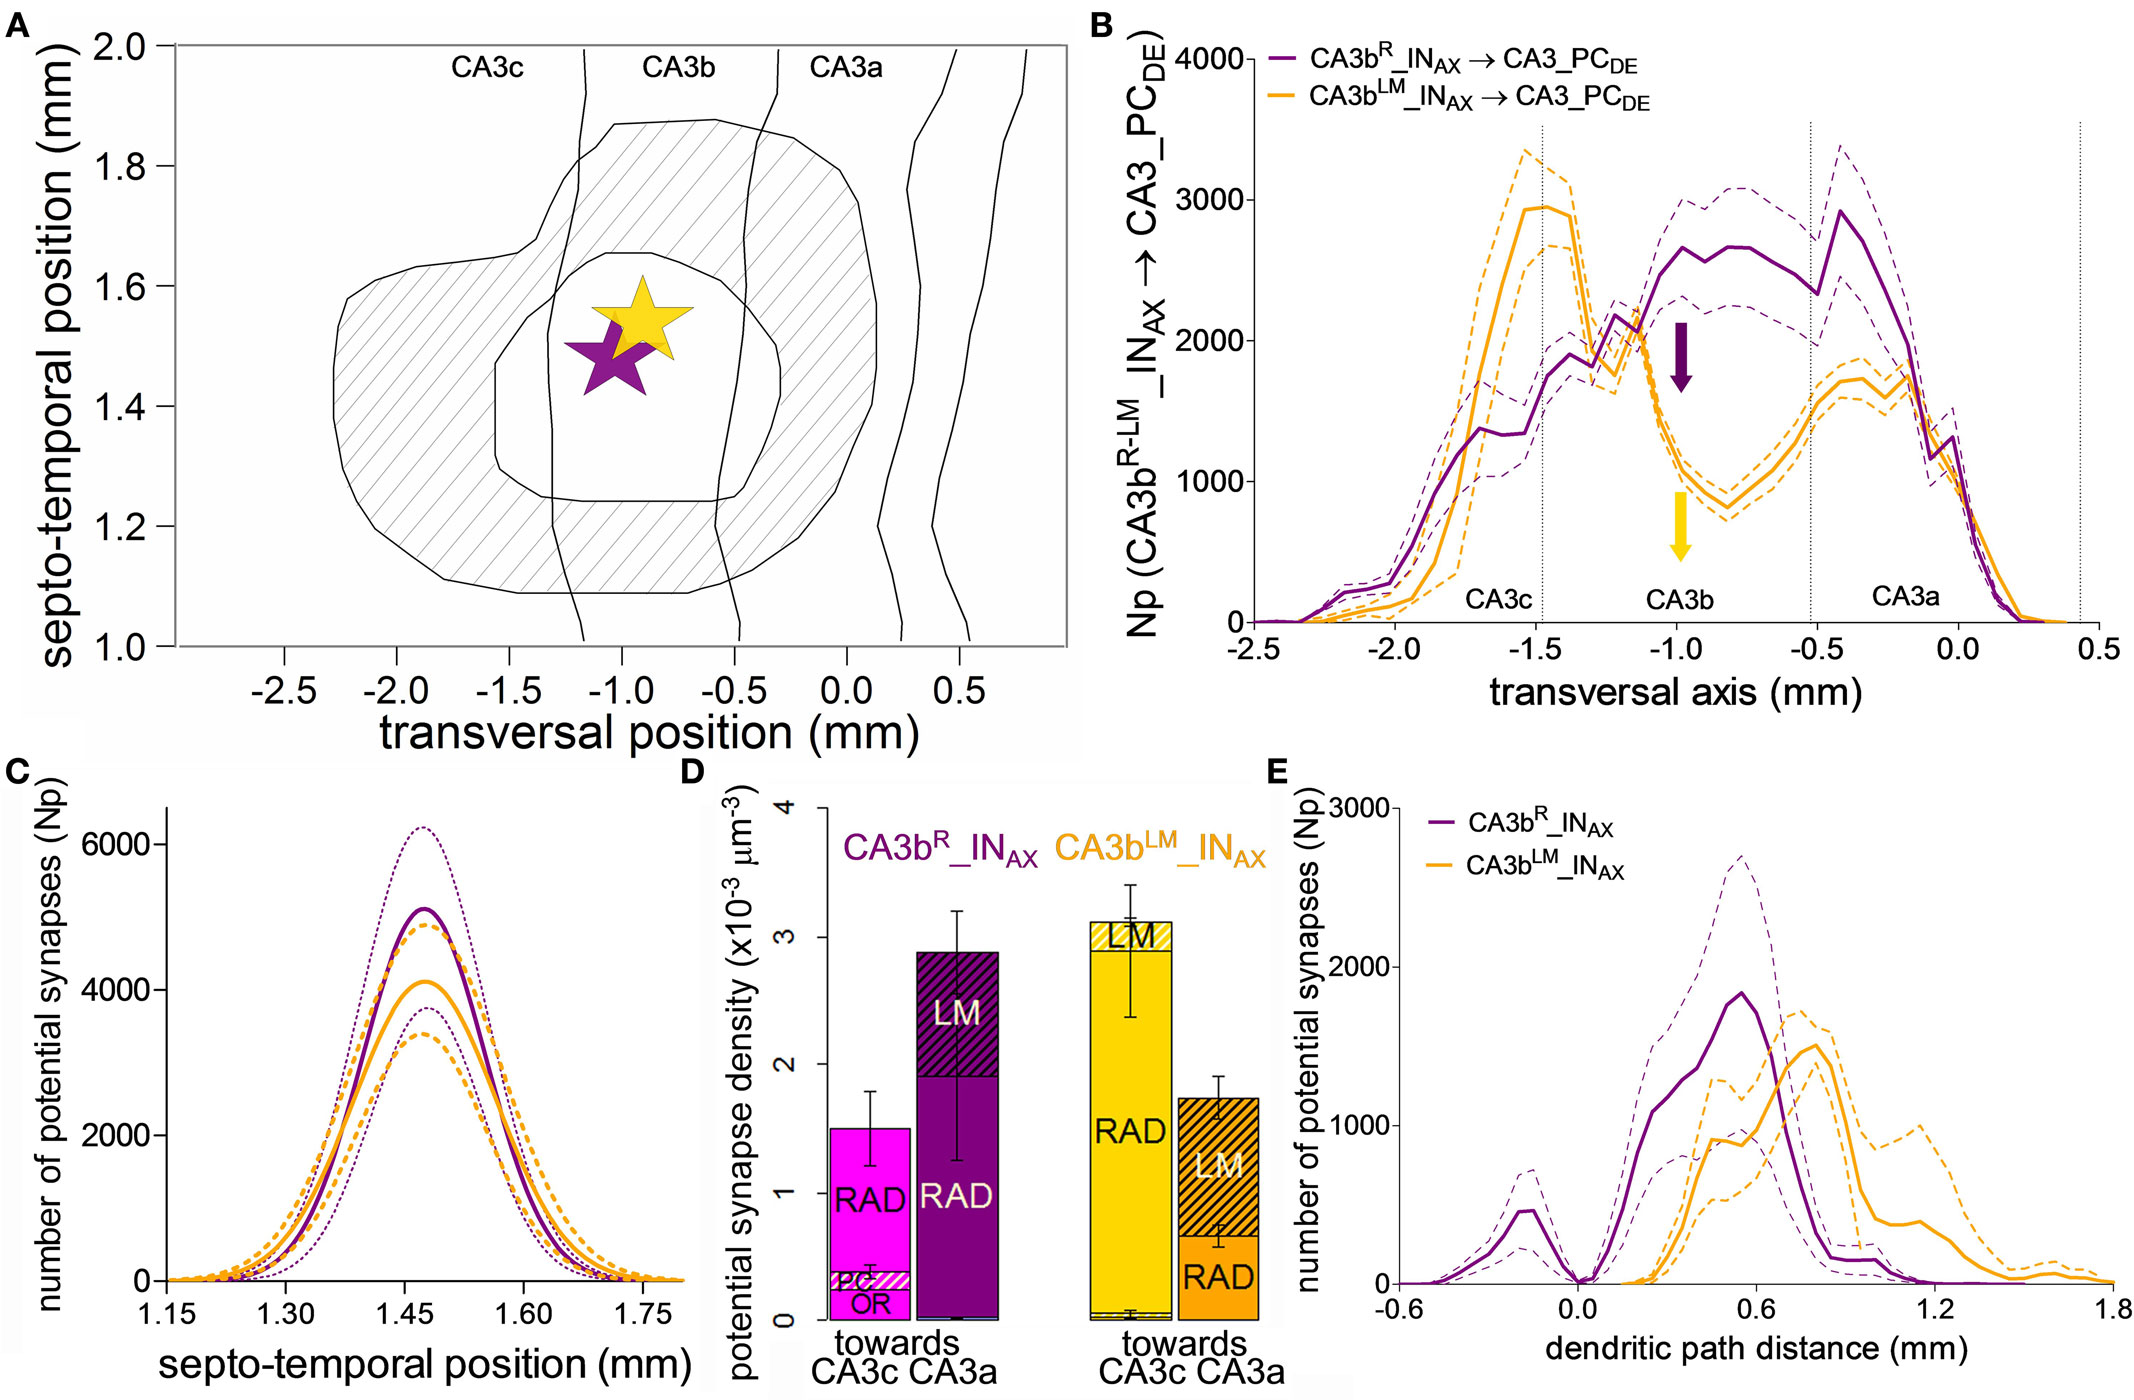
Figure 6. Potential connectivity analysis for CA3b interneurons onto CA3 pyramidal cells. (A) Map of the convolved common area of potential synapses formed by the axons of 13 CA3b interneurons with somata in the radiatum (R) or lacunosum-moleculare (LM) layers onto CA3 pyramidal cell dendrites. The inner closed line represents the area in which all pre-synaptic cells establish potential synapses. The outer close line delineates the region in which any of these interneurons makes potential contacts. The star marks the average somatic location of all 13 cells. The size of the star approximately corresponds to the location range. There were no statistically significant differences in the septo-temporal and transversal positions between the R and LM neurons. (B) Mean potential synapse distributions and 95% confidence intervals for six CA3bR_INAX (purple) and seven CA3bLM_INAX (gold) along the transversal axis. The solid colored arrows indicate the average transversal positions of the somata. The vertical dashed lines demarcate the boundaries between the three CA3 sub-regions. (C) Gaussian fits of the means and 95% confidence intervals for the septo-temporal distributions of potential synapses. (D) Transversal patterns (“toward CA3c” vs. “toward CA3a”) and layer specificity in potential synapse densities for the two CA3b interneuron types. (E) Potential synapse distribution along the dendritic path distance of CA3 pyramidal cells.
Interestingly, however, the two groups of interneurons can be clearly differentiated based on their potential connectivity patterns along the transverse axis (Figure 6B). The number of potential synapses from CA3bR_INAX gradually increases from CA3c, peaking just past the CA3b/CA3a border, and dropping sharply within CA3a. In contrast, CA3bLM_INAX displays a bimodal distribution, with a prominent potential synapse peak at the CA3c/CA3b border, a dip in the middle of CA3b, and a secondary peak in CA3a. In contrast, the potential connectivity patterns along the septo-temporal position are symmetric around the somata and indistinguishable between the two interneuron types (Figure 6C).
The differences along the transverse axis suggest opposite propensities of CA3bR_INAX and CA3bLM_INAX to make potential contacts toward CA3c and CA3a, respectively, as evidenced by potential synaptic density analysis (Figure 6D). Further inspection of layer specificity shows in the density bar graphs that the minor proportion of potential contacts in the oriens layer is unique of CA3bR_INAX cells, and entirely confined to the CA3c region. In contrast, in both groups the concentration of potential contacts in LM grows toward CA3a. The lack of CA3bLM_INAX potential synapses in oriens is reflected in the distribution along the dendritic path distance of the target PCs (Figure 6E), which is similar for the two interneuron types on the apical, but not basal arbors. Lastly, interneurons with higher and lower dendritic branch numbers (called HiDe and LoDe in Ascoli et al., 2009) cannot be distinguished by their potential connectivity (not shown).
Discussion
The approach introduced here enables the analysis of potential connectivity patterns from individual axo-dendritic overlaps across the entire hippocampus. The spatial scale defined by the span of whole axonal arborizations bridges the conceptual levels of potential synapses and regional anatomy. The hippocampus is especially suitable for studying systems-level connectivity, because of its unique structural organization and relative wealth of cellular morphological data. At the same time, the highly diverse hippocampal principal cells and interneurons form complex microcircuits whose computational function is only beginning to be understood. Functionally, the hippocampus is theorized to play a central role in spatial navigation and memory processing. Thus, our results might facilitate incorporation of realistic connectivity patterns into models investigating structure–function relationship.
We observe unique distributions of potential synapses across the various sub-regions and cyto-architectonic layers of the hippocampus, based on entire axonal reconstructions from seven neuron types and the dendritic arbors representing the whole CA PC network. Although axonal morphology constitutes the most prominent determinant of synaptic connectivity, the present study demonstrates the importance of integration both across data sources and data types. The 3D whole-hippocampus reconstruction enables the embedding of complete axonal arbors traced from disparate histological preparations into the same framework (e.g., Scorcioni and Ascoli, 2005; Ascoli et al., 2009; Ropireddy et al., 2011). Moreover, the dense dendritic embedding allows actual computation of potential synaptic maps, as well as quantitative analysis such as the dendritic and axonal distributions of potential contacts and the ratio between the numbers of actual and potential synapses.
In this analysis, the pre-synaptic neuron, the post-synaptic neuron, and the embedding tissue are reconstructed from different animals. Thus, this framework cannot capture the specific correlations among pairs of cells within their surroundings. At the same time, potential connectivity patterns can reveal general statistical principles of the specific interaction probabilities among particular cell classes that might apply across individuals. In particular, if validated with a larger sample, the CA3 axonal potential connectivity might indicate that proximal CA3c neurons (toward hilus) communicate primarily with CA1, while distal CA3 neurons (e.g., in CA3b) mostly form recurrent axo-dendritic overlaps within CA3. Moreover, the strikingly different potential connectivity patterns of the two CA3c neurons (proximal and distal) suggest that even principal cells from the same sub-region can have contrasting potential synaptic distributions throughout the hippocampus. While this finding may have interesting implications on the information processing in CA3 and CA1, the empirical observation must be corroborated on a representative sample of neurons before generalizing to the whole population of proximal and distal CA3 PCs.
We adopted the concept of potential synapses to characterize circuitry based on light microscopy data. Functionally, potential connectivity relates to the capability to create actual synapses leveraging the structural plasticity of dendritic spines and axonal boutons (Holtmaat and Svoboda, 2009). Evidence for this phenomenon is particularly compelling in the hippocampus, where it might bear direct functional relevance to information storage (Chklovskii et al., 2004). From this viewpoint, it is interesting to evaluate the ratio of actual to potential synapses, called connectivity fraction (Escobar et al., 2008) or filling fraction (Stepanyants et al., 2002). The only available dense electron microscopy reconstruction of a small hippocampal volume from the rat CA1 radiatum layer (Mishchenko et al., 2010) confirmed earlier estimates of connectivity fraction in the 0.20–0.25 range. Considering, as in these recent and earlier reports (Bannister and Larkman, 1995; Megias et al., 2001), bouton and/or spine counts as proxies for actual synapse numbers, we obtain values fully consistent with the existing data for that region. At the same time, our results can be further used to derive the connectivity fractions for other components of the hippocampal circuit.
Dentate mossy fibers are estimated to form ∼18 mossy terminals each (Acsady et al., 1998; Henze et al., 2000), leading to connectivity fractions of 0.17–0.18 in all three sub-fields CA3a,b,c. Similarly, the bouton numbers reported for the proximal CA3c pyramidal axon (Wittner et al., 2007) combined with our potential synapse count yield an overall connectivity fraction of ∼0.23. However, this value changes drastically throughout the hippocampus, from 0.06 in CA1 OR to ∼0.17 in CA3 OR and RAD, to 0.32 in CA1 RAD. This differentiation by sub-region and layer emphasizes the importance of analyzing connectivity through the entire anatomical region invaded by an axonal arborization as opposed to the narrow region of interest typically covered by electron microscopy.
Summing together the potential synapses made by the four analyzed pyramidal axons on all PC dendrites, ∼26% of the contacts are made in the oriens layer, and ∼59% in radiatum. These fractions, virtually identical in CA3 and CA1, can be compared to the relative densities of dendritic spines observed in the same layers. The values in CA3 (Drakew et al., 1996) constitute an almost perfect match, with 28% of spines in oriens and 59% in radiatum. Such correspondence suggests equal overall connectivity fraction between basal and apical dendrites. Interestingly, the proportion of CA1 spines found in radiatum (∼55%) is also very similar to the potential synapse fraction, while the value in oriens (∼39%) is higher (Bannister and Larkman, 1995; Megias et al., 2001), consistent with the addition of recurrent collaterals from CA1 PCs on the basal dendrites.
A drawback of this study is that the potential connectivity patterns are based on only one axonal reconstruction for each principal neuron. This is due to the difficulty of obtaining complete digital reconstructions of projecting axons from extremely laborious in vivo preparations. With the more contained interneurons, axons can be reconstructed from slices, enabling analysis of larger samples. In the case of CA3b Radiatum and LM cells, we found different potential synaptic patterns across the transversal axis (i.e., among the CA3 sub-fields). Our previous intrinsic morphometric analysis could not detect these differences between the two groups (Ascoli et al., 2009). This observation stresses the importance of studying connectivity patterns within the context of a 3D system-level anatomical framework.
Based on the axonal and dendritic reconstruction data available in NeuroMorpho.Org, our computational framework can allow the estimation of potential interconnectivity of additional neuron classes in the rodent hippocampus. In particular, complete axonal reconstructions of principal neurons from posterior–ventral region of CA3, CA1a, CA1b, CA1c, subiculum, and entorhinal cortex layer 2 (e.g., Scorcioni and Ascoli, 2005) can be embedded to map their hippocampal potential connectivity. Similarly, 18 axonal reconstructions of interneurons from DG hilus, CA3 stratum lucidum, and CA1 stratum oriens can also be included in future studies. Additionally, 223 dendritic reconstructions of interneurons throughout all DG, CA3, and CA1 sub-fields and layers can be embedded to extend all potential connectivity maps beyond the PC targets examined here. It is also expected that the number of available reconstructions will continue to grow, enabling further refinements of these results.
Comparing the potential connectivity obtained for the same pre-synaptic cells, but using the dendritic trees of different neuronal classes (e.g., interneurons vs. PCs), can also be useful as a control to examine the role of dendritic specificity in establishing potential synapses. This could be achieved, for example, by contrasting the connectivity patterns of CA3 pyramidal axons to CA1 basket cell dendrites with those to CA1 PC dendrites. An alternative possibility is to use random cable for the dendrite as a control. These extensions will be explored in future investigations.
Conflict of Interest Statement
The authors declare that the research was conducted in the absence of any commercial or financial relationships that could be construed as a potential conflict of interest.
Acknowledgments
We are indebted to Dr. Diek Wheeler and Mr. David Hamilton for their valuable feedback on an earlier version of this manuscript. Grant sponsors: National Institute of Health NS39600 and NS058816, Office of Naval Research MURI N00014-10-1-0198 to Giorgio A. Ascoli.
Footnotes
References
Acsady, L., Kamondi, A., Sik, A., Freund, T., and Buzsaki, G. (1998). GABAergic cells are the major post-synaptic targets of mossy fibers in the rat hippocampus. J. Neurosci. 18, 3386–3403.
Amaral, D. G., and Witter, M. P. (1989). The three-dimensional organization of the hippocampal formation: a review of anatomical data. Neuroscience 31, 571–591.
Amirikian, B. (2005). A phenomenological theory of spatially structured local synaptic connectivity. PLoS Comput. Biol. 1, e11. doi: 10.1371/journal.pcbi.0010011
Ascoli, G. A., Brown, K. M., Calixto, E., Card, J. P., Galvan, E. J., Perez-Rosello, T., and Barrionuevo, G. (2009). Quantitative morphometry of electrophysiologically identified CA3b interneurons reveals robust local geometry and distinct cell classes. J. Comp. Neurol. 515, 677–695.
Ascoli, G. A., Donohue, D. E., and Halavi, M. (2007). NeuroMorpho.org: a central resource for neuronal morphologies. J. Neurosci. 27, 9247–9251.
Bannister, N. J., and Larkman, A. U. (1995). Dendritic morphology of CA1 pyramidal neurones from the rat hippocampus: II. Spine distributions. J. Comp. Neurol. 360, 161–171.
Bressler, S. L., and Menon, V. (2010). Large-scale brain networks in cognition: emerging methods and principles. Trends Cogn. Sci. (Regul. Ed.) 14, 277–290.
Brown, K. M., Donohue, D. E., D’Alessandro, G., and Ascoli, G. A. (2005). A cross-platform freeware tool for digital reconstruction of neuronal arborizations from image stacks. Neuroinformatics 3, 343–360.
Bullmore, E., and Sporns, O. (2009). Complex brain networks: graph theoretical analysis of structural and functional systems. Nat. Rev. Neurosci. 10, 186–198.
Carnevale, N. T., Tsai, K. Y., Claiborne, B. J., and Brown, T. H. (1997). Comparative electrotonic analysis of three classes of rat hippocampal neurons. J. Neurophysiol. 78, 703–720.
Claiborne, B. J., Amaral, D. G., and Cowan, W. M. (1990). Quantitative, three-dimensional analysis of granule cell dendrites in the rat dentate gyrus. J. Comp. Neurol. 302, 206–219.
Chklovskii, D. B., Mel, B. W., and Svoboda, K. (2004). Cortical rewiring and information storage. Nature 431, 782–788.
Drakew, A., Muller, M., Gahwiler, B. H., Thompson, S. M., and Frotscher, M. (1996). Spine loss in experimental epilepsy: quantitative light and electron microscopic analysis of intracellularly stained CA3 pyramidal cells in hippocampal slice cultures. Neuroscience 70, 31–45.
Eichenbaum, H., and Cohen, N. J. (2001). From Conditioning to Conscious Recollection: Memory Systems of the Brain. Upper Saddle River, NJ: Oxford University.
Escobar, G., Fares, T., and Stepanyants, A. (2008). Structural plasticity of circuits in cortical neuropil. J. Neurosci. 28, 8477–8488.
Fiala, J. C. (2005). Reconstruct: a free editor for serial section microscopy. J. Microsc. 218(Pt 1), 52–61.
Harris, K. M. (1999). Structure, development, and plasticity of dendritic spines. Curr. Opin. Neurobiol. 9, 343–348.
Harris, K. M., and Stevens, J. K. (1989). Dendritic spines of CA1 pyramidal cells in the rat hippocampus: serial electron microscopy with reference to their biophysical characteristics. J. Neurosci. 9, 2982–2997.
Henze, D. A., Cameron, W. E., and Barrionuevo, G. (1996). Dendritic morphology and its effects on the amplitude and rise-time of synaptic signals in hippocampal CA3 pyramidal cells. J. Comp. Neurol. 369, 331–344.
Henze, D. A., Urban, N. N., and Barrionuevo, G. (2000). The multifarious hippocampal mossy fiber pathway: a review. Neuroscience 98, 407–427.
Holtmaat, A., and Svoboda, K. (2009). Experience-dependent structural synaptic plasticity in the mammalian brain. Nat. Rev. Neurosci. 10, 647–658.
Honey, C. J., Sporns, O., Cammoun, L., Gigandet, X., Thiran, J. P., Meuli, R., and Hagmann, P. (2009). Predicting human resting-state functional connectivity from structural connectivity. Proc. Natl. Acad. Sci. U.S.A. 106, 2035–2040.
Ishizuka, N., Cowan, W. M., and Amaral, D. G. (1995). A quantitative analysis of the dendritic organization of pyramidal cells in the rat hippocampus. J. Comp. Neurol. 362, 17–45.
Ishizuka, N., Weber, J., and Amaral, D. G. (1990). Organization of intrahippocampal projections originating from CA3 pyramidal cells in the rat. J. Comp. Neurol. 295, 580–623.
Jaffe, D. B., and Carnevale, N. T. (1999). Passive normalization of synaptic integration influenced by dendritic architecture. J. Neurophysiol. 82, 3268–3285.
Kalisman, N., Silberberg, G., and Markram, H. (2003). Deriving physical connectivity from neuronal morphology. Biol. Cybern. 88, 210–218.
Kalisman, N., Silberberg, G., and Markram, H. (2005). The neocortical microcircuit as a tabula rasa. Proc. Natl. Acad. Sci. U.S.A. 102, 880–885.
Knott, G. W., Holtmaat, A., Wilbrecht, L., Welker, E., and Svoboda, K. (2006). Spine growth precedes synapse formation in the adult neocortex in vivo. Nat. Neurosci. 9, 1117–1124.
Lendvai, B., Stern, E. A., Chen, B., and Svoboda, K. (2000). Experience-dependent plasticity of dendritic spines in the developing rat barrel cortex in vivo. Nature 404, 876–881.
Li, X. G., Somogyi, P., Ylinen, A., and Buzsaki, G. (1994). The hippocampal CA3 network: an in vivo intracellular labeling study. J. Comp. Neurol. 339, 181–208.
Megias, M., Emri, Z., Freund, T. F., and Gulyas, A. I. (2001). Total number and distribution of inhibitory and excitatory synapses on hippocampal CA1 pyramidal cells. Neuroscience 102, 527–540.
Mishchenko, Y., Hu, T., Spacek, J., Mendenhall, J., Harris, K. M., and Chklovskii, D. B. (2010). Ultrastructural analysis of hippocampal neuropil from the connectomics perspective. Neuron 67, 1009–1020.
Press, W. H. (1988). Numerical Recipes in C: The Art of Scientific Computing. Cambridge: Cambridge University Press.
Pyapali, G. K., Sik, A., Penttonen, M., Buzsaki, G., and Turner, D. A. (1998). Dendritic properties of hippocampal CA1 pyramidal neurons in the rat: intracellular staining in vivo and in vitro. J. Comp. Neurol. 391, 335–352.
Pyapali, G. K., and Turner, D. A. (1994). Denervation-induced dendritic alterations in CA1 pyramidal cells following kainic acid hippocampal lesions in rats. Brain Res. 652, 279–290.
Pyapali, G. K., and Turner, D. A. (1996). Increased dendritic extent in hippocampal CA1 neurons from aged F344 rats. Neurobiol. Aging 17, 601–611.
Rapp, P. R., and Gallagher, M. (1996). Preserved neuron number in the hippocampus of aged rats with spatial learning deficits. Proc. Natl. Acad. Sci. U.S.A. 93, 9926–9930.
Ropireddy, D., Bachus, S., Scorcioni, R., and Ascoli, G. A. (2008). “Computational neuroanatomy of the rat hippocampus: implications and application to epilepsy,” in Computational Neuroscience in Epilepsy, eds I. Soltesz, and K. Staley (San Diego: Elsevier), 71–85.
Ropireddy, D., Scorcioni, R., Lasher, B., Buzsaki, G., and Ascoli, G. A. (2011). Axonal morphometry of hippocampal pyramidal neurons semi-automatically reconstructed after in vivo labeling in different CA3 locations. Brain Struct. Funct. 216, 1–15.
Scorcioni, R., and Ascoli, G. A. (2005). Algorithmic reconstruction of complete axonal arborizations in rat hippocampal neurons. Neurocomputing 65–66, 15–22.
Scorcioni, R., Bouteiller, J., and Ascoli, G. A. (2002). A real-scale anatomical model of the dentate gyrus based on single cell reconstructions and 3D rendering of a brain atlas. Neurocomputing 44–46, 629–634.
Sik, A., Tamamaki, N., and Freund, T. F. (1993). Complete axon arborization of a single CA3 pyramidal cell in the rat hippocampus, and its relationship with postsynaptic parvalbumin-containing interneurons. Eur. J. Neurosci. 5, 1719–1728.
Silberschatz, A., Galvin, P. B., and Gagne, G. (2009). Operating System Concepts. San Francisco, CA: Wiley, John & Sons.
Spacek, J., and Hartmann, M. (1983). Three-dimensional analysis of dendritic spines. I. Quantitative observations related to dendritic spine and synaptic morphology in cerebral and cerebellar cortices. Anat. Embryol. 167, 289–310.
Sporns, O., Tononi, G., and Kotter, R. (2005). The human connectome: a structural description of the human brain. PLoS Comput. Biol. 1, e42. doi: 10.1371/journal.pcbi.0010042
Squire, L. R., and Zola-Morgan, S. (1991). The medial temporal lobe memory system. Science 253, 1380–1386.
Stepanyants, A., and Chklovskii, D. B. (2005). Neurogeometry and potential synaptic connectivity. Trends Neurosci. 28, 387–394.
Stepanyants, A., Hirsch, J. A., Martinez, L. M., Kisvarday, Z. F., Ferecsko, A. S., and Chklovskii, D. B. (2008). Local potential connectivity in cat primary visual cortex. Cereb. Cortex 18, 13–28.
Stepanyants, A., Hof, P. R., and Chklovskii, D. B. (2002). Geometry and structural plasticity of synaptic connectivity. Neuron 34, 275–288.
Stepanyants, A., Tamas, G., and Chklovskii, D. B. (2004). Class-specific features of neuronal wiring. Neuron 43, 251–259.
Tamamaki, N., Abe, K., and Nojyo, Y. (1988). Three-dimensional analysis of the whole axonal arbors originating from single CA2 pyramidal neurons in the rat hippocampus with the aid of a computer graphic technique. Brain Res. 452, 255–272.
Tamamaki, N., and Nojyo, Y. (1991). Crossing fiber arrays in the rat hippocampus as demonstrated by three-dimensional reconstruction. J. Comp. Neurol. 303, 435–442.
Turner, D. A., Li, X. G., Pyapali, G. K., Ylinen, A., and Buzsaki, G. (1995). Morphometric and electrical properties of reconstructed hippocampal CA3 neurons recorded in vivo. J. Comp. Neurol. 356, 580–594.
Wierenga, C. J., Becker, N., and Bonhoeffer, T. (2008). GABAergic synapses are formed without the involvement of dendritic protrusions. Nat. Neurosci. 11, 1044–1052.
Keywords: rat hippocampus, potential synapses, connectivity, 3D model, CA pyramidal axons, dentate mossy fiber, CA3b interneuron axons, computational
Citation: Ropireddy D and Ascoli GA (2011) Potential synaptic connectivity of different neurons onto pyramidal cells in a 3D reconstruction of the rat hippocampus. Front. Neuroinform. 5:5. doi: 10.3389/fninf.2011.00005
Received: 27 April 2011; Accepted: 20 June 2011;
Published online: 04 July 2011.
Edited by:
Olaf Sporns, Indiana University, USAReviewed by:
Hermann Cuntz, University College London, UKChristina Weaver, Franklin and Marshall College, USA
Copyright: © 2011 Ropireddy and Ascoli. This is an open-access article subject to a non-exclusive license between the authors and Frontiers Media SA, which permits use, distribution and reproduction in other forums, provided the original authors and source are credited and other Frontiers conditions are complied with.
*Correspondence: Giorgio A. Ascoli, Center for Neural Informatics, Structures and Plasticity, Krasnow Institute for Advanced Study, George Mason University, 4400 University Drive, Fairfax, VA 22030, USA. e-mail: ascoli@gmu.edu