Tracing activity across the whole brain neural network with optogenetic functional magnetic resonance imaging
- 1 Department of Electrical Engineering, University of California Los Angeles, Los Angeles, CA, USA
- 2 Department of Psychiatry and Biobehavioral Sciences, University of California Los Angeles, Los Angeles, CA, USA
- 3 Department of Radiology, University of California Los Angeles, Los Angeles, CA, USA
- 4 Department of Neuroscience, University of California Los Angeles, Los Angeles, CA, USA
- 5 Biomedical Engineering Interdepartmental Program, University of California Los Angeles, Los Angeles, CA, USA
Despite the overwhelming need, there has been a relatively large gap in our ability to trace network level activity across the brain. The complex dense wiring of the brain makes it extremely challenging to understand cell-type specific activity and their communication beyond a few synapses. Recent development of the optogenetic functional magnetic resonance imaging (ofMRI) provides a new impetus for the study of brain circuits by enabling causal tracing of activities arising from defined cell types and firing patterns across the whole brain. Brain circuit elements can be selectively triggered based on their genetic identity, cell body location, and/or their axonal projection target with temporal precision while the resulting network response is monitored non-invasively with unprecedented spatial and temporal accuracy. With further studies including technological innovations to bring ofMRI to its full potential, ofMRI is expected to play an important role in our system-level understanding of the brain circuit mechanism.
Human brains form highly complex circuits where the circuit elements communicate using electrical and/or chemical signals. It consists of approximately 100 billion neurons and many more glial cells. Furthermore, the hundreds of billions of neurons and glial cells also come in various different cell types, which can be categorized based on their shape, location, genetic properties, and the chemicals used for communication. It has been extremely difficult to spatially distinguish pertinent elements, adding complexity to the understanding of a circuit’s connection topology and function. Different state-of-the art methods to understand brain circuits include microscopic approaches looking at small-scale connections with electron (Briggman and Denk, 2006; Bock et al., 2011; Briggman et al., 2011) and light microscopy (Livet et al., 2007; Micheva and Smith, 2007; Choe et al., 2008), and larger scale connection topologies using light microscopy of brain sections across the whole brain (Bohland et al., 2009), and diffusion tensor MRI (Mori and Zhang, 2006). However, one of the most important approaches in understanding complex circuits, as is often used with electronic circuits, is the ability to trigger specific circuit elements with high temporal precision while monitoring the global network response in an intact circuit. The new optogenetic (Boyden et al., 2005; Zhang et al., 2006, 2007a,b) functional magnetic resonance imaging (ofMRI; Lee et al., 2010) has the potential to enable such processes for brain circuits. Optogenetic stimulation allows for cell-type specific stimulation with high temporal precision while the network response is measured non-invasively across the whole brain. This approach allows brain circuits to be systematically analyzed in normal and diseased conditions where it not only provides tracing of activity throughout the brain but has the potential to serve as an in vivo quantitative biomarker that can be directly correlated with normal and diseased phenotypes.
Brain Circuit Analysis and Debugging with ofMRI
Optogenetics (Boyden et al., 2005; Zhang et al., 2006, 2007a,b), is a revolutionary technology in which single-component microbial light-activated trans-membrane conductance regulators are introduced into specifically targeted cell types using genetic approaches allowing millisecond-scale targeted activity modulation in vivo (Aravanis et al., 2007). Channelrhodopsin (ChR2) is a monovalent cation channel that allows Na+ ions to enter the cell following exposure to 470 nm blue light, whereas Halorhodopsin (NpHR) is a chloride pump that activates upon illumination with 580 nm yellow light. As the optimum activation wavelength of these two proteins are over 100 nm apart, they can be controlled independently to either initiate action potential firing or suppress neural activity in intact tissue, and together may modulate neuronal synchrony. Both proteins have fast temporal kinetics, on the scale of milliseconds, making it possible to drive reliable trains of high frequency action potentials in vivo using ChR2 and suppress single action potentials within high frequency spike trains using NpHR. Recent developments in optogenetics also provide a wide range of additional tools including more accurate temporal kinetics (Gunaydin et al., 2010), step function control (Berndt et al., 2009), and higher sensitivity to light (Gradinaru et al., 2008; Chow et al., 2010). Thus far, one of the greatest challenges in neuroscience has been the difficulty of selectively controlling different circuit elements due to the dense complex wiring of many different cell types. Optogenetics, by enabling in vivo control of genetically targeted circuit elements, represents an exciting new opportunity for addressing these complicated issues.
The ofMRI technology (Lee et al., 2010; Figures 1 and 2), by combining optogenetics with fMRI, allows precise control of brain circuit elements and in vivo visualization of the resulting causal effects on the brain. In the first study demonstrating ofMRI (Lee et al., 2010), brain circuit elements were successfully controlled and monitored based on their genetic identity, cell body location, and axonal projection target. Selective excitation of excitatory neurons with cell body in M1 cortex resulted in robust activity measurement in local cortex (Figure 1) and distal areas including striatum, and thalamus (Figure 2). It was also demonstrated that the neural activity is more accurately mapped throughout the brain using the passband bSSFP–fMRI technique (Lee et al., 2008) compared to the conventional GRE-BOLD fMRI technique (Figure 2). The temporal dynamics of the fMRI signal was also shown to have strong correlations with the electrophysiological measurements indicating that the fMRI hemodynamic response accurately reflects temporal neural activity pattern (Figure 2 in Lee et al., 2010). Targeting excitatory neurons in anterior and posterior thalamus also demonstrated robust local and long-range activity consistent with the existing literature regarding network connectivity of each region (Figure 4 in Lee et al., 2010). In addition, selective excitation of axonal fibers projecting from M1 cortex within the thalamus, by selective expression of ChR2 in excitatory neurons with cell body in the M1 cortex and optical stimulation in the thalamus, showed that wiring patterns in addition to genetic identity can be used to selectively target and monitor the brain circuitry (Figure 3 in Lee et al., 2010). These findings demonstrate basic feasibility on how ofMRI defines a potent tool that is suitable for functional circuit analysis as well as global phenotyping of dysfunctional circuitry.
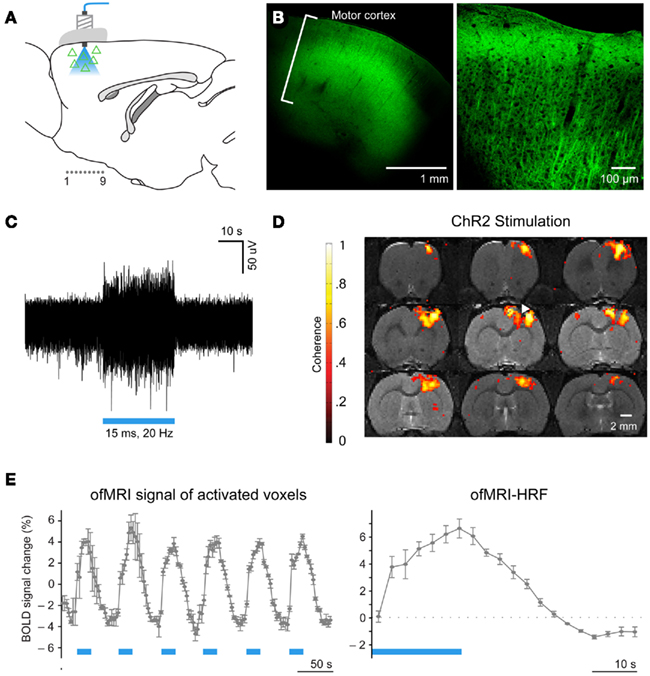
Figure 1. Optogenetic functional magnetic resonance imaging enables systematic brain circuit analysis through cell-type specific stimulation and non-invasive monitoring of the activity throughout the whole brain. (A) Schematic: transduced cells (triangles) and blue light delivery shown in M1. Coronally imaged slices in (D) marked as “1.0.9.” (B) Confocal images of ChR2–EYFP expression in M1. (C) Extracellular optrode recordings during 473 nm optical stimulation (20Hz/15 ms pulsewidth). (D) BOLD activation is observed at or near the site of optical stimulation in animals injected with AAV5–CaMKIIα::ChR2–EYFP (white arrowhead: injection/stimulation site). Coronal slices are consecutive and 0.5 mm thick. (E), Left: ofMRI hemodynamic response during 6 epochs of optical stimulation at 20 Hz/15 ms 473 nm light stimulation repeated every 60 s (blue bars). Hemodynamic response averaged across all voxels with coherence coefficient >0.35 in motor cortex. Right, Mean of all stimulation epochs. (Modified Figure from Lee et al., 2010).
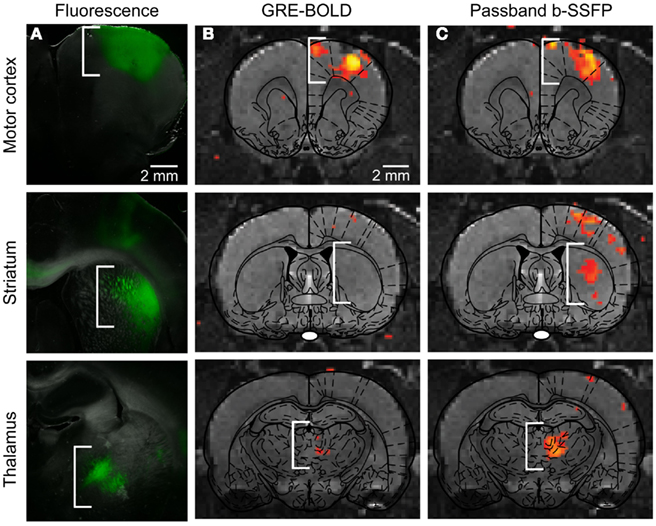
Figure 2. (A) Injection of CaMKIIα::ChR2-EYFP in M1, as expected, leads to opsin expression in motor cortex, striatum, and thalamus, i.e., the primary site of injection and sites targeted by the axonal projection of expressing neurons. (B) Conventional BOLD fMRI activity map superimposed onto appropriate anatomical and atlas images. (C) Passband bSSFP-fMRI activity map superimposed onto appropriate anatomical and atlas images, which more fully captures circuit-level activity. (Modified supplemental Figure from Lee et al., 2010).
Tracing the Brain Connection Topology and Activity
To compare the nature of different information obtained using various methods to understand the connectivity of the brain, let us consider a simple model of the brain (Figure 3A). Assume a brain that has three distinct areas (nodes labeled A–C), with connections originating from each area with the number of connections from one node to another ranging from 1 to 4. For simplicity, let us further assume that a given node is either excitatory (red triangle) or inhibitory (blue square). We will further assume that conflicting signals received from different nodes is resolved by majority vote. For example, if four inhibitory inputs and three excitatory inputs are received, the node will be inhibited. We also assume all nodes are synchronized where τ is the time it takes for each node to trigger the next node and that external stimulation results in an immediate state change at the stimulated node, which allows us to assume a discrete time model where n is the time variable with the discrete time interval τ. While the realistic scenario is obviously much more complex than what is represented here, this simple model brain can help illustrate how different techniques address distinct pieces of the puzzle in our effort to understand the brain circuit. The model brain described above can be summarized with Eq. 1, where G is the connectivity matrix with entry values that can range from −4 to 4, X(n) and Y(n) are the stimulus input vector and the activity at a given time n with values of 0 (not active) or 1 (active). G will then be a 3 by 3 matrix, X(n) and Y(n) will be 3 by 1 vectors. u is the unit step function applied to each vector components separately.
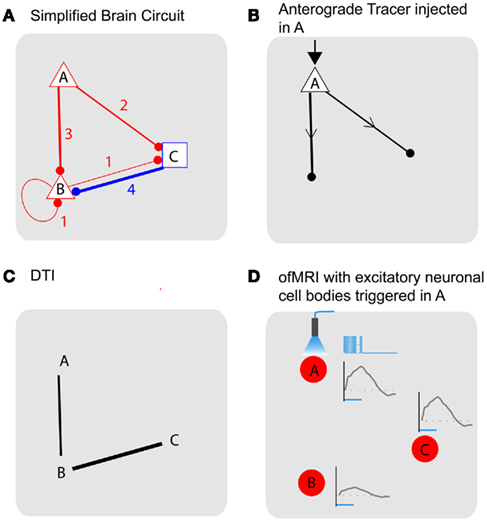
Figure 3. Tracing brain pathways: simplified model of brain demonstrates nature of the different information obtained using the current state-of-the art methods. (A) Simplified model brain with three distinct areas labeled A–C. Each area has connections originating from one area connecting to another with the number of connections that range from 1 to 4. Each node is also characterized as excitatory (red triangle) or inhibitory (blue square). (B) Anatomical tracing with anterograde tracers that do not cross synapses. (C) Diffusion tensor MRI has the potential to reveal large-scale axonal connections without connection type and directional information. (D) ofMRI with stimulation of the excitatory neurons with cell bodies at node A.1/6τ Hz, 3τ s duration (τ = 4 ms) stimulation, repeated every 1 min for 20 s duration will result in 1/6τ Hz activity in all three nodes. Node B activity will be at τ duration while A and C have 3τ duration. Node B and C activity will also be delayed by τ (Table 1). The color of the node (red) represent the expected positive BOLD signal from the increased activity at all three nodes synchronized with the stimulation cycle. Blue time course on the right of node Are presents temporally encoded optogenetic stimulation and the gray time curves show the temporal firing patterns captured through ofMRI–HRF. ofMRI is expected to reflect network activity pattern determined by the cell types involved, network connection topology, and temporal stimulation pattern.

For the model brain outlined in Figure 3A, the G matrix is as follows with a zero-state initial condition.
The tracer methods (Raju and Smith, 2006) based on viral and/or chemical tracers will provide anatomical information with directionality (Figure 3B). For example, if an anterograde tracer that does not cross synapses is injected into node A, the injection node will be highlighted with its axonal projections showing nodes that are directly connected with node A (B, C). Different types of tracers, for example, retrograde tracers (Miyamichi et al., 2011) will give information regarding which nodes the injected region receive axonal projections from. As demonstrated with this example, the tracer-based methods have the advantage of providing information about how different areas are connected with direction and cell type information. However, the main drawback of the method is that it does not allow in vivo evaluation of the connection, as well as the fact that the number of synapses that can be crossed by existing tracers is limited. Recent developments of powerful tracers with high level of specific control (Wall et al., 2010) and manganese ion (Mn2+, Pautler et al., 1998)-based MRI-sensitive in vivo fiber tract tracer potentially overcome some of the challenges. While individual tracer methods pose different pros and cons, the main information the tracing methods aims to obtain is the anatomical connectivity with directionality (Gij vs. Gji) and cell type (+, −).
Diffusion tensor imaging (DTI; Mori and Zhang, 2006) is an MR technique that relies on the restricted and/or anisotropic zero-displacement diffusion of metabolites (normally the most abundant water molecules are used) within and across different neural compartments (such as intra/extra cellular diffusion and diffusion within the myelin sheath etc.). Signal attenuation is observed whenever diffusion is present along the direction of the magnetic field gradients. The resulting diffusion ellipsoids for each voxel can then be concatenated in order to yield smooth trajectories that are assumed to be co-linear to the primary direction of the physical barriers, which cause the diffusion to be restricted/anisotropic in the first place. With DTI, large-scale connections can be measured without directionality, and without cell type information (Figure 3C). Due to limitations in spatial resolution and DTI technique’s ability to resolve directional ambiguities when fibers cross, the information that is obtained using DTI will be coarser than those obtained using tracer methods. However, DTI allows in vivo, non-invasive, and whole brain scanning ability, which enables the assessment of the connections in fully intact brain with the possibility of longitudinal assessment in living humans. Ideally, DTI aims to uncover the larger values of |Gij| + |Gji| (no direction, cell type information). In Figure 3C, the DTI image shows connections with |Gij| + |Gji| values over 3 as an example.
To fully understand the brain, temporal dynamics have to be resolved in addition to the anatomical connections. Traditionally, electrophysiological stimulation and recording hold an important place in the assessment of the activity. For activity assessment in an intact circuit, electrodes are placed in vivo where cells at a specific location are stimulated and/or recorded. However, one of the most significant difficulties with this approach has been the lack of cell type specificity in the stimulation (Histed et al., 2009), and the limited spatial information in the readout. With the lack of cell type specificity, it is difficult to interpret the resulting signal while the limited spatial information makes it difficult to trace the activity throughout the brain. fMRI (Ogawa et al., 1992; Bandettini and Wong, 1997; Song et al., 2000), on the other hand, while being a completely non-invasive technique with whole brain spatial information, also lacks cell-type specificity in stimulation with the conventional sensory stimulations and micro-electrode based stimulations (Tolias et al., 2005). Techniques such as resting-state fMRI (Fox and Raichle, 2007), while revealing valuable, completely non-invasive information about the network level connectivity, do not provide causal information. Modeling approaches to obtain causal information include the use of granger causality (Goebel et al., 2003) and dynamic causal modeling (Stephan and Friston, 2011).
ofMRI adds valuable new information since causal communication can be directly traced throughout the brain across multiple synapses with global activity pattern information in vivo. For example, if node A is excited, the downstream impact of such stimulation will be visualized across the whole brain with full spatial information. Assuming a stimulation with 1/6τ Hz, 3τ s duration (where, τ = 4 ms) repeated every 1 min for 20 s duration at node A [Figure 3D; Table 1; X(n)], one can potentially expect positive BOLD signal in all three nodes, since all three nodes will have increased neural activity at 1/6τ Hz with 3τ duration at node A and C and τ duration at node B [Table 1; Y(n)]. The amplitude of the ofMRI-measured response at node B could be 3 times smaller than the other nodes since it is three times less active. Alternatively, if continuous stimulation is applied at node A for 20 s every 1 min [Table 1; X(n)], one can expect positive BOLD signal in only node A and C since node B will not be active except for a mere τ s at the beginning of the 20-s stimulation [Table 1; Y(n)].
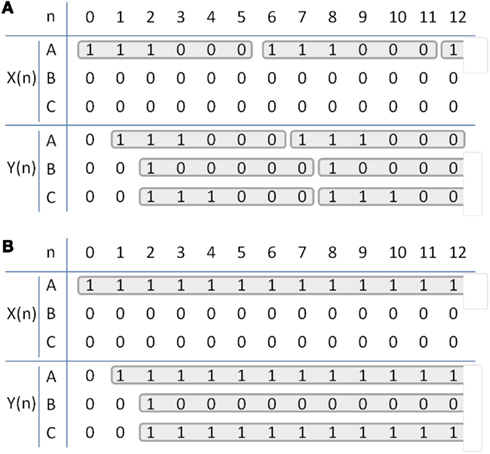
Table 1. Temporal dynamics of the simplified brain circuit. X(n) and Y(n) for an example stimulation of (A), 1/6τ Hz, 3τ s duration (τ = 4 ms), repeated every 1 min for 20 s at node A, and (B), constant stimulation repeated every 1 min for 20 s at node A. Each column represents signal value at every time interval τ.)
As illustrated through this simple example, temporal encoding of the stimulation, in addition to the anatomical connections and cell type, is expected to determine how activity propagates throughout the brain. ofMRI, for the first time, offers the potential to trace such activity throughout the whole brain with temporal accuracy. While the exact relationship between the neural activity and the observed ofMRI signal remains elusive, initial studies show that neural activity patterns are strongly correlated with the ofMRI hemodynamic response function (HRF; Figure 2 in Lee et al., 2010).
Discussion
While the published study (Lee et al., 2010) shows great promise in terms of the ofMRI technology’s capability to accurately trace neural activity across the whole brain, further investigation on neurovascular coupling is necessary to accurately trace neural activity. While the causal roles of the excitatory neurons have been investigated, causal roles of other cell types need to be further studied. In addition, triggering of any specific cell types will result in a cascade of activity in many different cell types that are connected to the primary neuron that is being modulated. Therefore, in order to study the one to one relationship between specific cell types and the resulting HRF, combinatorial approach of excitation and inhibition using ChR2 and NpHR will be necessary (see Pearl, 2002 for the use of inhibition to infer causality). For example, in order to study the role of excitatory neurons in generating the BOLD signal in the absence of activity in any other cell types, one can stimulate the excitatory neurons with ChR2 while inhibiting all other cell types using NpHR. Furthermore, ofMRI signal most likely represents a group average of neural activity since each imaging voxel is much larger than individual neurons. Each voxel can contain both excitation and inhibition. Therefore, investigating the relationship between how different mixture of activity is reflected in the ofMRI signal will be of great importance.
In addition to uncovering the cell-type specific roles in generating distinct HRFs, one can also utilize the temporally accurate control enabled by optogenetics to investigate the relationship between temporal signaling and the corresponding HRF. Temporal encoding will most likely change the local HRF as well as the signal propagation throughout the neural network. Once the relationship between the signaling pattern and the ofMRI signal is revealed, ofMRI studies can be used to accurately infer the signaling pattern in addition to the location of the traced activity. While initial studies hint at the possibility of inferring such temporal information, further studies to understand the relationship with experiment designs specifically targeted to understand the relationship will be necessary to bring this potential capability to its full potential.
In the efforts to trace the neural activity, distinguishing activity resulting from the first, second, and higher order connectivity is of great interest. Due to the relatively slow time scale provided by fMRI studies, which is on the order of seconds, activity cannot be traced at the timescale of the neural activity. However, careful experiment designs involving anatomical knowledge, particular design of stimulation patterns, and the study of the resulting shape, delay of the HRF can potentially provide valuable information.
Additional considerations that need to be taken into account include the use of anesthesia. Initial experiments were conducted with light isoflurane anesthesia. Anesthesia is known to have an impact on the neural activity, its propagation and the resulting HRF. Precisely how it impacts the system and whether it is of importance will depend on the system under investigation. While anesthesia is likely to bring about changes in neural response, whether the specific change impacts the conclusion of a study can vary. Further studies utilizing different anesthesia and awake animals will be of crucial importance to fully understand the impact of anesthesia on ofMRI signals.
Furthermore, while the initially published study demonstrates 0.5 mm × 0.5 mm × 0.5 mm resolution scans covering most of the brain volume, future technological developments can potentially enable ofMRI at the cortical layer and sub-nucleus specific level while covering the whole brain. Combining ofMRI approaches with other methods including anatomical connectomics data, modeling approach, resting-state fMRI, electrophysiological studies, optical imaging, and behavioral readouts will also be a powerful new synergistic approach to study brain circuits.
Conclusion
Increasing data suggest that the brain functions as an integrated circuit with network communication across diverse brain circuit elements and that disorders result in network level dysfunction of the brain (Cardin et al., 2009; Gradinaru et al., 2009; Kravitz et al., 2010). With ofMRI, large-scale communication arising from specifically targeted neural populations can be mapped across the whole brain with spatial and temporal accuracy. This will add an important new dimension to the anatomical connectomics project (Sporns et al., 2005) by visualizing how information propagates through the network. ofMRI based, cell-type specific, activity-dependent brain atlases can also provide a new angle to understanding the brain architecture by providing additional information in the efforts to segment different brain regions (Hilgetag et al., 2000) and in understanding the relationship between the segmented regions (Stephan et al., 2000; Honey et al., 2007).
Conflict of Interest Statement
The author declares that the research was conducted in the absence of any commercial or financial relationships that could be construed as a potential conflict of interest.
Acknowledgments
Jin Hyung Lee is supported by the NIH/NIBIB R00 Pathway to Independence Award, the NIH Director’s New Innovator Award, the Okawa Foundation Research grant award, and the NSF CAREER award. Jin Hyung Lee would like to acknowledge Dr. Dae-Shik Kim for discussions and contributions on DTI and other MRI based methods and Dr. Partha Mitra for helpful discussions regarding connectomics and network dynamics.
References
Aravanis, A. M., Wang, L. P., Zhang, F., Meltzer, L. A., Mogri, M. Z., Schneider, M. B., and Deisseroth, K. (2007). An optical neural interface: in vivo control of rodent motor cortex with integrated fiberoptic and optogenetic technology. J. Neural Eng. 4, S143–S156.
Bandettini, P. A., and Wong, E. C. (1997). Magnetic resonance imaging of human brain function. Principles, practicalities, and possibilities. Neurosurg. Clin. N. Am. 8, 345–371.
Berndt, A., Yizhar, O., Gunaydin, L. A., Hegemann, P., and Deisseroth, K. (2009). Bi-stable neural state switches. Nat. Neurosci. 12, 229–234.
Bock, D. D., Lee, W. C., Kerlin, A. M., Andermann, M. L., Hood, G., Wetzel, A. W., Yurgenson, S., Soucy, E. R., Kim, H. S., and Reid, R. C. (2011). Network anatomy and in vivo physiology of visual cortical neurons. Nature 471, 177–182.
Bohland, J. W., Wu, C., Barbas, H., Bokil, H., Bota, M., Breiter, H. C., Cline, H. T., Doyle, J. C., Freed, P. J., Greenspan, R. J., Haber, S. N., Hawrylycz, M., Herrera, D. G., Hilgetag, C. C., Huang, Z. J., Jones, A., Jones, E. G., Karten, H. J., Kleinfeld, D., Kotter, R., Lester, H. A., Lin, J. M., Mensh, B. D., Mikula, S., Panksepp, J., Price, J. L., Safdieh, J., Saper, C. B., Schiff, N. D., Schmahmann, J. D., Stillman, B. W., Svoboda, K., Swanson, L. W., Toga, A. W., Van Essen, D. C., Watson, J. D., and Mitra, P. P. (2009). A proposal for a coordinated effort for the determination of brainwide neuroanatomical connectivity in model organisms at a mesoscopic scale. PLoS Comput. Biol. 5, e1000334. doi: 10.1371/journal.pcbi.1000334
Boyden, E. S., Zhang, F., Bamberg, E., Nagel, G., and Deisseroth, K. (2005). Millisecond-timescale, genetically targeted optical control of neural activity. Nat. Neurosci. 8, 1263–1268.
Briggman, K. L., and Denk, W. (2006). Towards neural circuit reconstruction with volume electron microscopy techniques. Curr. Opin. Neurobiol. 16, 562–570.
Briggman, K. L., Helmstaedter, M., and Denk, W. (2011). Wiring specificity in the direction-selectivity circuit of the retina. Nature 471, 183–188.
Cardin, J. A., Carlen, M., Meletis, K., Knoblich, U., Zhang, F., Deisseroth, K., Tsai, L. H., and Moore, C. I. (2009). Driving fast-spiking cells induces gamma rhythm and controls sensory responses. Nature 459, 663–667.
Choe, Y., Abbott, L. C., Han, D., Huang, P.-S., Keyser, J., Kwon, J., Mayerich, D., Melek, Z., and McCormick, B. H. (2008). “Knife-edge scanning microscopy: high-throughput imaging and analysis of massive volumes of biological microstructures,” in High-Throughput Image Reconstruction and Analysis: Intelligent Microscopy Applications, eds R. Rao and G. Cecchi (Boston, MA: Artech House), 11–37.
Chow, B. Y., Han, X., Dobry, A. S., Qian, X., Chuong, A. S., Li, M., Henninger, M. A., Belfort, G. M., Lin, Y., Monahan, P. E., and Boyden, E. S. (2010). High-performance genetically targetable optical neural silencing by light-driven proton pumps. Nature 463, 98–102.
Fox, M. D., and Raichle, M. E. (2007). Spontaneous fluctuations in brain activity observed with functional magnetic resonance imaging. Nat. Rev. Neurosci. 8, 700–711.
Goebel, R., Roebroeck, A., Kim, D. S., and Formisano, E. (2003). Investigating directed cortical interactions in time-resolved fMRI data using vector autoregressive modeling and Granger causality mapping. Magn. Reson. Imaging 21, 1251–1261.
Gradinaru, V., Mogri, M., Thompson, K. R., Henderson, J. M., and Deisseroth, K. (2009). Optical deconstruction of parkinsonian neural circuitry. Science 324, 354–359.
Gradinaru, V., Thompson, K. R., and Deisseroth, K. (2008). eNpHR: a Natronomonas halorhodopsin enhanced for optogenetic applications. Brain Cell Biol. 36, 129–139.
Gunaydin, L. A., Yizhar, O., Berndt, A., Sohal, V. S., Deisseroth, K., and Hegemann, P. (2010). Ultrafast optogenetic control. Nat. Neurosci. 13, 387–392.
Hilgetag, C. C., Burns, G. A., O’Neill, M. A., Scannell, J. W., and Young, M. P. (2000). Anatomical connectivity defines the organization of clusters of cortical areas in the macaque monkey and the cat. Philos. Trans. R. Soc. Lond. B Biol. Sci. 355, 91–110.
Histed, M. H., Bonin, V., and Reid, R. C. (2009). Direct activation of sparse, distributed populations of cortical neurons by electrical microstimulation. Neuron 63, 508–522.
Honey, C. J., Kotter, R., Breakspear, M., and Sporns, O. (2007). Network structure of cerebral cortex shapes functional connectivity on multiple time scales. Proc. Natl. Acad. Sci. U.S.A. 104, 10240–10245.
Kravitz, A. V., Freeze, B. S., Parker, P. R., Kay, K., Thwin, M. T., Deisseroth, K., and Kreitzer, A. C. (2010). Regulation of parkinsonian motor behaviours by optogenetic control of basal ganglia circuitry. Nature 466, 622–626.
Lee, J. H., Dumoulin, S. O., Saritas, E. U., Glover, G. H., Wandell, B. A., Nishimura, D. G., and Pauly, J. M. (2008). Full-brain coverage and high-resolution imaging capabilities of passband b-SSFP fMRI at 3T. Magn. Reson. Med. 59, 1099–1110.
Lee, J. H., Durand, R., Gradinaru, V., Zhang, F., Goshen, I., Kim, D. S., Fenno, L. E., Ramakrishnan, C., and Deisseroth, K. (2010). Global and local fMRI signals driven by neurons defined optogenetically by type and wiring. Nature 465, 788–792.
Livet, J., Weissman, T. A., Kang, H., Draft, R. W., Lu, J., Bennis, R. A., Sanes, J. R., and Lichtman, J. W. (2007). Transgenic strategies for combinatorial expression of fluorescent proteins in the nervous system. Nature 450, 56–62.
Micheva, K. D., and Smith, S. J. (2007). Array tomography: a new tool for imaging the molecular architecture and ultrastructure of neural circuits. Neuron 55, 25–36.
Miyamichi, K., Amat, F., Moussavi, F., Wang, C., Wickersham, I., Wall, N. R., Taniguchi, H., Tasic, B., Huang, Z. J., He, Z., Callaway, E. M., Horowitz, M. A., and Luo, L. (2011). Cortical representations of olfactory input by trans-synaptic tracing. Nature 472, 191–196.
Mori, S., and Zhang, J. (2006). Principles of diffusion tensor imaging and its applications to basic neuroscience research. Neuron 51, 527–539.
Ogawa, S., Tank, D. W., Menon, R., Ellermann, J. M., Kim, S. -G., Merkle, H., and Ugurbil, K. (1992). Intrinsic signal changes accompanying sensory stimulation: functional brain mapping with magnetic resonance imaging. Proc. Natl. Acad. Sci. U.S.A. 89, 5951–5955.
Pautler, R. G., Silva, A. C., and Koretsky, A. P. (1998). In vivo neuronal tract tracing using manganese-enhanced magnetic resonance imaging. Magn. Reson. Med. 40, 740–748.
Raju, D. V., and Smith, Y. (2006). Anterograde axonal tract tracing. Curr. Protoc. Neurosci. Chap. 1, Unit 1.14.
Song, A. W., Popp, C. A., Mao, J., and Dixon, W. T. (2000). fMRI: methodology – acquisition and processing. Adv. Neurol. 83, 177–185.
Sporns, O., Tononi, G., and Kotter, R. (2005). The human connectome: a structural description of the human brain. PLoS Comput. Biol. 1, e42. doi: 10.1371/journal.pcbi.0010042
Stephan, K. E., and Friston, K. J. (2011). Analyzing effective connectivity with fMRI. Wiley Interdiscip. Rev. Cogn. Sci. 1, 446–459.
Stephan, K. E., Hilgetag, C. C., Burns, G. A., O’Neill, M. A., Young, M. P., and Kotter, R. (2000). Computational analysis of functional connectivity between areas of primate cerebral cortex. Philos. Trans. R. Soc. Lond. B Biol. Sci. 355, 111–126.
Tolias, A. S., Sultan, F., Augath, M., Oeltermann, A., Tehovnik, E. J., Schiller, P. H., and Logothetis, N. K. (2005). Mapping cortical activity elicited with electrical microstimulation using FMRI in the macaque. Neuron 48, 901–911.
Wall, N. R., Wickersham, I. R., Cetin, A., De La Parra, M., and Callaway, E. M. (2010). Monosynaptic circuit tracing in vivo through Cre-dependent targeting and complementation of modified rabies virus. Proc. Natl. Acad. Sci. U.S.A. 107, 21848–21853.
Zhang, F., Aravanis, A. M., Adamantidis, A., de Lecea, L., and Deisseroth, K. (2007a). Circuit-breakers: optical technologies for probing neural signals and systems. Nat. Rev. Neurosci. 8, 577–581.
Zhang, F., Wang, L. P., Brauner, M., Liewald, J. F., Kay, K., Watzke, N., Wood, P. G., Bamberg, E., Nagel, G., Gottschalk, A., and Deisseroth, K. (2007b). Multimodal fast optical interrogation of neural circuitry. Nature 446, 633–639.
Keywords: optogenetics, BOLD, ofMRI, opto-fMRI, connectomics
Citation: Lee JH (2011) Tracing activity across the whole brain neural network with optogenetic functional magnetic resonance imaging. Front. Neuroinform. 5:21. doi: 10.3389/fninf.2011.00021
Received: 19 March 2011;
Accepted: 13 September 2011;
Published online: 25 October 2011.
Edited by:
Claus Hilgetag, Jacobs University Bremen, GermanyReviewed by:
Kathleen S. Rockland, Massachusetts Institute of Technology, USAYoonsuck Choe, Texas A&M University, USA
Copyright: © 2011 Lee. This is an open-access article subject to a non-exclusive license between the authors and Frontiers Media SA, which permits use, distribution and reproduction in other forums, provided the original authors and source are credited and other Frontiers conditions are complied with.
*Correspondence: Jin Hyung Lee, Departments of Electrical Engineering, Psychiatry and Biobehavioral Sciences, Radiology, Neuroscience, Biomedical Engineering Interdepartmental Program, University of California Los Angeles, 420 Westwood Plaza, #68-121, Los Angeles, CA 90095, USA. e-mail: ljinhy@gmail.com