Data ontology and an information system realization for web-based management of image measurements
- Bioelectronic Systems Group, Interuniversity Microelectronics Centre (Imec), Leuven, Belgium
Image acquisition, processing, and quantification of objects (morphometry) require the integration of data inputs and outputs originating from heterogeneous sources. Management of the data exchange along this workflow in a systematic manner poses several challenges, notably the description of the heterogeneous meta-data and the interoperability between the software used. The use of integrated software solutions for morphometry and management of imaging data in combination with ontologies can reduce meta-data loss and greatly facilitate subsequent data analysis. This paper presents an integrated information system, called LabIS. The system has the objectives to automate (i) the process of storage, annotation, and querying of image measurements and (ii) to provide means for data sharing with third party applications consuming measurement data using open standard communication protocols. LabIS implements 3-tier architecture with a relational database back-end and an application logic middle tier realizing web-based user interface for reporting and annotation and a web-service communication layer. The image processing and morphometry functionality is backed by interoperability with ImageJ, a public domain image processing software, via integrated clients. Instrumental for the latter feat was the construction of a data ontology representing the common measurement data model. LabIS supports user profiling and can store arbitrary types of measurements, regions of interest, calibrations, and ImageJ settings. Interpretation of the stored measurements is facilitated by atlas mapping and ontology-based markup. The system can be used as an experimental workflow management tool allowing for description and reporting of the performed experiments. LabIS can be also used as a measurements repository that can be transparently accessed by computational environments, such as Matlab. Finally, the system can be used as a data sharing tool.
1. Introduction
Processing and extraction of information from images have become indispensable aspects of the experimental workflow in life science research, and in particular in cell biology and neuroscience (Swedlow and Eliceiri, 2009). The life science experimentation can be described in terms of processing workflows. A workflow representation provides an abstracted view over the experiment being performed. It describes what procedures need to be enacted, but not necessarily all the details of how they will be executed. A typical microscopic workflow involving problem definition, experimental execution, and data acquisition is summarized in Figure 1. At its last stage, the images are transformed into measurements, which are finally interpreted in the light of the original research question. At each step of the data processing workflow occurs a substantial decrease of the volume of output data (i.e., the input information for the next step). In contrast, this decrease is translated into an increase of the algorithmic complexity of generated information (derived data). Given this fact, if one wishes to automate data analysis and management in an experiment, all facets of so-outlined process need to be systematically framed. If this is not achieved every step of the process will lead to incremental irreversible loss of potentially valuable contextual information. Indeed, such loss of information can be a typical problem in research laboratories. Therefore, the management of the information flow and the acquired images obtained during an experiment, in particular, can be considered as a major challenge in life science imaging.
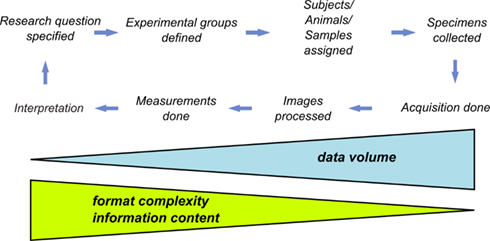
Figure 1. The experimental workflow. The experimental workflow in life sciences tries to answer the initially posed research question via quantitative analysis of multiple experimental trials. Each step requires the application of typically different hardware and software tools frequently using incompatible data formats.
Each step of the experimental workflow typically requires the use of different hardware and software tools. Ideally, obtained raw data should be directly available for use in other applications either by remote instrument read-out or by transfer of the data upon application request.
Differences in the posed research questions result in differences in the pursued methodological approaches and hence in differences in the information context along the workflow. This leads to irreducible heterogeneity of the produced contextual information which is difficult to standardize and describe in a detailed way by a generic information system. In such case, it is convenient to adhere only to minimal standards regarding data schemas structure in order to maintain interoperability between different analysis platforms. This situation has been already recognized for microarray experiments where Minimum Information About a Microarray Experiment (MIAME) was adopted to facilitate presenting and exchanging microarray data (Brazma et al., 2001).
As discussed, the meta-data may refer to the experimental design, to the source, preparation, treatment, or other relevant properties of the biological material being studied, to the parameters and values of instruments used, or to the analytical procedures performed on the measurements. Because there are no generally accepted standards for meta-data, the equipment vendors define their own meta-data formats which are often incompatible with those developed by competitors. Subsequently, there are no commonly accepted standards for exchange of the derived imaging data, such as spatial measurements, temporal sequences, or geometric objects. According to the estimates of Swedlow and Eliceiri (2009) there are approximately 80 proprietary file formats for optical microscopy alone that must be supported by any imaging tool for life science microscopy which aims to provide a general purpose solution. This lack of standardization of the meta-data has been recognized as a hindrance for the microscopic field (Goldberg et al., 2005; Linkert et al., 2010). Consequently, some standards are currently under discussion (Linkert et al., 2010). However, proposed standards are not yet sufficiently accepted by the research community, therefore they reflect only the experimental paradigms of their supporters. Altogether, this hinders the integration of heterogeneous data sources which are present in the life science workflow.
1.1. Related Works
The Open Microscopy Environment (OME1; Goldberg et al., 2005) was designed as a system for image storage, visualization, and analysis. The information system employs an extended meta-data file format for raw data storage, which is based on TIFF and XML standards. Its main information objects are centered around acquisition meta-data (Goldberg et al., 2005). The information system’s back-end is a Java Enterprise server application. There are two server realizations: a legacy OME Server developed until 2006 and a newer OMERO server. The new server employs Java remote objects and structured annotations as main technologies. Each annotation can be mapped to custom XML name-spaces (Swedlow et al., 2009). The OMERO clients allow the user to manage, view, annotate, and measure multi-dimensional remote images.
The Cell-Centered Database (CCDB2) project realizes a web accessible database for high-resolution multi-dimensional data from light and electron microscopy. The system has grid-based architecture. Imaging data in the CCDB can be accessed through searching or by browsing through the image gallery. The Animal Imaging Database (AIDB) is a sub-project of CCDB, designed to provide a public repository for animal imaging data sets from MRI and related techniques. The open-source branch of the project is called OpenCCDB. OpenCCDB provides secure input forms and allows profiled data access and sharing. The database is implemented in PostgreSQL. The information system comprises of several integrated software tools: (i) WebImage browser – a web-based tool for viewing and annotating images similar to Google Maps. (ii) Segmentation and analysis tool for electron tomographic data, called Jinx. (iii) An image workflow application for registering brain images to the stereotaxic coordinate systems called Jibber. The tool is implemented in Java and is available through Java Web Start technology. (iv) Cytoseg is an extensible tool developed to automate segmentation problems in electron microscopic images. The tool is based on the OpenCV (Open-Source Computer Vision3) library and Matlab.
The Bio-Image Semantic Query User Environment (Bisque4) is a web-based platform designed to provide organizational and quantitative analysis tools for 5D image data (Kvilekval et al., 2010). Bisque’s extensibility stems from its flexible meta-data and open web-based architecture. The system architecture is scalable, reconfigurable and extensible with core functions implemented as web-services. Most Bisque services are implemented using the REST access pattern, notably all managed items, such as images, datasets, meta-data, analysis and services are given unique URLs allowing simplified access by third party applications. The system uses a flexible meta-data model based on tags (i.e., named field with an associated value). Bisque is not designed to store image measurements but only annotations to images.
The Extensible Neuroimaging Archive toolkit (XNAT5) is an extensible platform for secure management and exploration of neuroimaging data (Marcus et al., 2007). XNAT supports workflows including data validation through an online quality control process. XNAT also includes an online image viewer that supports a number of common neuroimaging formats, including DICOM and Analyze. The viewer can be extended to support additional formats and to generate custom displays. The XNAT DICOM tools are written in Java and XNAT supports the configuration of pipelines for data transfer and quality control checks.
1.2. Definitions and Terms
Instrumental for the subsequent discourse are the concepts of “measurement” and “ontology.” The term measurement refers to succinct quantitative representations of image features over space and time. This implies the application of the act or process of measurement, i.e., “morphometry” to the raw imaging data. Therefore, measurement is synonymous to morphometric feature. Measurements, therefore, are reduced representations of the raw data, which have higher information complexity in the light of the previous discourse. Due to the irreversible information loss introduced by the process of measurement one needs an instance of (or a references to) the applied algorithm in order to be able to replicate the measurements (given the original data). Therefore, measurements are only implicitly “present” in images. Consequently, measurements can not be regarded as image “features.” This consideration introduces a distinction between “image-centric” and “process-centric” approaches in management of experimental information. An example of the former approach is the web application Open Microscopy Environment (OME; Goldberg et al., 2005).
The term ontology refers to a controlled vocabulary (i.e., data dictionary) about a specific area of knowledge. Examples of such areas include species anatomy, classes of chemical compounds, types of biological processes, cellular phenotypes, and nosological entities. Ontologies consist of hierarchical classification of entities linked with statically defined relationships. The structure of an ontology can be represented by a graph, i.e., for example a conceptual map. Ontologies can be viewed as mediators of data sharing and exchange between heterogeneous software applications. Heterogeneity in this context has several aspects: on the level of the hardware (i.e., different byte representation), the operation system, the program language (i.e., different data type representation), data source (i.e., the database management system), and finally the data schema. By providing explicitly the relationship between the entries in the vocabulary and the constraints on the data, ontologies provide the means for algorithmic translation of the data structures and instantiation of the data objects in different program language environments. Increasingly, biomedical researchers are looking to develop ontologies to support cross-laboratory data sharing and integration (Lependu et al., 2008). Examples for these are the Gene Ontology (GO6) for gene products (Ashburner et al., 2000) and the Unit Ontology (UO7). Such ontologies can be found in ontology repositories around the world, for example at the Ontology Lookup Service (OLS8; Côté et al., 2006, 2008), the Open Biological and Biomedical Ontologies web site9, or the US National Center for Biomedical Ontology BioPortal web site10. At the time of writing there were 81 such ontologies present at the OLS hub and more than 200 in the BioPortal site.
2. System Realization
Since imaging data are produced in a defined experimental context (Figure 1) in order to manage the increase in information complexity in a systematic manner all major steps of the experiment workflow need to be addressed by an information system, e.g., a laboratory management information system. Such system needs not be universal due to the intrinsic heterogeneity of the experimental context. In contrast, such system needs to address properly the stages where transformation of the information context occurs. This context needs to include structured information about the experimental conditions, the followed procedures and protocols, and finally the instrument settings, by means of which the raw images are produced.
Brain connectivity datasets (i.e., connectomes) are graph representations of spatial relationships between anatomic structures at different levels of detail. Connectivity maps can be considered as derived properties of the imaged sample, which strongly depend on the imaging methods and the anatomical techniques used to acquire the data. As such, the connectomes belong to the “interpretation” level of the workflow since they are a combination of prior knowledge, which can be captured by a use of certain vocabulary (i.e., ontology), and spatial relationships between the constructed information objects. Therefore, connectomes should be backed by information systems capturing the data at several nodes of the workflow. In such way, connectomes can be computed dynamically on demand based on the available data in the information system, given the constraints of the query and the prior knowledge.
In this paper, I present LabIS, an integrated information system for storage, annotation, and querying of multiple sets of image measurements. The aim of LabIS is to facilitate the information flow in the life science workflow. To this end its development pursues three specific objectives. The first objective of LabIS is to automate the process of querying and report generation of the stored data. The second objective of LabIS is to automate the process of storage, annotation, and retrieval of image measurements. The third objective is to provide means for data sharing by providing interoperability between different applications consuming measurement data. Instrumental for this objective is the construction of a data ontology representing the common measurement data model, which is shared by the client and server software platforms. Development snapshots were presented previously in Prodanov (2008, 2009).
A developmental instance of the system is available through the website Sourceforge.net at http://labinfsyst.sourceforge.net/. The system is distributed under Lesser Gnu General Public License (LGPL).
2.1. User Interface
This section addresses the first objective of LabIS, notably the automation of querying and report generation of the stored data. The user interface (UI) of LabIS is divided in 5 main modules: Project planning, Subject management, Manipulation management, Image Measurements and Morphometry, and System Administration. Screenshots of the user interface can be found in Appendix A. The user-interface modules are organized in a similar manner: users can generate reports, enter data, or annotate already present database records.
The Project planning module is used for management of the records of research projects. The users can perform tasks, such as deployment of new projects and/or changing the state or the attributes of ongoing projects. Groups of results can be organized in Results collections. Results collections in turn can be interpreted in the sense of mapping to atlas image datasets. Project characteristics can be reported in a flexible manner.
The Subject management module manages the records for experimental animals. The users can perform tasks, such as registration of new subjects/animals, editing of records, introduction of new species, etc. The subjects can be assigned to projects and to experimental groups. Dynamical reports can be generated for arbitrary periods.
The Manipulation management module manages the records for performed manipulations. The users can perform tasks, such as registration and editing of manipulations. Dynamical reports can be generated for arbitrary periods.
The Image Measurements and Morphometry module manages uploaded measurement records. Uploaded measurements can be associated to a project, an experimental subject, experimental group, sample, result collection, or paired to other measurements. The measurements can be searched for by the name of the measured image, by the internal ID or simply browsed. There are possibilities for flexible reporting of the performed measurements. A dynamically generated measurement report is presented in Figure 2.
The Administration module manages the user roles, the maintenance of the database, and the system configuration. The users can also define custom ontologies.
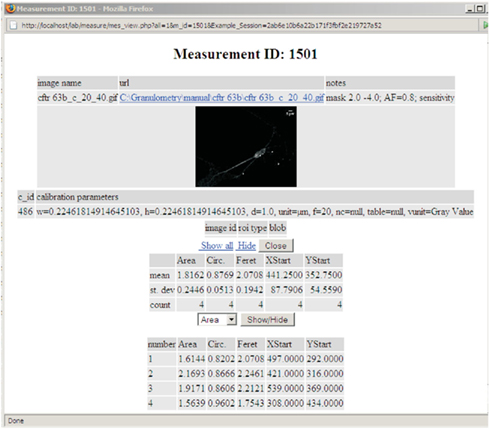
Figure 2. The measurement report.
A typical workflow that can be supported by the system is depicted in Figure 4. The user can describe a new project and specify its attributes in the Project module. Then she can define (experimental) groups related to the project. On a later stage, the user can enter manipulations that were performed and experimental subjects or samples. Independently, the user can upload measurements and annotate them with relevant attributes. The measurements can be collated in results collections, which in turn are associated to projects.
Data can be annotated in several ways. In the first place, measurements can be annotated in free text through the ImageJ clients (primary annotation). On the second place, measurements can be associated to hierarchical groups, experimental subjects, projects, and ontologies (data curation). On the third place, uploaded measurements can be registered in associated atlas spaces.
2.2. User Roles
The access to the system is password protected. The information system supports hierarchical user roles. There are 3 major types of users: ordinary users, editors, and administrators. The ordinary users can enter or annotate data and produce basic reports. The editors can edit already entered data. The administrators can create or delete other users or change their roles. They can also delete already entered data records.
2.3. System Architecture
This section addresses the realization of the second objective of LabIS, in particular to provide structured information context for the derivative image measurements. LabIS is a blend of multiple high-level server-side and client-side software technologies, such as the Structured Query Language SQL for relational database interaction, the Java programing language (Oracle Inc., USA), the Extensible Markup Language XML, and the server-side hypertext preprocessor language PHP11 among others. LabIS realizes 3-tier architecture including a user interface front-end, an application middle tier, and a relational database back-end (Figure 3). Such architecture provides flexibility regarding the exploitation and deployment options. The system was tested in both MS Windows and Linux development environments.
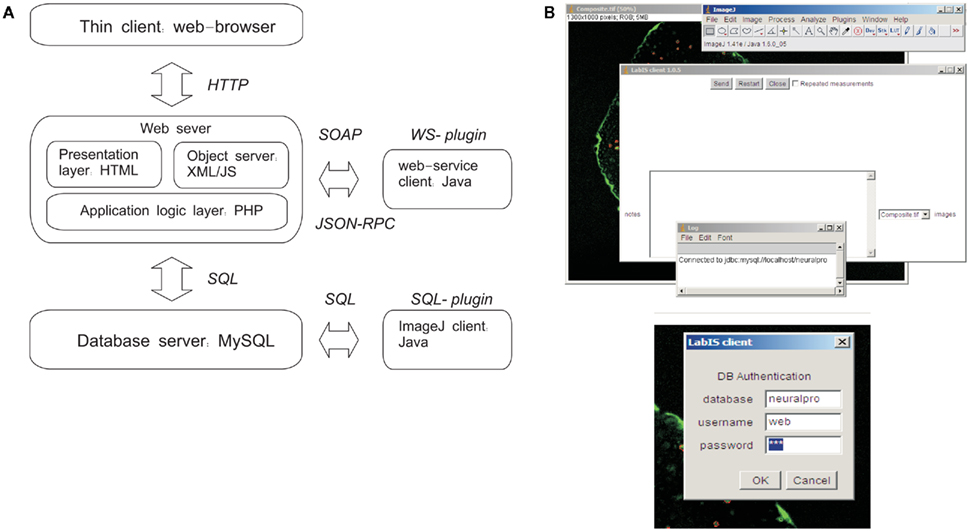
Figure 3. LabIS: system architecture and data upload clients. (A) The information system can be accessed through the web UI by a web browser. Interactions with LabIS are executed either by exchange of SOAP messages (WS plugin) or by SQL queries (SQL-plugin). On the server side, the requests are handled by the communication layer, which is implemented in PHP. The data storage back-end is based on the relational database model of MySQL. (B) User interfaces of the ImageJ plugins: main form for data upload (top) and login form (bottom). The SQL-plugin accesses directly the MySQL server.
2.3.1. Server-side
The back-end data storage layer is implemented in a MySQL database server (v. 5.112). The version that was used supports programing of stored procedures, views, and transactions.
The middle tier realizes the system application logic and the information objects. The middle tier is implemented in the web server scripting language PHP (v. 5.x). The PHP scripting engine runs in the environment of an Apache web server13.
The front-end realizes interactions with users and software clients. It includes a web user interface and bindings for Ajax and SOAP (Section 2.5).
2.3.2. Client side
The client side is realized by 3 types of clients: (i) web browser accessing the web UI (Section 2.1); (ii) web clients accessing the web-service interface via Ajax and SOAP bindings (Section 2.5); (iii) ImageJ modules accessing the database server or the web-service interface (Section 3.2).
2.4. Data Model
The information object model and its relationship to the system modules of LabIS are depicted in Figure 4. Information objects of LabIS can be divided in two categories: infrastructure objects and application objects. The objects are mapped to the table structure of the database, the elements of the UI, and to the communication infrastructure. Examples of the former are the Sessions and Users, which handle authentication and session tracking; or the Groups, which handle the classification of projects and experimental subjects. Examples of the latter are the Measurements, Images, ROIs, and Calibrations, which all are mapped to the communication infrastructure.
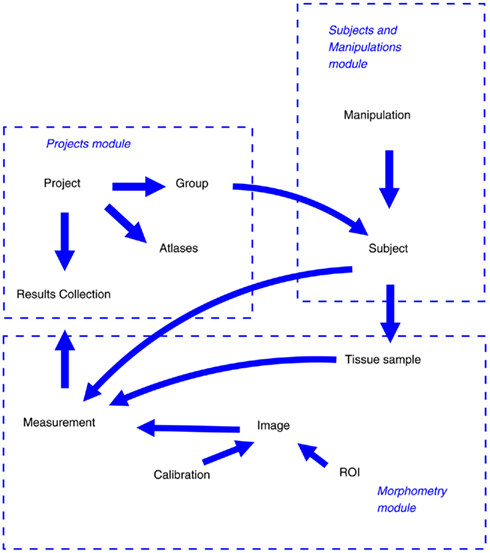
Figure 4. Object model of LabIS and its mapping to the modules. The major objects and relationships between them are shown by arrows.
2.4.1. Measurement ontology
Realization of a data ontology was instrumental for the data exchange between heterogeneous software applications. In the context of LabIS, the data ontology is used to map the data from one application language to another, for example from PHP to Java or from XML to PHP, or from JavaScript to PHP. In XML, the ontology was implemented as the name-space IJMes representing an extension of the public XML Schema name-space. In this way, any application that can decode the scheme will instantiate the ontology and will recover the meaning of the transmitted data. Using this framework, the internal representation of the data was decoupled from their publicly accessible form. This extensible ontology-based data exchange model was designed in order to ensure continuous evolution in the changing scientific environment.
A key concept for the realization of the measurement ontology is the representation of the image measurement by the Measurement and Measurement record objects (Figure 5). The object can be either constructed from data on the client side (former case) and sent to the server or it can be instantiated from a serialized form residing in the database and either sent to the UI (latter case, Figure 2) or the client side. The data schema of the measurement objects reflects closely the format of the image measurements produced by ImageJ and is the foundation for the interoperability between LabIS and ImageJ.
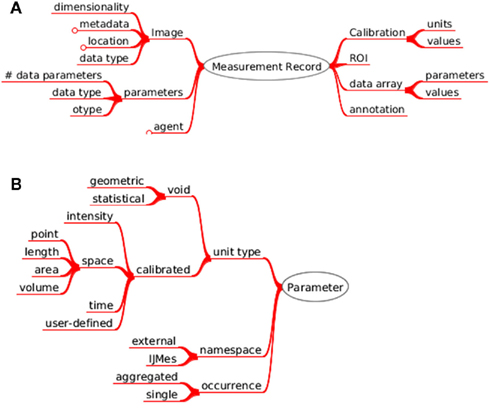
Figure 5. Measurement data ontology. (A) The object references to the measured image and structured annotations. It contains the types of custom parameters, which were measured; the active region of interest, the array of produced numerical values and the calibration of the image that was measured. (B) Measured parameters are defined by unit type, name-space or occurrence.
Each measurement parameter type present in the database is associated with an ontology entry. The hierarchy of entries is represented in Figure 5B.
Data ontologies can also be used for automated annotation of the experimental data. In the course of an experiment part of the meta-data can be automatically generated at different processing steps while other parts can be introduced as annotations by users (i.e., experts).
2.5. Communication Infrastructure
LabIS is a distributed Internet and intranet application. The system supports interactions with third party applications using 2 access interfaces (Figure 3): (i) direct communication with the database back-end and (ii) communication via the web-service interfaces. The direct communication with the database is intended for intranet environments, where the requirements for security are lower. In intranet environments the data input is performed in platform-independent manner via SQL queries.
2.5.1. The web-service interface
Web-services are a way of aggregating and integrating data sources and software by using standardized interface and service discovery mechanisms. In the context of LabIS, the web-service interface is operated by the Object Server (Figure 3). The interface is intended for use in Internet environments, where opening of the database port may impose a security risk. The web-service interface interacts via the data ontology and is, therefore, at a higher level of abstraction compared to the database structure. Due to the use of platform-independent formats, such as XML and JSON, LabIS supports cross-platform data exchange in a generic manner.
The Object Server provides two types of communication protocols to clients: (i) SOAP binding; and (ii) JSON-RPC (JavaScript Object Notation – Remote Procedure Call) binding. Both protocols operate over a Hypertext Transfer Protocol HTTP transport layer. Stored data are wrapped as ontology-defined information objects and transmitted as dynamically generated XML or JSON documents over the HTTP transport layer.
2.5.2. SOAP protocol binding
SOAP provides a way to communicate between applications running on different operating systems, with different technologies and programming languages. SOAP is a protocol for exchanging XML-encoded messages over HTTP/HTTPS (most cases) or SMTP. Version 1.2 became a W3C Recommendation in 2003. One of the key advantages of SOAP is that it has a publicly accessible service discovery mechanism through the use of the language WSDL. A human-readable view of the service broadcast mechanism of LabIS is displayed in Figure 6.
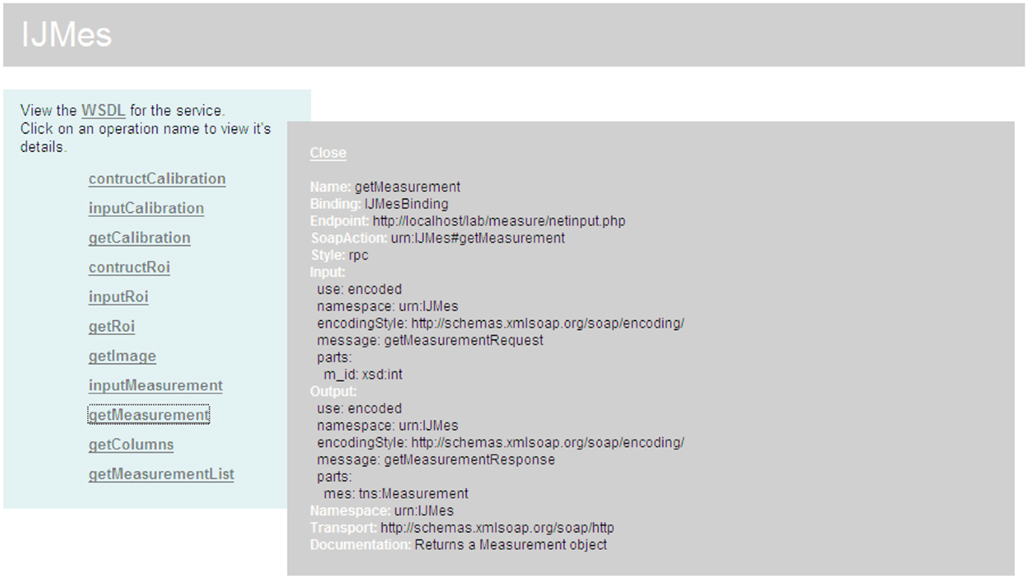
Figure 6. The measurement web-service communication layer. The figure represents a screen capture of a web browser window. Publicly accessible operations of the web-service are presented in the left plane. The description of a particular operation, getMeasurement, is expanded in the right plane. Service can be accessed by any SOAP-aware application. The messaging is based on the Remote Procedure Call (RPC) pattern of the SOAP exchange.
There are implementations for the most common programming languages, such as Apache Axis for Java, PHP-SOAP, PEAR-SOAP, and NuSOAP for PHP; the SOAP extensions for the NET Framework, etc. The SOAP binding for LabIS was implemented using NuSOAP developed by Dietrich Ayala and currently supported by the company NuSphere14. More details about the protocol and its realization are given in the Appendix.
2.5.3. JSON-RPC protocol binding
The JavaScript patterns for asynchronous communication to application web servers are collectively referred to as Ajax. Ajax includes the combined use of several technologies in the web-browsers (notably JavaScript and Document Object Model). Using Ajax, web applications can retrieve data from the server asynchronously in the background without interfering with the display and behavior of the existing page. The page can interact with the JavaScript technology based on events such as the loading of a document, a mouse click, focus changes, or even a timer. JSON-RPC is a light-weight communication protocol operating currently only over HTTP. In contrast to SOAP, JSON-RPC does not define name-spaces and only implicitly refers to complex types. There are implementations of this protocol in Java, PHP, and other languages. More details about the protocol and its realization are given in the Appendix.
3. Interoperability
Interoperability with third party software is realized both on the client side and the server side.
3.1. Integration in OLS
Support of third party ontologies is provided using the publicly available OLS ontology registry web-service. This support is realized on 2 levels: (i) individual measurement types can be annotated with ontology keys, for example using the Unit Ontology; (ii) the complex measurement objects can be annotated using terms of any of the ontologies supported by OLS. The integration with OLS is transparent for the user and is realized using a cascade of JSON-RPC calls from the browser which in turn trigger SOAP calls to the OLS web-service interface. This pattern of interaction is an example of a mixed client-server interoperability since a SOAP client instance acts also on the server-side to access a remote web-service interface.
3.2. Integration in ImageJ
ImageJ is a public domain image processing program. It has an open architecture providing extensibility via third party Java modules (called plugins) and scripting macros. It is developed by Wayne Raspband since 1997 and expanded via contributed software code by an international group of contributors (Collins, 2007).
LabIS can be accessed directly from ImageJ via GUI clients. In such way, the entire image processing functionality of ImageJ was made available to the end user. The user can perform arbitrary measurements using any type of built-in or customized ImageJ plugins. The GUI front-end clients were implemented as a set of plugins: the SQL Results plugin and web-service SOAP Results and JSON Results plugins. The SQL-plugin implements a MySQL client that interacts directly with the database server. It is intended for use in intranet environments. The WS-plugin implements a SOAP client and interacts with the Object Server of LabIS (Figure 3). This functionality is an example of interoperability on the client side.
The data representing an individual measurement or an array of measurements (i.e., the ImageJ ResultsTable object) together with the relevant meta-data concerning the image under study, such as dimensions, calibration, path, regions of interest, etc. are assembled in a complex Measurement object. After the end of the measurement session this object together with a JPEG-encoded thumbnail view of the active image are uploaded either using the SQL client or using the web-service client. Known measurement unit types are associated automatically to terms in third party ontologies, i.e., the Unit Ontology. The basic measurement unit types in ImageJ are: areas, diameters, perimeters, angles, circularity, coordinates in 2D and 3D, intensities, and calibrated pixel values. If a new measurement type is encountered it is also automatically included in the database. Such new type can be later annotated using the web UI and the ontology terms lookup service.
3.3. Integration in Matlab
Integration in the Matlab® computational environment (The Mathworks Inc., Natick, MA, USA) was achieved on the client side. Since version R2007, Matlab® provides client functionality for web-services. The generation of client scripts is fully automated using the WSDL service discovery mechanisms. The high-level functionality is implemented by the createClassFromWsdl function, which accepts a path or URL to a WSDL resource as an argument15. Low level functionality is accessed by the use the functions createSoapMessage, callSoapService, and parseSoapResponse.
3.4. Spatial Annotation and Atlas Integration
As of recently, LabIS provides atlas mapping and registration functionality16. Major features include the possibility to associate Results collection to atlases and to map individual members of the collection to normalized atlas imaging space. At present only pseudo 3D datasets (i.e., series of 2D images) are supported due to the paucity of publicly available high-resolution 3D atlas datasets on the web.
The atlasing integration module of LabIS is backed up by the spatial extensions of MySQL, which in turn realize a subset of the Open Geospatial Consortium (OpenGIS) specification functionality. Notably, those extensions compute spatial relationships between objects and facilitate formulation of spatial queries.
A user case is demonstrated in Figure 7 where some measurements are mapped to a rat coronal histological atlas. This is achieved by integration with public atlas datasets, for example those available at http://brainmaps.org/. LabIS realizes generic atlas mapping functionality by using multi-resolution tiled images, for example those in Zoomify17 format. The image rendering functionality on the client side is based on the Brain Maps web application programing interface (Mikula et al., 2007) and enhanced by incorporation of JSON-RPC functionality. The client-server interaction is realized by invoking JSON-RPC calls on the server. The user can mark and label the imported atlas dataset. Enhanced functionality is drawing and labeling of ROIs which can be stored in the database. This provides also possibilities for spatial querying of the measurements datasets.
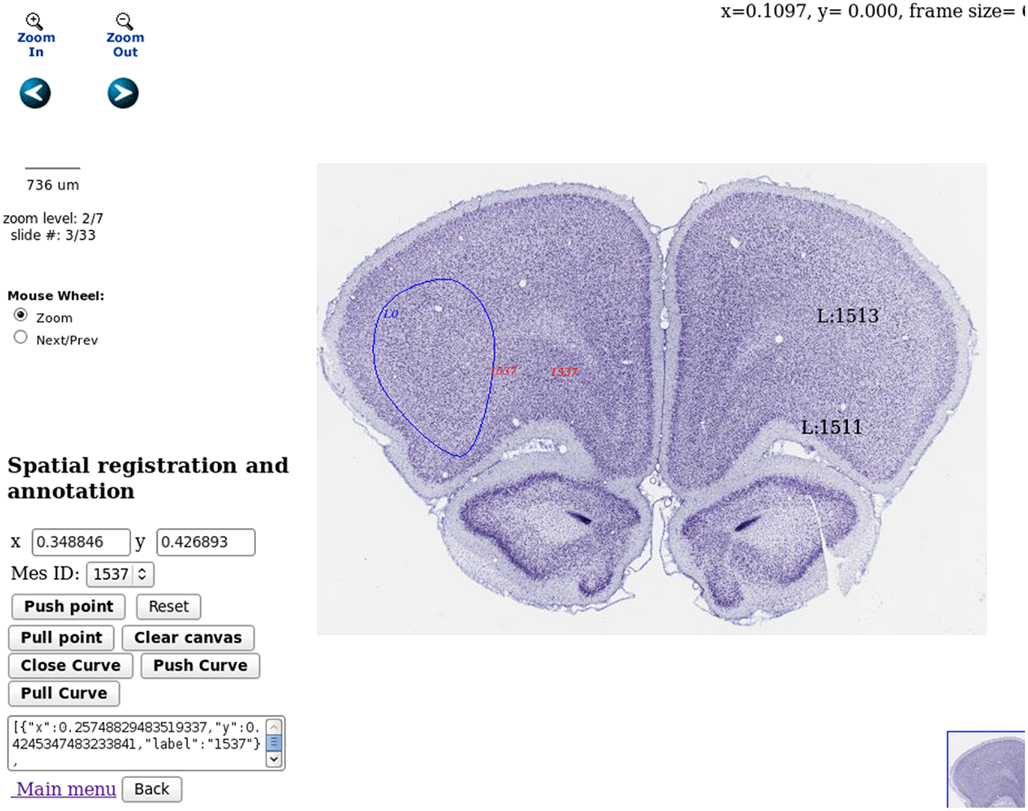
Figure 7. Spatial annotation and atlas registration. Three types of atlas annotations are demonstrated in the figure. In solid blue is displayed a ROI annotation delineating a region in the frontal cortex, dataset r3778, Nissl stating, source Brain Maps, contributed by Jones (2007, http://brainmaps.org/index.php?action=metadata&datid=94). In red are demonstrated provisional annotations produced by mouse clicks on the client side. In black are demonstrated measurements, already stored on the server. Spatial annotation storage and retrieval can be done using the user interface in the bottom left part of the web page. Spatial navigation in the atlas dataset can be done using the icons in the top left part of the web page.
Older user cases are also available. Developmental versions of the system supported data disclosed in publications about: motor endplate distributions in Prodanov (2006) and Prodanov et al. (2005); synaptic boutons morphometry in Prodanov (2006) and Prodanov et al. (2006); peripheral axon spatial distributions in Prodanov (2006), Prodanov et al. (2004, 2007, 2010), and Prodanov and Feirabend (2008).
4. Discussion
Key features of so-presented information system can be discussed in several aspects. On the application level, advantages of the system are the demonstrated seamless interoperability between Java, PHP, and browser technologies (notably JavaScript) and the use of open communication standards, notably SOAP and JSON-RPC. On the system level, advantages of the system are the extendable data model, the independence of a particular programming language and the scalability of the component technologies, resulting in overall scalability with regard to the performance. On the level of exploitation and deployment, advantages of the system are the use of open-source platforms, which are available as standard hosting options in the most web hosting services.
The design of the information system follows several basic principles. In the first place, LabIS incorporates commonly accepted basic software technologies. The information system uses open-source software technologies and open communication and data storage protocols. This choice was made in order to allow for a better interoperability in the context of the experimental workflow (Figure 1). On the second place, to enforce data organization in a structured manner, LabIS realizes a centralized data storage model. It should be noted that LabIS is not a raw image database. The raw images are let to reside in remote repositories, such as on a local client file system or third party file server, while only references to them are stored centrally. In contrast, the imaging meta-data and the produced measurements are stored centrally in the relational database. Such an approach provides a definite advantage for the integration of third party imaging data, such as large scale digital atlases. It also increases the portability of the system since its entire database can be easily copied from one host to another.
On the third place, LabIS is designed and developed in a modular manner. Individual modules share the same information object model but are autonomous from each other. In such way, different modules can be introduced incrementally in time depending on the actual needs of the end-users. Finally, since the type of imaging data and the measurements that are performed can change in the future, I designed an extendable data model for communication with third party applications.
4.1. Application Drivers
Until recently, management and storage of data were not considered as critical issues in the academic environments. Scientific journal articles were regarded as final and sufficient high-level summaries of the experimental findings.
However, the volumes of raw data generated by the current imaging experiments require scalable data management and archiving solutions (Bjaalie, 2002). Prominent examples of this upscaling are the projects exploring brain connectivity at the microscopic scale through large scale microcircuitry reconstructions and modeling in species like rat – the Blue Brain (Markram, 2006); drosophila – (Cardona et al., 2010) and human – the Human connectome project (Hagmann et al., 2010). Although, the latter project depends on functional magnetic imaging (fMRI), and diffusion tensor imaging (DTI) data18. This evolution mirrors the development of genomics and proteomics data warehouses [for example GenBank (Benson et al., 2000), Structural Folds of Protein database (SCOP; Andreeva et al., 2004), and Protein Data Bank database (PDB; Weissig et al., 2000)].
Moreover, with the advent of high-throughput and high-content imaging methods considerable amounts of experimental data need to be stored and analyzed (Price et al., 2002; Manning et al., 2008; Watson, 2009). In electron microscopy, recently developed serial section transmission electron microscopy (ssTEM) techniques for serial imaging and reconstruction enables ultramicroscopic reconstruction of complete invertebrate nervous systems (Anderson et al., 2009; Cardona et al., 2010). Currently, quantitative analysis of molecular events in living organisms is performed with the combined application of imaging and genetic engineering technologies. Assays can include, for example, ligand screening (Loo et al., 2007; Szafran et al., 2008; Sutherland et al., 2011), cell transfection (Chang et al., 2004), and RNA interference (Echeverri and Perrimon, 2006; Moffat et al., 2006). High-throughput imaging encompasses also non-optical data of entire animals. Examples can be given in high-throughput MR imaging (Schneider et al., 2003; Pieles et al., 2007), computed tomography (CT; Johnson et al., 2006), and in vivo bioluminescence (Stell et al., 2007). High-content screening (HCS) combines the efficiency of high-throughput techniques with the ability of cellular imaging to collect quantitative data from complex biological systems. The HCS field has evolved from a technology used exclusively by the pharmaceutical industry for secondary drug screening, to a technology used for primary drug screening and fundamental research in academia. Biologists can now prepare and automatically image thousands of samples per day thus enabling chemical screens and functional genomics (for example, using RNA interference technology; Perlman et al., 2004; Loo et al., 2007). Typically, in a single experiment, tens to hundreds of experimental conditions are screened (Perlman et al., 2004; Echeverri and Perrimon, 2006; Moffat et al., 2006; Loo et al., 2007). Output data can comprise, for example, cell counts, per-cell protein levels, and morphological parameters (such as, sizes, cell/organelle shape, or subcellular patterns of DNA or protein staining). Such experiments can be analyzed in high-content manner using automated or semi-automated workflows, for example using open-source tools like CellProfiler (Carpenter et al., 2006). Commercial software of this type is also present, with a main application in the pharmaceutical screening market, by companies including Cellomics, TTP LabTech, Evotec, Molecular Devices, and GE Healthcare (Garippa, 2004). Application domains of these packages are mainly mammalian cell types and cellular features of pharmaceutical interest, including protein translocation, micronucleus formation, neurite outgrowth, and cell count. It is plausible to consider that so-outlined application drivers can eventually lead to scaling behavior of the biomedical imaging datasets mirroring the Moore’s law in computing hardware. An analogous trend has already been recognized in neural recordings (Stevenson and Kording, 2011).
In the past 10 years, there has been an increasing focus on developing novel image processing, data mining, and database tools (Peng, 2008; Swedlow and Eliceiri, 2009). So-described process of upscaling of research infrastructure also requires complementary development of software and communication protocols, collectively denoted as “scientific middleware” (Prodanov, 2008). It eventually allows researchers to transparently use and share distributed resources, such as computing times, raw data, network services, and instruments. Therefore, a major design concern in scientific middleware needs to be scalability of performance and modularity. Modularity in the sense that features non-envisioned in the primary design features could be added in a manner that would not affect the core functionality. Examples can be given by the projects μManager (Edelstein et al., 2010), ImageJ, and CellProfiler.
4.2. Interoperability Issues and Application Domains
Major issues for the management of biomedical imaging data can be outlined as (i) the lack of interoperability between the major acquisition and analysis packages; (ii) the intrinsic complexity and heterogeneity of the meta-data. From the neuroinformatics perspective these issues are recognized as the “databasing challenge,” notably the accumulation, storage, management, and sharing of data; and the “tools challenge,” notably the development and sharing of tools for data analyses (Bjaalie, 2008). While the complexity issue was already outlined in the Introduction, the following section focuses on the interoperability.
Image acquisition, processing and data analysis involves data exchange between heterogeneous hardware and software. This requires maintaining interoperability between multiple, and most often, heterogeneous software packages and hardware devices. Interoperability can be achieved by: (i) adhering to common (i.e., mutually accepted) data exchange formats and communication protocols; or by (ii) direct integration of hardware (resp. software) in acquisition or analysis platforms.
On the image acquisition level, the interoperability challenge is being addressed by the project μManager (Edelstein et al., 2010). The μManager system facilitates microscope control and image acquisition and aims at the development of open-source software for control of automated microscopes. Drivers for different microscopic components are supported in modular manner thus allowing independent setups to be built.
On the image storage level the interoperability is addressed by OME (respectively OMERO) which provides structured storage and data import from a great number of proprietary image file formats. According to Swedlow et al. (2003) the most important recommendations that would help bridge the heterogeneity are that the meta-data should be readable by third party software using a widely accepted package or library and the commercial software programs need to provide data export to an open meta-data specification and the scientists should use image processing and analysis tools that preserve image meta-data. On the image processing level, the challenge is addressed by CellProfiler which allows for the composition of complex processing workflows using a number of third party tools.
On the measurement and application level, the interoperability is addressed by LabIS. Presented interoperability cases demonstrate the integration of LabIS in the experimental workflow on the level of the organization and interpretation of the derived data.
Functionality realized in LabIS can be used in several directions. In the first place, LabIS is a workflow management tool. As such it allows for organization and reporting of the performed experiments. On the second place, LabIS can be used as a processed data (i.e., measurements) repository. Using the web-service or the database interfaces, the data can be accessed by computational and statistical environments, such as Matlab and the R-language. On the third place, LabIS can be used as a data sharing tool. It allows publication of the raw experimental data with any desired degree of restriction of the details. Such data can be used by other research teams to support collaborations. In contrast to specific atlasing tools, such as the Rodent Brain Workbench19 (Moene et al., 2007), LabIS is much less application-centric. Sharing of the raw data and measurements in neuroscience gains momentum. It is believed that the widespread sharing of data and tools for neuroscientific research will accelerate the development of neuroinformatics (Eckersley et al., 2003). The exchange of raw neuroscience data between groups presents the opportunity to differently re-analyze previously collected data and encourage new interpretations (Amari et al., 2002). With the increase of experimental complexity and the size restrictions imposed by the scientific publishers, frequently essential experimental details are omitted from the final peer reviewed publications. This would eventually lead to unnecessary reproduction of experiments and waste of time and resources. On the other hand, data sharing can reduce experimental and analytical error.
Conflict of Interest Statement
The author declares that the research was conducted in the absence of any commercial or financial relationships that could be construed as a potential conflict of interest.
Footnotes
- ^http://www.openmicroscopy.org/site
- ^http://ccdb.ucsd.edu/index.shtm
- ^http://opencv.willowgarage.com/wiki/
- ^http://www.bioimage.ucsb.edu/bisque
- ^http://www.xnat.org/
- ^http://www.geneontology.org
- ^http://www.obofoundry.org/cgi-bin/detail.cgi?id=unit
- ^http://www.ebi.ac.uk/ols
- ^http://obofoundry.org/
- ^http://bioportal.bioontology.org/
- ^http://www.php.net
- ^http://www.mysql.com
- ^http://www.apache.org
- ^http://sourceforge.net/projects/nusoap
- ^http://www.mathworks.com/help/techdoc/ref/createclassfromwsdl.html
- ^Currently only the Mozilla Firefox web browser’s JavaScript engine is fully supported. Internet Explorer is supported as of version 7. While Safari and Chorme browsers are not tested.
- ^www.zoomify.com
- ^http://www.humanconnectomeproject.org/
- ^http://rbwb.org/
References
Amari, S.-I., Beltrame, F., Bjaalie, J. G., Dalkara, T., Schutter, E. D., Egan, G. F., Goddard, N. H., Gonzalez, C., Grillner, S., Herz, A., Hoffmann, K.-P., Jaaskelainen, I., Koslow, S. H., Lee, S.-Y., Matthiessen, L., Miller, P. L., Silva, F. M. D., Novak, M., Ravindranath, V., Ritz, R., Ruotsalainen, U., Sebestra, V., Subramaniam, S., Tang, Y., Toga, A. W., Usui, S., Pelt, J. V., Verschure, P., Willshaw, D., Wrobel, A., and Group, O. E. C. D. N. W. (2002). Neuroinformatics: the integration of shared databases and tools towards integrative neuroscience. J. Integr. Neurosci. 1, 117–128.
Anderson, J. R., Jones, B. W., Yang, J.-H., Shaw, M. V., Watt, C. B., Koshevoy, P., Spaltenstein, J., Jurrus, E., V, K. U., Whitaker, R. T., Mastronarde, D., Tasdizen, T., and Marc, R. E. (2009). A computational framework for ultrastructural mapping of neural circuitry. PLoS Biol. 7, e1000074. doi: 10.1371/journal.pbio.1000074
Andreeva, A., Howorth, D., Brenner, S. E., Hubbard, T. J. P., Chothia, C., and Murzin, A. G. (2004). Scop database in 2004: refinements integrate structure and sequence family data. Nucleic Acids Res. 32, D226–D229.
Ashburner, M., Ball, C. A., Blake, J. A., Botstein, D., Butler, H., Cherry, J. M., Davis, A. P., Dolinski, K., Dwight, S. S., Eppig, J. T., Harris, M. A., Hill, D. P., Issel-Tarver, L., Kasarskis, A., Lewis, S., Matese, J. C., Richardson, J. E., Ringwald, M., Rubin, G. M., and Sherlock, G. (2000). Gene ontology: tool for the unification of biology. The gene ontology consortium. Nat. Genet. 25, 25–29.
Benson, D. A., Karsch-Mizrachi, I., Lipman, D. J., Ostell, J., Rapp, B. A., and Wheeler, D. L. (2000). GenBank. Nucleic Acids Res. 28, 15–18.
Bjaalie, J. G. (2002). Opinion: localization in the brain: new solutions emerging. Nat. Rev. Neurosci. 3, 322–325.
Bjaalie, J. G. (2008). Understanding the brain through neuroinformatics. Front. Neurosci. 2:19–21. doi: 10.3389/neuro.01.022.2008
Brazma, A., Hingamp, P., Quackenbush, J., Sherlock, G., Spellman, P., Stoeckert, C., Aach, J., Ansorge, W., Ball, C. A., Causton, H. C., Gaasterland, T., Glenisson, P., Holstege, F. C., Kim, I. F., Markowitz, V., Matese, J. C., Parkinson, H., Robinson, A., Sarkans, U., Schulze-Kremer, S., Stewart, J., Taylor, R., Vilo, J., and Vingron, M. (2001). Minimum information about a microarray experiment (miame)-toward standards for microarray data. Nat. Genet. 29, 365–371.
Cardona, A., Saalfeld, S., Preibisch, S., Schmid, B., Cheng, A., Pulokas, J., Tomancak, P., and Hartenstein, V. (2010). An integrated micro- and macroarchitectural analysis of the drosophila brain by computer-assisted serial section electron microscopy. PLoS Biol. 8, e1000502. doi: 10.1371/journal.pbio.1000502
Carpenter, A. E., Jones, T. R., Lamprecht, M. R., Clarke, C., Kang, I. H., Friman, O., Guertin, D. A., Chang, J. H., Lindquist, R. A., Moffat, J., Golland, P., and Sabatini, D. M. (2006). Cellprofiler: image analysis software for identifying and quantifying cell phenotypes. Genome Biol. 7, R100.
Chang, F.-H., Lee, C.-H., Chen, M.-T., Kuo, C.-C., Chiang, Y.-L., Hang, C.-Y., and Roffler, S. (2004). Surfection: a new platform for transfected cell arrays. Nucleic Acids Res. 32, e33.
Côté, R. G., Jones, P., Apweiler, R., and Hermjakob, H. (2006). The ontology lookup service, a lightweight cross-platform tool for controlled vocabulary queries. BMC Bioinformatics 7, 97. doi: 10.1186/1471-2105-7-97
Côté, R. G., Jones, P., Martens, L., Apweiler, R., and Hermjakob, H. (2008). The ontology lookup service: more data and better tools for controlled vocabulary queries. Nucleic Acids Res. 36, W372–W376.
Echeverri, C. J., and Perrimon, N. (2006). High-throughput RNAi screening in cultured cells: a user’s guide. Nat. Rev. Genet. 7, 373–384.
Eckersley, P., Egan, G. F., Ichi Amari, S., Beltrame, F., Bennett, R., Bjaalie, J. G., Dalkara, T., Schutter, E. D., Gonzalez, C., Grillner, S., Herz, A., Hoffmann, K. P., Jaaskelainen, I. P., Koslow, S. H., Lee, S.-Y., Matthiessen, L., Miller, P. L., da Silva, F. M., Novak, M., Ravindranath, V., Ritz, R., Ruotsalainen, U., Subramaniam, S., Toga, A. W., Usui, S., van Pelt, J., Verschure, P., Willshaw, D., Wrobel, A., Tang, Y., and on Neuroinformatics, O. E. C. D. W. G. (2003). Neuroscience data and tool sharing: a legal and policy framework for neuroinformatics. Neuroinformatics 1, 149–165.
Edelstein, A., Amodaj, N., Hoover, K., Vale, R., and Stuurman, N. (2010). Computer control of microscopes using μManager. Curr. Protoc. Mol. Biol. 92, 14.20.1–14.20.17.
Garippa, R. (2004). A multi-faceted approach to the advancement of cell-based drug discovery. Drug Discov. World 6, 43–55.
Goldberg, I. G., Allan, C., Burel, J.-M., Creager, D., Falconi, A., Hochheiser, H., Johnston, J., Mellen, J., Sorger, P. K., and Swedlow, J. R. (2005). The open microscopy environment (OME) data model and xml file: open tools for informatics and quantitative analysis in biological imaging. Genome Biol. 6, R47.
Hagmann, P., Cammoun, L., Gigandet, X., Gerhard, S., Grant, P. E., Wedeen, V., Meuli, R., Thiran, J.-P., Honey, C. J., and Sporns, O. (2010). MR connectomics: principles and challenges. J. Neurosci. Methods 194, 34–45.
Johnson, J. T., Hansen, M. S., Wu, I., Healy, L. J., Johnson, C. R., Jones, G. M., Capecchi, M. R., and Keller, C. (2006). Virtual histology of transgenic mouse embryos for high-throughput phenotyping. PLoS Genet. 2, e61. doi: 10.1371/journal.pgen.0020061
Kvilekval, K., Fedorov, D., Obara, B., Singh, A., and Manjunath, B. (2010). Bisque: a Platform for bioimage analysis and management. Bioinformatics 26, 544–552
Lependu, P., Dou, D., Frishkoff, G. A., and Rong, J. (2008). Ontology database: a new method for semantic modeling and an application to brainwave data. Lect. Notes Comput. Sci. 5069, 313–330.
Linkert, M., Rueden, C. T., Allan, C., Burel, J.-M., Moore, W., Patterson, A., Loranger, B., Moore, J., Neves, C., Macdonald, D., Tarkowska, A., Sticco, C., Hill, E., Rossner, M., Eliceiri, K. W., and Swedlow, J. R. (2010). Metadata matters: access to image data in the real world. J. Cell Biol. 189, 777–782.
Loo, L.-H., Wu, L. F., and Altschuler, S. J. (2007). Image-based multivariate profiling of drug responses from single cells. Nat. Methods 4, 445–453.
Manning, H. C., Lander, A., McKinley, E., and Mutic, N. J. (2008). Accelerating the development of novel molecular imaging probes: a role for high-throughput screening. J. Nucl. Med. 49, 1401–1404.
Marcus, D. S., Olsen, T. R., Ramaratnam, M., and Buckner, R. L. (2007). The Extensible Neuroimaging Archive Toolkit: an informatics platform for managing, exploring, and sharing neuroimaging data. Neuroinformatics 5, 11–34.
Mikula, S., Trotts, I., Stone, J. M., and Jones, E. G. (2007). Internet-enabled high-resolution brain mapping and virtual microscopy. Neuroimage 35, 9–15.
Moene, I. A., Subramaniam, S., Darin, D., Leergaard, T. B., and Bjaalie, J. G. (2007). Toward a workbench for rodent brain image data: systems architecture and design. Neuroinformatics 5, 35–58.
Moffat, J., Grueneberg, D. A., Yang, X., Kim, S. Y., Kloepfer, A. M., Hinkle, G., Piqani, B., Eisenhaure, T. M., Luo, B., Grenier, J. K., Carpenter, A. E., Foo, S. Y., Stewart, S. A., Stockwell, B. R., Hacohen, N., Hahn, W. C., Lander, E. S., Sabatini, D. M., and Root, D. E. (2006). A lentiviral RNAi library for human and mouse genes applied to an arrayed viral high-content screen. Cell 124, 1283–1298.
Peng, H. (2008). Bioimage informatics: a new area of engineering biology. Bioinformatics 24, 1827–1836.
Perlman, Z. E., Slack, M. D., Feng, Y., Mitchison, T. J., Wu, L. F., and Altschuler, S. J. (2004). Multidimensional drug profiling by automated microscopy. Science 306, 1194–1198.
Pieles, G., Geyer, S. H., Szumska, D., Schneider, J., Neubauer, S., Clarke, K., Dorfmeister, K., Franklyn, A., Brown, S. D., Bhattacharya, S., and Weninger, W. J. (2007). Micromri-hrem pipeline for high-throughput, high-resolution phenotyping of murine embryos. J. Anat. 211, 132–137.
Price, J. H., Goodacre, A., Hahn, K., Hodgson, L., Hunter, E. A., Krajewski, S., Murphy, R. F., Rabinovich, A., Reed, J. C., and Heynen, S. (2002). Advances in molecular labeling, high throughput imaging and machine intelligence portend powerful functional cellular biochemistry tools. J. Cell. Biochem. Suppl. 39, 194–210.
Prodanov, D. (2006). Morphometric Analysis of the Rat Lower Limb Nerves. Anatomical Data Forneural Prosthesis Design. Ph.D. thesis, Twente University, Enschede.
Prodanov, D. (2008). “Bidirectional communication of imaging data over the internet using ImageJ,” in Proceedings of the 2nd ImageJ User and Developer Conference, eds A. Jahnen, and C. Moll, Luxembourg, 76–84.
Prodanov, D. (2009). “Data ontology and information system for management of image measurements over the internet,” in Frontiers in Neuroinformatics: 2nd INCF Congress of Neuroinformatics, Plzen.
Prodanov, D., Feirabend, H. K., and Marani, E. (2010). “Quantitative microscopic analysis of myelinated nerve fibers,” in Horizons in Neuroscience Research, Volume 2 of Horizons in Neuroscience Research (Hauppauge, NY: Nova Science Publishers), 213–271.
Prodanov, D., and Feirabend, H. K. P. (2008). Automated characterization of nerve fibers labeled fluorescently: determination of size, class and spatial distribution. Brain Res. 1233, 35–50.
Prodanov, D., Heeroma, J., and Marani, E. (2006). Automatic morphometry of synaptic boutons of cultured cells using granulometric analysis of digital images. J. Neurosci. Methods 151, 168–177.
Prodanov, D., Nagelkerke, N., and Lakke, E. J. (2004). “K-function based approach for topographical description of the peripheral nerve fibers,” in Proceedings of the Dutch Annual Conference on Biomedical Engineering, IBMT, Arnhem, 114–116.
Prodanov, D., Nagelkerke, N., and Marani, E. (2007). Spatial clustering analysis in neuroanatomy: applications of different approaches to motor nerve fiber distribution. J. Neurosci. Methods 160, 93–108.
Prodanov, D., Thil, M.-A., Marani, E., Delbeke, J., and Holsheimer, J. (2005). Three-dimensional topography of the motor endplates of the rat gastrocnemius muscle. Muscle Nerve 32, 292–302.
Schneider, J. E., Bamforth, S. D., Farthing, C. R., Clarke, K., Neubauer, S., and Bhattacharya, S. (2003). High-resolution imaging of normal anatomy, and neural and adrenal malformations in mouse embryos using magnetic resonance microscopy. J. Anat. 202, 239–247.
Stell, A., Belcredito, S., Ramachandran, B., Biserni, A., Rando, G., Ciana, P., and Maggi, A. (2007). Multimodality imaging: novel pharmacological applications of reporter systems. Q. J. Nucl. Med. Mol. Imaging. 51, 127–138.
Stevenson, I. H., and Kording, K. P. (2011). How advances in neural recording affect data analysis. Nat. Neurosci. 14, 139–142.
Sutherland, J. J., Low, J. A., Blosser, W., Dowless, M. S., Engler, T. A., and Stancato, L. F. (2011). A robust high-content imaging approach for probing the mechanism of action and phenotypic outcomes of cell cycle modulators. Mol. Cancer Ther. 10, 242–254.
Swedlow, J. R., and Eliceiri, K. W. (2009). Open source bioimage informatics for cell biology. Trends Cell Biol. 19, 656–660.
Swedlow, J. R., Goldberg, I., Brauner, E., and Sorger, P. K. (2003). Informatics and quantitative analysis in biological imaging. Science 300, 100–102.
Swedlow, J. R., Goldberg, I. G., Eliceiri, K. W., and Consortium, O. M. E. (2009). Bioimage informatics for experimental biology. Annu. Rev. Biophys. 38, 327–346.
Szafran, A. T., Szwarc, M., Marcelli, M., and Mancini, M. A. (2008). Androgen receptor functional analyses by high throughput imaging: determination of ligand, cell cycle, and mutation-specific effects. PLoS ONE 3, e3605. doi: 10.1371/journal.pone.0003605
Weissig, V., Lizano, C., and Torchilin, V. P. (2000). Selective DNA release from DQA-some/DNA complexes at mitochondria-like membranes. Drug Deliv. 7, 1–5.
Appendix
A. LabIS User Interface
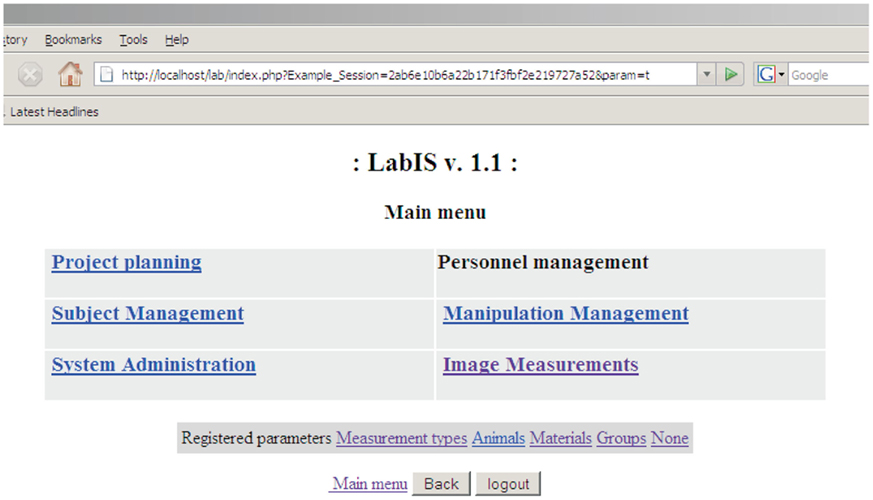
Figure A1. The main menu of LabIS.
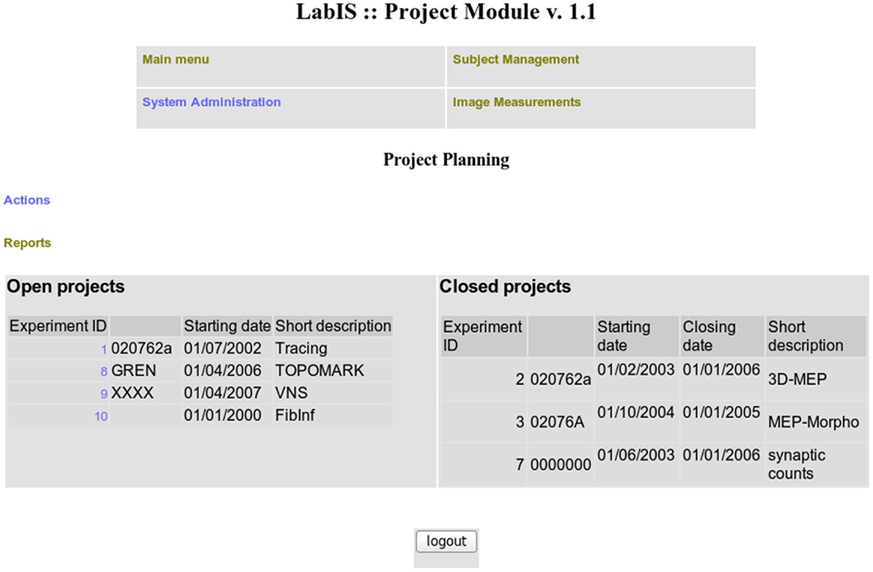
Figure A2. The projects module.
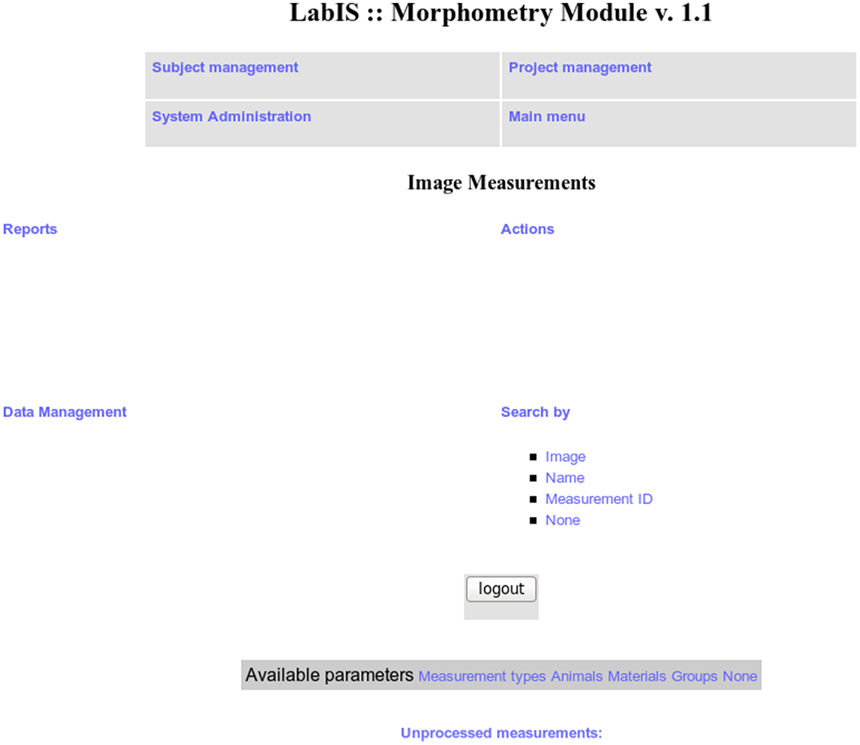
Figure A3. The Image measurements and morphometry module.
B. XML and SOAP
B.1. XML and Name-Spaces
The Extensible Markup Language (XML) is a general-purpose open standard for creating custom markup documents. It is extensible in the sense that it allows its users to define their own elements using “name-spaces.” Its primary purpose is to facilitate sharing of information between information systems. The specification of XML is supported by the World Wide Web Consortium (W3C). The recommendation specifies both the lexical grammar and the requirements for parsing. An XML document may contain element or attribute names from more than one XML vocabulary.
The XML name-spaces are controlled vocabularies of the language containing collections of structuring elements which are not part of the original specification but comply to the XML grammar. They are defined by a W3C recommendation called Namespaces in XML.
XML Schema, published as a W3C recommendation in May 2001, is one of several XML schema languages. XML Schema is a XML language for data structures (i.e., schemas), prescribed by the W3C as the successor of DTDs. XML Schema can be used to express a schema: a set of rules to which an XML document must conform in order to be considered “valid” according to that schema.
B.2. SOAP Protocol Primer
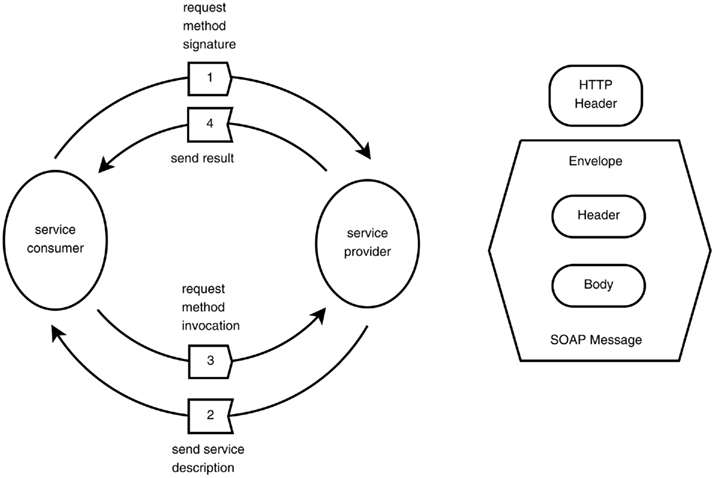
Figure A4. The SOAP protocol. Interaction between the service consumer and the service provider (top). Elements of the SOAP message over HTTP (bottom).
B.3. Main Functionality of the Web-Service
The main operations and functionality of the SOAP binding are summarized in Tables A1 and A2.
SOAP is a protocol for exchanging XML-based messages over computer networks, normally using HTTP/HTTPS. SOAP once stood for “Simple Object Access Protocol” but this acronym was dropped with Version 1.2 of the standard, as it was considered to be misleading.
The primitive data types are defined by the XMLSchema
xsd and xsi name-spaces, while the web-service components are defined by the Web-Service Description Language WSDL name-space (Christensen et al., 2001a), which describes the public operations the web-service clients can execute (see Figure A4). The SOAP protocol is defined by 3 name-spaces: xmlns:soap, xmlns:SOAP-ENV, and xmlns:SOAP-ENC (Table A1). SOAP forms the foundation layer of the web-services providing a basic messaging framework, upon which the application layers was built. The ontology names-space is denoted as IJMes. It is an expansion of the SOAP and WSDL name spaces.
SOAP forms the foundation layer of the web-services protocol stack providing a basic messaging framework upon which abstract layers can be built. An example of the SOAP message exchange is provided in Listings 1 and 2. The protocol is based on asynchronous exchange of messages. The key features of the SOAP messages are that (i) a SOAP message is a valid XML document, (ii) a SOAP message must use the SOAP Envelope name-space and (iii) a SOAP message must use the SOAP Encoding name-space.
Currently the communication patterns of the web-services are described in the terms of the WSDL specification. WSDL is an XML format for describing network services as a set of endpoints operating on messages containing either document-oriented or procedure-oriented information (Christensen et al., 2001b). The operations and messages are described abstractly, and then bound to a concrete network protocol and message format to define an endpoint (i.e., a service).
Listing 1: Example of the SOAP request
POST /lab/measure/netinput. php HTTP/1.0

Host: localhost

User-Agent: NuSOAP/0.7.3 (1.114)

Content-Type: text/xml; charset=ISO-8859-1

SOAPAction: "urn:IJMes#getCalibration"

Content–Length: 517


<?xml version="1.0" encoding="ISO-8859-1"?>

<SOAP-ENV:Envelope

SOAP-ENV:encodingStyle="http://schemas.xmlsoap.org/soap/encoding/"

xmlns:SOAP-ENV="http://schemas.xmlsoap.org/soap/envelope/"

xmlns:xsd="http://www.w3.org/2001/XMLSchema"
xmlns:xsi="http://www.w3.org/2001/XMLSchema-instance"

xmlns:SOAP–ENC="http://schemas.xmlsoap.org/soap/encoding/"

xmlns:tns="urn:IJMes">

<SOAP–ENV:Body>

<tns:getCalibration xmlns:tns="urn:IJMes">

                <c_id xsi:type="xsd:int">100</c_id>

</tns:getCalibration>

</SOAP-ENV:Body>

</SOAP-ENV:Envelope>
Listing 2: Example of the SOAP response
HTTP/1.1 200 OK

Date: Tue, 05 Aug 2008 12:26:41 GMT

Server: Apache /2.2.8 (Win32) PHP/5.2.6

X-Powered-By: PHP/5.2.6

Expires: Mon, 26 Jul 1997 05:00:00 GMT

Last-Modified: Tue, 05 Aug 2008 12:26:41 GMT

Cache-Control: no-cache, must-revalidate

Pragma: no-cache

X-SOAP-Server: NuSOAP/0.7.3 (1.114)

Content-Length: 822

Connection: close Content-Type: text/xml; charset=ISO-8859-1


<?xml version="1.0" encoding="ISO-8859-1"?>

<SOAP-ENV:Envelope

xmlns:SOAP-ENV="http://schemas.xmlsoap.org/soap/envelope/"

xmlns:xsd="http://www.w3.org/2001/XMLSchema"
xmlns:xsi="http://www.w3.org/2001/XMLSchema-instance"

xmlns:SOAP-ENC="http://schemas.xmlsoap.org/soap/encoding/"

mlns:tns="urn:IJMes">


<SOAP-ENV:Body>

<ns1:getCalibrationResponse xmlns:ns1="urn:IJMes">

<cal xsi:type="tns:Calibration">

<c id xsi:type="xsd:int">100</ c id>

<unit xsi:type="xsd:string">mm</unit>

<fX xsi:type="xsd:float">0.0149253731343284</fX>

....

</cal>

</ns1:getCalibrationResponse>

</SOAP-ENV:Body>


</SOAP-ENV:Envelope>
Listing 3: Example of the JSON-RPC request
POST /lab/measure/atserver. php HTTP/1.1

Host: 127.0.0.1:8080

User-Agent: Mozilla/5.0 (X11; U; Linux i686; en-US; rv:1.9.2.16)

Gecko/20110323 Ubuntu/10.04 (lucid) Firefox/3.6.16

Accept: text /html, application/xhtml+xml, application /xml; q = 0.9,*/*;q=0.8

Accept-Language: en-us, en; q=0.5

Accept-Encoding: gzip, deflate

Accept-Charset: ISO-8859-1,utf-8;q=0.7,*;q=0.7

Keep-Alive: 115

Connection: keep-alive

Content-Type: application/json; charset=UTF-8

Referer: http://localhost: 8080/lab/measure/test at srv-json. php

Content-Length: 59

Pragma: no-cache

Cache-Control: no-cache


{"method":"getLabelsInSlide","params": ["1","1","0"],"id":2}
C. JSON-RPC Protocol Primer
LabIS realizes Ajax-style interaction between the web browser and the web server via the Remote Procedure Call (RPC) pattern based on JSON (JavaScript Object Notation), e.g., JSON-RPC. The protocol is called JSON-RPC and is described in http://json-rpc.org/. Unsurprisingly, JSON-RPC has two components: JSON and RPC.
JSON (http://www.json.org) is not a complete programming language but a subset of the web browser scripting language JavaScript as defined in the ECMAScript Programming Language Standard, third edition (ECMA, 2009). JSON is a text format for the serialization of structured data. JSON-based communication protocols became a typical choice for Ajax web UIs, which eventually lead to the adoption of the pattern by the leading browsers Internet Explorer and Mozilla. This move further increased the support of JSON in languages such as Java, Perl and PHP. Compared to XML, JSON is much less verbose, which minimizes the network traffic and the parsing time of the messages. The format is easy to parse and handle by other software client and server-side languages. RPC is a communication pattern that allows a computer program to call execution of a subroutine or procedure in a remote address space (commonly on another computer on a shared network). Technologies that use RPC patterns are, for example Java via Remote Method Invocation, CORBA, XML-RPC, and SOAP.
The request consists of an HTTP POST request header and a message body formatted as a JSON string with elements id, method, and parameters params. The response consists of an HTTP response header and a message body formatted as a JSON string with elements id, result, and error.
Examples of JSON-RPC requests and responses are given in Listings 3 and 4.
Listing 4: Example of the JSON-RPC response
HTTP/1.1 200 OK

Date: Sun, 03 Jul 2011 14:22:25 GMT

Server: Apache /2.2.14 (Ubuntu)

X-Powered-By: PHP/5.3.2-1ubuntu4.7

Expires: Mon, 26 Jul 1997 05:00:00 GMT

Last-Modified: Sun, 03 Jul 2011 14:22:25 GMT

Cache-Control: no-cache, must-revalidate

Pragma: no-cache

Content-Length: 112

Keep-Alive: timeout=15, max=100

Connection: Keep-Alive

Content-Type: text / javascript; charset=iso-8859-1


{"id":2, "result" : {"labels" : [{ "label" : "1512","name" : "1512",

"x" : "0.236232","y" : "0.449104","z" : "0"}]}, "error" : null}
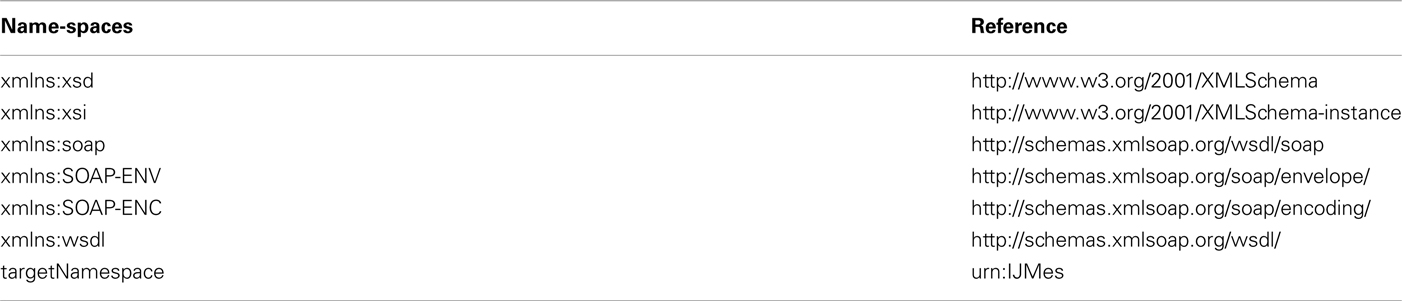
Table A1. Name-spaces of the web-service.
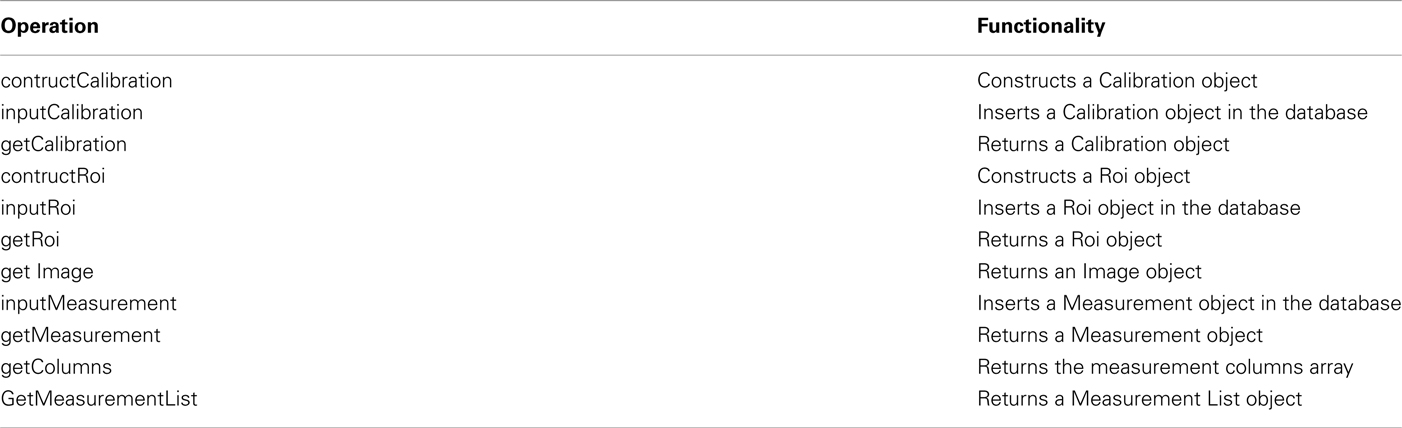
Table A2. Main operations and functionality.
References
Christensen, E., Curbera, F., Meredith, C., and Weeravarana, S. (2001a). Web Services Description Language (WSDL). 1.1. Technical Report W3C. Available at: http://www.w3.org/TR/soap/
Keywords: web-service, ontology, morphometry
Citation: Prodanov D (2011) Data ontology and an information system realization for web-based management of image measurements. Front. Neuroinform. 5:25. doi: 10.3389/fninf.2011.00025
Received: 04 October 2011; Accepted: 15 October 2011;
Published online: 25 November 2011.
Edited by:
John Van Horn, University of California at Los Angeles, USAReviewed by:
John Van Horn, University of California at Los Angeles, USACopyright: © 2011 Prodanov. This is an open-access article subject to a non-exclusive license between the authors and Frontiers Media SA, which permits use, distribution and reproduction in other forums, provided the original authors and source are credited and other Frontiers conditions are complied with.
*Correspondence: Dimiter Prodanov, Bioelectronic Systems Group, Interuniversity Microelectronics Centre, Kapeldreef 75, 3001 Leuven, Belgium. e-mail: dimiterpp@gmail.com; dimiter.prodanov@imec.be