An in vivo MRI template set for morphometry, tissue segmentation, and fMRI localization in rats
- 1 Department of Neuroimaging, Cuban Neuroscience Center, Havana, Cuba
- 2 Institute of Development, Aging and Cancer, Tohoku University, Sendai, Japan
Over the last decade, several papers have focused on the construction of highly detailed mouse high field magnetic resonance image (MRI) templates via non-linear registration to unbiased reference spaces, allowing for a variety of neuroimaging applications such as robust morphometric analyses. However, work in rats has only provided medium field MRI averages based on linear registration to biased spaces with the sole purpose of approximate functional MRI (fMRI) localization. This precludes any morphometric analysis in spite of the need of exploring in detail the neuroanatomical substrates of diseases in a recent advent of rat models. In this paper we present a new in vivo rat T2 MRI template set, comprising average images of both intensity and shape, obtained via non-linear registration. Also, unlike previous rat template sets, we include white and gray matter probabilistic segmentations, expanding its use to those applications demanding prior-based tissue segmentation, e.g., statistical parametric mapping (SPM) voxel-based morphometry. We also provide a preliminary digitalization of latest Paxinos and Watson atlas for anatomical and functional interpretations within the cerebral cortex. We confirmed that, like with previous templates, forepaw and hindpaw fMRI activations can be correctly localized in the expected atlas structure. To exemplify the use of our new MRI template set, were reported the volumes of brain tissues and cortical structures and probed their relationships with ontogenetic development. Other in vivo applications in the near future can be tensor-, deformation-, or voxel-based morphometry, morphological connectivity, and diffusion tensor-based anatomical connectivity. Our template set, freely available through the SPM extension website, could be an important tool for future longitudinal and/or functional extensive preclinical studies.
Introduction
A magnetic resonance image (MRI) “template set” comprises a reference or template image, which can be an image of average intensity and/or shape, and a set of either discrete or probabilistic images representing tissue types, all in the reference space. An undeniable landmark in this area is the statistical parametric mapping (SPM) software package (Friston et al., 2010), which provides a human average template and tissue priors of white matter, gray matter, and cerebrospinal fluid, as well as methods for spatial normalization and segmentation. The construction of this human template set can be found elsewhere (Mazziotta et al., 1995a,b, 2001) and its main applications are functional MRI (fMRI) localization, voxel-based morphometry (Ashburner and Friston, 2000) SPM (Friston et al., 2010), among others. To enrich the deliverables of the template set, various discrete digitalizations with finer parcellation of gray (Tzourio-Mazoyer et al., 2002; Rasser et al., 2008) and white matter (Hua et al., 2008; Mori et al., 2008), as well as their probabilistic versions (Shattuck et al., 2008), have been proposed. Combined with spatial normalization and tissue segmentation, these digital parcellations afford further morphometric applications, such as the statistical comparison of volumes and areas of regions-of-interest (ROI), deformation- (Chung et al., 2003) or tensor- (Kipps et al., 2005) based morphometry, ROI-based morphological connectivity (Sanabria-Diaz et al., 2010); anatomical connectivity between gray matter ROI-based diffusion tensor imaging (DTI) tractography (Iturria-Medina et al., 2007; Iturria-Medina et al., 2008); and localization of fMRI activation within ROIs (Tzourio-Mazoyer et al., 2002; Maldjian et al., 2003), which have been also useful for pre-surgical planning (Bizzi, 2009) or even providing seeds for DTI-tractography (Saur et al., 2010).
The aforementioned human neuroimaging applications are also required for rodents, since they constitute the animal models of preclinical research for human diseases. The importance of building mouse templates and structure digitalizations for morphometry is demonstrated in several papers. In contrast to manual 2D morphometry, SPM5 voxel-based morphometry in the R6/2 transgenic mouse detected differences between genotypes (Sawiak et al., 2009). Other phenotyping examples are the reduced cerebellar volume of the inferior colliculus and the olfactory bulbs reported for cdf mutant mice (Bock et al., 2006); the morphologic abnormalities found in various areas of the Reeler mouse brain (Badea et al., 2007b) and in the striatum of the YAC128 Huntington disease mouse model (Lerch et al., 2008); and the morphologic differences between the 129S1/SvImJ, C57/Bl6, and CD1 mouse strains (Chen et al., 2006). An excellent review on mice “templating” can be found in (Dorr et al., 2008), with more recent efforts in (Ma et al., 2008; Aggarwal et al., 2009; Chuang et al., 2011; Hawrylycz et al., 2011).
However, in spite of the recent uprising of rat models of epilepsy (Tenney et al., 2003; Nersesyan et al., 2004; David et al., 2008; Englot et al., 2008), Parkinson (Van Camp et al., 2003; Pelled et al., 2005; Hou et al., 2010), autism (Pletnikov et al., 2001; Osumi, 2009), Alzheimer (Ganten, 1998; Yang et al., 2011), stroke (Li et al., 2000; Aoki et al., 2003), spinal cord injury (Ramu et al., 2006; Endo et al., 2007; Takagi et al., 2009; Ghosh et al., 2010), depression (Huang et al., 2011), among others, there is less focus on the construction of rat templates and either discrete or probabilistic digitalizations of tissues or structures. In fact, although there have been different approaches (Toga et al., 1995; Leergaard et al., 2003; Keilholz et al., 2006; Hjornevik et al., 2007), only two papers have provided rat MRI template sets with average reference images, tissue segmentations, or discrete parcellations (Schweinhardt et al., 2003; Schwarz et al., 2006). Both sets however present various drawbacks:
• They are based on medium field MRI (4.7 T), though recent animal scanners are 7.0 T or higher. In fact, the most updated mouse templates come even from 9.4 T systems.
• Their average templates are built after linear registration of individual MRIs to a common space. As recently defended by (Lu et al., 2010), that policy responded to the sole goal of qualitative evaluations of roughly localized fMRI activations in stereotaxic spaces: BOLD elicited by forepaw stimulation in (Schweinhardt et al., 2003) and functional perfusion MRI after pharmacological administration in (Schwarz et al., 2006). In contrast, mouse templates have been built by means of hierarchical, multi-resolution non-linear registration schemes in order to achieve the highest possible spatial correspondence between all images of the sample. This means that the maximum possible information about the variability of the sample is stored in the deformation fields (Ashburner and Friston, 2000; Bookstein, 2001; Mechelli et al., 2005). Provided that the conditions for the warps are accomplished – i.e., the transformation is a diffeomorphism or a regularized enough to guarantee that the Jacobian is positive at every point of the region of interest – the higher the spatial match of the registered images the finer the details of the average image. Thus, the spatial normalization of any individual MRI can be achieved with the highest possible parameterization providing an optimized statistical performance for the discrimination of pathological individuals or samples.
• Their template spaces are biased, i.e. do not minimize the non-linear normalization deformations of all brains in the studied population. This introduces a bias in the registration toward those brains closest in shape to the template (Guimond, 2000; Kochunov et al., 2001a,b).
• Although probabilistic images of brain parenchyma and cerebrospinal fluid were provided in (Schwarz et al., 2006), there is a lack of probabilistic white matter and gray segmentations, used for the popular and worldwide used prior-based methods such as the SPM8 unified segmentation (Ashburner and Friston, 2005) or FSL–FAST1. To the knowledge of the authors, the only published priors for rodents are presented in (Sawiak et al., 2009) for mice.
For the aforementioned reasons, both template sets are not the most suitable for studies depending on (1) unbiased normalization methods (such as deformation- or tensor-based analysis, or detailed characterization of anatomical or functional features); (2) normalization combined with tissue segmentation [such as voxel-based morphometry, as done in (Sawiak et al., 2009) for mice]; or (3) both combined with digitalization-based classification (also called “automatic labeling”) of structures of the individual MRI (useful for ROI deformation-based morphometry as done in (Lerch et al., 2008) for mice, structure volumetry, as done in (Badea et al., 2007a) for mice, and possibly ROI-based DTI and morphological connectivity).
Therefore we present a new in vivo template set for rats with the first clear advantage of being based on a 7.0-T scanner. The set comprises a minimal deformation template (MDT), as in (Kovacevic et al., 2005), based on T2 MRIs of 30 male Wistar rats. The non-linear transformations were achieved by means of a multi-resolution, multi-grid, high dimensional registration method provided by a very general and adaptable software: “elastix” (Klein et al., 2010)2. Our set also contains probabilistic gray matter and white matter segmentations, which are reported for the first time for rats. These were assessed by averaging warped individual segmentations that were obtained from fitting various parametric and non-parametric curves to the histograms of the semi-manually non-brain stripped T2 MRIs. Additionally, we include a digitalization of 96 cortical structures of latest edition of the Paxinos and Watson (P & W) atlas (Paxinos and Watson, 2007), traditionally necessary for the anatomical interpretation of fMRI results since (Schwarz et al., 2006), and now useful for the aforementioned ROI-based analyses, within the cerebral cortex. This digital parcellation was warped to the average template by means of the approximate thin plate splines (TPS) non-linear registration method (Rohr et al., 2001) based on matching 36 pairs of landmarks in the template and atlas spaces. Our template set as well as the documentation about the chosen landmarks and digitalized regions are freely available either through the SPM extensions webpage3 or at http://www.idac.tohoku.ac.jp/bir/en/db/rb/101028.html.
Among the possible applications for which the template is intended we firstly prove its usefulness for three basic ones: (1) spatial normalization and (2) tissue segmentation of individual MRIs, and (3) automatic labeling of cortical structures in the individual MRI space. Note that in the case of studies not intended for precise anatomical characterizations relying on the structural T2 MRI, like fMRI or DTI, acquisition time must be reduced at expenses of the T2 image resolution, which becomes a secondary aspect, though necessary for these basic applications. Therefore, we also test them with “coarser” MRIs, i.e., those having a lower resolution and much shorter acquisition time than those used for the construction of the template set. Besides, we validated the performance of spatial normalization in localizing fMRI activations elicited by forepaw and hindpaw stimulation within the expected cortical regions, in both hemispheres. The aforementioned three basic applications also served to calculate and report the average and SD of the volumes of the cortical structures defined by the atlas. To illustrate morphometric applications in vivo, we probe volume–body weight correlations, evidencing some features of Wistar brain ontogenesis.
Materials and Methods
Notation
A lower case bold symbol, e.g., f, denotes a column vector. An upper case bold symbol, e.g., An × m, denotes a matrix whose size is specified by the corresponding subscripts, if they appear. Non-bold symbols denote scalar magnitudes. 1n × m and 0n × m are n × m matrices of ones and zeros respectively. ||f||2 is the Frobenius norm of f. The symbol ∧ denotes the logical operator “AND.” The symbol⊗denotes the Kronecker product. The superscript T denotes transposition.
Animal Preparation
For the template construction and volumetry
Thirty (30) Wistar rats (Charles River Japan, Yokohama, Japan) were used for the template construction. They were distributed into five groups of six rats for each week of age (6, 7, 8, 9, 10 weeks old, body weight ranges of 214 ± 19, 275 ± 21, 312 ± 9, 331 ± 17, 364 ± 18 g, respectively). All procedures and protocols were performed in agreement with the policies established by the “Animal Care Committee” at Tohoku University, Sendai, Japan. Each rat was initially anesthetized with 5% isoflurane and then secured on a custom-built holder using adhesive tape and a bite bar. A breathing sensor (SA Instruments Inc., NY, USA) was placed under the ventral surface of the rat body. Anesthesia was further kept with isoflurane (at 1 L/min oxygenation), administered via a face mask. A constant breathing rate was maintained at around 50 breaths/min for the entire span of MRI acquisition by manually keeping the concentration of isoflurane in the range of 1.5–2.5%. This empirical rate is suitable for an MRI acquisition with satisfactorily low motion artifacts and little compromise of the scanning time. Core body temperature was maintained at 37.0 ± 1°C by means of a hot water-circulating pad.
For fMRI experiments
An additional 6 week old rat underwent fMRI experiment. The details of the experimental procedures are described in (Sumiyoshi et al., 2011). Briefly, the rat underwent mechanical ventilation (SAR-830AP Ventilator, CWE, Inc., Ardmore, PA, USA) with a combination of α-chloralose anesthesia (40 mg/kg/h, i.v.) and muscle relaxation administration (pancuronium bromide, 2 mg/kg/h i.v.). The physiological variables were maintained at normal limits by small adjustments in ventilation (end-tidal CO2 = 27.5 ± 4 mmHg). A pair of small needle electrodes (NE-224S, Nihon Koden, Tokyo, Japan) was inserted for electrical stimulation.
Magnetic Resonance Imaging
All MRI data were acquired using a 7.0-T Bruker PharmaScan system (Bruker Biospin, Ettlingen, Germany) with a 38-mm-diameter birdcage coil. Prior to all MRI experiments, we firstly performed a global magnetic field shimming inside the coil, which was completed in a ROI around gray matter (∼300 μL) by using a point resolved spectroscopic protocol (Sanganahalli et al., 2009). The line width (full width at half maximum) at the end of the shimming procedure ranged from 15 to 20 Hz in the ROI.
High resolution/long duration T2 MRI for the template construction and volumetry
High resolution T2-weighted images were obtained using a respiratory-gated 2D Turbo RARE sequence with fat suppression under the following parameters: TR = 10971 ms, TEeff = 30 ms, RARE factor = 4, effective spectral bandwidth = 100 kHz, flip angle = 90°, field of view = 32 mm × 32 mm, matrix size = 256 × 256, in-plane resolution = 125 μm × 125 μm, number of slices = 128, slice thickness = 0.3 mm, slice gap = 0 mm, and number of averages = 16. The total scanning time for T2-weighted imaging was around 3 h, depending on the respiration rate of the rat.
Low resolution/short duration T2 MRI for the fMRI experiments
In order to perform the necessary image processing (spatial registration and tissue segmentation), the fMRI experiment was accompanied by a low resolution T2 MRI with exactly the same parameters as the high quality one, excepting for the number of averages (10), the slice thickness (0.5 mm) and the number of slices (54). These parameters were chosen to reduce the scanning time of this image to around 50 min, making possible its inclusion in fMRI experiments.
Functional MRI experiments
We separately performed an fMRI experiment for each of the four types of electrical stimulations, i.e., forepaw and hindpaw, both left and right. A block-design paradigm (10 blocks) was employed for each fMRI experiment. Each block comprised 30 s of electrical stimulation followed by 40 s of the resting condition. The electrical pulses (3 Hz, 3.0 mA, and 0.3 ms width) were produced by a generator (SEN-3401, Nihon Koden) and an isolator (SS-203J, Nihon Koden).
The fMRI images were obtained by using a gradient-echo echo-planar imaging with fat suppression under the following parameters: TR = 2000 ms, TE = 15 ms, effective spectral bandwidth = 250 kHz, flip angle = 30°, field of view = 25 mm × 14 mm, matrix size = 125 × 70, in-plane resolution = 200 μm × 200 μm, number of slices = 7, slice thickness = 1.5 mm, slice gap = 0 mm, number of volumes = 370, and dummy scans = 4. The total scanning time for the fMRI experiment was 12 min and 20 s.
Construction of the Minimal Deformation Template
The intensity of each of the 30 high resolution MRIs was corrected for intensity inhomogeneities due to a non-ideal receiver coil profile (Ashburner, 2002). Then, similar to a procedure described in (Kovacevic et al., 2005), an intensity “equalization” of all corrected MRI was performed. This operation (described in Intensity “Equalization” of the MRIs in Appendix) simultaneously shifts the position and scales the width of the peak of the histogram of each MRI to be around those corresponding to a randomly chosen MRI.
The corrected high resolution MRIs were segmented into “brain only” MRIs by removing all voxels not belonging to the brain parenchyma, cerebellum, and ventricles. The binary brain mask was extracted using a modified version of the method described by (Uberti et al., 2009) for the mouse head. In this semi-automatic method, based on the level set theory, a 2D closed contour in each slice expands until reaching the edge of the brain, where an automatic stopping criterion is fulfilled. We found that this method shows imperfect results, e.g. the occasional inclusion of part of the trigeminal nerve in the mask. Therefore we decided to stop every contour manually, after visually inspecting it at each expanding step. We demanded a brain mask as more precise as possible for the non-linear registration procedures, but avoiding the excessive burden of a fully manual delineation.
The MDT was created with a multi-resolution, multi-grid registration scheme similar to (Kovacevic et al., 2005). After choosing the brain only MRI of the rat having the median body weight, all other were registered to its space trough affine registration. The affine transformations, say Mi i = 1…30, mapping the reference to the individual spaces were averaged and inverted. The resulting transformation, M0, was post multiplied by each individual transformation to obtain the transformations, M0Mi i = 1…30, to the best representative affine space. These were applied to obtain the first linear average template. Using elastix (Klein et al., 2010), a non-linear transformation mapping each point in template space to the i-th individual space, say fi(x), was estimated by optimizing a cost function based on the normalized mutual information between the template and the i-th individual brain only MRI. The non-linearly transformed images were averaged to obtain the second template. This procedure was iterated five times, using a multi-resolution scheme starting from a downsampling/blurring factor of 8 to 1 and randomly sampled grid spacing from 8 to 4. The final concatenated transformations were inverted and averaged, namely  Finally, all transformations were concatenated and applied to the original brain only MRIs and whole head corrected MRIs to obtain the final corresponding templates:
where T(x) represents either the MDT or the whole head MRI template and Ii(x) is the i-th individual MRI.
The MDT image extends from −8.29 to 8.58 mm left to right, from −15.66 to 6.71 mm caudal to ventral and from −4.56 to 8.06 mm ventral to dorsal; while for the whole head template these values are −15.29 to 16.58 mm, −21.41 to 16.84 mm, and −18.07 to 13.81 mm, respectively. The origin (anterior commissure) and orientation of the coordinate system is very similar to the convention established in (Hawrylycz et al., 2011), i.e., the “Waxholm space.” Voxel size (isotropic 1.25 mm3) is the actual value multiplied by 10 to make images usable in standard human software like SPM, i.e., 1 mm means 100 μm. The orientation of the images is left–right (neurological).
Assessment of the Probabilistic Tissue Segmentations
We provide probabilistic images of the gray matter, white matter, and cerebrospinal fluid of the Wistar rat in the P & W space. These types of images are considered as spatial priors in SPM segmentation (Ashburner and Friston, 2005; Friston et al., 2010). To obtain these priors, the native “brain only” MRIs were firstly segmented into tissue types by using a simple histogram analysis. Second, these native segmentations were warped to the MDT space using the transformations obtained in the subsection above to finally average them through individuals.
Figure 1B depicts the histogram of the individual “brain only” MRI shown in Figure 1A. Despite the evident contrast between white and gray matter in this image, suggesting the existence of at least two populations of voxels with intensities around two different intensity peaks, only a single global peak is clearly seen in Figure 1B. This is possibly due to noise and partial volume effects. Therefore, before any further analysis of the histogram, we applied an anisotropic filter (Perona and Malik, 1990) to the image. The effect of this filter is well known: its denoising effect narrows the distribution of the existing intensity populations while penalizing the smoothing operation in those regions where sharp edges are present (high gradient) avoiding additional partial volumes caused by the smoothing.
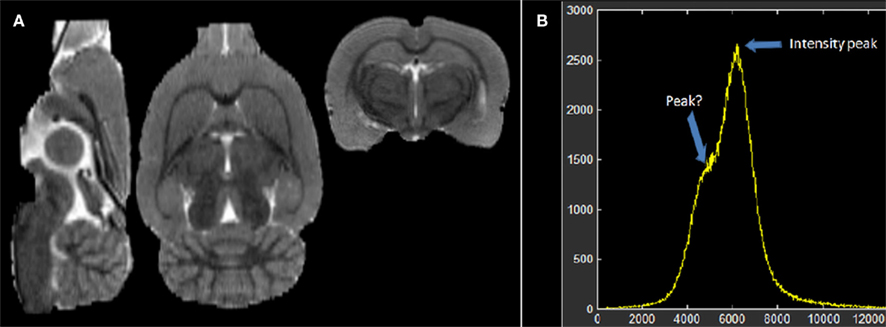
Figure 1. (A) Individual low resolution MRI of a rat and (B) its intensity histogram. Note that there is a global peak only, though it seems there is an unclear second peak.
The histogram of each filtered “brain only” MRI was fitted with four Gaussian curves, representing non-brain tissue, white matter, gray matter, and cerebrospinal fluid4. Additionally three non-parametric curves, representing partial volume populations5, fitted the residual part of the histogram not fitted by the Gaussians. The latter curves were obtained with a roughly empirical method: we subtracted the Gaussian curves from the histogram and zeroed the negative values, dividing the result into the three partial volume regions bounded by the centers of the Gaussians. Each voxel was labeled with seven probabilities, Pnb, Pnb/WM, PWM, PWM/GM, PGM, PGM/CSF, and PGM/CSF 6, corresponding to the values, at the intensity of the voxel, of the seven fitted functions normalized to sum 1. Based on purely empirical criteria, these probabilistic classifications were reduced to three tissue types, namely:
where μx = arg maxi Px(i), mx/y = arg mediani Px/y(i), H(i) is the Heaviside step function and f (i; μx) is a smooth function of the intensity i, decaying from its maximum at μx until zero at my/x and mx/z; y and z being the tissue types at both sides of tissue x in the histogram. This procedure is inspired by (Kovacevic et al., 2002) for segmenting human brains. Notwithstanding, they are merely empirical segmentations, they served as spatial priors in SPM8 (without the normalization step) to obtain the conclusive and robust probabilistic tissue segmentations of white matter, gray matter, and cerebrospinal fluid of the individual MRI. These final segmentations were binarized by means of the maximum probabilistic (MaxProb) criterion, registered to the MDT space and averaged. Finally, these averages were manually corrected by an expert to constitute the probabilistic priors of our new template set.
The MaxProb criterion is:
Note that the probabilistic segmentations might be the logical choice for the averaging. We found however they yield an underestimation of the probabilistic gray matter prior, even after the proper normalization of the priors to sum 1. This consequently produced an incorrect too low probability gray matter map from the SPM automatic segmentation of the individual MRIs. Applying the MaxProb criterion overcame this situation.
Digitalization of the Paxinos and Watson Atlas
The sixth edition of the P & W stereotaxic atlas was originally provided in PDF format (Paxinos and Watson, 2007). We selected a total of 48 cortical structures on each hemisphere (total: 96) that were manually delineated with Adobe Illustrator in the coronal slices of this PDF book. The acronyms used by Paxinos and Watson appear in Table 1. We obtained a BITMAP image of each coronal slice containing a set of closed and filled contours of different colors representing the cortical structures present in the slice. Ad hoc software was developed to align and interpolate these bitmaps to produce a digital volume in the P & W space (isotropic voxel size of 0.12 mm) representing a digital parcellation image with the 96 selected cortical structures.
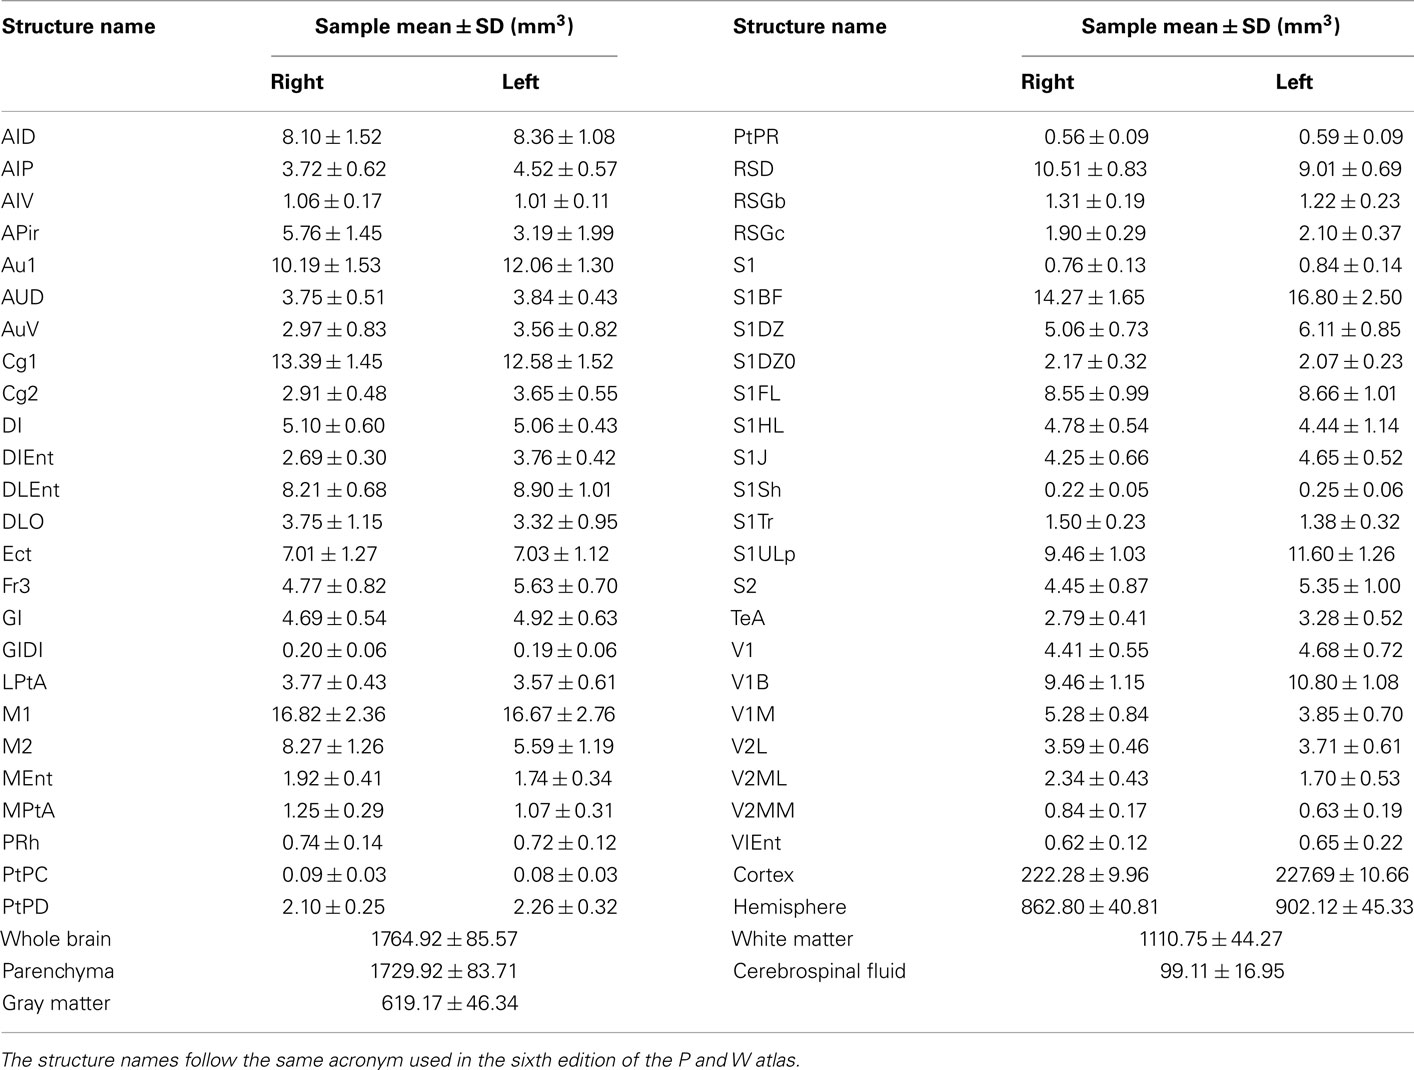
Table 1. Mean and SD of the volume of the anatomical structures of our sample.
This digital parcellation was registered and resampled with nearest neighbor interpolation to the template by using the approximate TPS registration method (Rohr et al., 2001). This is a modified version of the widely used standard (interpolating) TPS method (Bookstein, 1989), which estimates a smooth spatial transformation that maps the coordinates of a set of selected landmarks in a target space to their homologous in a source space. Unlike the standard TPS method, the approximate TPS method takes into account the uncertainty of the coordinates of the landmarks so the map between both sets is not exact. A total of 36 landmarks were defined in the P & W space (target) and their corresponding pairs were manually located in the template. Therefore, landmark coordinates are affected by human error making the use of the approximate TPS registration method more adequate than the standard one. The way this error is assigned to each landmark and implemented, taking into account the dimensions and anisotropy of the voxel, is described in Section “Details of the Implementation of the Approximate Thin Plate Spline Registration Method” in Appendix. The landmarks were located using T2-CARB software, a version of IMAGIC7 for rats.
The voxels of the warped atlas belonging to white matter, cerebrospinal fluid, or another non-brain part of the head, where removed. Further minor manual corrections were made with MRIcron8.
SPM Normalization, Segmentation, and Automatic Labeling of Structures, Using SPM8
Using the tissue priors, the SPM8 unified segmentation method was tested in both the high and low resolution MRIs. This method provides individual tissue segmentation into gray matter, white matter and cerebrospinal fluid, and the forward and inverse transformations to the template space. The automatic labeling of the native MRI into different gray matter structures was also tested by applying the inverse transformation to digitalized atlas. This classification was further refined so that only those voxels belonging to an individual binary gray matter mask remained. By means of the hidden random Markov field theory we excluded isolated points and filled small holes in the segmentation (Cuadra et al., 2005). This has been usually done with IBASPM (an extension toolbox of SPM5; Alemán-Gómez et al., 2006) in several applications (Alemán-Gómez et al., 2006; Iturria-Medina et al., 2007; Sotero et al., 2007; Sanabria-Diaz et al., 2010).
Functional MRI Test
After slice timing and inter-scan motion correction, spatial smoothing was performed to the EPI volumes using a Gaussian kernel of 0.8 mm full width at half maximum. Single-subject analysis was performed with a critical T-value for each voxel calculated for a significance level of p < 0.05 (FWE corrected). Then the average EPI was registered to the low resolution T2 MRI with the standard SPM8 12 parameters registration method, based on the normalized mutual information criterion. The resulting transformation was applied to the fMRI results to correct for geometrical distortions provoked by B0 inhomogeneities. We verified that this approach performed similarly to the correction method based on gradient field maps described in (Anderson et al., 2001; Hutton et al., 2002). After spatially normalizing the anatomical low resolution T2 MRI to the MDT space, the transformation was applied to the corrected fMRI result. The anatomical evaluation of fMRI localization could be done by overlaying the significant activations on the MDT and digital parcellation image.
Volumetry
Firstly, each individual MRI was warped using “elastix” to the MDT space by means of a highly parameterized, but still diffeomorphic (Jacobians > 0), transformation. The latter was then applied to the individual SPM8 gray matter, white matter, and cerebrospinal fluid segmentations. The volume of a desire cortical region is the sum of the Jacobians of the transformation through the voxels belonging simultaneously to the region (according to the digital parcellation image) and to the MaxProb normalized gray matter segmentation, times template voxel size. Likewise, the volumes of whole brain, gray matter, white matter, brain parenchyma, and cerebrospinal fluid were also calculated.
We then performed a simple survey about Wistar rat ontogenetic development by correlating the volumes of the structures with a developmental variable. We found that the performance of a volume–age regression model is limited due to the very low time accuracy in which age is usually recorded in many laboratories, including ours (1 week). Even in this lapse, rats undoubtedly exhibit dramatic increases in size and body weight, and consequently the brain could change as well. Based on empirical rationale, body weight, which is measured using a much higher resolution than age (1 g vs. 1 week), might be a proxy of age in the regression models in the studied postnatal period (P42–P70). In fact, we found a very strong and significant linear relationship between both variables for the age range of our sample [weight = (35.67 g/week) × age + 13.32, pslope ≈ 0, but pintercept > 0.1]. Therefore, we sought for volume–body weight relations by means of a robust linear regression method (DuMouchel and O’Brien, 1989), consisting of the estimation of the slope β and intercept η in:

This equation was fitted for the volume of each cortical structure, cortical hemisphere, whole brain, brain parenchyma, and cerebrospinal fluid.
It should be noted that we used the same individual MRIs for both the template construction and volume calculations. This could favorably bias our reports with respect to new MRIs from now on since the template is the minimum deformation space of the sample. However we only intend to probe the possible applications of the template set, encouraging rigorous experimental designs for future work.
Results
Minimum Deformation Template and Digitalized Parcellation Image
Figures 2A,B show the histograms of the MRIs before and after the equalization respectively. Although not demonstrated in this paper, the high variability of the intensity peaks in Figure 2A suggests an undesirable effect when averaging without equalization. The first set of peaks in Figure 2B corresponds to non-brain tissue (excepting fluid), while the last two correspond to brain and cerebrospinal fluid9. Note that the optimization procedure described in Section “Intensity ‘Equalization’ of the MRIs” in Appendix successfully “equalized” the last two peaks, as desired.
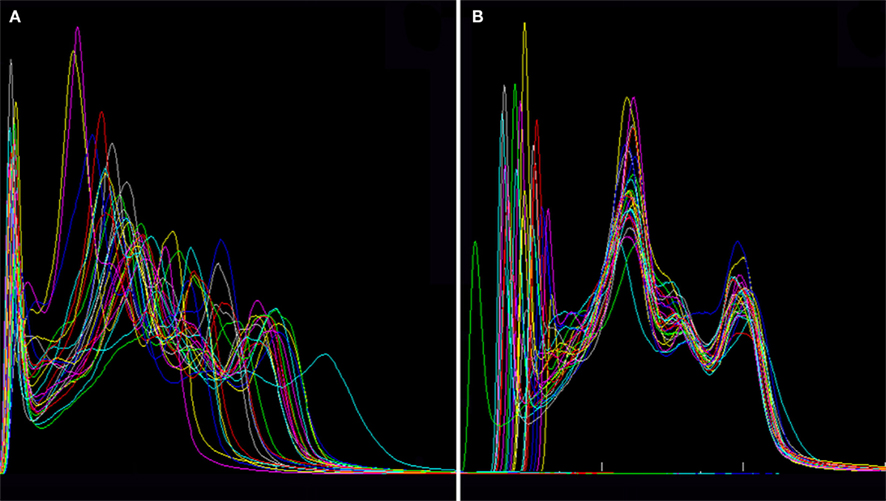
Figure 2. Histograms of all intensity corrected MRIs (A) before and (B) after the equalization, showing that the widths and positions of the peaks are transformed to very similar values in each individual.
Figures 3A,B depict the initial T2 MRI average template, based on linear registration only (namely modifying Eq. 1 into  ), and the MDT, respectively. As previously demonstrated by Kovacevic et al. (2005) for mice, the MDT possesses a higher (though slighter) degree of detail. Moreover, our template appears to be less noisy and with better resolution than those presented in (Schweinhardt et al., 2003; Schwarz et al., 2006), since it was based a MRI system with a higher main magnetic field (7.0 vs. 4.7 T) and improved T2 protocol. The digitalized parcellation image is overlaid on several coronal slices of the MDT in Figure 4 to provide an idea about the spatial match between both images.
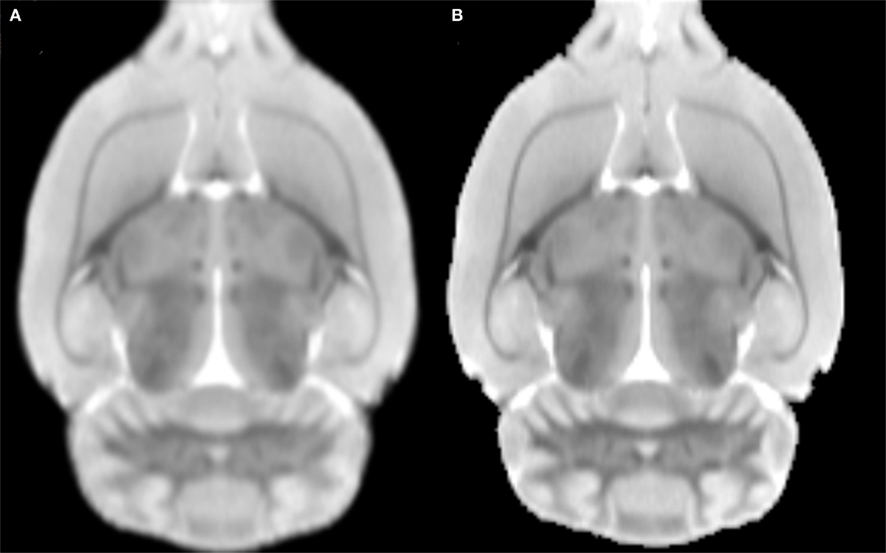
Figure 3. An axial slice of the (A) average MRI after linear registration to the “average” affine space and the (B) minimal deformation template.
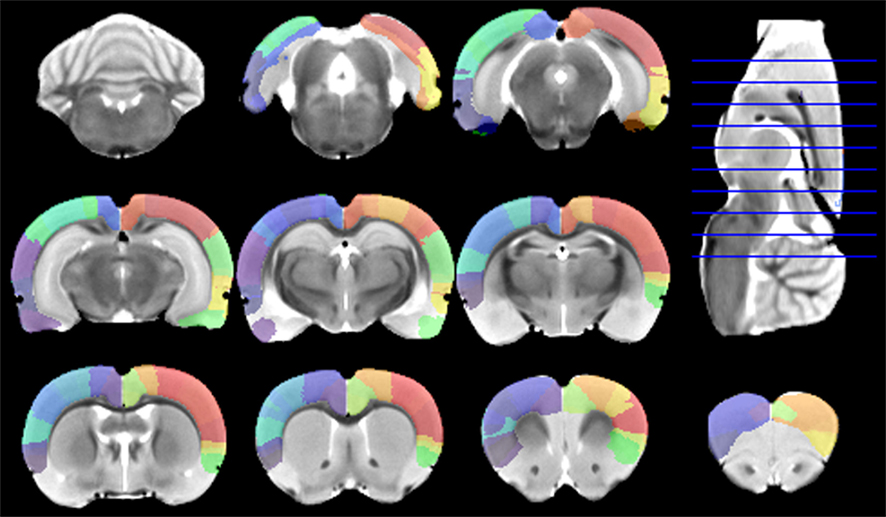
Figure 4. Digitalized Paxinos and Watson atlas, overlaid on the minimal deformation template after being warped to the template space using the approximate thin plate splines (TPS) method, plus further manual corrections.
Probabilistic Tissue Segmentations in the MDT Space
The effect of the anisotropic filter on the individual high resolution “brain only” MRI can be seen in Figure 5A. This image and the resulting histogram in Figure 5B can be directly compared with Figures 1A,B, respectively. Instead of the single peak shown in Figure 1B, two very distinguishable peaks are now present in the histogram of Figure 5B, corresponding to white matter and gray matter populations respectively. The Gaussians and non-parametric curves representing different tissue types and partial volumes are shown in this figure. The final individual probabilistic segmentations of gray matter, white matter, and cerebrospinal fluid are overlaid on the individual “brain only” MRI in Figure 5C.
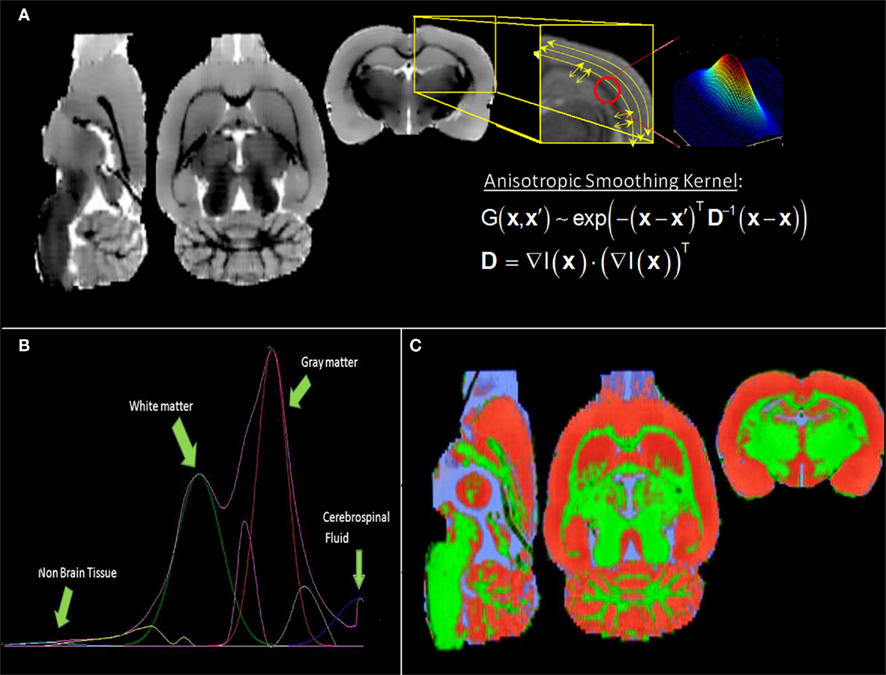
Figure 5. (A) Filtered low resolution MRI shown in Figure 1 (right) and illustrative picture of the effect of the anisotropic filter on the image in the region enclosed by the yellow box (left): the image is more denoised along the low changes of intensities; the smoothing kernel is a tensor calculated with the gradient of the image at each point. (B) Histogram showing two identifiable peaks corresponding to the white matter and gray matter intensity populations (lilac curve). Four Gaussian distributions were fitted (cyan: non-brain, green: white matter, red: gray matter and blue: cerebrospinal fluid) and three non-parametric curves representing partial volumes. (C) Final tissue segmentations (same color code as the fitted Gaussian curves), after SPM8 post processing of the preliminary segmentations obtained from the histogram analysis.
The probabilistic segmentations (the so-called spatial priors in SPM) of tissue types are shown with colors in Figure 6. As a quantitative measure of the overlapping of the different tissue types between the template and the digitalized atlas, we found that, among the voxels classified as part of the cortex by the digitalized atlas, 6.0% and 5.7% are classified by the corresponding MaxProb segmentations as white matter and cerebrospinal fluid, respectively.
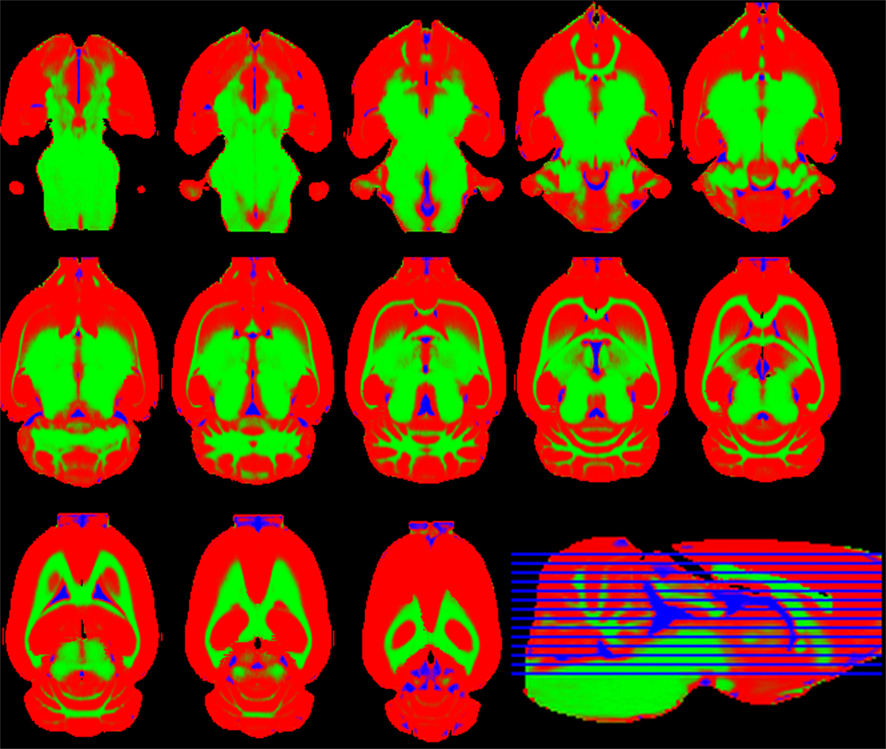
Figure 6. Axial slices of the gray matter (red), white matter (green), and cerebrospinal fluid (blue) probabilistic segmentations.
Our gray and white matter tissue priors resemble those obtained by (Sawiak et al., 2009) for mice, the sole paper in the literature assessing these segmentations for rodents. In that paper, the three tissue classes were obtained directly from the average template image and smooth variability was provided by applying a 250-μm Gaussian filter. In contrast, we exploited the actual variability of our sample by averaging all individual MaxProb binary segmentations, achieving tissue probabilities.
SPM8 Unified Segmentation Results
For the sake of brevity, we shall only present the results for the low resolution MRI. The spatially normalized low resolution MRI is shown together with the average template in Figure 7 for three orthogonal views. Figures 8A,B show the individual tissue segmentations and automatic labeling, respectively, overlaid on a set of coronal slices of the individual low resolution MRI in its native space.
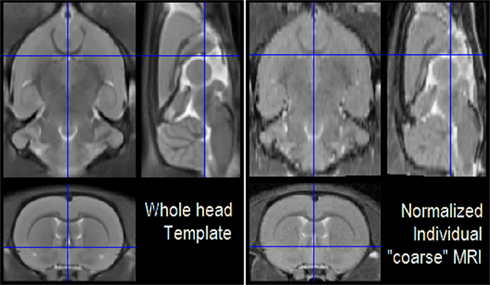
Figure 7. Registered orthogonal views of the average MRI template (right) and spatially normalized low resolution MRI (left). In order to provide a comprehensive view, we constructed this picture with the “Check Reg” button of SPM8, which is the usual tool of SPM users for the visualization of registration results.
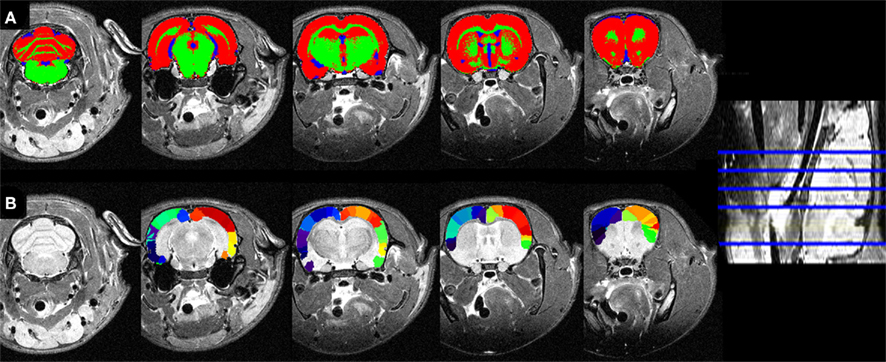
Figure 8. (A) Tissue segmentations (same color code as 6) and (B) atlasing overlaid on the individual coronal slices of the low resolution MRI in the native space.
We have described a histogram-based analysis for obtaining the preliminary individual segmentations. We clarify that this is not a practical technique for automatically segmenting an individual MRI since histogram construction requires extraction of the brain mask. In contrast, the SPM segmentation methods (or another Bayesian technique), based on spatial priors, can directly deal with the individual raw whole head MRI.
Volumetry
The mean and SD of the brain structure volumes are shown in
Table 1. A way to at least evaluate the performance of brain volume estimations is by means of the similarity index, originally defined as the Dice’s coefficient (Dice, 1945) and used in (Zijdenbos et al., 1994) for Neuroimaging. This index was calculated between the brain mask estimated via MaxProb SPM segmentations and the one extracted with the semi-automatic method described in the Section “Materials and Methods,” which we consider as the ground truth. For our 30 rats, the average SI is very high (around 0.97 ± 0.00), if we take into account that SI takes values from 0 to 1 corresponding to 0 and 100% of overlap, respectively.  where the subscripts M and A denote MaxProb and Atlas brain masks, respectively.
The reported volume means and deviations might constitute tentative references for future work in detecting altered volumes of structures in rat models of diseases or atrophy provoked by injuries.
Table 2 contains the regions presenting a significant slope (p < 0.01) in the regression model (4) as well as the putative expected percent of volume change within the range of weights of our sample. This percent is calculated as: % = (β × Δw/〈V〉) × 100, where Δw is the range of weights and 〈V〉 is the mean volume of our sample. The average of the slope of the regression is 1.042 ± 0.228 mm3/g for the entire brain. A simple and intuitive linear dimensional analysis gives us an idea about the plausibility of those values. Table 1 of the P & W book (Paxinos and Watson, 2007) presented, for different body weights of similar rats, the distances between the Bregma to the Interaural Plane in both the anterior–posterior (AP) and dorso-ventral (DV) directions. The slope of the regression between (AP*DV)3/2 (assuming an isometric scaling between brain linear measures and brain volume) and the corresponding rat body weights is very significant, and equal to 1.234 ± 0.117 mm3/g, which is within the range of slope values (1.042 ± 0.228 mm3/g) between brain volume and body weight in our sample.
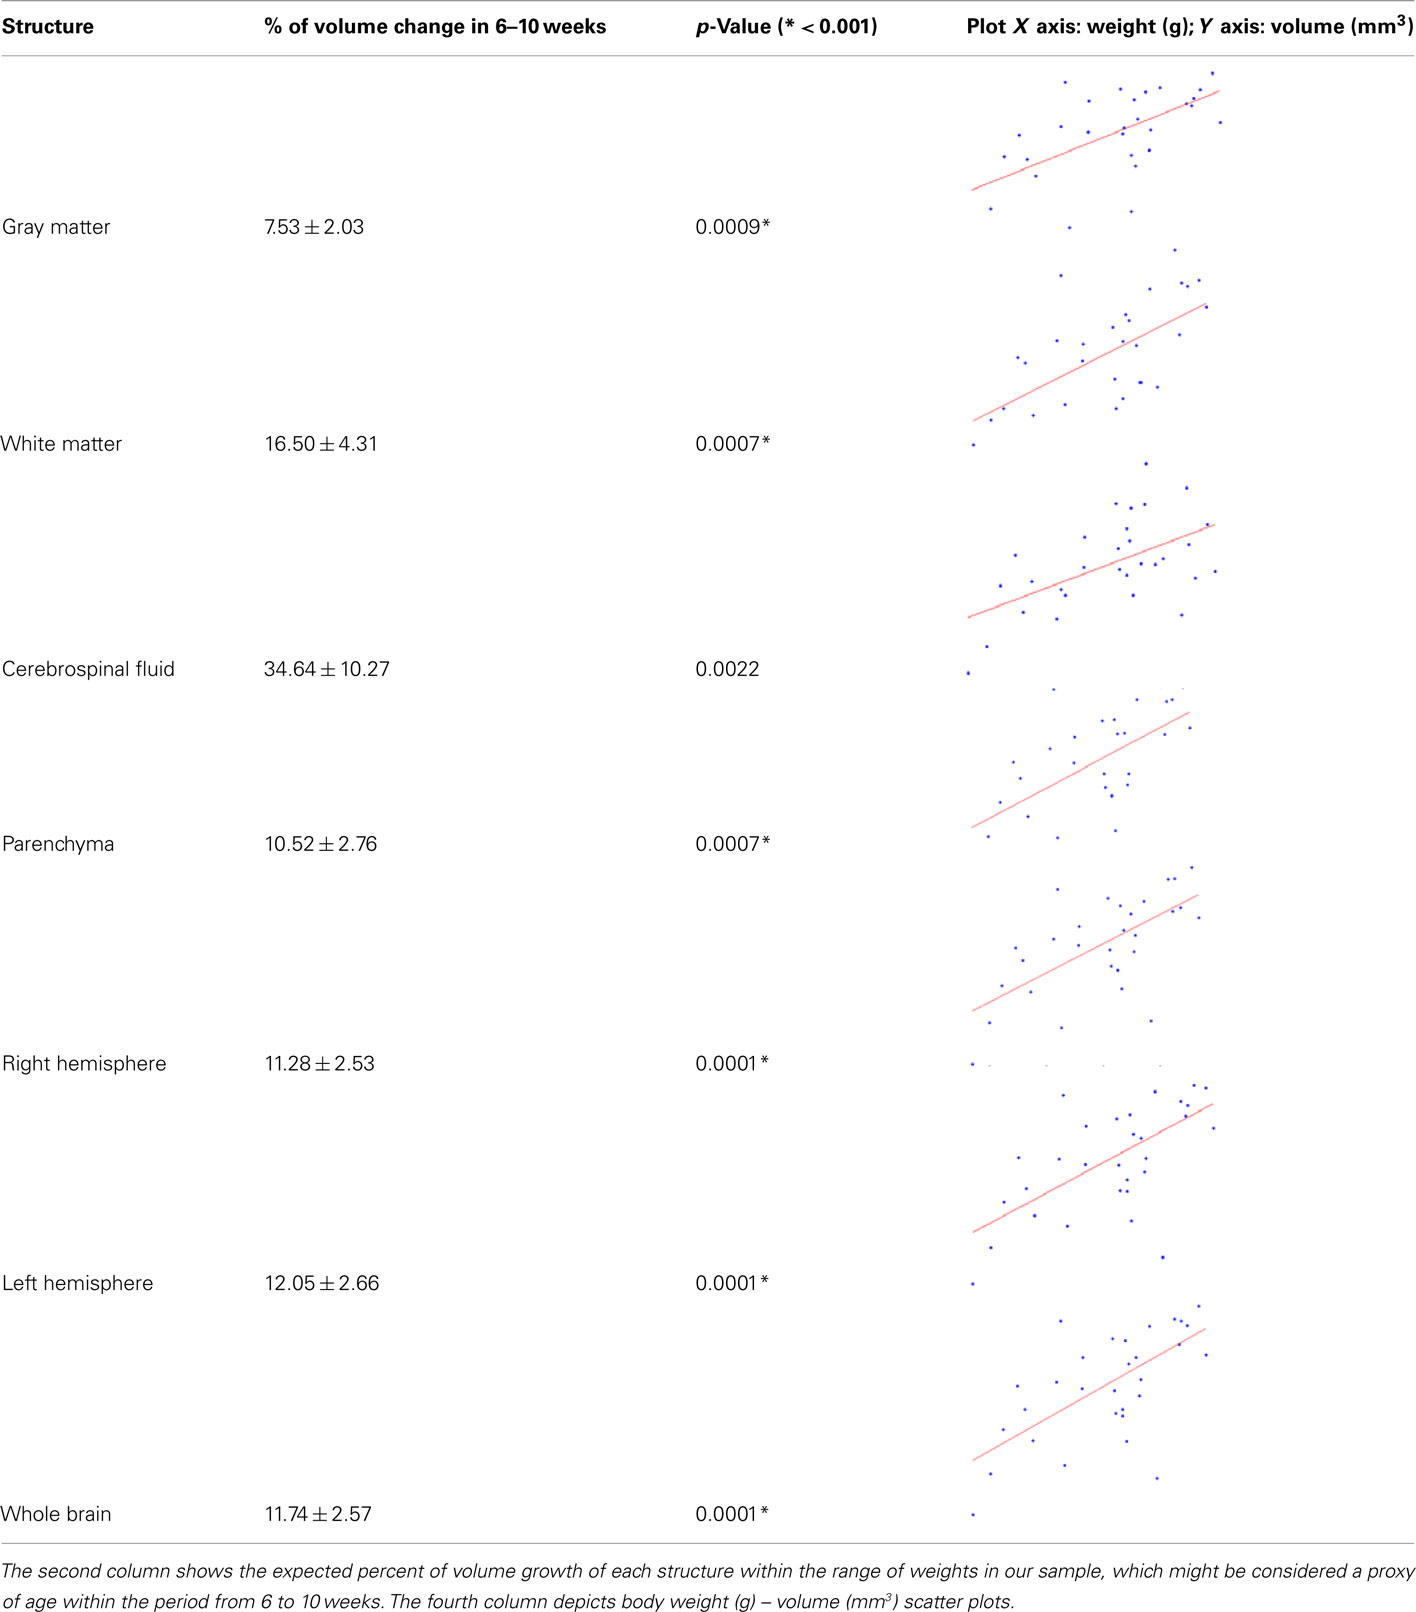
Table 2. Structures with a significant slope in the regression of volume vs. body weight.
Although the volume of the entire hemispheres, brain, parenchyma, white matter, and cerebrospinal fluid are significantly correlated with body weight, the cerebral cortex is not. This result resembles those found in (Maheswaran et al., 2009a,b) for wild type mice, where brain, cerebellum, and hippocampus significantly and positively correlated with age, while neocortex did not. Moreover (Chuang et al., 2011) has recently fitted a sigmoid function to C57BL/6 mouse volume development from embryonic stages (E0–E18) to postnatal ages (P0–P80 and older). Inspecting the figures of that paper, we believe that indeed a linear model is suitable for the postnatal age period (P42–P70) used in our paper. We also observe that while the brain, hippocampus, and cerebellum again present a clear tendency to grow with age, cortex volume is likely to remain constant during this period. As postulated in (Chuang et al., 2011), the constancy of cortical volume appear to be at expenses of the growth of other brain structures, say white matter.
On the other hand, no substructures constituting the cortex resulted to be significantly correlated (according to p < 0.01) with body weight. Although this appears to be reasonable upon the fact of cortical volume constancy, it is in disagreement, for example, with (Riddle et al., 1992), where a growth of the somatosensory cortex was demonstrated using succinic dehydrogenase histochemistry and digital image analysis. This might be due to the age period used in this paper (P42–P70) in contrast to the wider range used in (Riddle et al., 1992; two groups: P7 and P70–P84).
ROI-based Anatomical Interpretation of fMRI
Figure 9 shows, on the average template, the fMRI activations caused by forepaw and hindpaw stimulations. As expected (Spenger et al., 2000), they are located within the contralateral forelimb (S1FL) and hindlimb (S1HL) regions of the primary somatosensory cortex, respectively. To illustrate the accuracy of this localization we calculated the percent of voxels within the corresponding anatomical region which have a T-value above 6, 7, 8, and 9. Respectively, these values are 83.1, 89.5, 94.2, and 98.9% for the left forepaw; 91.8, 98.4, 99.6, and 100.0% for the right forepaw; 85.3, 95.3, 100.0, 100.0% for the left hindpaw; and 81.8, 97.3, 100.0, and 100.0% for the right hindpaw. This means that the center and most parts of the significantly activated regions are within the corresponding expected anatomical areas.
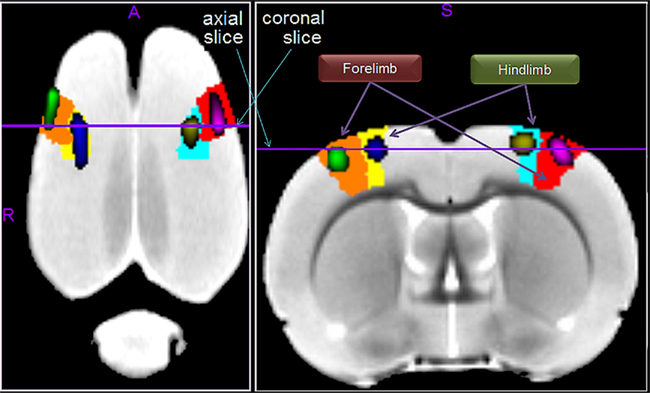
Figure 9. The fMRI activations induced by forepaw and hindpaw electrical stimulations. The left (green) and right (violet) forepaw activations are located within the contralateral forelimb regions of the primary somatosensory cortex, denoted as S1FL in the P and W atlas (orange and red regions respectively). Likewise, the left (blue) and right (yellow) activations are within the contralateral hindlimb regions, denoted as S1HL (yellow and cyan regions respectively).
Our fMRI forepaw results resemble those obtained in (Schweinhardt et al., 2003) and (Lu et al., 2010). Like (Schweinhardt et al., 2003), we obtained fewer activated regions than (Lu et al., 2010). Note that in the latter, other somatosensory related areas (both ventrolateral and ventral posterolateral thalamic nuclei, S1DZ and S1ULp) were significantly activated, probably in relation to the use of an iron-oxide contrast agent, which enhances the signal to noise ratio of the image. Moreover and controversially, barrel field “S1BF” was also activated in (Lu et al., 2010).
Discussion
In this paper, we constructed a new MRI template set of Wistar rat comprising in the same space: (1) a MDT, intensity, and shape average of 30 T2-weighted MRIs, (2) probabilistic images of gray matter, white matter, cerebrospinal fluid, and brain, and (3) a digitalization of 96 cortical structures of the last version of the P & W atlas. We aim to provide a template set for the most basic (and interdependent) neuroimaging applications, namely unbiased spatial normalization, tissue (in special gray/white matter) segmentation and automatic labeling of cortical structures of individual rat structural T2 MRIs, since they are mandatory for the majority of neuroimaging studies. Thus, we validated them not only with both individual high resolution T2-weighted MRIs (acquired in 3 h) but with coarser ones, acquired in the relatively short time of 50 min. The latter case is of particular importance for certain long lasting experiments, such as fMRI or any type of diffusion weighted imaging (DWI)10, where the time must be gained at expenses of the structural MRI.
Comparison with Previous Rat MRI Templates
Table 3 summarizes the main characteristics of our template set, the procedures for its construction and the tested applications, facing them against the two previous attempts. In this table, bold letters highlight the more evidently advantageous features. The major disadvantages of our paper are logistic: a medium sample size (though we used Wistar, a strain of rat never used before for a template construction) and the lack of the highest MR main magnetic fields available, e.g., 9.4 T.
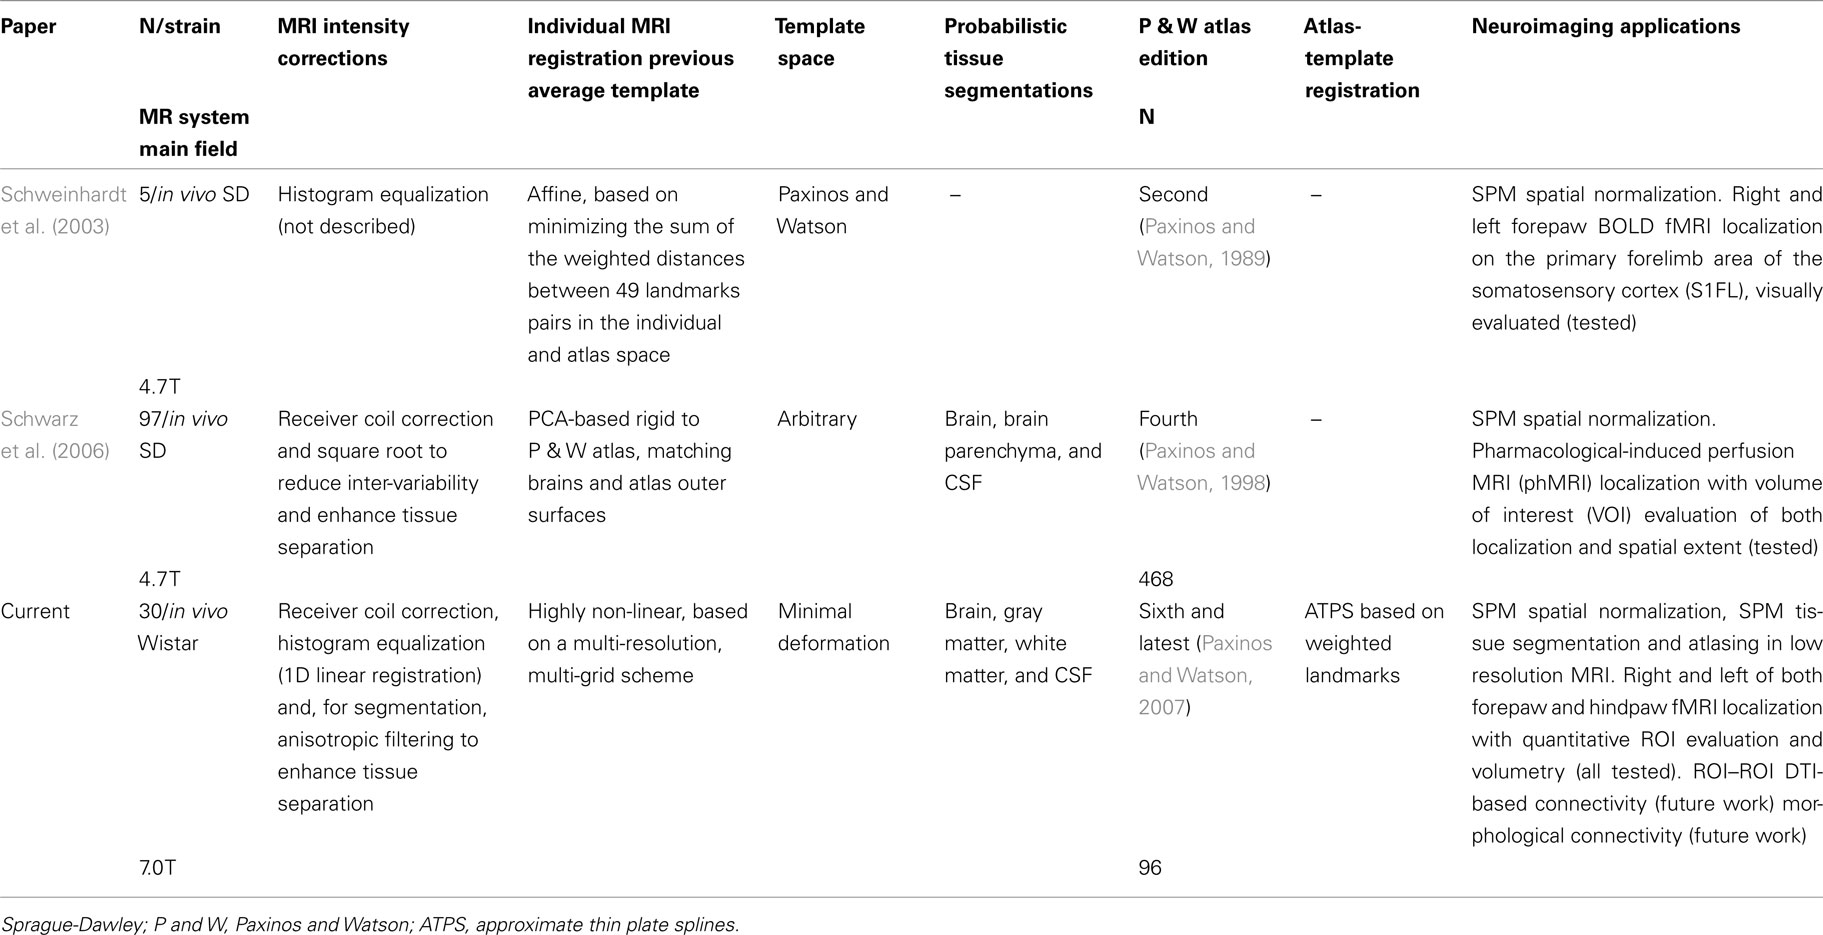
Table 3. Comparison between three approaches to obtain a template set for rats.
Intended to the sole purpose of a rough localization functional features, both previous template sets were built by means of linear registration methods to biased spaces. Indeed, several studies have been using these templates for localization of BOLD fMRI (Ramu et al., 2006; Endo et al., 2007; Reyt et al., 2010; Sumiyoshi et al., 2011), position emission tomography (PET; Fujita et al., 2005; Casteels et al., 2006; Frumberg et al., 2007; Hjornevik et al., 2008; Sung et al., 2009), pharmacological MRI (phMRI; Gozzi et al., 2007, 2008; Schwarz et al., 2007; Dodd et al., 2010), or manganese-enhanced MRI (MEMRI; Eschenko et al., 2010). In contrast, our registration method sought for the MDT of our sample, avoiding a bias in registration methods toward those heads most similar to the template (Guimond, 2000; Kochunov et al., 2001a,b). Besides, the use of highly parameterized non-linear deformations allowed for the achievement of a high detailed MDT, storing the most part of the sample variability in the deformation fields. Thus, our template set is not only useful for functional localization but also for unbiased, robust and detailed anatomical studies based on non-linear registrations. In addition we provide, for the first time in rats, gray and white matter probabilistic segmentations. This allows for the application of Bayesian segmentation methods, such as FAST–FSL or SPM8 unified segmentation (Ashburner and Friston, 2005).
Only (Schwarz et al., 2006) and our paper have provided digitalization of the P & W structures, being the former digitalization overwhelmingly superior to ours (468 vs. 96). Increasing the number of digitalized structures must therefore be a mandatory part of our main future work. However, we have used the latest version of the P & W atlas (sixth) while they used the fourth one and we have established a non-linear spatial correspondence between template and atlas.
Exemplified Applications
In our paper, we proved that the fMRI activations elicited by forepaw and hindpaw stimulations in both hemispheres can be located within the expected anatomical regions of the P & W digitalization. Note that hindpaw stimulation was not tested previously, probably due to the difficulty in obtaining a robust and distinguishable activation.
As an example, we also tested the feasibility of using the template set for a volumetric analysis of the rat brain. In fact, to the knowledge of the authors, there is a scarcity of volumetric studies on rodent brains and, particularly, no such studies on rats. We proposed to calculate the volumes of the subdivided cortical structures of the atlasing. Thus, we were able to explore the possible relationship between these volumes and body weight, as a proxy of age, for our sample of male Wistar rats, opening a window for the study of the ontogenesis of the rat brain. Whole brain, whole gray and white matter, parenchyma, and cerebrospinal fluid, but not whole cortex or its subdivisions, are correlated with body weight and thus very likely with age within the period of our sample (P42–P70). Therefore, we suggest that either body weight or age should be taken as a covariate in any regression analysis between volumes and other variables of interest. Also, the normal developing curves of brain structures and substructures can be used as phenotypic signatures in rat disease models.
Comparison with Mouse Templates
As mentioned before, like all mice templates since the seminal paper of (Kovacevic et al., 2005), our registration method was non-linear to the minimum deformation space and we provide gray and white matter segmentations like (Sawiak et al., 2009). Mouse templates are also accompanied by 3D discrete images of labeled structures, such as (Dorr et al., 2008; 62 structures) and (Chen et al., 2006; 42 structures), or probabilistic approaches (Ma et al., 2005; Badea et al., 2007a). Like in our template set, the annotation of structures in those templates is usually based on standard references, e.g. (Paxinos and Franklin, 2000). Besides, we have defined a coordinate system which is inspired in a very recent effort for standardization of mice “atlasing,” i.e., the so-called Waxholm space (Hawrylycz et al., 2011).
Our template set is in vivo. This is the most contrastive feature when compared to all in vitro mouse templates in the literature, excepting the single case of (Ma et al., 2008). The disadvantage of in vitro templates is the loss of representativeness of in vivo samples, due to ventricle collapse, myelin water fraction changes, and manipulation related distortions due to the skull stripping procedure despite various papers proposed to overcome the last problem by leaving the brain in situ (inside the cranium). While in vitro template have a very high resolution, in vivo templates are more suitable for in vivo applications, such as longitudinal studies of the same animals and fMRI.
Applications of Our Template Set
Apart from precise localization of functional features like (Schwarz et al., 2006), identifying phenotypes like (Bock et al., 2006; Badea et al., 2007b), or the quantification of volume and surface of structures like (Badea et al., 2007a), the automatic labeling might be used for ROI to ROI DTI-based tractography. Seed and target ROIs can be obtained from the automatic labeling, whereas tracts can be restricted to go through the parenchyma or even white matter. An immediate future work must be the use of this tractography for assessing robust and systematical measures of ROI–ROI anatomical connectivity, as has been proposed elsewhere (Iturria-Medina et al., 2007, Iturria-Medina et al., 2008). We perceive a future interest in using this technique to probe the anatomical substrates of various fMRI-proven connections between either ipsilateral or contralateral areas (Lu et al., 2007; Pawela et al., 2008; Bifone et al., 2010; Magnuson et al., 2010). The feasibility of combining different neuroimaging techniques to assess connectivity, such as fMRI, DTI, and the recent so-called “morphological connectivity,” which is based in either volume or area ROI/ROI correlations (Sanabria-Diaz et al., 2010), opens a wide window for understanding rat brain anatomical and functional networking.
As was already demonstrated in primates and humans, neuroimaging characterization of rats will aid the understanding of the anatomical and physiological substrates of different brain pathologies and contribute to unraveling the ontogenetic and phylogenetic development of mammals.
Practical Advices for Neuroimagers
Our template set can be used directly with any neuroimaging software for spatial registration, segmentation, and automatic labeling of structures. We only alert the reader about helping the registration with a previous alignment of the MRI according to the template orientation and setting the origin in the anterior commissure. Our template set and some helpful codes are publicly available through the SPM extension webpage http://www.fil.ion.ucl.ac.uk/spm/ext/, or at http://www.idac.tohoku.ac.jp/bir/en/db/rb/101028.html.
Conflict of Interest Statement
The authors declare that the research was conducted in the absence of any commercial or financial relationships that could be construed as a potential conflict of interest.
Acknowledgments
This work has been supported by the Japan–Canada Joint Health Research Program (JSPS). “The neuro architectonic determinants of EEG recordings” and by the JSPS Grants-in-Aid (B) 18320062. The authors appreciate Sarah Michael for the English corrections and Adianez Obrador Fragoso for further refinements. The authors also thank Benjamin Thyreau, Joe Michel López Inguanso, and Rogney Marine Isalgue for their laborious assistance. Finally, the authors are very grateful for the useful academic advice of Lester Melie García, Gretels Sanabria, Jorge A. Bergado Rosado, and Professor Pedro Antonio Valdés Sosa.
Footnotes
- ^http://www.fmrib.ox.ac.uk/fsl/fast4/index.html
- ^http://elastix.isi.uu.nl
- ^http://www.fil.ion.ucl.ac.uk/spm/ext/
- ^From the lowest to the highest intensity mean.
- ^Non-brain/white matter, white matter/gray matter, and gray matter/cerebrospinal fluid.
- ^The subscripts “nb,” “WM,” “GM,” and “CSF” refer to non-brain tissue, white matter, gray matter, and cerebrospinal fluid, respectively.
- ^www.neuronicsa.com
- ^http://www.cabiatl.com/mricro/
- ^We clarify that, in contrast to Figure 1, where the histogram was created from a brain only MRI, the cerebrospinal fluid in this whole head case presents a distinguishable peak. This is due to the contribution of a large amount of non-brain fluid spaces, e.g., subarachnoid.
- ^e.g., DTI, diffusion spectrum imaging (DSI), q-ball imaging (QBI), among others.
References
Aggarwal, M., Zhang, J., Miller, M. I., Sidman, R. L., and Mori, S. (2009). Magnetic resonance imaging and micro-computed tomography combined atlas of developing and adult mouse brains for stereotaxic surgery. Neuroscience 162, 1339–1350.
Alemán-Gómez, Y., Melie-García, L., and Valdes-Hernández, P. (2006). IBASPM: toolbox for automatic parcellation of brain structures. Presented at the 12th Annual Meeting of the Organization for Human Brain Mapping, June 11–15, 2006, Florence. [Available on CD-Rom in NeuroImage, Vol. 27, No.1].
Anderson, J., Hutton, C., Ashburner, J., Turner, R., and Friston, K. (2001). Modelling geometric deformations in EPI time series. Neuroimage 13, 903–919.
Aoki, I., Ebisu, T., Tanaka, C., Katsuta, K., Fujikawa, A., Umeda, M., Fukunaga, M., Takegami, T., Shapiro, E. M., and Naruse, S. (2003). Detection of the anoxic depolarization of focal ischemia using manganese-enhanced MRI. Magn. Reson. Med. 50, 7–12.
Ashburner, J. (2002). “Another MRI bias correction approach,” in Neuroimage 16, Presented at the 8th International Conference on Functional Mapping of the Human Brain, June 2–6, 2002, Sendai. [Available on CD-Rom].
Ashburner, J., and Friston, K. J. (2000). Voxel-based morphometry – the methods. Neuroimage 11, 805–821.
Badea, A., Ali-Sharief, A. A., and Johnson, G. A. (2007a). Morphometric analysis of the C57BL/6J mouse brain. Neuroimage 37, 683–693.
Badea, A., Nicholls, P. J., Johnson, G. A., and Wetsel, W. C. (2007b). Neuroanatomical phenotypes in the reeler mouse. Neuroimage 34, 1363–1374.
Bifone, A., Gozzia, A., and Schwarz, A. J. (2010). Functional connectivity in the rat brain: a complex network approach. Magn. Reson. Imaging 28, 1200–1209.
Bizzi, A. (2009). Presurgical mapping of verbal language in brain tumors with functional MR imaging and MR tractography. Neuroimaging Clin. N. Am. 19, 573.
Bock, N. A., Kovacevic, N., Lipina, T. V., Roder, J. C., Ackerman, S. L., and Henkelman, R. M. (2006). In vivo magnetic resonance imaging and semiautomated image analysis extend the brain phenotype for cdf/cdf mice. J. Neurosci. 26, 4455–4459.
Bookstein, F. L. (1989). Principal warps: thin-plate splines and the decomposition of deformations. IEEE Trans. Pattern Anal. Mach. Intell. 11, 567–585.
Bookstein, F. L. (2001). “Voxel-based morphometry” should not be used with imperfectly registered images. Neuroimage 14, 1454–1462.
Casteels, C., Vermaelen, P., Nuyts, J., Van der Linden, A., Baekelandt, V., Mortelmans, L., Bormans, G., and Van Laere, K. (2006). Construction and evaluation of multitracer small-animal PET probabilistic atlases for voxel-based functional mapping of the rat brain. J. Nucl. Med. 47, 1858–1866.
Chen, X. J., Kovacevic, N., Lobaugh, N. J., Sled, J. G., Henkelman, R. M., and Henderson, J. T. (2006). Neuroanatomical differences between mouse strains as shown by high-resolution 3D MRI. Neuroimage 29, 99–105.
Chuang, N., Mori, S., Yamamoto, A., Jiang, H., Ye, X., Xu, X., Richards, L. J., Nathans, J., Miller, M. I., Toga, A. W., Sidman, R. L., and Zhang, J. (2011). An MRI-based atlas and database of the developing mouse brain. Neuroimage 54, 80–89.
Chung, M. K., Worsley, K. J., Robbins, S., Paus, T., Taylor, J., Giedd, J. N., Rapoport, J. L., and Evans, A. C. (2003). Deformation-based surface morphometry applied to gray matter deformation. Neuroimage 18, 198–213.
Cuadra, M. B., Cammoun, L., Butz, T., Cuisenaire, O., and Thiran, J. P. (2005). Comparison and validation of tissue modelization and statistical classification methods in T1-weighted MR brain images. IEEE Trans. Med. Imaging 24, 1548–1565.
David, O., Guillemain, I., Saillet, S., Reyt, S., Deransart, C., Segebarth, C., and Depaulis, A. (2008). Identifying neural drivers with functional MRI: an electrophysiological validation. PLoS Biol. 6, e315.
Dice, L. R. (1945). Measures of the amount of ecologic association between species. Ecology 26, 297–302.
Dodd, G. T., Williams, S. R., and Luckman, S. M. (2010). Functional magnetic resonance imaging and c-fos mapping in rats following a glucoprivic dose of 2-deoxy-d-glucose. J. Neurochem. 113, 1123–1132.
Dorr, A. E., Lerch, J. P., Spring, S., Kabani, N., and Henkelman, R. M. (2008). High resolution three-dimensional brain atlas using an average magnetic resonance image of 40 adult C57Bl/6J mice. Neuroimage 42, 60–69.
DuMouchel, W. H., and O’Brien, F. L. (1989). “Integrating a robust option into a multiple regression computing environment,” in Computing and Graphics in Statistics (New York, NY: Springer-Verlag New York, Inc.), ISBN:0-387-97633-7.
Endo, T., Spenger, C., Tominaga, T., Brene, S., and Olson, L. (2007). Cortical sensory map rearrangement after spinal cord injury: fMRI responses linked to nogo signalling. Brain 130, 2951–2961.
Englot, D. J., Mishra, A. M., Mansuripur, P. K., Herman, P., Hyder, F., and Blumenfeld, H. (2008). Remote effects of focal hippocampal seizures on the rat neocortex. J. Neurosci. 28, 9066–9081.
Eschenko, O., Canals, S., Simanova, I., Beyerlein, M., Murayama, Y., and Logothetis, N. K. (2010). Mapping of functional brain activity in freely behaving rats during voluntary running using manganese-enhanced MRI: implication for longitudinal studies. Neuroimage 49, 2544–2555.
Friston, K. J., Ashburner, J., Kiebel, S. J., Nichols, T. E., and Penny, W. D. (2010). Statistical Parametric Mapping: The Analysis of Functional Brain Images, 1 Edn. London: Academic Press, Elsevier. ISBN-13:978-0-12-372560-8.
Frumberg, D. B., Fernando, M. S., Lee, D. E., Biegon, A., and Schiffer, W. K. (2007). Metabolic and behavioral deficits following a routine surgical procedure in rats. Brain Res. 1144, 209–218.
Fujita, M., Zoghbi, S. S., Creseenzo, M. S., Hong, J., Musachio, J. L., Lu, J. Q., Liow, J. S., Seneca, N., Tipre, D. N., Cropley, V. L., Imaizumi, M., Gee, A. D., Seidel, J., Green, M. V., Pike, V. W., and Innis, R. B. (2005). Quantification of brain phosphodiesterase 4 in rat with (R)-[C-11] rolipram-PET. Neuroimage 26, 1201–1210.
Ghosh, A., Haiss, F., Sydekum, E., Schneider, R., Gullo, M., Wyss, M. T., Mueggler, T., Baltes, C., Rudin, M., Weber, B., and Schwab, M. E. (2010). Rewiring of hindlimb corticospinal neurons after spinal cord injury. Nat. Neurosci. 13, 97–104.
Gozzi, A., Ceolin, L., Schwarz, A., Reese, T., Bertani, S., Crestan, V., and Bifone, A. (2007). A multimodality investigation of cerebral hemodynamics and autoregulation in pharmacological MRI. Magn. Reson. Imaging 25, 826–833.
Gozzi, A., Herdon, H., Schwarz, A., Bertani, S., Crestan, V., Turrini, G., and Bifone, A. (2008). Pharmacological stimulation of NMDA receptors via co-agonist site suppresses fMRI response to phencyclidine in the rat. Psychopharmacology (Berl.) 201, 273–284.
Guimond, A. (2000). Average brain models: a convergence study. Comput. Vis. Image Underst. 77, 192–210.
Hawrylycz, M., Baldock, R. A., Burger, A., Hashikawa, T., Johnson, G. A., Martone, M., Ng, L., Lau, C., Larsen, S. D., Nissanov, J., Puelles, L., Ruffins, S., Verbeek, F., Zaslavsky, I., and Boline, J. (2011). Digital atlasing and standardization in the mouse brain. PLoS Comput. Biol. 7, e1001065.
Hjornevik, T., Jacobsen, L. M., Qu, H., Bjaalie, J. G., Gjerstad, J., and Willoch, F. (2008). Metabolic plasticity in the supraspinal pain modulating circuitry after noxious stimulus-induced spinal cord LTP. Pain 140, 456–464.
Hjornevik, T., Leergaard, T. B., Darine, D., Moldestad, O., Dale, A. M., Willoch, F., and Bjaalie, J. G. (2007). Three-dimensional atlas system for mouse and rat brain imaging data. Front. Neuroinform. 1:4.
Hou, Z. Y., Lei, H., Hong, S. H., Sun, B., Fang, K., Lin, X. T., Liu, M. L., Yew, D. T. W., and Liu, S. W. (2010). Functional changes in the frontal cortex in Parkinson’s disease using a rat model. J. Clin. Neurosci. 17, 628–633.
Hua, K., Zhang, J., Wakana, S., Jiang, H., Li, X., Reich, D. S., Calabresi, P. A., Pekar, J. J., van Zijl, P. C. M., and Mori, S. (2008). Tract probability maps in stereotaxic spaces: analyses of white matter anatomy and tract-specific quantification. Neuroimage 39, 336–347.
Huang, W., Heffernan, M. E., Li, Z. X., Zhang, N. Y., Overstreet, D. H., and King, J. A. (2011). Fear induced neuronal alterations in a genetic model of depression: an fMRI study on awake animals. Neurosci. Lett. 489, 74–78.
Hutton, C., Bork, A., Josephs, O., Deichmann, R., Ashburner, J., and Turner, R. (2002). Image distortion correction in fMRI: a quantitative evaluation. Neuroimage 16, 217–240.
Iturria-Medina, Y., Canales-Rodriguez, E. J., Melie-Garcia, L., Valdes-Hernandez, P. A., Martinez-Montes, E., Aleman-Gomez, Y., and Sanchez-Bornot, J. M. (2007). Characterizing brain anatomical connections using diffusion weighted MRI and graph theory. Neuroimage 36, 645–660.
Iturria-Medina, Y., Sotero, R. C., Canales-Rodriguez, E., Aleman, Y., and Melie-Garcia, L. (2008). Studying the human brain anatomical network via diffusion-weighted mri and graph theory. Neuroimage 40, 1064–1076.
Keilholz, S. D., Silva, A. C., Raman, M., Merkle, H., and Koretsky, A. P. (2006). BOLD and CBV-weighted functional magnetic resonance imaging of the rat somatosensory system. Magn. Reson. Med. 55, 316–324.
Kipps, C. M., Duggins, A. J., Mahant, N., Gomes, L., Ashburner, J., and McCusker, E. A. (2005). Progression of structural neuropathology in preclinical Huntington’s disease: a tensor based morphometry study. J. Neurol. Neurosurg. Psychiatr. 76, 650–655.
Klein, S., Staring, M., Murphy, K., Viergever, M. A., and Pluim, J. P. W. (2010). Elastix: a toolbox for intensity-based medical image registration. IEEE Trans. Med. Imaging 29, 196–205.
Kochunov, P., Lancaster, J. L., and Fox, P. (2001a). Towards an optimal regional spatial normalization target: creating a representative target for a group MR brain image. Radiology 221, 460.
Kochunov, P., Lancaster, J. L., Thompson, P., Woods, R., Mazziotta, J., Hardies, J., and Fox, P. (2001b). Regional spatial normalization: toward an optimal target. J. Comput. Assist. Tomogr. 25, 805–816.
Kovacevic, N., Henderson, J. T., Chan, E., Lifshitz, N., Bishop, J., Evans, A. C., Henkelman, R. M., and Chen, X. J. (2005). A three-dimensional MRI atlas of the mouse brain with estimates of the average and variability. Cereb. Cortex 15, 639–645.
Kovacevic, N., Lobaugh, N. J., Bronskill, M. J., Levine, B., Feinstein, A., and Black, S. E. (2002). A robust method for extraction and automatic segmentation of brain images. Neuroimage 17, 1087–1100.
Leergaard, T. B., Bjaalie, J. G., Devor, A., Wald, L. L., and Dale, A. M. (2003). In vivo tracing of major rat brain pathways using manganese-enhanced magnetic resonance imaging and three-dimensional digital atlasing. Neuroimage 20, 1591–1600.
Lerch, J. P., Carroll, J. B., Spring, S., Bertram, L. N., Schwab, C., Hayden, M. R., and Henkelman, R. M. (2008). Automated deformation analysis in the YAC128 Huntington disease mouse model. Neuroimage 39, 32–39.
Li, F. H., Liu, K. F., Silva, M. D., Omae, T., Sotak, C. H., Fenstermacher, J. D., and Fisher, M. (2000). Transient and permanent resolution of ischemic lesions on diffusion-weighted imaging after brief periods of focal ischemia in rats – correlation with histopathology. Stroke 31, 946–953.
Lu, H., Zuo, Y., Gu, H., Waltz, J. A., Zhan, W., Scholl, C. A., Rea, W., Yang, Y., and Stein, E. A. (2007). Synchronized delta oscillations correlate with the resting-state functional MRI signal. Proc. Natl. Acad. Sci. U.S.A. 104, 18265–18269.
Lu, H. B., Scholl, C. A., Zuo, Y. T., Demny, S., Rea, W., Stein, E. A., and Yang, Y. H. (2010). Registering and analyzing rat fMRI data in the stereotaxic framework by exploiting intrinsic anatomical features. Magn. Reson. Imaging 28, 146–152.
Ma, Y., Hof, P. R., Grant, S. C., Blackband, S. J., Bennett, R., Slatest, L., McGuigan, M. D., and Benveniste, H. (2005). A three-dimensional digital atlas database of the adult C57BL/6J mouse brain by magnetic resonance microscopy. Neuroscience 135, 1203–1215.
Ma, Y., Smith, D., Hof, P., Foerster, B., Hamilton, S., Blackband, S. J., Yu, M., and Benveniste, H. (2008). In vivo 3D digital atlas database of the adult C57BL/6J mouse brain by magnetic resonance microscopy. Front. Neuroanat. 2:1.
Magnuson, M., Majeed, W., and Keilholz, S. D. (2010). Functional connectivity in blood oxygenation level-dependent and cerebral blood volume-weighted resting state functional magnetic resonance imaging in the rat brain. J. Magn. Reson. Imaging 32, 584–592.
Maheswaran, S., Barjat, H., Bate, S. T., Aljabar, P., Hill, D. L. G., Tilling, L., Upton, N., James, M. F., Hajnal, J. V., and Rueckert, D. (2009a). Analysis of serial magnetic resonance images of mouse brains using image registration. Neuroimage 44, 692–700.
Maheswaran, S., Barjat, H., Rueckert, D., Bate, S. T., Howlett, D. R., Tilling, L., Smart, S. C., Pohlmann, A., Richardson, J. C., Hartkens, T., Hill, D. L. G., Upton, N., Hajnal, J. V., and James, M. F. (2009b). Longitudinal regional brain volume changes quantified in normal aging and Alzheimer’s APP x PS1 mice using MRI. Brain Res. 1270, 19–32.
Maldjian, J. A., Laurienti, P. J., Kraft, R. A., and Burdette, J. H. (2003). An automated method for neuroanatomic and cytoarchitectonic atlas-based interrogation of fMRI data sets. Neuroimage 19, 1233–1239.
Mazziotta, J., Toga, A., Evans, A., Fox, P., Lancaster, J., Zilles, K., Woods, R., Paus, T., Simpson, G., Pike, B., Holmes, C., Collins, L., Thompson, P., MacDonald, D., Iacoboni, M., Schormann, T., Amunts, K., Palomero-Gallagher, N., Geyer, S., Parsons, L., Narr, K., Kabani, N., Le Goualher, G., Boomsma, D., Cannon, T., Kawashima, R., and Mazoyer, B. (2001). A probabilistic atlas and reference system for the human brain: International Consortium for Brain Mapping (ICBM). Philos. Trans. R. Soc. Lond. B Biol. Sci. 356, 1293–1322.
Mazziotta, J. C., Toga, A. W., Evans, A., Fox, P., and Lancaster, J. (1995a). A probabilistic atlas of the human brain: theory and rationale for its development. The International Consortium for Brain Mapping (ICBM). Neuroimage 2, 89–101.
Mazziotta, J. C., Toga, A. W., Evans, A. C., Fox, P. T., and Lancaster, J. L. (1995b). Digital brain atlases. Trends Neurosci. 18, 210–211.
Mechelli, A., Price, C. J., Friston, K. J., and Ashburner, J. (2005). Voxel-based morphometry of the human brain: methods and applications. Curr. Med. Imaging Rev. 1, 105–113.
Mori, S., Oishi, K., Jiang, H. Y., Jiang, L., Li, X., Akhter, K., Hua, K. G., Faria, A. V., Mahmood, A., Woods, R., Toga, A. W., Pike, G. B., Neto, P. R., Evans, A., Zhang, J. Y., Huang, H., Miller, M. I., Zijl, P., and Mazziotta, J. (2008). Stereotaxic white matter atlas based on diffusion tensor imaging in an ICBM template. Neuroimage 40, 570–582.
Nersesyan, H., Hyder, F., Rothman, D. L., and Blumenfeld, T. H. (2004). Dynamic fMRI and EEG recordings during spike-wave seizures and generalized tonic-clonic seizures in WAG/Rij rats. J. Cereb. Blood Flow Metab. 24, 589–599.
Pawela, C. P., Biswal, B. B., Cho, Y. R., Kao, D. S., Li, R., Jones, S. R., Schulte, M. L., Matloub, H. S., Hudetz, A. G., and Hyde, J. S. (2008). Resting-state functional connectivity of the rat brain. Magn. Reson. Med. 59, 1021–1029.
Paxinos, G., and Franklin, K. (2000). The Mouse Brain in Stereotaxic Coordinates. New York: Academic Press.
Paxinos, G., and Watson, C. (1989). The Rat Brain in Stereotaxic Coordinates, 2nd Edn. Sidney: Academic Press.
Paxinos, G., and Watson, C. (1998). The Rat Brain in Stereotaxic Coordinates, 4th Edn. San Diego: Academic Press.
Paxinos, G., and Watson, C. (2007). The Rat Brain in Stereotaxic Coordinates, 6th Edn. London: Academic Press.
Pelled, G., Bergman, H., Ben-Hur, T., and Goelman, G. (2005). Reduced basal activity and increased functional homogeneity in sensorimotor and striatum of a Parkinson’s disease rat model: a functional MRI study. Eur. J. Neurosci. 21, 2227–2232.
Perona, P., and Malik, J. (1990). Scale-space and edge-detection using anisotropic diffusion. IEEE Trans. Pattern Anal. Mach. Intell. 12, 629–639.
Pletnikov, M. V., Jones, M. L., Rubin, S. A., Moran, T. H., and Carbone, K. M. (2001). Rat model of autism spectrum disorders – genetic background effects on Borna disease virus-induced developmental brain damage. Neuroprotective Agents 939, 318–319.
Ramu, J., Bockhorst, K. H., Mogatadakala, K. V., and Narayana, P. A. (2006). Functional magnetic resonance imaging in rodents: methodology and application to spinal cord injury. J. Neurosci. Res. 84, 1235–1244.
Rasser, P. E., Patrick, J. J., Ward, P. B., and Thompson, P. M. (2008). A Deformable Brodmann Area Atlas. Available at: http://www.loni.ucla.edu/(thompson/ISBI2004/PRasserISBI2004_final.pdfed
Reyt, S., Picq, C., Sinniger, V., Clarencon, D., Bonaz, B., and David, O. (2010). Dynamic causal modelling and physiological confounds: a functional MRI study of vagus nerve stimulation. Neuroimage 52, 1456–1464.
Riddle, D., Richards, A., Zsuppan, F., and Purves, D. (1992). Growth of the rat somatic sensory cortex and its constituent parts during postnatal-development. J. Neurosci. 12, 3509–3524.
Rohr, K., Stiehl, H. S., Sprengel, R., Buzug, T. M., Weese, J., and Kuhn, M. H. (2001). Landmark-based elastic registration using approximating thin-plate splines. IEEE Trans. Med. Imaging 20, 526–534.
Sanabria-Diaz, G., Melie-Garcia, L., Iturria-Medina, Y., Aleman-Gomez, Y., Hernandez-Gonzalez, G., Valdes-Urrutia, L., Galan, L., and Valdes-Sosa, P. (2010). Surface area and cortical thickness descriptors reveal different attributes of the structural human brain networks. Neuroimage 50, 1497–1510.
Sanganahalli, B. G., Bailey, C. J., Herman, P., and Hyder, F. (2009). Tactile and Non-Tactile Sensory Paradigms for fMRI and Neurophysiologic Studies in Rodents. Dynamic Brain Imaging (New York, NY: Humana Press), 213–242.
Saur, D., Schelter, B., Schnell, S., Kratochvil, D., Kupper, H., Kellmeyer, P., Kummerer, D., Kloppel, S., Glauche, V., Lange, R., Mader, W., Feess, D., Timmer, J., and Weiller, C. (2010). Combining functional and anatomical connectivity reveals brain networks for auditory language comprehension. Neuroimage 49, 3187–3197.
Sawiak, S. J., Wood, N. I., Williams, G. B., Morton, A. J., and Carpenter, T. A. (2009). Voxel-based morphometry in the R6/2 transgenic mouse reveals differences between genotypes not seen with manual 2D morphometry. Neurobiol. Dis. 33, 20–27.
Schwarz, A. J., Danckaert, A., Reese, T., Gozzi, A., Paxinos, G., Watson, C., Merlo-Pich, E. V., and Bifone, A. (2006). A stereotaxic MRI template set for the rat brain with tissue class distribution maps and co-registered anatomical atlas: application to pharmacological MRI. Neuroimage 32, 538–550.
Schwarz, A. J., Gozzi, A., Reese, T., and Bifone, A. (2007). In vivo mapping of functional connectivity in neurotransmitter systems using pharmacological MRI. Neuroimage 34, 1627–1636.
Schweinhardt, P., Fransson, P., Olson, L., Spenger, C., and Andersson, J. L. R. (2003). A template for spatial normalisation of MR images of the rat brain. J. Neurosci. Methods 129, 105–113.
Shattuck, D. W., Mirza, M., Adisetiyo, V., Hojatkashani, C., Salamon, G., Narr, K. L., Poldrack, R. A., Bilder, R. M., and Toga, A. W. (2008). Construction of a 3D probabilistic atlas of human cortical structures. Neuroimage 39, 1064–1080.
Sotero, R. C., Trujillo-Barreto, N. J., Iturria-Medina, Y., Carbonell, F., and Jimenez, J. C. (2007). Realistically coupled neural mass models can generate EEG rhythms. Neural Comput. 19, 478–512.
Spenger, C., Josephson, A., Klason, T., Hoehn, M., Schwindt, W., Ingvar, M., and Olson, L. (2000). Functional MRI at 4.7 Tesla of the rat brain during electric stimulation of forepaw, hindpaw, or tail in single- and multislice experiments. Exp. Neurol. 166, 246–253.
Sumiyoshi, A., Riera, J. J., Ogawa, T., and Kawashima, R. (2011). A mini-cap for simultaneous EEG and fMRI recording in rodents. Neuroimage 54, 1951–1965.
Sung, K. K., Jang, D. P., Lee, S., Kim, M., Lee, S. Y., Kim, Y. B., Park, C. W., and Cho, Z. H. (2009). Neural responses in rat brain during acute immobilization stress: a [F-18]FDG micro PET imaging study. Neuroimage 44, 1074–1080.
Takagi, T., Nakamura, M., Yamada, M., Hikishima, K., Momoshima, S., Fujiyoshi, K., Shibata, S., Okano, H. J., Toyama, Y., and Okano, H. (2009). Visualization of peripheral nerve degeneration and regeneration: monitoring with diffusion tensor tractography. Neuroimage 44, 884–892.
Tenney, J. R., Duong, T. Q., King, J. A., Ludwig, R., and Ferris, C. F. (2003). Corticothalamic modulation during absence seizures in rats: a functional MRI assessment. Epilepsia 44, 1133–1140.
Toga, A. W., Santori, E. M., Hazani, R., and Ambach, K. (1995). A 3D digital map of rat-brain. Brain Res. Bull. 38, 77–85.
Tzourio-Mazoyer, N., Landeau, B., Papathanassiou, D., Crivello, F., Etard, O., Delcroix, N., Mazoyer, B., and Joliot, M. (2002). Automated anatomical labeling of activations in SPM using a macroscopic anatomical parcellation of the MNI MRI single-subject brain. Neuroimage 15, 273–289.
Uberti, M. G., Michael, D. B., and Liu, Y. (2009). A semi-automatic image segmentation method for extraction of brain volume from in vivo mouse head magnetic resonance imaging using constraint level sets. J. Neurosci. Methods 179, 338–344.
Van Camp, N., D’Hooge, R., Verhoye, M., Peeters, R. R., De Deyn, P. P., and Van der Linden, A. (2003). Simultaneous electroencephalographic recording and functional magnetic resonance imaging during pentylenetetrazol-induced seizures in rat. Neuroimage 19, 627–636.
Yang, H. Y., Qiao, H. X., and Tian, X. (2011). Proteomic analysis of cerebral synaptosomes isolated from rat model of Alzheimer’s disease. Indian J. Exp. Biol. 49, 118–124.
Zijdenbos, A. P., Dawant, B. M., Margolin, R. A., and Palmer, A. C. (1994). Morphometric analysis of white matter lesions in MR images: method and validation. IEEE Trans. Biomed. Eng. 13, 716–724.
Appendix
Intensity “Equalization” of the MRIs
The intensity of the i-th MRI, say  , is linearly transformed according to
  where ai and bi are the scale and offset parameters respectively. These are estimated by minimizing
  where hi(x) and hreference(x) are the smoothed envelopes of the histograms of the i-th and reference MRIs, respectively, and xk are the centers of the bins of the reference histogram. This reference histograms is the one of both having the highest position of its peak.
Details of the Implementation of the Approximate Thin Plate Spline Registration Method
We only provide here some necessary details of the approximate TPS method, based on the mapping of two sets of landmarks defined in the source Isource(x) and the target image (Paxinos and Watson atlas). The complete detailed theory can be found in (Rohr et al., 2001).
The warping of the source image to the target image shape is expressed by:

where f(x) is the transformation estimated by the approximate TPS method, x is the space coordinate and {} denotes interpolation for realistic discrete images. Let the rows of matrices  and
and  be the coordinates of the n landmarks in the target and source spaces respectively. The transformation f(x) in Eq. A1 is divided into a linear and a non-linear part, the former determining its behavior at infinity. Both parts are parameterized by a 4 × 4 affine matrix A (affine transformation in homogeneous coordinates) and a n × 4 matrix W respectively, which are calculated by:
where the (i, j)-th element of the distance matrix KX,Y is the norm of the difference between the i-th and j-th rows of matrices X and Y respectively. The transformation f(x) is calculated with the following expression:

The product λΣ in Eq. A2 is the regularization term. The matrix Σ encloses the weights assigned to the landmarks and is weighted by λ. For λ = 0, the method reduces to the standard interpolating TPS method where f(pi) = qi, being pi and qi the i-th landmark of the target and source sets respectively. When λ → ∞ the transformation becomes affine. We used a value according to a criterion defined in (Rohr et al., 2001). We define the matrix of weights as:
where the i-th block diagonal 3 × 3 weight matrix  (i = 1,…,n) accounts for the anisotropic shape and size of the voxel of the image and its orientation in the world space, provided by the voxel-to-real millimeter space Mvoxel2world. The matrix Σi is geometrically an ellipsoid of size which is also tuned by parameter wi, which quantifies the amount of subjective error committed when placing the i-th landmark.
Keywords: Wistar rats, template set, elastix, SPM, fMRI, morphometry, anatomical connectivity, Paxinos and Watson
Citation: Valdés-Hernández PA, Sumiyoshi A, Nonaka H, Haga R, Aubert-Vásquez E, Ogawa T, Iturria-Medina Y, Riera JJ and Kawashima R (2011) An in vivo MRI template set for morphometry, tissue segmentation, and fMRI localization in rats. Front. Neuroinform. 5:26. doi: 10.3389/fninf.2011.00026
Received: 14 April 2011; Accepted: 17 October 2011;
Published online: 24 November 2011.
Edited by:
Jan G. Bjaalie, University of Oslo, NorwayReviewed by:
Dante R. Chialvo, Northwestern University, USAAlexis Roche, Siemens Medical Solutions, Switzerland
Copyright: © 2011 Valdés-Hernández, Sumiyoshi, Nonaka, Haga, Aubert-Vásquez, Ogawa, Iturria-Medina, Riera and Kawashima. This is an open-access article subject to a non-exclusive license between the authors and Frontiers Media SA, which permits use, distribution and reproduction in other forums, provided the original authors and source are credited and other Frontiers conditions are complied with.
*Correspondence: Jorge J. Riera, Institute of Development, Aging and Cancer, Tohoku University, 4-1 Seiryo-machi, Aoba-ku, Sendai 980-8575, Japan. e-mail: riera@idac.tohoku.ac.jp
† Pedro Antonio Valdés-Hernández and Akira Sumiyoshi have contributed equally to this work.