High-resolution fiber tract reconstruction in the human brain by means of three-dimensional polarized light imaging
- 1 Institute of Neuroscience and Medicine (INM-1, INM-2, INM-4), Research Centre Jülich and Jülich Aachen Research Alliance, Jülich, Germany
- 2 Department of Mathematics and Natural Sciences, University of Wuppertal, Wuppertal, Germany
- 3 C. and O. Vogt Institute for Brain Research, Heinrich-Heine University Düsseldorf, Düsseldorf, Germany
- 4 Department of Psychiatry, Psychotherapy and Psychosomatics, RWTH Aachen University, Aachen, Germany
Functional interactions between different brain regions require connecting fiber tracts, the structural basis of the human connectome. To assemble a comprehensive structural understanding of neural network elements from the microscopic to the macroscopic dimensions, a multimodal and multiscale approach has to be envisaged. However, the integration of results from complementary neuroimaging techniques poses a particular challenge. In this paper, we describe a steadily evolving neuroimaging technique referred to as three-dimensional polarized light imaging (3D-PLI). It is based on the birefringence of the myelin sheaths surrounding axons, and enables the high-resolution analysis of myelinated axons constituting the fiber tracts. 3D-PLI provides the mapping of spatial fiber architecture in the postmortem human brain at a sub-millimeter resolution, i.e., at the mesoscale. The fundamental data structure gained by 3D-PLI is a comprehensive 3D vector field description of fibers and fiber tract orientations – the basis for subsequent tractography. To demonstrate how 3D-PLI can contribute to unravel and assemble the human connectome, a multiscale approach with the same technology was pursued. Two complementary state-of-the-art polarimeters providing different sampling grids (pixel sizes of 100 and 1.6 μm) were used. To exemplarily highlight the potential of this approach, fiber orientation maps and 3D fiber models were reconstructed in selected regions of the brain (e.g., Corpus callosum, Internal capsule, Pons). The results demonstrate that 3D-PLI is an ideal tool to serve as an interface between the microscopic and macroscopic levels of organization of the human connectome.
Introduction
Structure and function of the human brain are intricately linked across multiple levels of brain connectivity. It is the brain’s intrinsic multiscale architecture that allows different morphological entities to be defined at different scales, essentially depending on the spatial resolution provided by the available neuroimaging techniques and the scientific objectives. A natural description of neuronal connections might therefore be organized in three levels that cover the macro-, meso-, and microscale (Sporns et al., 2005; Kötter, 2007). Various approaches for mapping the human connectome at the level of macroscopic anatomical connectivity, i.e., at millimeter scales, such as MR-based diffusion imaging (Basser et al., 1994; Pierpaoli and Basser, 1996; Conturo et al., 1999; Beaulieu, 2002; Tuch et al., 2002, 2003; Hagmann et al., 2003; Tuch, 2004; Mori and Zhang, 2006; Schmahmann et al., 2007; Naidich et al., 2008; Johansen-Berg and Rushworth, 2009) or dissection techniques (Klingler, 1935; Türe et al., 2000) were established over the past years and enriched our knowledge about fiber pathways in the human brain. To obtain and interpret experimental connectivity data at the meso- and microscale, however, is still a challenging task in terms of methodology, data handling and analysis, as well as exchange of information.
Three-dimensional Polarized Light Imaging
Axer et al. (2011) represents a novel neuroimaging technique to map nerve fibers, i.e., myelinated axons, and their pathways in human postmortem brains with are solution at the sub-millimeter scale, i.e., at the mesoscale. Polarized light imaging (Scheuner and Hutschenreiter, 1972; Brosseau, 1998; Larsen et al., 2007) utilizes an optical property of the myelin sheaths of nerve fibers known as birefringence (Göthlin, 1913; Schmidt, 1923; Schmitt and Bear, 1937). Biological samples exhibit essentially two types of birefringence referred to as intrinsic and form birefringence. The latter type reflects the textural feature of the material and the mutual birefringence of all its components (e.g., tissue and embedding), while the intrinsic birefringence is caused by individual properties of the constituting molecules (Wiener, 1912). In case of nerve fibers, birefringence is induced by the regular arrangement of lipids and proteins in the myelin sheath (Norton and Cammer, 1984; Martenson, 1992), thus resulting in distinct optical anisotropy. The net birefringence of the neurofilaments inside the axon and the radially oriented lipid chains of the myelin sheath can be described by a single axis of optical anisotropy giving rise to uniaxial negative birefringence and, therefore, reflecting the spatial orientation of the fiber (Vidal et al., 1979).
The birefringence of brain tissue is measured by passing linearly polarized light through histological brain sections and by detecting local changes in the polarization state of light by a camera. Such principle of measurement is referred to as polarimetry and has been used in anatomical studies of the central nervous system already a century ago (Brodmann, 1903). However, in the recent past, significant advances in the 3D reconstruction of microtome sections (Dauguet et al., 2007; Singh et al., 2008; Capek et al., 2009; Palm et al., 2010), image analysis, computational techniques, and progress in understanding the interaction of polarized light with birefringent tissue (Schnabel, 1966; Fraher and MacConnaill, 1970; Oldenbourg and Mei, 1995;Oldenbourg, 1996; Oldenbourg et al., 1998; Massoumian et al., 2003; Farrell et al., 2005; Larsen et al., 2007; Axer et al., 2011) have opened up new avenues to study brain regions with complex fiber architecture at the highest level of detail. We took advantage of this progress to gain a vector field description of fiber tract orientations in histological brain sections and to reconstruct 3D fiber tract models in selected brain regions across a series of aligned sections.
This paper focuses on basic data structures gained with the latest advances in Three-dimensional polarized light imaging (3D-PLI; based on a novel tilting object stage and a polarizing microscope) and their utilization in terms of mapping the human connectome at the mesoscale. The idea is to apply basic principles of polarized light imaging in different optical setups, thus providing complementary scales of resolution to bridge the gap between structural descriptions at single fiber dimensions and at macroscopic fiber pathway levels.
Materials and Methods
Preparation of Human Brain Tissue
The study is based on adult postmortem human brains obtained from body donor programs at the medical departments of the Heinrich-Heine-University in Düsseldorf (Germany) and the Rheinisch-Westfälische Technische Hochschule in Aachen (Germany) in accordance with legal requirements. The clinical records were free of signs of neurological or psychiatric diseases. The brains were removed from the skull, fixed in 4% buffered formalin for at least 6 months, embedded in luxol fast blue-stained gelatine, and sectioned completely with a thickness of 100 μm thickness using a cryostat microtome (Polycut CM 3500, Leica, Germany). The maximum deviation of the section thickness from 100 μm amounts to ±5 μm. The integrity of the myelin sheaths in the brain tissue was not affected. In addition, one optic tract was prepared bilateral and sectioned parallel to the main fiber direction with thicknesses of 20, 25, 50, 70, and 100 μm.
The blockface of the frozen, gelatine-embedded brain was imaged during sectioning in order to obtain an undistorted reference image, i.e., the blockface image (Zilles et al., 2002; Amunts and Zilles, 2006; Toga et al., 2006). Hence, a CCD camera (Oscar F510, Allied Vision Technologies, Germany) with an endocentric lens (APO Rodagon N 2.8/50 mm, Linos, Germany) was mounted vertically above the blockface at a distance of 1.2 m. It provided an image dimension of 2588 × 1958 pixels. In addition, the precise distance of each blockface to the camera system was determined with an opto-electronic distance sensor (LDM 42A, Astech, Germany). The distance measurement is required to correct for perspective distortions in the images, since an endocentric lens was used and the distance between the block surface and the camera increased while the sectioning proceeded. This is due to the fact, that the microtome owns an automatized height adjustable knife. Taking the distance information into account, the set of blockface images was subjected to a single-modality 2D affine registration for the 3D (blockface) brain reconstruction (Eiben et al., 2010; Palm et al., 2010).
Large-area Rotating Polarimeter with Tilting Stage
A fully automatized rotating polarimeter has been constructed and optimized for high-resolution PLI (Axer et al., 2011). The setup is sensitive to small local changes of the polarization state of light induced by the interaction with the anisotropic brain tissue, i.e., the myelin. Since it provides single-shot imaging of whole human brain sections (with a sensitive area of 24 cm in diameter), it is referred to as large-area polarimeter.
The polarimeter is equipped with a pair of crossed polarizers (XP38, ITOS, Germany), a specimen stage and a quarter-wave retarder (WP140, ITOS, Germany) positioned between the two polarizers. A customized LED light source (FZJ-SSQ300-ALK-G, iiM, Germany) illuminates the brain section with a narrow-band green wavelength spectrum (525 ± 25 nm; Figure 1A). By rotating all optical devices simultaneously around the stationary tissue sample, the principal axes of birefringent structures, i.e., the fiber axes, are systematically imaged by a CCD camera (AxioCam HRc, Zeiss, Germany) at discrete rotation angles ρ. The birefringence causes the measured light intensity I to vary in a sinusoidal manner with respect to the rotation angles ρ, depending on the local 3D fiber orientation (φ, α; cf. Figure 1C). The sinusoidal variation of light intensity as a function of the rotation angle is referred to a slight intensity profile.
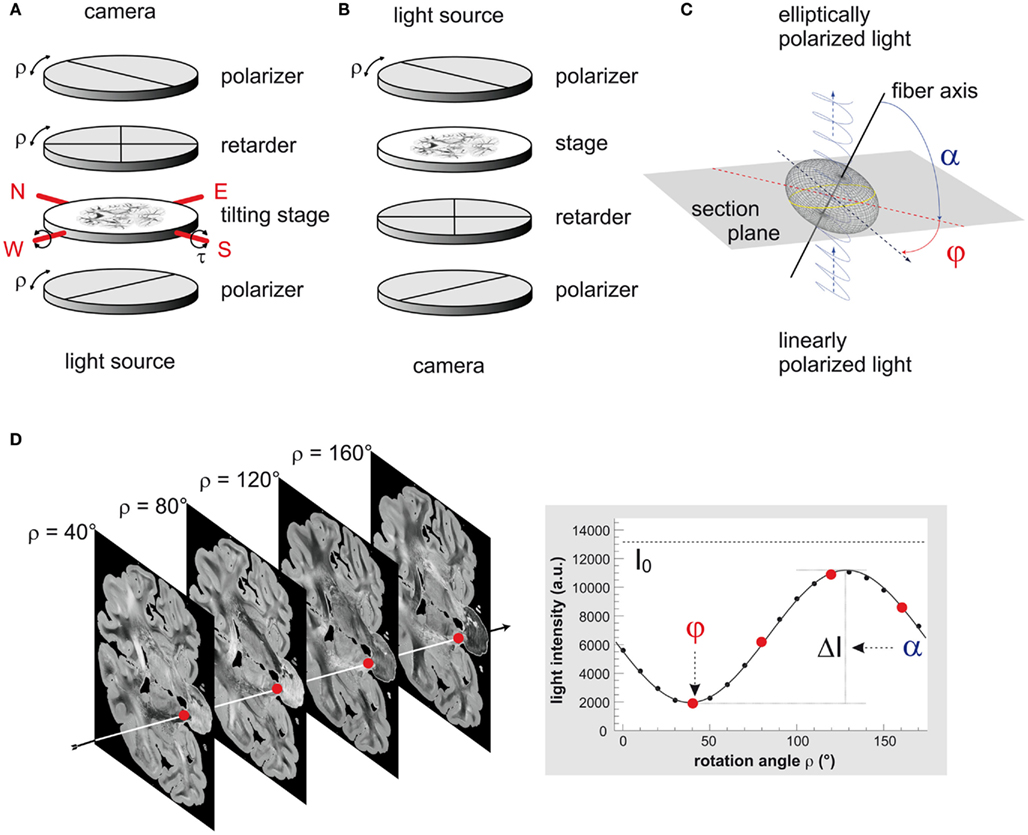
Figure 1. Three-dimensional-polarimetry at a glance. (A) Scheme of the large-area rotating polarimeter with tilting stage (N-North, W-West, E-East, S-South). (B) Optical scheme of the polarizing microscope LMP1-1. (C) Scheme of the optical fiber model. The refractive index of a negative uniaxially birefringent medium, such as a myelinated axon, is described by an elliptically shaped oblate surface, the refractive index ellipsoid or indicatrix (gray mesh). A beam of linearly polarized light (blue trace) interacts locally with the myelin sheath of a single axon (black line), which induces a phase shift to the light beam. The light becomes elliptically polarized and serves as a direct measure of the orientation of the indicatrix or the prevailing local fiber orientation, respectively. In the frame coordinate system this orientation is determined by the in-plane direction angle φ and the out-of-section inclination angle α. (D) A typical PLI raw image data set consists of 18 images corresponding to equidistant rotation angles between 0° and 170°. Here, a selection of four images of a coronal section is shown, while the sketched arrow indicates one representative pixel. To obtain the fiber orientation, the measured light intensities are studied pixel-wise as a function of discrete rotation angles. The derived physical model provides a precise mathematical description of the measurement (continuous black line) and relates the sine phase to the direction angle φ and the amplitude to the inclination angle α. The highlighted data points correspond to the selected images.

Where

Each image pixel is therefore characterized by an individual light intensity profile that can be described with the Jones calculus (Jones, 1941) and the basic principles of optics (Snell’s law, Huygens–Fresnel principle; cf. Saleh and Teich, 1991; Figure 1D). In Eq 1 the phase of the profile encodes the angle φ, which represents the individual fiber direction, i.e., the projection of the fiber axis into the section plane with respect to the null position of the polarimeter (ρ = 0°). The amplitude of the profile quantifies the phase retardation δ induced to the light wave by the myelin (Figure 1C). This phase retardation is a function of the light wavelength λ, the section thickness d, the birefringence Δn of the myelin, and the inclination angleα of the fiber’s principal axis (cf. Eq 2). The birefringence depends on the wavelength of light and the temperature of the tissue. In order to keep the variations of both parameters small, the light source was water-cooled and all measurements were carried out at controlled environment temperatures (22 ± 1°C). The transmittance I0 denotes the intensity of the incident light modified by local extinction effects.
As a fundamental technical innovation in comparison to the planar setup as specified in Axer et al. (2011) a novel specimen stage has been introduced. This stage is tiltable with respect to two perpendicular axes precisely aligned to the camera image axes. By slightly tilting the brain section around these two axes, fiber tracts can be imaged stereoscopically from four different views (within a tilt angle range of |τ| ≤ 4° in east, west, north, and south direction), in addition to the standard planar view (Figure 1A). This innovation was driven by the known limitation of a standard planar polarimeter where the extracted inclination angles α are naturally restricted to absolute values between 0° and 90°, and are therefore afflicted with a sign ambiguity. The tilting modifies the inclination angles of the fiber axes with respect to the planar projection plane and enables to disambiguate the inclination measurement.
Image ac quisition and image processing using the large-area polarimeter
Each section was imaged at five tilts (planar with τ = 0°; east, west, north, and south with τ = 4°) at 18 equidistant rotation angles of the polarimeter covering an angular range between 0° and 170°. I.e., in total, 90 images were acquired for each section. The camera setup yielded RGB images with image sizes of 1388 × 1040 pixels and a pixel dimension of 100 μm × 100μm. The sampling interval can be increased up to 33 μm × 33μm using the same setup. However, for the presented studies we aimed for isotropic voxel sizes. The light intensities were sampled with a dynamic range of 14 bits per color channel.
Raw image processing, signal analysis and image registration were performed according to Axer et al. (2011). As a result, the following parameter maps were obtained:
• The transmittance map (I0): it represents the pixel-wise (doubled) average map of all PLI raw images (cf. Figure 1D) and is a measure for the extinction of light after passing through the polarimeter and the brain tissue.
• The retardation map (|sin δ): it equates to the normalized amplitudes of the light intensity profiles (ΔI/I0, cf. Figure 1D) and describes the magnitude of the phase shift (retardation) induced to the light wave due to the interaction with the birefringent tissue.
• The fiber direction map (φ): it describes the in-section direction angle, i.e., the x–y orientation of each fiber (cf. Figure 1C).
• The fiber inclination map (α): it describes the out-of-section angle, i.e., the vertical component of each fiber (cf. Figure 1C).
Image calibration, independent component analysis (ICA), discrete harmonic Fourier analysis, and image registration were fundamental prerequisites in this processing chain aiming for consistent data sets of local fiber orientations. To ensure comparability among different sections and brains, image calibration is applied to all raw images aiming for homogeneous and constant background intensities, i.e., measured light intensities without brain tissue in the optical path. In addition, the application of ICA to PLI raw images enables the effective separation of birefringence signals from interfering signal sources, such as electronics noise, light scatter, dust particles, or filter inhomogeneity. The reproducibility of the results gained with the combination of image calibration and ICA has been demonstrated in Dammers et al. (2010, 2011). Pixel-wise fitting of the ICA-enhanced light intensity profiles by means of discrete harmonic Fourier analysis (Glazer et al., 1996) provides fast and automatized extraction of the parameter maps listed above.
To utilize the additional information gained with the tilting stage, a precise rectification of the raw images had to be done prior to any analysis. This is due to the fact, that the tilts geometrically distort the raw images with respect to each other. To overcome this distortion, projective transformations (2D homography, cf. Fischler and Bolles, 1981; Hartley and Zisserman, 2004) between mutually tilted image pairs is recovered based on a robust matching of SIFT keypoints (scale-invariant feature transform; cf. Lowe, 2004). Since the tilting takes effect on the amplitudes of the intensity profiles, i.e., on the retardation |sin δ|, the change of the retardation with the tilting condition was evaluated pixel-wise to determine the sign of the fiber inclination. The sign describes the slope of the fiber course (uphill or downhill). By this means an inclination sign map(s) was created for each section.
Fiber tractography
To reconstruct fiber models in a volume of fiber orientation maps (FOM), the data were subjected to a standard streamline algorithm based on the Euler method (Mori, 2007) as implemented in the basic toolbox of the Matlab@ framework (Mathworks Inc.). A tract is propagated from a seed point by following the local vector orientation using interpolation methods. Seed points were densely placed on the surfaces of a box confining the volume of interest (VOI). The VOIs shown here were placed primarily in areas of white matter with a heterogeneous fiber direction (e.g., the Pons). The line propagator step size was chosen to be 30% of the vector grid unit throughout the propagation process in order to minimize aberration due to coarse quantization. The resulting streamlines are defined by a sequence of vertices in 3D space.
Polarizing Microscope
Basic principles of polarized imaging enable also to utilize microscopic devices in order to study neuroanatomical structures at the highest level of detail in 3D on small sample and tissue sizes. Therefore, a polarizing microscope (LMP-1, Taorad, Germany) with a pixel size of 1.6 μm × 1.6 μm in-plane has been employed (Glazer et al., 1996). In contrast to the large-area polarimeter, only one linear polarizer in the optical path is rotatable (Figure 1B) and a brain section has to be scanned tile-wise with overlapping fields of view using a motorized microscope stage (Märzhäuser, Germany). Pursuant to theoretical optics (Jones, 1941), Eqs 1 and 2 also apply to this type of polarimeter.
Image acquisition and image processing using the polarizing microscope
Each brain region was imaged at 18 equidistant rotation angles of the polarizer covering an angular range between 0° and 170°.A single microscope (grayscale) image comprises an area of about 3.3 mm × 3.3 mm (2048 × 2048 pixels), i.e., a whole brain section is built up of about 2500 single tiles, for example. The images were sampled with a dynamic range of 12 bits.
To produce ultra high-resolution images of large brain areas, multiple images were combined (stitched) with a Matlab@ application developed in our lab. Raw image processing and signal analyses were performed as already described for the large-area polarimeter (cf. Axer et al., 2011).
Results
Reference Data Set
The aligned series of blockface images represents a three-dimensional data set that serves as an undistorted high-resolution reference. It was used to retrieve the spatial coherence within adjacent sections and to correct for tissue distortions inevitably introduced by sectioning and further steps of histological processing. In particular, the luxol fast blue-stained gelatine (cf. Figure 2A) turned out to be beneficial for automatized discrimination of the brain tissue from the background, i.e., the surrounding gelatine. The hue representation of the hue-saturation-value (HSV) color space provided a clear separation of the predominantly red and yellow colored fixed brain tissue from the blue color of the gelatine (Figure 2). The perspective error correction integrated into the rigid registration process finally led to an accurately aligned and scaled high-resolution 3D representation of the blockface brain (Figure 2D).
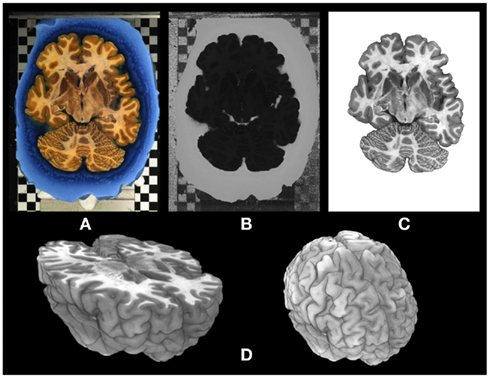
Figure 2. Segmentation and 3D reconstruction of the blockface image data set. (A) Blockface image of a horizontally cut postmortem human brain represented in RGB (red-green-blue) color space. The brain is embedded in stained (luxol fast blue) gelatine. The checkerboard in the background was used for subsequent alignment of the blockface images obtained during sectioning. (B) Transformation of the RGB image into the HSV-color space enables an accurate segmentation of the image into tissue and background. The hue-channel of the blockface is shown here. (C) Segmented brain section. (D) 3D representations of the reconstructed blockface brain.
Parameter Maps and Data Structures
The image processing chain of 3D-PLI results in a set of comprehensive parameter maps in 2D (grayscale) and 3D (colorscale), each of them highlighting distinct tissue properties and anatomical structures. One of the basic 2D parameter maps obtained by analyzing the light intensity profiles is the transmittance map (I0; Figure 3A). This type of map provides a general separation of gray and white matter, but it also shows intensity gradients within the cortical and the subcortical gray matter as well as in the white matter (cf. arrow heads in Figure 3B). Comparison of transmittance maps of coronal sections with myelin stained sections based on the Heidenhain–Woelcke technique (Bürgel et al., 1997) revealed a striking correspondence between both modalities (Figure 3). However, the transmittance maps yielded more contrast across the white matter than the myelin stained sections, in particular in U-fiber regions (cf. white arrow heads in Figures 3A,B).
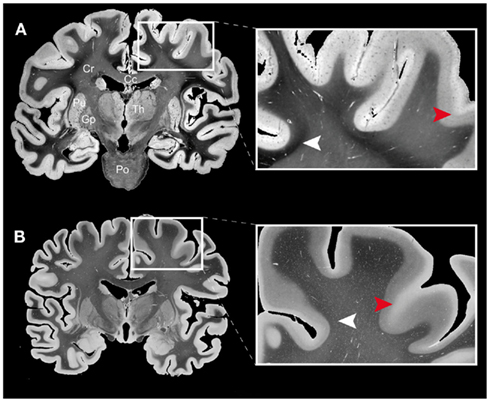
Figure 3. Comparison of (A) a transmittance map of a coronal whole human brain section (100 μm thickness, gelatine embedding) and (B) a coronal section from another human brain stained with the Heidenhain–Woelcke technique for myelin (20 μm thickness, paraffin embedding). The images were scaled to the same gray value range and show global similarities in their gray level distributions. However, the enlarged regions of interest from the frontal lobe (right images) document that the transmittance map yields more contrast across the white matter regions (e.g., in U-fiber regions as indicated by the white arrow heads) than the classical histological myelin staining. For cortical regions the measured intensity gradients are similar (cf. red arrow heads). Legend: Cc, corpus callosum; Cr, corona radiata; Th, thalamus; Pu, putamen; Gp, globus pallidus; Po, pons.
The fundamental entity of 3D-PLI to characterize the locally prevailing fiber tract orientation in a single voxel is a unit vector. The integration of all vectors for an entire brain section leads to a comprehensive 3D vector field description, i.e., a FOM. This is another, fundamental difference from the myelin stained sections, which do not enable to extract the third dimension, i.e., the inclination.
Due to the tilting stage, we were able to assign a definite preference to the out-of-section inclination angle (i.e., the sign relative to the section plane) in the FOM for the first time. Analysis of the tilted raw images approved that the tilting of 4° takes effect on the amplitudes of the intensity profiles, i.e., the retardation |sin δ| (cf. Figure 4A as an example). As intended, the data revealed correlations between the tilting condition (east, west, north, and south), the retardation, and the fiber direction. The largest changes of retardation values caused by the tilting were observed in brain regions with prevailing intermediate fiber inclinations (i.e., α ≈ 45°), while fibers running within or perpendicular to the section plane showed much smaller changes. The benefit of tilting becomes obvious in Figures 4B,C. In general, we observed that inclination sign maps were characterized by distinct clusters dominated by the same inclination sign distributed all over the brain section (cf. Figure 5A). However, the tilting method also proved to be sensitive to heterogeneous structures within regions of intense fiber intermingling such as the Corona radiata.
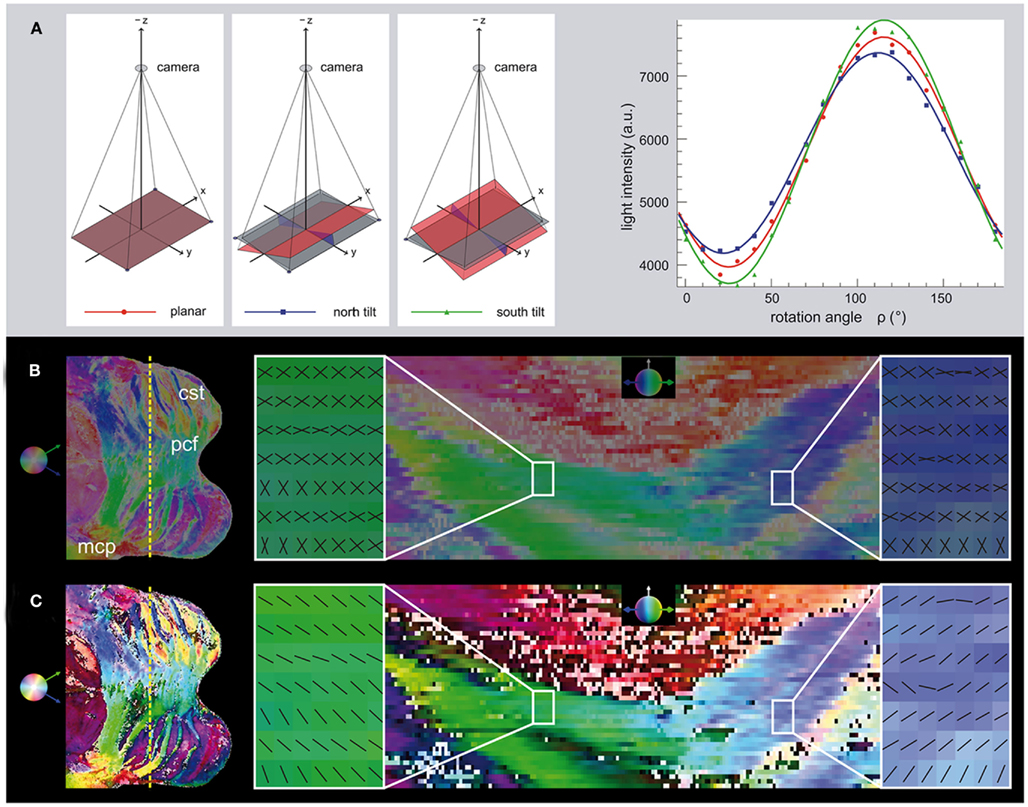
Figure 4. Determination of the ambiguous inclination sign by tilting. (A) In addition to images acquired in the standard planar position, further information can be derived from images that are tilted in north and south direction, for example. After optical rectification, the light intensity in a single pixel is plotted for the series of polar filter rotation angles. The north, south and planar tilting positions have different amplitudes. The change in the amplitude of the signal demonstrates the change in the absolute inclination angle as a result of tilting. In this case, the south tilt yields a larger amplitude and hence a higher absolute inclination angle than the north tilt. This indicates a negative inclination sign. (B) The overview of the transversal section through the Pons on the left shows the cutting plane (dotted yellow line) of the coronal view on the right. The HSV-color coding shows both possible inclination signs in the same color (Hue: transversal direction, Saturation: coronal inclination, Value: constantly 0.5). The magnified regions show the two possible fiber orientations mirrored to each other, if the inclination sign is still ambiguous. (C) After determination of the inclination sign, a decision is made for every pixel, which is color-coded by different brightness values (>0.5: positive sign, <0.5: negative sign). The magnified regions show the resulting fiber orientations. The inclination sign was determined as negative in the left region, while a positive inclination sign was derived in the right region. The orientations agree with the course of the pontocerebellar fiber bundles running toward each other from lateral to medial. Legend: cst, cortico-spinal tract; pcf, pontocerebellar fibers; mcp, middle cerebellar peduncle.
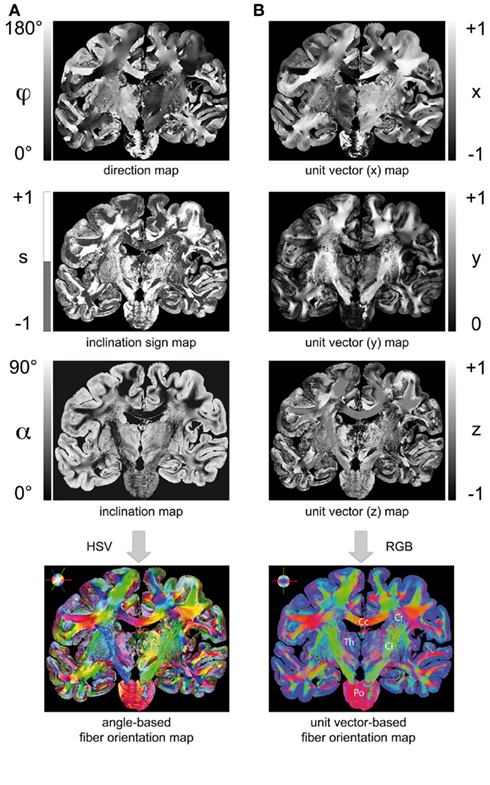
Figure 5. Two ways to render a fiber orientation map (FOM): (A) Transformation of a direction map, inclination sign map, and inclination map into a FOM using the HSV-color space (encoding: H = 2φ, S = 1 − α/90°, V = 1 for S > 0; H = 2φ, S = 1, V = 1 − α/90°) for S ≤ 0). (B) Transformation of the extracted fiber orientations into unit vectors (x = cos(sα)·cos(φ), y = cos(sα)·sin(φ), z = sin(sα)) and visualization in the RGB color space (encoding: R = | x |, G = | y |, B = | z |). Legend: Cc, corpus callosum; Cr, corona radiata; Ci, internal capsule; Th, thalamus; Po, pons.
Two representations of a FOM turned out to be beneficial in terms of visualization and fiber tractography: (i) utilizing the HSV-color space provided an informative way to encode the determined fiber orientations based on the direction angle (φ), the inclination angle (α), and the inclination sign (s) for each image pixel. Brain regions with a rich variety of fiber orientations (e.g., the Corona radiata), but also regions with homogenous fiber courses (e.g., the Corpus callosum) become evident in an HSV-colored FOM (cf. Figure 5A). (ii) Transforming the angle-based description of fiber orientations into unit vectors (Figure 5B) resulted in a data structure that is best suited for fiber tractography using streamline algorithms. The visualization of vector data utilizes the RGB color space, where the vector components are encoded in the basic colors red, green, and blue. Though this color code is an established approach in MR diffusion imaging, it actually reduces the full spatial information of symmetrical fiber courses (compare the transversally symmetric courses of the Internal capsule in the FOMs shown in Figure 5). However, the RGB representation is preferred for direct comparison between 3D-PLI and results from diffusion weighted MRI (cf. Oishi et al., 2011).
3D Fiber Tract Models
The 3D data set for high-resolution structural fiber mapping is composed of adjusted and stacked sectional FOMs. This 3D-FOM already provides novel insights into complex local fiber architectures, even without further computational processing such as fiber tractography.
Fiber tract models finally demonstrate the feasibility of the applied imaging technique. Therefore, fiber tractography was performed in small subsamples of a stack of 10 coronal whole brain FOMs to build continuous fiber tract models. Five regions of interest with dimensions of 2 mm × 2 mm × 1 mm distributed over the entire volume of sections were subjected to the streamline algorithm. Five selected regions are shown in Figure 6, where fiber models were reconstructed from 3D-FOMs in the Corpus callosum, the Capsula interna, and the Pons. Intense fiber crossings also affect 3D-PLI due to partial volume effects, however, on a much smaller scale than it is the case in diffusion weighted MRI. Some transversal fiber tracts (red) crossing the internal capsule between Putamen and Thalamus (C) are confused (blue) by the cortico-spinal mainstream (green) and do not survive the crossing.
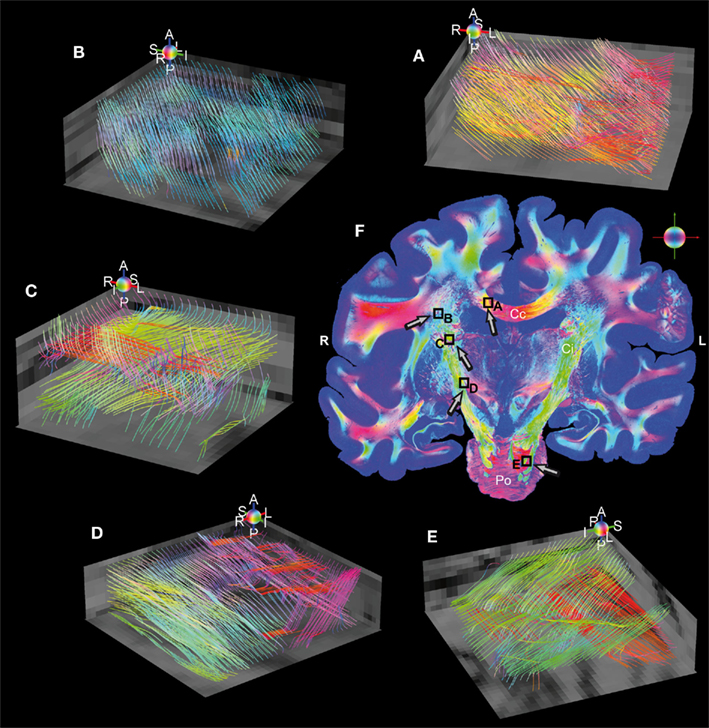
Figure 6. Reconstructed fiber tract models in five regions of interest (volumes of 2 mm × 2 mm × 1 mm) sampled with an isotropic resolution of 100 μm. The individual color spheres (legend: A, anterior; P, posterior; I, inferior; S, superior; R, right; L, left) indicate the orientations of the fiber tract models. Fiber models were generated in (A) the Corpus callosum, (B) the Corona radiata, (C,D) the internal capsule (green), perforated by small fascicles (red and magenta) connecting the cerebral cortex with the Thalamus (C), Red nucleus and Substantia nigra (D), and (E) the Pons (green = cortico-spinal tract, red = transversal branches). Superimposed retardation maps (gray values) serve as anatomical references. (F) The RGB fiber orientation map is a representative of the stacked whole brain sections used for the study. The black rectangles highlight the magnified regions of interest (A–E) and the arrows indicate the individual observer’s perspective. Legend: Cc, corpus callosum; Ci, internal capsule; Po, pons; R, right; L, left.
In addition to fiber tract models in white matter regions reconstructed from 3D-FOMs obtained with the large-area polarimeter, 3D-PLI applied to the polarizing microscope images provides further, even more detailed insights into regions close to or within the cortex. To give an example, association fibers at the circular sulcus of the insula were 3D reconstructed and studied (Figure 7). The fiber tract models in a volume of 0.5 mm × 0.5 mm × 0.1 mm (obtained with the large-area polarimeter) follow a clear subcortical U-shape with indications of changeover into the cortex (Figure 7B). Two microscopic 2D-FOMs (Figures 7C,D) covering 2D sub-regions at the white/gray matter border of a section from the center of the stack prove the fiber crossover into the cortex. Single fibers can clearly be observed at the provided pixel size of 1.6 μm. There seems to be a gap (blue) between the white and the gray matter. This is due to the fact that the contributions of perpendicularly crossing fibers in the same voxel tend to average out thus lowering the amplitude of the measured intensity profile, i.e., partial volume effects due to the section thickness can be observed.
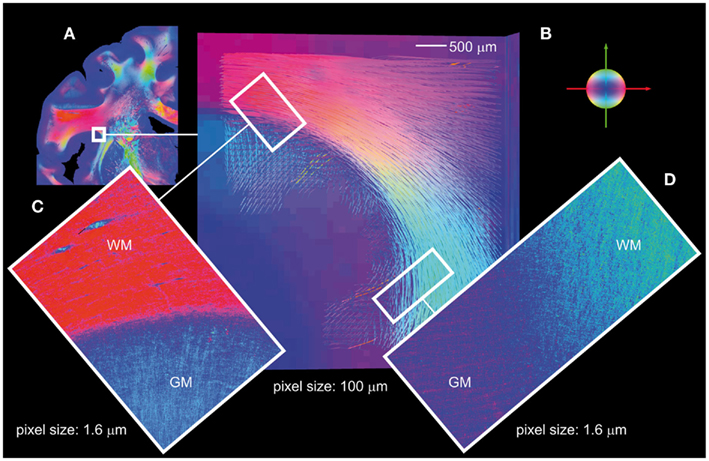
Figure 7. Association fibers. (A) FOM of a coronal section with the indicated region of interest in the upper part of the circular sulcus of the insula. (B) Reconstructed U-fiber models (volume of 5 mm × 5 mm × 1 mm, pixel size of 100 μm) based on a stack of aligned FOMs obtained with the large-area polarimeter, covering the insular cortex and the underlying extreme capsule turning into the stem of the parietal operculum. Superficial layers of U-fibers turn into the insular cortex and into the cortex of the post-central gyrus. (C,D) Show the gray/white matter borders in the two regions of interest shown in (B), analyzed with the polarizing microscope. Note, the two 2D-FOMs reflect the fiber orientations in a single section from the center of the stack. White matter (WM) and gray matter (GM) regions are characterized by significantly different fiber tract densities and fiber orientations. Color code of the fiber orientations: red = transversal, green = axial, blue = sagittal.
To demonstrate the influence of section thickness d on the retardation as well as the impacts on the polarimeter setup in terms of sensitivity, a study of an optic tract was carried out. Since the optic tract was sectioned along its main fiber direction (i.e., α = 0°), the determined retardation maps of the different section thicknesses reveal the largest signals to be expected in 3D-PLI. According to Axer et al. (2011), the histogram of a retardation map with resident in-plane fibers can be used to determine the correlation between the measured retardation value |sin δ| and the inclination angle α (Figure 8). The mean values  of the histogram tails were extracted by fitting and used as reference measures for in-plane fibers of the different section thicknesses (Figures 8A,B). A significant increase of
  from 0.201 at d = 20 μm to 0.728 at d = 100 μm was observed, while scattering and absorption effects become more influential at thicknesses above 100 μm thus leading to a decrease of the maximum signal (Figure 8B). This behavior was described by a fit function based on Eqs 1 and 2 multiplied by an exponential term. Hundred micrometer represents the maximum suitable section thickness and the highest dynamic range to separate fiber inclination angles (Figure 8C).
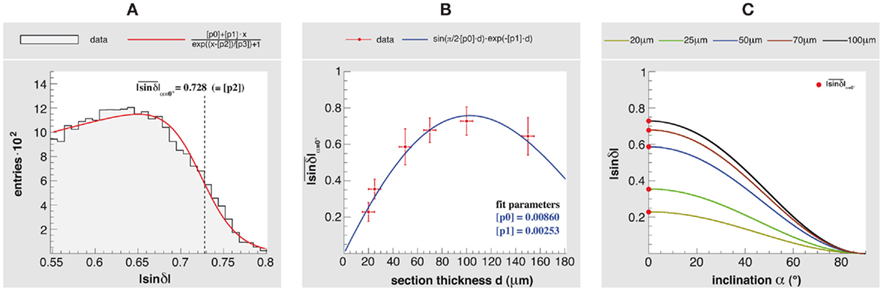
Figure 8. Influence of the section thickness on the fiber inclination estimation. An optic tract was sectioned parallel to the main fiber direction with thicknesses of 20, 25, 50, 70, and 100 μm, and measured with the large-area polarimeter. (A) Histogram of the retardation map ( > 0.55) of a 100 μm section and the resulting fit function (with fit parameter [p2] = used as a reference measure). (B)
as a function of the section thickness. The error bars indicate the maximum deviation of the section thickness (±5 μm) and the maximum variance across the fitted histogram tail. (C) The relationship between the fiber inclination angle α and a measured retardation value is given by (cf. Axer et al., 2011). Since depends on the section thickness, the usable dynamic range to separate different fiber inclinations decreases for decreasing thicknesses.
> 0.55) of a 100 μm section and the resulting fit function (with fit parameter [p2] = used as a reference measure). (B)
as a function of the section thickness. The error bars indicate the maximum deviation of the section thickness (±5 μm) and the maximum variance across the fitted histogram tail. (C) The relationship between the fiber inclination angle α and a measured retardation value is given by (cf. Axer et al., 2011). Since depends on the section thickness, the usable dynamic range to separate different fiber inclinations decreases for decreasing thicknesses.
Discussion
In order to create a comprehensive structural description of the neural network and its intricate fiber connections, i.e., to assemble an important part of the human connectome, a multimodal approach is certainly indispensable. Depending on data provided by complementary neuroimaging techniques, an anatomical connectivity map could target three levels of organization (microscale, mesoscale, and macroscale) requiring reasonable cross-level integration.
MR-based diffusion imaging is the most frequently used method to visualize fiber pathways in both the living (Basser et al., 1994; Pierpaoli and Basser, 1996; Conturo et al., 1999; Beaulieu, 2002; Tuch et al., 2002, 2003; Hagmann et al., 2003; Tuch, 2004; Mori and Zhang, 2006; Schmahmann et al., 2007; Naidich et al., 2008; Johansen-Berg and Rushworth, 2009) and the postmortem (Englund et al., 2004; Larsson et al., 2004) human brain. With a spatial resolution at the millimeter scale, diffusion imaging contributes nearly exclusively to the construction of data sets at the level of macroscopic structural connectivity. However, restricted by the resolution, complex fiber networks and small fiber tracts cannot be discovered reliably at present. Furthermore, the terminal parts of fiber tracts within the cerebral cortex cannot be demonstrated.
Conversely, microscopic techniques generate data sets of impressing neuroanatomical detail, but they are limited to small sample sizes (i.e., small areas of interest in a small number of subjects). This substantially restricts their predictive power. In the recent years, anatomical connections in the human postmortem brains were studied with dissection techniques (Klingler, 1935; Türe et al., 2000), in myelin stained sections of adult human brains (Bürgel et al., 1997, 2006), or of immature brains taking advantage of heterochronic myelination of different fiber tracts during pre- and early postnatal development (Flechsig, 1901), in lesioned brains using various techniques for staining degenerating fibers (Funk and Heimer, 1967; Clarke and Miklossy, 1990), and using tract-tracing methods for discovering local connections (Burkhalter et al., 1993; Lanciego and Wouterlood, 2000). These studies have contributed to our knowledge about human brain fiber tracts, but all of these approaches suffer from severe restrictions, if fiber tracts are to be mapped in the adult human brain including their 3D courses. In contrast to studies in animals, the tight packing of different fiber tracts in the white substance, and the lack of specific tracers for in vitro tracking of long-distance fibers made comprehensive fiber tract mapping impossible in the adult human brain (Schmahmann and Pandya, 2009).
Obviously, there is still need for an operational link between both, the high-resolution micro-connectome and the averaged macro-connectome. In this paper, we propose to utilize 3D-PLI based on two polarimeter setups providing complementary scales of resolution, in order to close the gap between macroscopic fiber pathways revealed by diffusion weighted MRI and their real terminals located in the cortex: the polarizing microscope and the large-area polarimeter with tilting stage. The latter device has been optimized to one-shot whole brain imaging, while the polarizing microscope is an ideal tool to disentangle complex fiber constellations in small brain areas and to follow fiber tracts to their terminals into gray matter regions. With an in-plane sampling between 33 and 100 μm, the large-area polarimeter enables the 3D modeling of long and short distance white matter tracts as shown in this paper (cf. Figures 6 and 7). The polarizing microscope features an in-plane pixel size down to axonal diameters (1.6 μm) together with a high sensitivity to small birefringent signals (cf. Figure 7). This multiscale approach utilizing the same technology provides data sets of importance to several branches of neuroscience, however, limited to a small number of subjects.
To successfully apply 3D-PLI to thin brain sections, a valid bio-physical model is required to describe the light transmittance through the polarimeter and the birefringent brain tissue. It has been shown in previous studies (Axer et al., 2000, 2011; Larsen et al., 2007) that basic principles of theoretical optics provide a sound base to estimate the light transmission, which is a measure of the locally prevailing spatial fiber orientation. Data fitting by means of discrete Fourier analysis based on the mathematical expression of this bio-physical model (cf. Eqs 1 and 2) enabled the analysis of light intensity profiles obtained for each tissue (image) pixel. This holds true for the large-area polarimeter as well as the polarizing microscope.
The used fiber model yields the local in-plane fiber direction φ with very high accuracy (±2°), while the most challenging parameter to be extracted is the inclination angle α. The interpretation of a light intensity profile is quite challenging in terms of fiber inclination, due to its complex dependencies on section thickness, birefringence, and light wavelength. In addition, the inclination angle cannot be extracted unambiguously from the theoretical model solely. The introduction of a tilting object stage into the large-area polarimeter represents a milestone for 3D-PLI, since the out-of-section fiber inclination (α) could be determined without ambiguity, for the first time. This enhances the reliability of the extracted fiber orientation significantly. Note, with a standard planar polarimeter the fiber orientation was intrinsically afflicted with an inclination sign ambiguity, which was formerly tackled with a simulated annealing approach as proposed by Larsen and Griffin (2004). However, it was demonstrated that the purely computer-aided application of the continuity heuristic could not entirely eliminate the ambiguity (Axer et al., 2011). Uncertainties evoked by this ambiguity were maximal (±90°), for fibers with intermediate inclinations (i.e., α ≈ ±45°), while fibers running within or perpendicular to the section plane were not affected. We found that the tilting method is most sensitive where a sign flip of the inclination has the greatest impact on the spatial fiber orientation, which are fibers with intermediate inclinations. This observation matches the expectation based on the theoretical model (cf. Eq 2) used to determine the fiber orientations.
The results presented here were mainly derived from brain sections with a thickness of 100 μm as this thickness was found to be well suited for the large-area polarimeter (Axer et al., 2001). Our study of an optic tract confirmed this result (cf. Figure 8). However, PLI inherently permits the reduction of section thicknesses to values considerably below 100 μm, even down to single fiber dimensions, but at the expense of the sampled dynamic range. We demonstrated this by investigating sections of the optic tract of different thicknesses (between 20 and 150 μm; cf. Figure 8). It is clear that the discrimination of different fiber orientations becomes more challenging and the demands on the imaging system are tightened when the section thickness decreases. In addition, the handling of whole brain cryo-sections also becomes difficult. However, investigating thin brain sections still represents an attractive approach to enhance the sampling resolution of 3D-PLI in the third dimension and to further reduce partial volume effects impairing the signal interpretation, e.g., in transition zones between fiber tracts with different orientations (Figure 7 and Axer et al., 2011) or in regions with myelination gradients. The polarizing microscope with its high sensitivity is certainly a promising tool in terms of fiber inclination determination in thin sections (below 50 μm).
Although the tissue properties (myelination, section thickness, fiber orientation) are well integrated into the bio-physical model, to date, the 3D-PLI-based analysis does not take local variations in the axon myelination into account. As a consequence, regions characterized by significant myelination gradients (e.g., the transition domains between gray and white matter) are likely to be misinterpreted as changing fiber inclinations, if the local myelination is not considered. The misinterpretation becomes obvious in RGB FOMs (Figure 5), where cortical areas appear to be dominated by steep fiber orientations (blue color). Brain areas where the density of fibers diminishes significantly (e.g., subcortical nuclei) are quite challenging, since the detected amplitudes of the light intensity profiles are small, thus faking steep fibers. Therefore, fiber models were primarily reconstructed in white matter domains so far. However, in the current study we demonstrated that the extracted transmittance value I0 is sensitive to local myelination and is, therefore, an ideal candidate to quantify the myelination in the same term as used for the determination of fiber inclinations. Cortical and subcortical gray matter could be distinguished from regions of strong myelination in the white matter, in accordance with results gained from myelin stained histological sections (cf. Figure 3). As a matter of fact, the transmittance basically reflects the attenuation of light when passing through the brain tissue. The observed discriminative absorption and scattering effects in the white matter are mainly due to the local shape and orientation of the refractive index ellipsoid determined by the myelination. This means that the transmittance is an indirect measure of the myelination slightly modified by the fiber orientation (which explains the intensity gradients in the white matter, Hebeda et al., 1994). Ongoing studies are currently dealing with the extension of the 3D-PLI analyses using the transmittance information.
The 3D reconstruction of gross histological brain sections poses particular challenges to the alignment techniques. Clearly, nerve fiber models of the human brain also depend on an accurate 3D volume data set of vectors derived from a registered stack of 2D-FOMs, which are individually taken from distorted histological brain sections. In order to preserve the reliability of the vector data on a sub-millimeter scale, the registration procedure needs to meet high-resolution requirements. A successful strategy to retrieve the 3D coherence among serial sections and correction for histological distortion was realized by using state-of-the-art image (affine and non-linear) registration techniques applied to blockface images (Figure 2) and to corresponding parameter maps (Palm et al., 2010). By means of these instruments large global and local section deformations, unavoidably introduced during histological processing, were corrected with high quality, i.e., with a maximum displacement of 300 μm. The registration preserves the initial in-plane image resolution by using high-resolution blockface images as spatial references. In addition, the registration yields transformations related to rotation, shearing or non-uniform scaling. This information is used to re-orientate the fiber courses accordingly, finally providing an aligned stack of corrected FOMs – the 3D-FOM. High-quality image registration of large microscopic PLI data sets remains a task for future studies.
Promising approaches to reconstruct fiber tracts from 3D-FOMs are based on deterministic streamline region-to-region tractography (cf. Figures 6 and 7). Due to the complexity of the 3D-PLI data sets, the reconstruction is currently limited to small regions of interest (about 300 mm3). To deal with crossing and kissing fiber constellations, partial volume effects in transitional domains between adjacent major fiber tracts, or gray/white matter borders, investigations beyond the standard streamline tractography are certainly needed. Therefore, dedicated utilization of high-performance computing and state-of-the-art tools for fiber tractography will be of importance to exploit the great potential of 3D-PLI in the near future.
Conclusion
Three-dimensional polarized light imaging enables the uniform high-resolution scanning of whole human brain sections, which allows for the investigation of both short-range axonal projections and long-distance links at the sub-millimeter scale. Depending on the employed optical system (large-area polarimeter or polarizing microscope), PLI is able to establish an interface between the microscopic and the macroscopic characterization of the anatomical connectivity by employing different polarimeter setups. Since the method is capable of detecting even small fiber tracts with myelination within the cerebral cortex, it is an ideal candidate to demonstrate the anatomical connections by means of direct measurements at complementary scales in the same object. Such multiscale data sets are valuable as they provide in 2D and 3D (i) where and to what extent fibers change orientation, (ii) to study specific tracts through regions of crossing and kissing fibers, and (iii) to tackle partial volume effects. Accurately following fibers through the complexity of white matter bundles has always been a crucial issue in MRI-based fiber tractography. 3D-PLI FOMs comprise vector fields that are comparable to the principal Eigenvectors extracted from a field of MR diffusion tensors, and are therefore best suited to be integrated in a multimodal approach to map connectional anatomy. This is extremely useful for the independent calibration and validation of next generation tracking software and the interpretation of the results derived from diffusion weighted MRI. Cross-validation of diffusion imaging and 3D-PLI in the same species is particularly desirable and will therefore be addressed in future studies.
Cross-linking of multiscale data sets from complementary neuroimaging techniques is a real challenge and requires precise definition of data structures, robust alignment tools, and interfacing modalities. In case of 3D-PLI, the blockface-based reference brain represents an operational link between the macroscopic MRI world and the high-resolution 3D-PLI modality. By means of 3D–3D registration, the reference brain can be transformed into the MR space, while the correspondence of the single blockface sections to the PLI parameter maps are still maintained. Once the interface is established, our multiscale approach for the same object is a most versatile tool to derive anatomical information (e.g., fiber orientations, myelination) at different measured scales of resolution (as exemplified in the reconstructed U-fiber region). In this way 3D-PLI provides the key technology and fundamental data structures to bridge the gap between the macro- and the micro-connectome.
Conflict of Interest Statement
The authors declare that the research was conducted in the absence of any commercial or financial relationships that could be construed as a potential conflict of interest.
Acknowledgments
We would like to thank M. Cremer and F. Kocaer, Research Centre Jülich, Germany, for excellent technical assistance and preparation of the histological sections. Our work was partly supported by the Initiative and Network Fund of the Helmholtz Association within the Helmholtz Alliance on Systems Biology (“Human Brain Model”).
References
Amunts, K., and Zilles, K. (2006). “Atlases of the human brain: tools for functional neuroimaging,” in Neuroanatomical Tract Tracing 3: Molecules, Neurons, and Systems, eds L. Zaborsky, F. G. Wouterlood, and J. L. Lanciego (New York: Springer), 566–603.
Axer, H., Axer, M., Krings, T., and Keyserlingk, D. G. V. (2001). Quantitative estimation of 3-D fiber course in gross histological sections of the human brain using polarized light. J. Neurosci. Methods 105, 121–131.
Axer, H., Berks, G., and Keyserlingk, D. G. V. (2000). Visualization of nerve fiber orientation in gross-histological sections of the human brain. Microsc. Res. Tech. 51, 481–192.
Axer, M., Amunts, K., Gräß el, D., Palm, C., Dammers, J., Axer, H., Pietrzyk, U., and Zilles, K. (2011). A novelapproach to the humanconnectome: ultra-high resolutionmapping of fiber tracts in the brain. Neuroimage 54, 1091–1101.
Basser, P. J., Mattiello, J., and Le Bihan, D. (1994). Estimation of the effective self-diffusion tensor from the NMR spin-echo. J. Magn. Reson. B 103, 247–254.
Beaulieu, C. (2002). The basis of anisotropic water diffusion in the nervous system – A technical review. NMR Biomed. 15, 435–455.
Brodmann, K. (1903). Bemerkungen zur Untersuchung des Nervensystems im polarisierten Lichte. J. Psychol. Neurol. 2, 211–213.
Bürgel, U., Amunts, K., Hoemke, L., Mohlberg, H., Gilsbach, J. M., and Zilles, K. (2006). White matter fiber tracts of the human brain: three-dimensional mapping at microscopic resolution, topography and intersubject variability. Neuroimage 29, 1092–1105.
Bürgel, U., Mecklenburg, I., Blohm, U., and Zilles, K. (1997). Histological visualization of long fibre tracts in the white matter of adult human brains. J. Brain Res. 38, 397–404.
Burkhalter, A., Bernardo, K. L., and Charles, V. (1993). Development of local circuits in human visual cortex. J. Neurosci. 13, 1916–1931.
Capek, M., Bruza, P., Janacek, J., Karen, P., Kubinova, L., and Vagnerova, R. (2009). Volume reconstruction of large tissue specimensfrom serial physical sections usingconfocalmicroscopy and correction of cuttingdeformations by elastic registration. Microsc. Res. Tech. 72, 110–119.
Clarke, S., and Miklossy, J. (1990). Occipital cortex in man: organization of callosal connections, related myelo- and cytoarchitecture, and putative boundaries of functional visual areas. J. Comp. Neurol. 298, 188–214.
Conturo, T. E., Lori, N. F., Cull, T. S., Akbudak, E., Snyder, A. Z., Shimony, J. S., McKinstry, R. C., Burton, H., and Raichle, M. E. (1999). Tracking neuronal fiber pathways in the living human brain. Proc. Natl. Acad. Sci. U.S.A. 96, 10422–10427.
Dammers, J., Axer, M., Gräß el, D., Palm, C., Zilles, K., Amunts, K., and Pietrzyk, U. (2010). Signal enhancement in polarized light imaging by means of independent component analysis. Neuroimage 49, 1241–1248.
Dammers, J., Breuer, L., Axer, M., Kleiner, M., Eiben, B., Gräß el, D., Dickscheid, T., Zilles, K., Amunts, K., Shah, J., and Pietrzyk, U. (2011). Automatic identification of gray and white matter components in polarized light imaging. Neuroimage 59, 1338–1347.
Dauguet, J., Delzescaux, T., Conde, F., Magnin, J. F., Ayache, N., Hantraye, P., and Frouin, V. (2007). Three-dimensional reconstruction of stained histological slices and 3D non-linear registration with in-vivo MRI for whole baboon brain. J. Neurosci. Methods 164, 191–204.
Eiben, B., Palm, C., Pietrzyk, U., Davatzikos, C., and Amunts, K. (2010). “Perspective error correction using registration for blockface volume reconstruction of serial histological sections of the human brain,” in Bildverarbeitung für die Medizin, eds T. M. Deserno, H. Handels, H. P. Meinzer, and T. Tolxdorff (Berlin: Springer), 301–305.
Englund, E., Sjöbeck, M., Brockstedt, S., Lätt, J., and Larsson, E. M. (2004). Diffusion tensor MRI post mortem demonstrated cerebral white matter pathology. J. Neurol. 251, 350–352.
Farrell, A., Rouseff, D., and McCally, L. R. (2005). Propagation of polarized light through two- and three-layer anisotropic stacks. J. Opt. Soc. Am. 22, 1981–1992.
Fischler, M. A., and Bolles, R. C. (1981). Random sample consensus: a paradigm for model fittingwithapplications to image analysis and automated cartography. Comm. ACM 24, 381–395.
Flechsig, P. (1901). Developmental (myelongenetic) localisation of the cerebral cortex in the human subject. Lancet 158, 1027–1030.
Fraher, J. P., and MacConnaill, M. A. (1970). Fibre bundles in the CNS revealed by polarized light. J. Anat. 106, 170.
Funk, R. P., and Heimer, L. (1967). Two methods for selective silver impregnation of degenerating axons and their synaptic endings in the central nervous system. Brain Res. 4, 36–374.
Glazer, A. M., Lewis, J. G., and Kaminsky, W. (1996). An automatic optical imaging system for birefringent media. Proc. R. Soc. Lond. A 452, 2751–2765.
Göthlin, G. F. (1913). Die doppelbrechenden Eigenschaften des Nervengewebes. Kungl. Svenska Vetenskapsakad. Handl. 51, 1.
Hagmann, P., Thiran, J. P., Jonasson, L., Vandergheynst, P., Clarke, S., Maeder, P., and Meuli, R. (2003). DTI mapping of human brain connectivity: statistical fibre tracking and virtual dissection. Neuroimage 19, 545–554.
Hartley, R. I., and Zisserman, A. (2004). Multiple View Geometry in Computer Vision. Cambridge: University Press.
Hebeda, K. M., Menovsky, T., Beek, J. F., Wolbers, J. G., and van Gemehrt, M. J. C. (1994). Light propagation in the brain depends on nerve fiber orientation. Neurosurgery 35, 720–724.
Johansen-Berg, H., and Rushworth, M. F. (2009). Using diffusion imaging to study human connectional anatomy. Annu. Rev. Neurosci. 32, 75–94.
Jones, R. C. (1941). A new calculus for the treatment of optical systems. J. Opt. Soc. Am. 31, 488–493.
Klingler, J. (1935). Erleichterung der makroskopischen Präparation des Gehirns durch den Gefrierprozess. Schweiz. Arch. Neurol. Psychiatr. 36, 247–256.
Kötter, R. (2007). “Anatomical concepts of brain connectivity,” in Handbook of Brain Connectivity, eds V. K. Jirsa, and A. R. MacIntosh (Berlin: Springer), 149–167.
Lanciego, J. L., and Wouterlood, F. G. (2000). Neuroanatomical tract-tracing methods beyond 2000: what’s now and next. J. Neurosci. Methods 103, 1–2.
Larsen, L., and Griffin, L. D. (2004). “Can a continuity heuristic be used to resolve the inclination ambiguity of polarized light imaging?” in CVAMIA-MMBIA, LNCS 3117, eds M. Sonka, I. A. Kakadiaris, and J. Kybic (Berlin: Springer), 365–375.
Larsen, L., Griffin, L. D., Gräß el, D., Witte, O. W., and Axer, H. (2007). Polarized light imaging of white matter architecture. Microsc. Res. Tech. 70, 851–863.
Larsson, E. M., Englund, E., Sjöbeck, M., Lätt, J., and Brockstedt, S. (2004). MRI with diffusion tensor imaging post-mortem at 3.0 T in a patient with frontotemporal dementia. Dement. Geriatr. Cogn. Disord. 17, 316–319.
Lowe, D. G. (2004). Distinctive image features from scale-invariant keypoints. Int. J. Comput. Vis. 60, 91–110.
Massoumian, F., Juskaitis, R., Neil, M. A. A., and Wilson, T. (2003). Quantitative polarized light microscopy. J. Microsc. 209, 13–22.
Mori, S., and Zhang, J. (2006). Principles of diffusion tensor imaging and its applications to basic neuroscience research. Neuron 51, 527–539.
Naidich, T. P., Duvernoy, H. M., Delman, B. N., Sorensen, A. G., Kollias, S. S., and Haacke, E. M. (2008). Duvernoy’s Atlas of the Human Brain Stem and Cerebellum. Vienna: Springer.
Oishi, K., Faria, A., van Zijl, P. CM., and Mori, S. (2011). MRI Atlas of Human White Matter. London: Academic Press.
Oldenbourg, R., and Mei, G. (1995). New polarized light microscope with precision universal compensator. J. Microsc. 180, 140–147.
Oldenbourg, R., Salmon, E. D., and Tran, P. T. (1998). Birefringence of single and bundled microtubules. Biophys. J. 74, 645–654.
Palm, C., Axer, M., Gräß el, D., Dammers, J., Lindemeyer, J., Zilles, K., Pietrzyk, U., and Amunts, K. (2010). Towards ultra-high resolution fibre tract mapping of the human brain – Registration of polarized light images and reorientation of fibre vectors. Front. Hum. Neurosci. 4, 1–16.
Pierpaoli, C., and Basser, P. J. (1996). Toward a quantitative assessment of diffusion anisotropy. Magn. Reson. Med. 33, 893–906.
Scheuner, G., and Hutschenreiter, J. (1972). Polarisationsmikroskopie in der Histophysik. Leipzig: VEB Georg Thieme.
Schmahmann, J. D., and Pandya, D. N. (2009). Fiber Pathways of the Brain. New York: Oxford University Press.
Schmahmann, J. D., Pandya, D. N., Wang, R., Dai, G., D’Arceuil, H. E., deCrespigny, A. J., and Wedeen, V. J. (2007). Association fibre pathways of the brain: parallel observations from diffusion spectrum imaging and autoradiography. Brain 130, 630–653.
Schmitt, O., and Bear, R. S. (1937). The optical properties of vertebrate nerve axon as related to fiber size. J. Cell. Comp. Physiol. 9, 261–273.
Schnabel, R. (1966). Zur Mikroskopischen Untersuchung optisch anisotroper Strukturen des Nervensystems mit circular polarisiertem Licht. Acta Neuropathol. 7, 180–184.
Singh, M., Rajagopalan, A., Kim, T. S., Hwang, D., Chui, H., Zhang, X. L., Lee, A. Y., and Zarow, C. (2008). Co-registration of in vivo human MRI brain images to postmortem histological microscopic images. Int. J. Imaging Syst. Technol. 18, 325–335.
Sporns, O., Tononi, G., and Kötter, R. (2005). The human connectome: a structural description of the human brain. PLoS Comput. Biol. 1, e42.
Toga, A. W., Thompson, P. M., Mori, S., Amunts, K., and Zilles, K. (2006). Towards multimodal atlases of the human brain. Nat. Rev. Neurosci. 7, 952–966.
Tuch, D. S., Reese, T. G., Wiegell, M. R., Belliveau, J. W., and Wedeen, V. J. (2003). Diffusion MRI of complex neural architecture. Neuron 40, 885–895.
Tuch, D. S., Reese, T. G., Wiegell, M. R., Makris, N., Belliveau, J. W., and Wedeen, V. J. (2002). High angular resolution diffusion imaging reveals intravoxel white matter fiber heterogeneity. Magn. Reson. Med. 48, 577–582.
Türe, U., Yasargil, M. G., Friedmann, A. H., and Al-Mefty, O. (2000). Fiber dissection technique: lateral aspect of the brain. Neurosurgery 47, 417–427.
Vidal, B., Silveira Mello, M. L., Caseiro-Filho, A. C., and Godo, C. (1979). Anisotropic properties of the myelin sheath. Acta Histochem. 66, 32–39.
Keywords: connectome, human brain, method, polarized light imaging, PLI, U-fiber, systems biology, white matter
Citation: Axer M, Grässel D, Kleiner M, Dammers J, Dickscheid T, Reckfort J, Hütz T, Eiben B, Pietrzyk U, Zilles K and Amunts K (2011) High-resolution fiber tract reconstruction in the human brain by means of three-dimensional polarized light imaging. Front. Neuroinform. 5:34. doi: 10.3389/fninf.2011.00034
Received: 18 March 2011; Accepted: 08 December 2011;
Published online: 30 December 2011.
Edited by:
Claus Hilgetag, Jacobs University Bremen, GermanyReviewed by:
Suzanne Haber, University of Rochester, USAMarc Tittgemeyer, Max-Planck-Institute for Neurological Research, Germany
Copyright: © 2011 Axer, Grässel, Kleiner, Dammers, Dickscheid, Reckfort, Hütz, Eiben, Pietrzyk, Zilles and Amunts. This is an open-access article distributed under the terms of the Creative Commons Attribution Non Commercial License, which permits non-commercial use, distribution, and reproduction in other forums, provided the original authors and source are credited.
*Correspondence: Markus Axer, Institute of Neuroscience and Medicine, INM-1, Research Centre Jülich, D-52425 Jülich, Germany. e-mail: m.axer@fz-juelich.de