LORIS: a web-based data management system for multi-center studies
- 1Montreal Neurological Institute, McGill University, Montreal, Canada
- 2Biospective, Montreal, QC, Canada
- 3Handprint Corporation, New York, NY, USA
- 449-Forty Nine, Centre for Economic Solutions, London, UK
Longitudinal Online Research and Imaging System (LORIS) is a modular and extensible web-based data management system that integrates all aspects of a multi-center study: from heterogeneous data acquisition (imaging, clinical, behavior, and genetics) to storage, processing, and ultimately dissemination. It provides a secure, user-friendly, and streamlined platform to automate the flow of clinical trials and complex multi-center studies. A subject-centric internal organization allows researchers to capture and subsequently extract all information, longitudinal or cross-sectional, from any subset of the study cohort. Extensive error-checking and quality control procedures, security, data management, data querying, and administrative functions provide LORIS with a triple capability (1) continuous project coordination and monitoring of data acquisition (2) data storage/cleaning/querying, (3) interface with arbitrary external data processing “pipelines.” LORIS is a complete solution that has been thoroughly tested through a full 10 year life cycle of a multi-center longitudinal project1 and is now supporting numerous international neurodevelopment and neurodegeneration research projects.
Introduction
One of the primary challenges in conducting large-scale, multi-center studies is to coherently gather, process, and disseminate data in a way that is not only optimized and complete, but also aligned with the workflow of the researchers conducting the study. The integration of data from different domains is a significant undertaking, and requires a proper infrastructure to acquire and disseminate data from multiple modalities. Several systems have been built in attempt to streamline and simplify data collection, nevertheless, creating a neuroimaging research framework that has the ability to store and link both scalar2 and imaging data remains a major challenge.
Longitudinal Online Research and Imaging System (LORIS) (http://cbrain.mcgill.ca/loris) is a modular and extensible data and project management system that is encapsulated by a structured model integrating heterogeneous data types and modalities from imaging data to cognitive and behavioral scalars, and genetic biomarkers. It features an intuitive design which follows the natural workflow of multi-center research studies and performs numerous quality control checks to ensure for data completeness and accuracy.
The system is accessible through a standard web browser, allowing users to perform a wide variety of tasks for data entry, quality control, data querying, and 3D image visualization. LORIS stores a wide range of behavioral, neurological, genomic, and imaging data, including anatomical and functional 3D/4D MRI models, atlases, and maps. Researchers are able to query, aggregate, retrieve, and distribute various forms of subject data to image processing pipelines and neurobehavioral statistical models frequently used in neuroimaging research studies. Its extensible design enables scaling and customization to meet the needs of rapidly growing research projects.
LORIS was originally developed for the NIH MRI Study of Normal Brain Development (Evans and Brain Development Cooperative Group, 2006), both for active study management and centralized archival/retrieval of multi-site data. Initially, LORIS was designed to address the following concerns (1) data transfer and confidentiality, (2) integration of behavior and imaging information, and (3) dissemination.
With rapid advances in neuroimaging technology, data acquisition and computer networks, the successful organization and management of data is of paramount importance (Poliakov et al., 2007; Hasson, 2008). As highlighted by Van Horn and Toga, (2009), numerous characteristics are innate to successful data archiving and exchange efforts:
- Unrestricted user access.
- Transparent data entry and querying.
- Assignment and assumption of formal responsibilities among the stake holders.
- Technical and semantic interoperability between database and other online resources.
- Quality control, data validation, authentication, and authorization.
- Demonstrated operational efficiency and flexibility.
- Respect for intellectual property and other ethical and legal requirements.
- Management accountability which includes approaches to funding.
- Solid technological architecture.
- Reliable user support.
As described below, the LORIS architecture satisfies all of the technical aspects in this list. Policy aspects that govern the deployment of the database within a project are user-defined and beyond the scope of this technical report. However, LORIS provides all of the functionality (audit trail, workflow management, data provenance, user forums, etc.) that mediate project management and policy implementation. As LORIS has evolved over the last 10 years, its capabilities have expanded in the areas of data acquisition, quality control, analysis, querying, and visualization. LORIS currently provides a comprehensive framework for multi-center data acquisition and is deployed in numerous neurodevelopment and neurodegeneration research projects internationally (see Results).
Materials and Methods
LORIS Overview
LORIS is a multi-tiered application, featuring three distinct stages of data flow: (1) an acquisition stage for data entry and data transfer, (2) an archiving stage with a web-accessible front end used for quality control and visualization, (3) a dissemination stage that enables data querying such that results can easily be submitted to processing pipelines for subsequent analysis (see Figure 1).
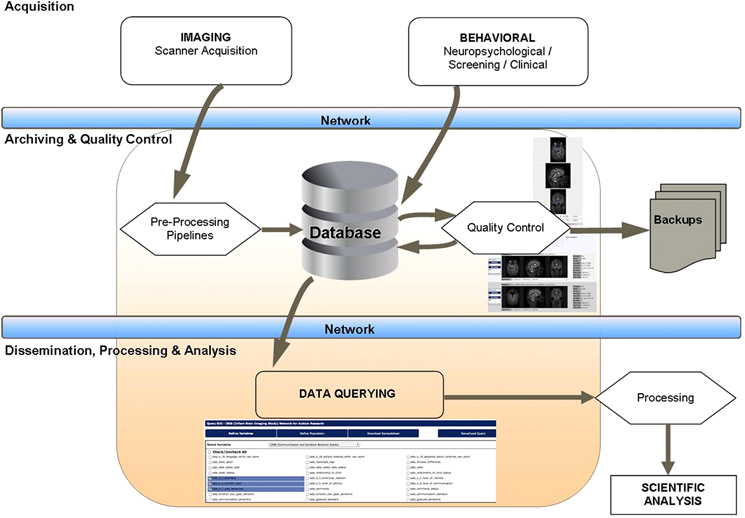
Figure 1. Data flow within the LORIS system.
While design details regarding the various layers of LORIS are outlined in the “System Architecture” section, the basic construct is developed around a structured data model called the “Subject Profile,” which is used to map the study-specific battery of instruments3 and methodologies, including an array of external metadata collected about the study subjects. Data is organized in a subject-centric manner (i.e., around a study subject on which data is collected) and offers all necessary identifying subject information to allow project managers to filter for status information without a need to enter and view individual profiles (see Figure 2). Demographic information is collected and a unique set of anonymized subject identifiers are assigned. These identifiers are designed to match the protocol requirements of the study (detailed in the “System Architecture” section).
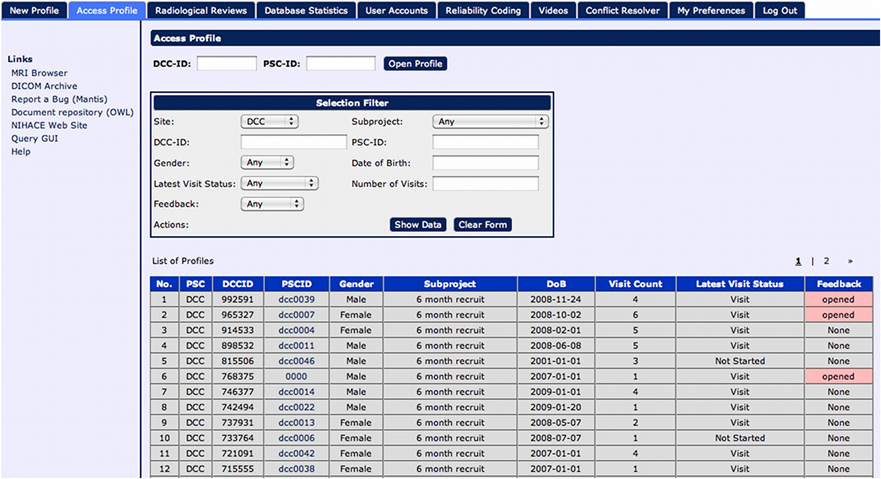
Figure 2. Subject listing window displays and filters all subjects within the study.
The creation of the Subject Profile contains “timepoints”—longitudinal extensions representing study iterations where a subject returns for multiple visits. Timepoints are used to collect the full array of instruments and other data collected during a subject's visit (see Figure 3). In case of multi-site studies, the timepoints are associated with a specific study site enabling the researchers to track individual subjects over time at different geographical locations.
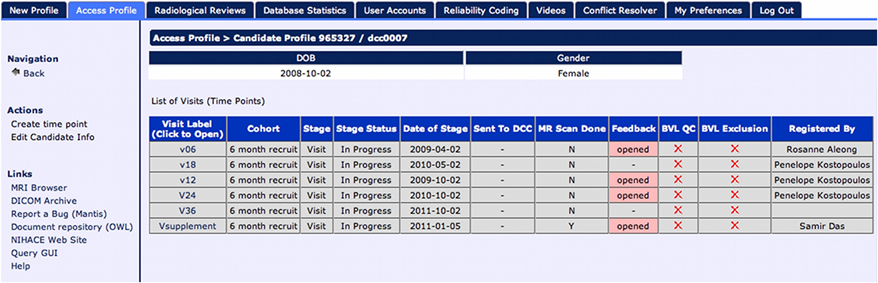
Figure 3. Timepoint listing for all longitudinal visits.
Researchers can access LORIS modules in a seamless and intuitive fashion using the following three sections of its front-end layer: (1) the Behavioral Database, (2) Imaging Browser, and (3) Data Querying GUI (DQG).
Behavioral Database
Data in LORIS is divided between scalar data such as behavioral, neuropsychological, or other medical data, and medical imaging data types such as MRI data. The non-imaging, scalar data is managed in a module referred to as the “behavioral database,” since many of these data are collected by behavioral test instruments. Researchers can access a full battery of instruments via timepoints by clicking on each individual timepoint link (see Figure 4).
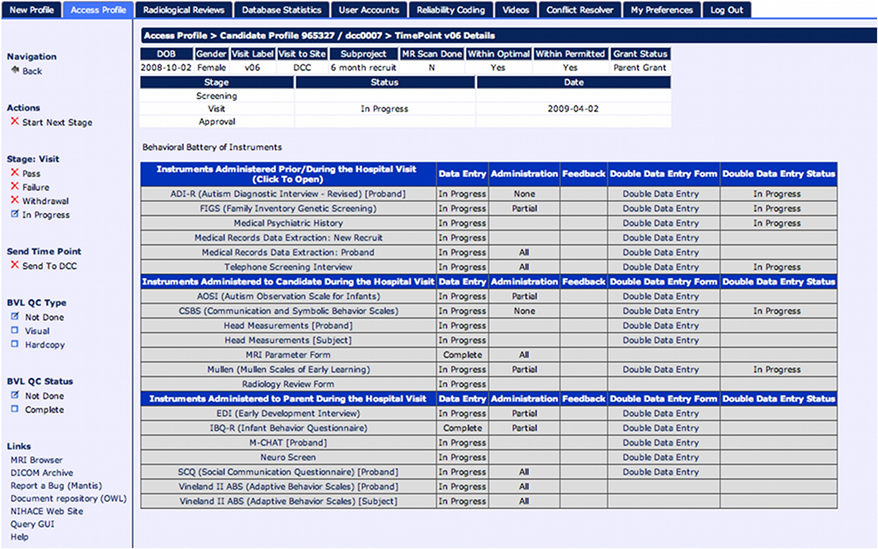
Figure 4. Test battery for each timepoint; clicking on a measure opens data entry forms.
This module contains all data entry, automated scoring, project management, and comprehensive quality control features. Scoring functions have been fully incorporated to remove the need for manual scoring and error-prone calculations. Instruments feature their own scoring algorithm based on original clinical tools, and the scores are graphed in scatter plots across or between subjects and/or instruments, using a Statistics module4. Instruments are automatically scored and re-scored by the system, while additional validation includes range checking and analysis of the scoring fields.
The behavioral database also enables researchers to easily monitor study progress, as the data entry personnel are required to set specific flags, such as Data Entry Completion Status, when the study data is entered. The Statistics module displays individual status and overall summary statistics for numerous project-specific metrics. The system also provides data completeness checks to aid in the project's workflow management, which allows study coordinators and investigators to ensure that data acquisition is proceeding on schedule.
Data Entry Quality Control
Measure-specific protocol verification and rule checking are applied to ensure that entered data conforms to predefined constraints. Highly visible and concrete information on the status of data entry activity, as well as a record of data entry corrections are displayed in the Feedback module. This module mediates and keeps a log of both resolved and unresolved data entry issues by allowing the user to flag and annotate problems encountered.
The Feedback module is fully integrated into LORIS' web GUI and is context sensitive. Raw data can be inspected at random by an authorized user to verify any given instrument, while systematic visual quality control can occur once data entry has been completed. Changes are tracked, including an array of flags and reviewer comments. Double data entry is an option, where a Conflict Resolver flags discrepancies between the two entries and requires intervention to resolve the conflict before a measure is considered validated. All discrepancies are recorded in the database and can be parsed to reveal problem areas.
LORIS also has a series of other tools to aid in the process of quality control. The reliability module provides scored agreement between two entries and can be used to ascertain reliability with the gold standard, or reliability between coders within a site or across sites, and in other collaborative projects. A certain percentage of entries can be flagged on an ongoing basis to ascertain reliability within the project and ensure the quality of the data collected.
Auxiliary modules have also been included to facilitate the reliability process. For example, the Video Uploader module allows the storage and dissemination of large video and audio files between researchers and clinicians necessary for cross-site reliability. Compared to mailing tapes or uploading files to external providers, the implementation of the Video Uploader within the LORIS database ensures the proper tagging, reliable storage, and dramatically decreases the transfer time and minimizes the expense of using express post.
Imaging Browser
LORIS seamlessly links stored medical images to the related clinical, behavioral, and genetic datasets within the Subject Profile. It also supplies this data to the processing pipelines for downstream analysis. Researchers can opt to use the Imaging Browser to display medical images (MRI scans, other scan modalities, processed outputs, atlases, etc.) that have been imported into the database along with all the required demographic and header information. The Imaging Browser utilizes Java Image Viewer (JIV, Cocosco and Evans, 2001), a java-based image viewer that renders cursor-driven triplanar views via the web, allowing users to browse through slices of a 3D image, zoom in and move the image, use tags, and change the intensity of the image (see Figure 5).
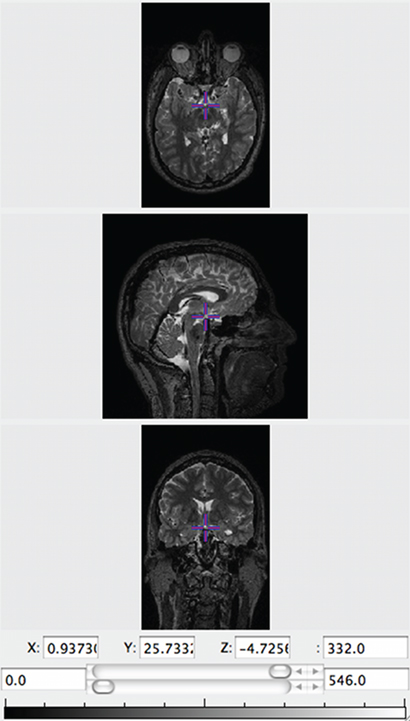
Figure 5. JIV (Java Image Viewer) enables 3D orthogonal viewing for quality control.
Imaging Quality Control
What distinguishes LORIS in terms of managing MRI data is not only the ability to link imaging data to the behavioral/clinical/genetic scalars, but also the wide array of quality control mechanisms that are built into the system (see Figure 6). Researchers can use the Imaging Browser to perform radiological reviews and independent visual quality control. In other studies, these functions are traditionally performed in a decentralized fashion (e.g., by distributing physical media) or by proprietary software (e.g., by a Clinical Research Organization).
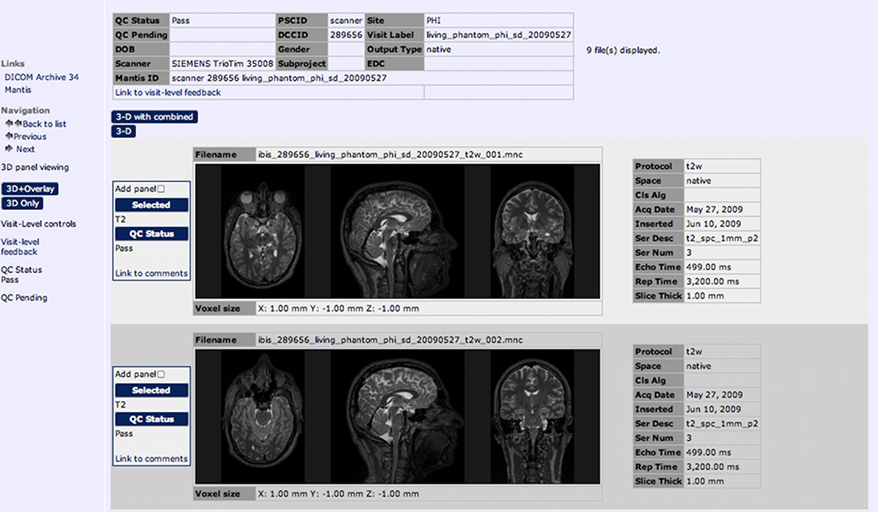
Figure 6. The Imaging Browser allows for tagging, filtering, and visualization of quality control results for each scan.
In LORIS, quality control results are stored directly into the database for data validation. For imaging data, this is of particular importance as these results can become significant to subsequent analyses. Querying this information alongside other data for analysis has proven to be particularly valuable as it helps researchers remove questionable data prior to analysis and better understand statistical outcomes in light of radiological and image quality reviews.
Built directly into the Imaging Browser is a system to validate incoming scans for independent visual inspection for raw and/or processed data. Comments and status flags are included for each modality as well as the entire acquisition, and these entries can be perused and downloaded by other researchers. Radiological review results can also be parsed and compared in the Radiological Review module, particularly in cases where multiple reviews are done. Inconsistencies are then flagged and displayed so that an independent final review can be performed. Connecting these tasks directly in LORIS, and having the ability to subsequently download this data from a single source significantly reduces the risk of errors and can serve as valuable co-variates in analysis.
The Data Querying GUI
Historically, researchers required a programmer or database administrator to query the database, and to produce and disseminate particular data output. This had potentially translated into days or weeks of delay for their investigations. LORIS assigns great priority to data dissemination and, therefore, enables researchers to directly query the database and easily retrieve data. The DQG allows researchers to design, execute, and save queries in a simple and intuitive manner (see Figure 7), without having to write complex SQL queries. The interface allows for selection of variables, and quick download in most commonly used formats, e.g., Excel, comma separated values (CSV), or HTML. In addition, users can save any query (both the variables and the population) and use it in the future with new or updated data, without worrying about ambiguities and inconsistencies. Datasets can also be tagged with a version number or a timestamp such that longitudinal comparisons can be made, minimizing any ambiguity about what has been downloaded.
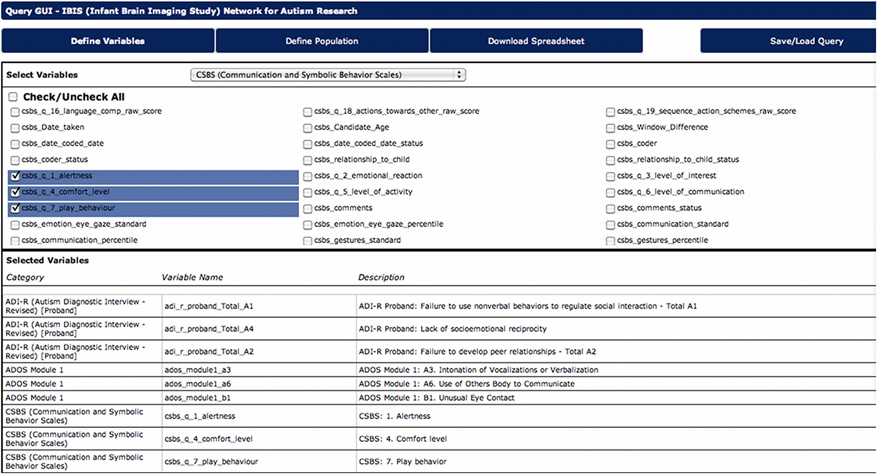
Figure 7. Data Query GUI allows users to choose desired variables, define populations, and download datasets.
Another feature of LORIS is the Data Dictionary Builder. Traditionally, the process of creating a data dictionary (e.g., variable descriptions) could take as long as several years to finalize, a process that can now be completed in a fraction of that time. LORIS provides a structured and organized framework preventing inevitable loss of time in handling large arrays of variables between groups of collaborators. To simplify the process, the Builder parses existing form data and table structures to create an initial instantiation. The Builder can then be re-run quickly and as frequently as needed, as it features a full revision history. Its repository also helps reduce errors and misclassifications that often arise with a large number of variables. Once the ratification process has been completed, all changes are saved in the database, including field descriptions and data types. This ensures that any subsequent changes to the data dictionary are stored, facilitating the tracking of changes, as well as providing a solid audit trail. Finally, all of the variable descriptions are also stored in the database tables and are made available as part of the DQG functionality, a feature that can greatly facilitate data sharing and field mapping for collaborations.
System Architecture
From a system architecture point of view, LORIS can be viewed as having three component layers: an infrastructure layer, a processing layer, and a web application layer (Figure 8). Data entry, transfer, image pre-processing, visualization, and quality control are all aspects that take place within these layers, with the ultimate goal of serving data via the Data Querying GUI to facilitate processing and analysis.
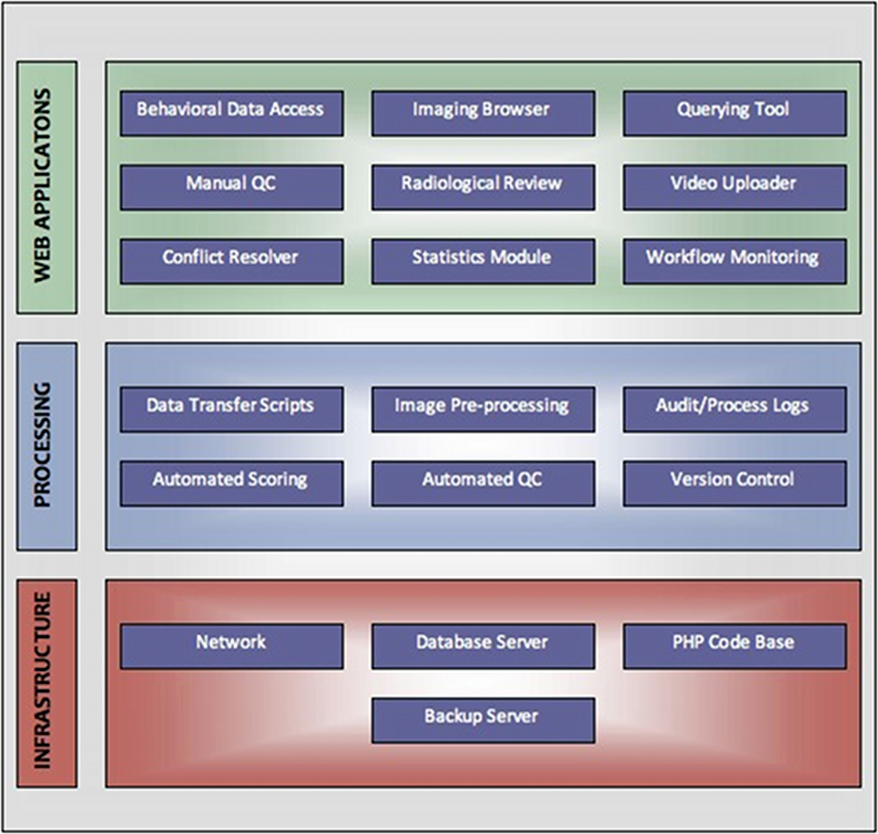
Figure 8. System architecture layers.
The infrastructure layer consists of an open source Linux/Apache/MYSQL/PHP (LAMP) framework, which employs a relational database management system (RDBMS), where data is stored in subject-centric manner and is accessible via the web. Instruments are stored as individual tables in the RDBMS and are linked to the core timepoint tables based on a primary key that is composed of the anonymized unique identifiers and timepoint label. In addition, included in LORIS are hierarchical arrays of records that allow siblings and other family members to be traced.
LORIS is a scalable system that can handle significant amounts of diverse data. Multi-center imaging studies require the ability to store large imaging datasets, consisting of several terabytes of raw and processed data, as well as comprehensive behavioral measures that can total thousands of variables. Any size limitations for LORIS are dependent on the database constraints and/or hardware capacities of the file server. For MySQL5, size limitations vary depending on the storage engine and file system (e.g., 32 vs. 64 bit machines). For past implementations of this system, roughly 4 million candidates could be registered, containing more than half a million behavioral/clinical forms. However, by upgrading to an InnoDB storage engine for example, even larger datasets can be stored, where table sizes of 64 terabytes are supported5. Given that LORIS typically stores large files as pointers to a file server, as opposed to large data types (BLOBs in MySQL terminology), these limits would be nearly impossible to reach in multi-center research studies. For more information regarding specific implementations of LORIS, please see the Results section.
This system was designed as an extensible platform specifically to handle the changing demands of a longitudinal, multi-center study. As such, enhanced functionality has continuously been introduced over the last 10 years as new projects have been added (e.g., Statistics module, Reliability module, and Radiological Review module). LORIS is composed of a structured core encapsulated by an extensible data model that can be customized to map onto the workflow and data requirements of any study. The core defines the structure of the Subject Profile, while the extensible model is used to code project-specific instruments and map behavioral and demographics metadata onto the subject's profile.
The LORIS processing layer is indexed to provide optimized views such that queries are executed as quickly as possible. While on the front end, menus have been created to allow for spry filtering, both of the data itself as well as the top-level view of status information, which allows project manager to filter for status information of any dataset without the need to enter and view individual profile data.
To ensure protocol conformity, the identifier structure is forced to match the study protocol, such that site, cohort, and other information can be stored directly in the identifier. The default implementation uses a binary format, comprised of a randomized numeric study identifier and a site-specific alpha-numeric identifier (either sequential or randomized as required). While redundant identifiers substantially reduce the risk of mismatches, LORIS is not limited to two identifiers, additional identifiers can be attached to further reduce the risk of mismatch at the expense of a more cumbersome subject identification process. Subjects can also be tagged with multiple external identifiers, such that researchers can manually perform cross-site linking. For timepoint labels, an alpha-numerical key serves as a central reference point when grouping data. This has the dual purpose of listing simplified timepoint labels on the front end, while using the label itself to create intuitive primary keys for the MYSQL tables on the database back end.
LORIS has two primary methods of access. A web application layer performs high level processing and provides a web-based user interface, where users can log in over a secure protocol (SSL) to manipulate or view data. On the back end, developers can create command line tools that operate on data structures in the database using the same Application Programming Interface (API) used for the front end applications. The battery of instruments including any related scoring functions are coded on the back end by programmers using standardized PHP libraries called PEAR6. Specifically, PEAR libraries such as Quick Forms, allow for the quick and uniform creation of data entry forms, which includes significant range checking functionality. Depending on the complexity of an instrument, coding time (including validation) typically takes a few days to complete.
To ensure full access control, LORIS is equipped with a User Accounts module in the web application layer, where each user is given an account, which is in turn linked to an array of permissions. System administrators can perform all user creation, configuration, and permission management functions directly through the web interface, without having to access the MySQL back end directly. Depending on the study, different permissions are created to allow for viewing or editing of specific sections within the database.
On the imaging side, LORIS can handle different modalities and incorporates the images for visualization within the Imaging Browser. The system is designed to automatically capture incoming imaging data using the DICOM toolkit7. A DICOM listener is configured to import incoming scans. Data is then transferred through a pre-processing pipeline that performs any necessary anonymization and archives the DICOM data within the system. The DICOM Archive module allows for web viewing of the DICOM images and metadata (summaries of the header information). Once archiving and backup is completed, data is converted to a 3D volume, in MINC8 format and imported into the Imaging Browser. Automated quality control scripts are run on the image maps to ensure image integrity and header accuracy. Data is then checked against the MRI parameter forms (a form that each site enters directly into the database that includes the scanner technician's comments, and delineates the range of modalities collected) to ensure that all data is properly tracked. Any incongruities are reported in the Statistics module.
Results
LORIS Deployments
Initially developed to manage data for the NIH MRI Study of Normal Brain Development (Evans and Brain Development Cooperative Group, 2006, www.bic.mni.mcgill.ca/nihpd/info), LORIS has since been adapted and implemented in numerous decentralized large-scale studies internationally, including:
- IBIS (www.ibis-network.org)—Autism US
- NeuroDevNet (www.neurodevnet.ca)—Child brain development, Canada
- GUSTO (www.gusto.sg)—birth cohort, Singapore
- MAVAN (Maternal Adversity, Vulnerability, and Neurodevelopment)—mother/child cohort, Canada
- AddNeuroMed (www.innomed-addneuromed.com)—Alzheimer's Disease (AD), Europe
- NeuGrid (www.neugrid.eu)—grid-computing network, applications in AD, Europe
- CBRAIN (www.cbrain.mcgill.ca)—grid-computing applications network, Canada
- India Dementia Network—grid-computing, AD, India
- CITA (www.cita-alzheimer.org)—AD, Spain
The NIH MRI Study of Normal Brain Development (Evans and Brain Development Cooperative Group, 2006) resulted in a publicly released dataset consisting of longitudinal data for approximately 500 subjects. Each subject returned for at least three visits, consisting of an MRI scan with multiple modalities acquired (i.e., anatomical scans, DTI, spectroscopy) and clinical/behavioral/psychological testing comprising numerous assessments. For this project, LORIS stored more than 8000 distinct variables and about 37,000 individual assessments. On the MRI side, LORIS housed and distributed ∼3 TB of native and processed data for over 2000 MRI acquisitions.
The IBIS project for autism research, which is another implementation of LORIS, is mandated to collect both imaging and behavioral/clinical data for a longitudinal cohort of more than 500 subjects consisting of multiple timepoints. This translates to more than 6000 variables, and greater than 60,000 individual assessments. As this is an ongoing project, the database continues to collect data, and currently houses more than 1100 scans consisting of ∼1 TB of imaging data.
While it is impractical to discuss each project individually, it is evident that the needs of different projects will differ considerably and the LORIS architecture has to be flexible. For example, the GUSTO birth cohort study based in Singapore is mandated to collect data for hundreds of behavioral and clinical measures conducted on thousands of subjects, and currently totals more than 14,000 variables, with over 178,000 individual assessments entered into the database. Imaging data for this study is also collected at numerous timepoints for both head and chest MRI scans. Overall, LORIS currently provides a framework that houses data for more than 5000 unique subject profiles, with data collected for over 30,000 variables spanning more than 400 instruments. This translates into data acquisition for more than 350,000 assessments and upwards of 5000 imaging scans (each with multiple modalities).
Discussion
LORIS in Comparison
In larger studies, a myriad of issues can arise once an image has been acquired or a behavioral test has been administered. While it may be relatively simple to compile data for a small number of subjects when only a few variables are collected, the complexities of a multi-center study can quickly become overwhelming given the numerous longitudinal timepoints, containing thousands of variables, as well as numerous imaging modalities.
Given that LORIS was developed during the life cycle of a diversified longitudinal project, quick response time was necessary to mirror the evolving needs of data collections sites, which in turn demanded a flexible database management system. This experience yielded a unique perspective that allowed the database architects to closely follow the work patterns and problems from the end user's perspective. As a result, a multitude of quality control checks were incorporated, with results stored as queryable fields. Being able to efficiently track workflow and to easily perform quality control were critical features that greatly improved the quality of a data collected in such research trials.
In addition to being able to acquire data, LORIS was also concerned with data dissemination. Being able to easily link various data types and download data directly from a web browser was an important feature, resulting in our Data Querying GUI. LORIS was also designed to seamlessly integrate neuroimaging pipelines for future analysis. As such, LORIS recognizes and mandates a maintained modularity from image processing pipelines, such that any pipelines can be run separately to allow complete generality of downstream analysis options.
There are numerous products that are capable of storing, processing, and even managing data collection, either on the behavioral side or the imaging side, but few systems were designed to tackle the full spectrum of data types. Many have been designed to facilitate these efforts, but most were only produced with specific subset of goals in mind. For example, products such as REDCap (Harris et al., 2009) or Deduce (Horvath et al., 2010) are web-based applications that provide an interface for inputting and modifying data, but do not focus on reporting and feedback functionalities. In addition, these programs are limited to behavioral and clinical data collection, and do not have capabilities for imaging modalities. More comprehensive imaging databases, such as HID (Ozyurt et al., 2010) or DFBIdb (Adamson and Wood, 2010) are also available. However, while these platforms can store and manage large and diverse data collections, neither tool focuses on data management, specifically on the behavioral side.
Other systems specialize in data dissemination or processing, such as the LONI image data archive (Van Horn and Toga, 2009) at UCLA or the NIH-funded National Database for Autism Research (NDAR—http://ndar.nih.gov). The LONI image data archive focuses on distributing imaging data, which can then be processed by the LONI Pipeline processing environment, whereas NDAR's current role is as an aggregator of clinical/behavioral data for research on Autism. However, none of these systems were designed specifically to support data acquisition.
Although LORIS has been in continuous use since 2001, similar platforms have emerged in recent years to tackle the challenge of handling a wide array of data types. The MIND network (Bockholt et al., 2009) has very similar functionality to LORIS, however, minor differences exist in the nature of their workflow and interface. NeuroLOG (Dojat et al., 2011) has a federated architecture for the integration of neuroimaging data as well as distributed tools and pipelines from multiple research sites. It differs from LORIS in that it is not web-accessible (a client must be downloaded) and it does not contain a robust quality control framework. XNAT (Marcus et al., 2006, 2007) is another similar databasing system, however, it has a slightly different scope, as it is more concerned with the progression of MRI data through a release pipeline with manual verification of data along the way. LORIS is structured around integrating both the behavioral and MRI domains in a way that can also integrate longitudinal analysis. XNAT tends to focus on data once it has been certified, while LORIS provides acquisition monitoring and in-browser quality control for both imaging and behavioral data. Data entry can occur directly in the database. In addition, all quality control results are stored in the database and can be downloaded as a covariate.
Future Direction
Given that LORIS is an ongoing project with active development, new modules are constantly being added and functionality continues to be optimized and improved. A recent feature is a new 3D image viewer, Brain Browser9 that takes advantage of WebGL libraries and HTML5 which enable the generation of interactive 3D graphics within a web browser.
Integration between LORIS and the CBRAIN10 high-performance computing grid is a recent development, as researchers seek uncomplicated web-based solutions for compute-intensive image processing. CBRAIN, a portal to the Canadian national supercomputing grid of ∼50,000 cores, is a web-enabled platform for distributed processing, analysis, exchange, and visualization of brain imaging data. Commonly used pipelines and tools11, e.g., SPM (modified to operate in batch mode) (Friston et al., 1995), MINC tools, FSL (Woolrich et al., 2009) are implemented in the CBRAIN platform for community use.
Finally, as popularity of tools such as Redcap (Harris et al., 2009) increase, the need for more end-user customization is becoming apparent. Currently, database forms are easily coded by developers using standard libraries to facilitate form building. This is not a complicated process however, it is becoming obvious that user-enabled form builders would further facilitate the process of setting up the behavioral database. This would save valuable programming time and resources, and would give more flexibility and control to the users of the system to validate the behavioral measures.
Obtaining LORIS
LORIS is an open source product and is obtained by contacting us at info-loris.mni@mcgill.ca. Source code will be made available in early 2012 on the NITRC site at www.nitrc.org/projects/loris/.
Conclusion
LORIS is a database repository and data acquisition monitoring system that has been thoroughly tested through the full life cycle of numerous multi-center longitudinal projects. The main strength of LORIS is the ability to integrate all data types and modalities from imaging data to cognitive and behavioral metrics, and genetic biomarkers, which can then be disseminated in a user friendly and robust fashion. Enhanced quality control mechanisms and work-flow paradigms produce cleaner datasets with fewer errors, while advanced data mining techniques greatly facilitate research discoveries. The LORIS database is one of the most comprehensive and user-friendly systems for clinical studies. For more information about LORIS, please visit: www.cbrain.mcgill.ca/loris.
Conflict of Interest Statement
The authors declare that the research was conducted in the absence of any commercial or financial relationships that could be construed as a potential conflict of interest.
Acknowledgments
This work has been funded in whole or in part with Federal funds from the National Institute of Child Health and Human Development, the National Institute of Drug Abuse, the National Institute of Mental Health, and the National Institute of Neurological Disorders and Stroke (Contract #s N01-HD02-3343, N01-MH9-0002, and N01-NS-9- 2314, -2315, -2316, -2317, -2319 and -2320). In addition to the authors, several developers dedicated significant time to LORIS: Matt Charlet, Andrew Cordery, David Brownlee, Sebastian Muehlboeck, Zia Mohaddes, David MacFarlane, Tarek Sherif, Johnny Wong, Mia Petkova, Christine Rogers, Denise Milovan, Rozie Arnaoutelis, and Penelope Kostopoulos. Collaborations with National Institutes of Health Pediatric Database (NIHPD), IBIS Network, US Autism Center of Excellence, MAVAN—Maternal Adversity, Vulnerability, and Neurodevelopment, GUSTO birth cohort study, Singapore, OutGrid, European Alzheimer's Network, NeuroDevNet NCE on Developmental Disorders, Alzheimer's Disease Neuroimaging Initiative (ADNI), Pfizer Inc., StoP-AD, McGill AD network, Indian Dementia Network and National Brain Research Centre.
Footnotes
- ^NIH MRI Study of Normal Brain Development (Evans and Brain Development Cooperative Group, 2006).
- ^“Scalar” or “behavioral” data are general terms that refer to non-imaging data, typically represented as scalar or text fields.
- ^This is a general term that refers to the full list of screening questionnaires, psychological assessments, clinical forms, and demographic information.
- ^This module provides reports and data acquisition summary statistics.
- ^See MYSQL website for more information: http://dev.mysql.com/doc/refman/5.0/en/table-size-limit.html
- ^http://pear.php.net/
- ^http://dicom.offis.de/dcmtk
- ^see http://www.bic.mni.mcgill.ca/ServicesSoftware/MINC for more information about MINC.
- ^see https://brainbrowser.cbrain.mcgill.ca for more information about Brain Browser.
- ^see http://cbrain.mcgill.ca/ for more information about CBRAIN.
- ^see http://www.bic.mni.mcgill.ca/ServicesSoftware/MINC for more information about MINC.
References
Adamson, C. L. and Wood, A. G. (2010). DFBIdb: a software package for neuroimaging data management. Neuroinformatics 8, 273–284.
Bockholt, H. J., Scully, M., Courtney, W., Rachakonda, S., Scott, A., Caprihan, A., Fries, J., Kalyanam, R., Segall, J. M., Garza, R., Lane, S. and Calhoun, V. D. (2009). Mining the mind research network: a novel framework for exploring large scale, heterogeneous translational neuroscience research data sources. Front. Neuroinform. 3, 36. doi: 10.3389/neuro.11.036.2009
Cocosco, C. A. and Evans, A. C. (2001). “Java internet viewer: a WWW tool for remote 3D medical image data visualization and comparison,” in Proceedings of the 4th International Conference on Medical Image Computing and Computer-Assisted Intervention (MICCAI 2001) held in Utrecht, eds Wiro J. Niessen and Max A. Viergever, (The Netherlands), October 14–17, 1415–1416.
Dojat, M., Pélégrini-Issac, M., Ahmad, F., Barillot, C., Batrancourt, B., Gaignard, A., Gibaud, B., Girard, P., Godard, D., Kassel, G., Lingrand, D., Malandain, G., Michel, F., Montagnat, J., Pennec, X., Rojas Balderrama, J. and Wali, B. (2011). “NeuroLOG: a framework for the sharing and reuse of distributed tools and data in neuroimaging,” Proceedings of the 17th Annual Meeting of the Organization for Human Brain Mapping held in Québec, Canada, June 26–30.
Evans, A. C. and Brain Development Cooperative Group. (2006). The NIH MRI study of normal brain development. Neuroimage 30, 184–202.
Friston, K. J., Holmes, A. P., Worsley, K. J., Poline, J.-B., Frith, C. D. and Frackowiak, R. S.J. (1995). Statistical parametric maps in functional imaging: a general linear approach. Hum. Brain Mapp. 2, 189–210.
Harris, P. A., Taylor, R., Thielke, R., Payne, J., Gonzalez, N. and Conde, J. G. (2009). Research electronic data capture (REDCap) – A metadata-driven methodology and workflow process for providing translational research informatics support. J. Biomed. Inform. 42, 377–381.
Hasson, U., Jeremy, J., Wilde, M., Nusbaum, H. and Small, S. (2008). Improving the analysis, storage and sharing of neuroimaging data using relational databases and distributed computing. Neuroimage 39, 693–706.
Horvath, M. M., Winfield, S., Evans, S., Slopek, S., Shang, H. and Ferranti, J. (2010). The DEDUCE guided query tool: providing simplified access to clinical data for research and quality improvement. J. Biomed. Inform. 44, 266–276.
Marcus, D. S., Olsen, T., Ramaratnam, M. and Buckner, R. L. (2006). “XNAT: a software framework for managing neuroimaging laboratory data,” Proceedings of the 12th Annual Meeting of the Organization for Human Brain Mapping Held in Florence, ed M. Corbetta, (Italy), June 11–15.
Marcus, D. S., Olsen, T. R., Ramaratnam, M. and Buckner, R. L. (2007). The extensible neuroimaging archive toolkit: an informatics platform for managing, exploring, and sharing neuroimaging data. Neuroinformatics 5, 11–34.
Ozyurt, I. B., Keator, D. B., Wei, D., Fennema-Notestine, C., Pease, K. R., Bockholt, J. and Grethe, J. S. (2010). Federated web-accessible clinical data management within an extensible neuroimaging database. Neuroinformatics 8, 231–249.
Poliakov, A. V., Hertzenberg, X., Moore, E. B., Corina, D. P., Ojemann, G. A. and Brinkley, J. F. (2007). Unobtrusive integration of data management with fMRI analysis. Neuroinformatics 5, 3–10.
Van Horn, J. D. and Toga, A. W. (2009). Is it time to re-prioritize neuroimaging databases and digital repositories? Neuroimage 47, 1720–1734.
Keywords: database, neuroimaging, longitudinal, multi-center, MRI, data querying, imaging data, behavioral data
Citation: Das S, Zijdenbos AP, Harlap J, Vins D and Evans AC (2012) LORIS: a web-based data management system for multi-center studies. Front. Neuroinform. 5:37. doi: 10.3389/fninf.2011.00037
Received: 15 September 2011; Accepted: 21 December 2011;
Published online: 20 January 2012.
Edited by:
John Van Horn, University of California at Los Angeles, USAReviewed by:
David N. Kennedy, University of Massachusetts Medical School, USAJessica A. Turner, Mind Research Network, Albuquerque, USA
Copyright: © 2012 Das, Zijdenbos, Harlap, Vins and Evans. This is an open-access article distributed under the terms of the Creative Commons Attribution Non Commercial License, which permits non-commercial use, distribution, and reproduction in other forums, provided the original authors and source are credited.
*Correspondence: Samir Das, Montreal Neurological Institute, McGill University, 3801 University Street, Webster 2B, #208, Montreal, QC, Canada. e-mail: samir@bic.mni.mcgill.ca