
- 1 Superior Institute of Maia, Maia, Portugal
- 2 Socius – Research Centre in Economic and Organizational Sociology, Lisbon, Portugal
- 3 Faculty of Medicine, Department of Experimental Biology, University of Porto, Porto, Portugal
- 4 Instituto de Biologia Molecular e Celular, Porto, Portugal
- 5 Department of Imaging, Centro Hospitalar de Vila Nova de Gaia e Espinho, Vila Nova de Gaia, Portugal
- 6 Magnetic Resonance Imaging Unit, Department of Radiology, São João Hospital, Porto, Portugal
- 7 Department of Management, University of Glasgow, Glasgow, Scotland
The ventromedial prefrontal cortex (vmPFC) is believed to be important in everyday preference judgments, processing emotions during decision-making. However, there is still controversy in the literature regarding the participation of the vmPFC. To further elucidate the contribution of the vmPFC in brand preference, we designed a functional magnetic resonance imaging (fMRI) study where 18 subjects assessed positive, indifferent, and fictitious brands. Also, both the period during and after the decision process were analyzed, hoping to unravel temporally the role of the vmPFC, using modeled and model-free fMRI analysis. Considering together the period before and after decision-making, there was activation of the vmPFC when comparing positive with indifferent or fictitious brands. However, when the decision-making period was separated from the moment after the response, and especially for positive brands, the vmPFC was more active after the choice than during the decision process itself, challenging some of the existing literature. The results of the present study support the notion that the vmPFC may be unimportant in the decision stage of brand preference, questioning theories that postulate that the vmPFC is in the origin of such a choice. Further studies are needed to investigate in detail why the vmPFC seems to be involved in brand preference only after the decision process.
Introduction
In the last few years several articles were published involving a new approach to the study of brands using neuroscientific techniques. One of these first studies used photographs of soft drinks where brands figured explicitly, inducing preference judgments (Paulus and Frank, 2003). These authors hypothesized that a specific area in the prefrontal cortex, the ventromedial prefrontal cortex (vmPFC), was critical for everyday preference judgments. In fact, they found important activations in this brain region when participants selected preferred soft drinks in contrast with a visual discrimination task of the same stimuli (liquids contained in bottles or glasses). Also investigating brands, Deppe et al. (2005), largely based on the work of Damásio, Bechara, and co-workers (Damásio, 1994; Bechara et al., 1997, 1999; Bechara and Damásio, 2005), proposed a dichotomic theory in economic decision-making, “(…) one chain involving emotional experience (…) and another one based on reasoning strategies” (p. 180). Deppe et al. (2005) propose the vmPFC to be central in the processing of emotions during decision-making, whereas brain regions associated with working memory could sustain reasoning.
Koenigs and Tranel (2008) recruited patients with a specific damage of the vmPFC to select soft drinks in two conditions: blinded or brand-cued. While healthy controls and patients with damage in other brain areas changed their soda preference from the blinded drinks to the brand-cued ones, patients with a lesion in the vmPFC persisted in their original choice, ignoring brand information, showing that the vmPFC is also necessary in the integration of information in the decision-making process.
In addition the vmPFC was found to be important in signaling risk probabilities (Tom et al., 2007; Rangel et al., 2008). Fellows and Farah (2007) again working with patients with vmPFC impairment, suggested that this brain region is necessary for all sorts of choice tasks, either uncertain (including risky or ambiguous situations), or certain.
However, there is still controversy in the literature regarding the function of the vmPFC in decision-making in general, and in brand preference in particular. For example, Schaefer and Rotte (2007) did not report activations in this brain region when sport and luxury car brands (rewarding stimuli) were compared with rational choices of car brands. In another study, using fNIRS to compare luxury and common handbags assessed individually, Lin et al. (2010) suggest that the cognitive subprocesses that underlie the assessment of branded handbags were only important after the choice was made.
To further elucidate the contribution of the vmPFC in brand preference, we designed a functional magnetic resonance imaging (fMRI) study where subjects assessed positive, indifferent and fictitious brands, testing the participation of the vmPFC in the processing of these different hedonic categories of brands. Moreover, both the period during and after the decision process were analyzed, hoping to unravel temporally the role of the vmPFC.
The designation vmPFC is ambiguous in the literature. The present study relies on the probabilistic atlases Harvard-Oxford Cortical Structural Atlas and Harvard-Oxford Subcortical Structural Atlas provided by the Harvard Centre for Morphometric Analysis1. We have considered the vmPFC to include the ventral medial frontal pole, frontal medial cortex, ventral paracingulate gyrus, ventral anterior cingulate gyrus, and subcallosal cortex, limited dorsally by the plane z = +10, and laterally by the planes x = ±20 (MNI152 coordinates).
Materials and Methods
General Structure
To explore the research question, an event-related fMRI experiment was designed. There were four different stimuli categories, plus the interstimuli interval. Each category was composed by 35 slides (6 s each). The interstimuli interval ranged from 4 until 9 s, in 0.5 s steps. The experiment duration was 1200 s, plus 9 s added in the end to ensure that all of the hemodynamic response was included. The sequence was optimized with Optseq2 software (Athinoula A. Martinos Center for Biomedical Imaging, USA)2.
Three of the four stimuli were brands’ logos grouped in the following categories: positive, indifferent, and fictitious brands. The fourth stimulus was non-emotional words. During the interstimuli interval participants fixated a cross.
Brand Selection
In order to select the logos for the positive and indifferent brand categories, participants completed an electronic survey in which were shown 200 brand logos, that they had to rate using the pleasure and arousal dimensions of the PAD – pleasure, arousal, dominance scale (Russell and Mehrabian, 1977; Mehrabian and De Wetter, 1987; Mehrabian, 1995), and the SAM – self assessment manikin, explained in detail elsewhere (Morris, 1995; Bradley and Lang, 2007). Self-reporting emotions is a complex task for most individuals, mainly due to the difficulty in verbalizing such inner states (Chamberlain and Broderick, 2007). SAM is a non-verbal pictorial assessment technique designed to represent each dimension of the PAD scale associated with a person’s affective reaction to a certain stimuli. Dominance was not included in the brand assessment because with static pictures this dimension correlates with pleasure (Bradley and Lang, 2007).
After this task, the responses were screened and categorized according to the following criteria: positive brands if the score was ≥7 in the pleasure dimension, and ≥5 in the arousal dimension; indifferent brands if the score was ≥4 and ≤6 in the pleasure dimension, and ≤5 in the arousal dimension. With this procedure 35 positive and 35 indifferent brands were chosen for each participant, and were randomized to enter the fMRI paradigm.
Fictitious Logos
The fictitious brands were brands’ logos that did not exist in the market. Each logo was designed by a marketer made to resemble a real one, making it plausible for the consumer. The fictitious brands did not represent a particular type of product. Instead, logos with assorted shapes, colors, and fonts suggesting different products and services were used (examples in Figure 1)

Figure 1. Examples of some of the logos used as fictitious stimuli.
Non-Emotional Words
The fourth stimulus (a second baseline) was non-emotional words: determiners, conjunctions, prepositions, or adverbs. Importantly, nouns or verbs that could evoke emotions, objects, or actions were not used. With this stimulus we hoped to avoid meditation during the fMRI task (Gusnard and Raichle, 2001; Beckmann and Smith, 2005; De Luca et al., 2006), that could cloud possible self-reflexive processes elicited by brands (Yoon et al., 2006).
Structuring the Paradigm
The structure of the paradigm was the same for all participants. The paradigm sequences were programmed with SuperLab 4.0 software (version 4.0.6b; Cedrus Corporation, USA)3.
Instructions for the Scanning Session
Depending on the type of stimulus visualized, the participants were instructed to either rate hedonically the brand (as positive, negative, indifferent, or unknown), to read covertly non-emotional words, or just to fixate a cross. Participants made their choices using a button box (model Lumina LU400-PAIR; Cedrus Corporation, USA)4.
Human Subjects
The participants were 18, 7 healthy male and 11 healthy female volunteers, right handed, with neither history of neurological nor psychiatric disturbances (mean age 28.2 ± 6.9 years, 19–41 years). Informed consent was obtained in all cases. A safety form for magnetic resonance imaging was filled by every participant. After each session the participants were debriefed. This research project was performed according to the Declaration of Helsinki and was approved by the local Ethics Committee.
Data Acquisition
Functional images with axial orientation were obtained using a T2*-weighted EPI sequence in a Siemens® Magnetom Trio high field (3 T) MRI scanner (Siemens AG, Germany; TR = 3000 ms, TE = 30 ms, 64 × 64 matrix, FOV = 192 mm, 3.0 mm axial slices). The order of acquisition of the slices was interleaved, and they covered the whole brain. The study consisted in one session where 407 volumes were acquired. The first four volumes were discarded to ensure pulses stabilization.
A whole brain anatomical structural scan was acquired also for each volunteer, using a T1-weighted MPRAGE protocol (256 × 256 matrix, FOV = 256 mm, 3.0 mm axial slices), for co-registration purposes. Gradient field mapping was additionally acquired for image quality control.
Image Analysis
Functional magnetic resonance imaging data processing was carried out using FEAT (FMRI Expert Analysis Tool) version 5.98, a model-based GLM (general linear model) analysis tool, and also using probabilistic independent component analysis (PICA; Beckmann and Smith, 2004) as implemented in MELODIC (Multivariate Exploratory Linear Decomposition into Independent Components) version 3.09, a model-free analysis tool, both part of FSL – FMRIB’s Software Library5 (Smith et al., 2004; Woolrich et al., 2009).
General linear model analysis – common procedures
In the FEAT analysis, the following pre-statistics processing was applied: motion correction using MCFLIRT (Jenkinson et al., 2002); slice-timing correction using Fourier-space time-series phase-shifting; non-brain removal using BET (Smith, 2002); spatial smoothing using a Gaussian kernel of FWHM 5 mm; grand-mean intensity normalization of the entire 4D dataset by a single multiplicative factor; high pass temporal filtering (Gaussian-weighted least-squares straight line fitting, with sigma = 30.0 s). Stimuli were convolved with a gamma function with canonical values (phase 0 s, SD 3 s, and mean lag 6 s). To account for variations, temporal derivatives were added for every explanatory variable (EV), in order to achieve a better fit between the signal and the stimuli convolved hemodynamic responses. Time-series statistical analysis was performed using FILM with local autocorrelation correction (Woolrich et al., 2001). Registration to high-resolution structural and/or standard space images was done using FLIRT (Jenkinson and Smith, 2001; Jenkinson et al., 2002).
At the individual level two different strategies of analysis were used for comparison. The first strategy was a traditional approach where the hemodynamic response was investigated during the complete time window of the stimulus (6 s). In the second approach the stimulus duration was divided in two: the period before the response (decision-making), and the period after the response (passive period; see Figure 2).
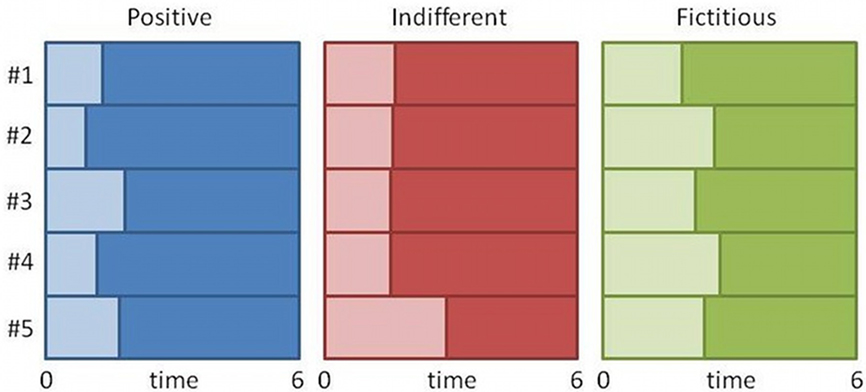
Figure 2. Splitting the duration of the stimulus for one subject. The figure represents the splitting of the first five stimuli of each category (positive, indifferent, and fictitious logos). Lighter areas represent the period until the response (during decision), and darker areas represent the period after the response (passive visualization of the stimulus).
General linear model analysis – conventional stimulus analysis
Before the scanning session, participants assessed a set of 200 brand logos, from which the positive and indifferent stimuli were extracted. Then, during the scanning, participants rated again the brands. In the first model, in which the whole of the stimulus duration was considered, 13 EVs were included: the three types of stimulus (positive, indifferent, and fictitious logos) times the four possible ratings (positive, indifferent, negative, and unknown), and the non-emotional words.
Most of the assessments were consistent between the two study sessions, before and during the scanning (see Brand Selection), but some of the possible combinations received little or even no ratings. Although all the possibilities were modeled with EVs aiming to explain most of the variance, only those that were consistent between sessions, i.e., positive brands that were rated as positive during the scanning session (PosPos), indifferent brands that were rated as indifferent (IndInd), or fictitious logos that were rated as unknown inside the scanner (NoBUnk) were considered in the analysis. Hence, at the individual level analysis, stimuli, and baseline were compared, resulting in the following contrasts: positive > indifferent, positive > unrecognized logos, and indifferent > unrecognized logos.
General linear model analysis – stimulus detailed analysis
In the second model, 25 EVs were considered: the three types of stimulus (positive, indifferent, and fictitious logos), times the four possible ratings (positive, indifferent, negative, and unknown), times the two epochs (before and after button pressing), and the non-emotional words.
At the individual level and as before, stimuli and baseline were subtracted, resulting in the following six contrasts (ar: after response; br: before response): positive br > indifferent br, positive br > unrecognized logos br, indifferent br > unrecognized logos br, positive ar > indifferent ar, positive ar > unrecognized logos ar, and indifferent ar > unrecognized logos ar.
General linear model analysis – group analysis
For both models, group analysis was performed with FLAME (FMRIB’s Local Analysis of Mixed Effects) stage 1 and stage 2 with automatic outlier detection (Beckmann et al., 2003; Woolrich et al., 2004; Woolrich, 2008). At this level, group means were calculated from the individual level contrasts.
Z (Gaussianized T/F) statistic images were thresholded using clusters determined by z > 2.3 and a (corrected) cluster significance threshold of p = 1.00 (Worsley, 2001). Only clusters with more than 50 voxels survived the threshold.
Probabilistic independent component analysis
The following data pre-processing was applied: masking of non-brain voxels, voxel-wise de-meaning of the data, and normalization of the voxel-wise variance. Pre-processed data were whitened and projected into a 164-dimensional subspace using probabilistic Principal Component Analysis where the number of dimensions was estimated using the Laplace approximation to the Bayesian evidence of the model order (Minka, 2000; Beckmann and Smith, 2004). The whitened observations were decomposed into sets of vectors, which describe signal variation across the temporal domain (time-courses), the session/subject domain and across the spatial domain (maps) by optimizing for non-Gaussian spatial source distributions using a fixed-point iteration technique (Hyvärinen, 1999). Estimated component maps were divided by the SD of the residual noise and thresholded by fitting a mixture model to the histogram of intensity values (Beckmann and Smith, 2004).
The EVs basic shapes convolved with a gamma function and including temporal derivatives were concatenated for all the participants in the same order that time-courses were entered in MELODIC, and the same contrasts used in FEAT were computed. The parameter estimates of each spatial independent component (164 total) were then calculated and tested using GLM for each case (see Figure 3), and so the selection of significant spatial independent components was based on statistical criteria.
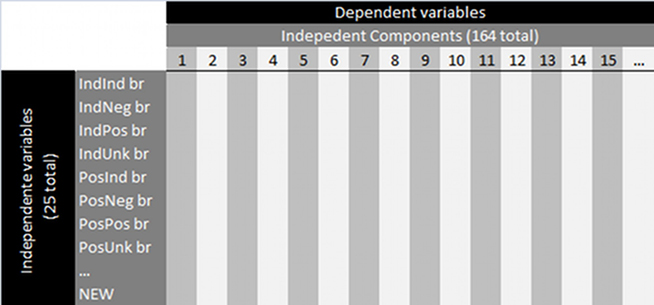
Figure 3. Illustration of the application of a GLM analysis to each of the 164 independent components yielded by MELODIC. For each IC, 25 independent variables were modeled: the three types of stimulus (positive, indifferent, and fictitious logos), times the four possible ratings (positive, indifferent, negative, and unknown), times the two epochs (before and after button pressing), and the non-emotional words.
Results
Consistency in the Assessments between Sessions
Most of the ratings were coherent from one session to the other. Results are summarized in Table 1. Five hundred fifty-four fictitious brands’ logos out of 630 (87.9%) were rated as unknown, 590 positive brands out of 630 (93.7%) were rated as positive, and 427 indifferent brands out of 630 (67.8%) were again rated as indifferent.
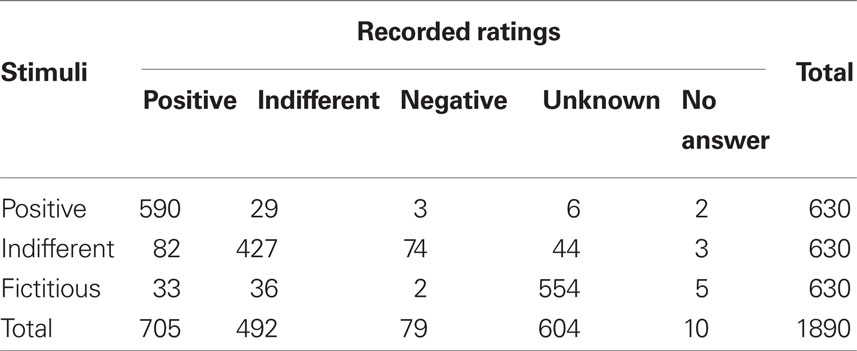
Table 1. Assessments made during the scanning sessions separated according to the type of stimuli.
Response Time
The graph in Figure 4 depicts the distribution of the subjects’ choices by response time. Response times were shorter with positive ratings (1546 ms) than indifferent (2370 ms) or fictitious ratings (2334 ms), suggesting a delayed decision process with the last two ratings. These differences are significant between positive and indifferent ratings (F426,589,0.01 = 1.702 – p-value < 0.000001), and positive and fictitious ratings (F553,589,0.01 = 1.708 – p-value < 0.000001), but not significant between indifferent and fictitious ratings (F553,426,0.01 = 1.004 – p-value = 0.969508).
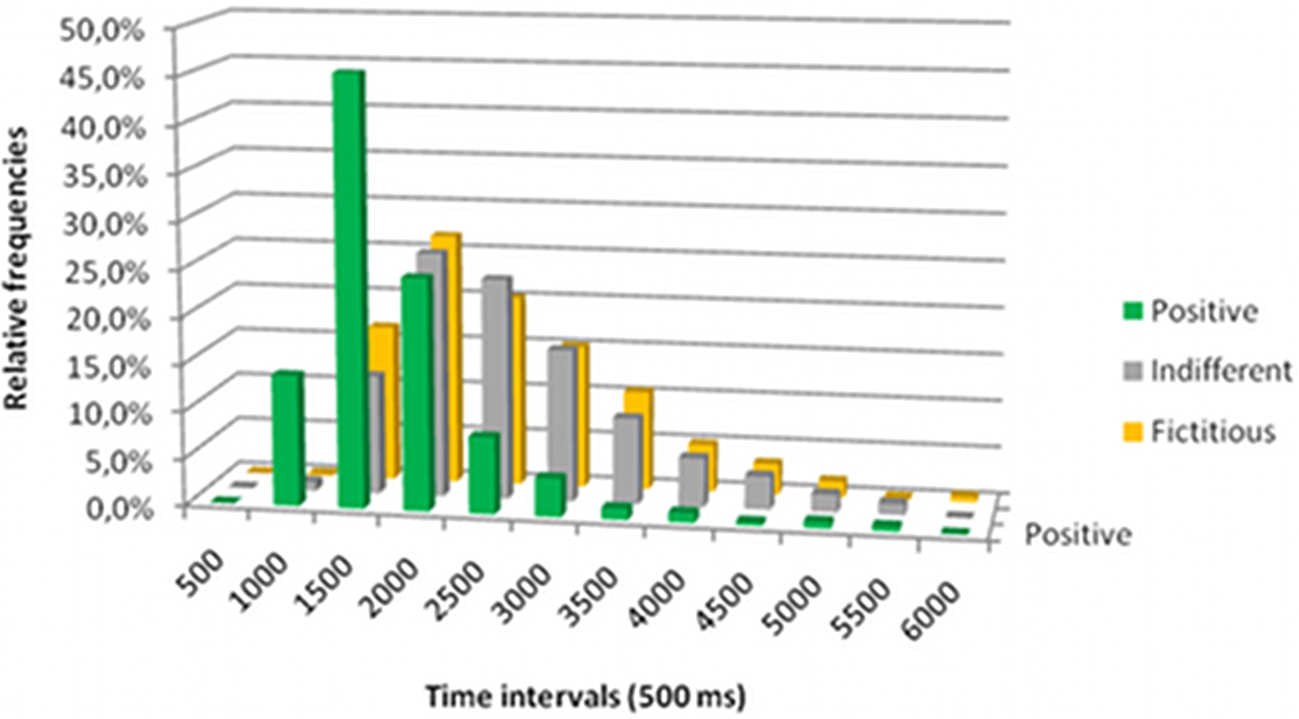
Figure 4. Relative frequency of response times obtained during the scanning session grouped in 500 ms intervals.
General Linear Model Analysis
In the conventional GLM analysis (the whole of the stimulus duration), the vmPFC was significantly and extensively activate for the contrasts positive versus indifferent or fictitious logos (Figure 5).
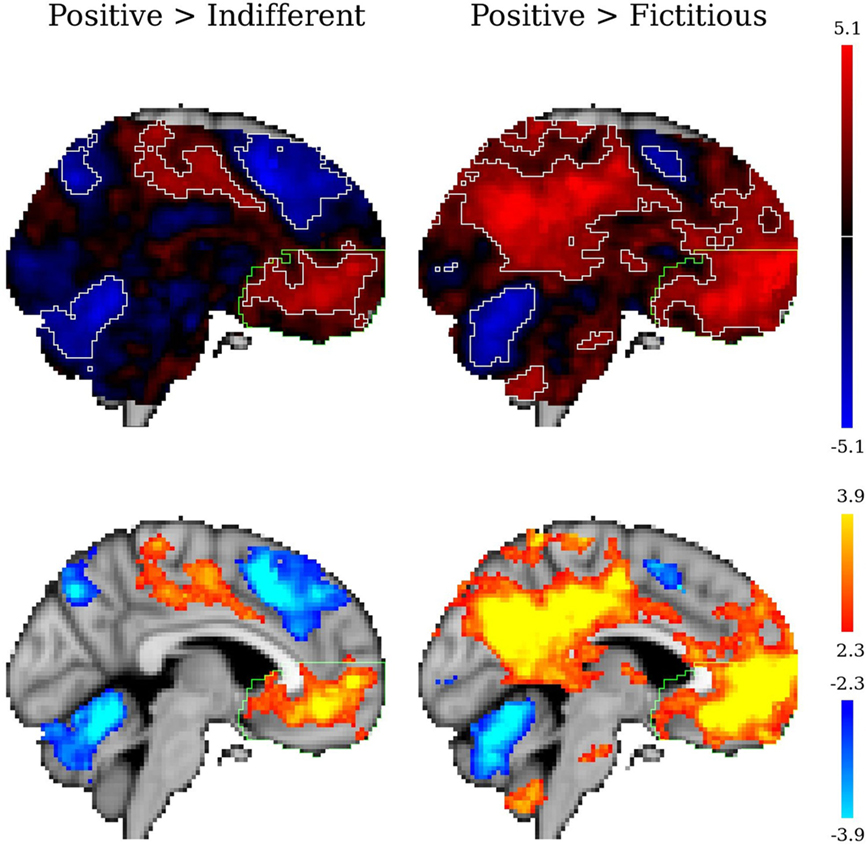
Figure 5. Statistical z maps (unthresholded in the upper row and thresholded in the lower row) for the contrasts positive versus indifferent brands and positive versus fictitious logos in a conventional GLM analysis. In the unthresholded images the significant clusters are outlined in white (for z > 2.3), and the vmPFC is outlined in green. Sagittal views for x = −04 (MNI152 coordinates).
Figure 6 represents the stimulus detailed analysis for the same contrasts. For the period before the response (decision stage) the vmPFC tendentiously deactivated. Conversely, after button pressing, i.e., after the decision was made and while subjects were passively visualizing the stimulus, the vmPFC was active.
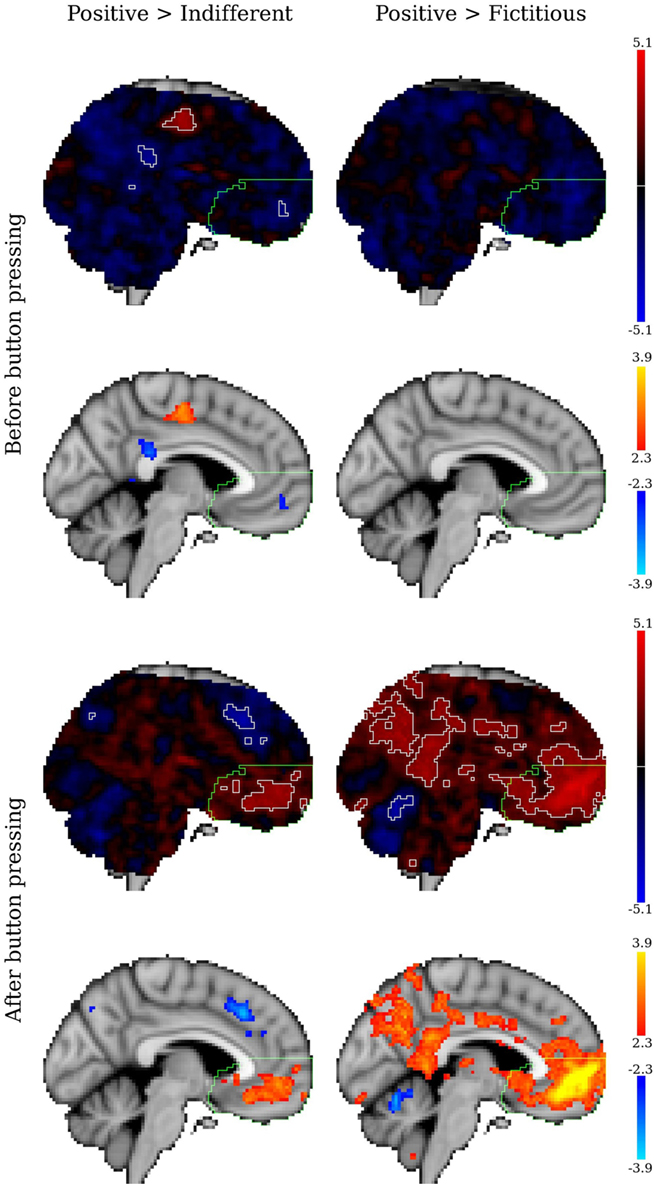
Figure 6. Statistical z maps (unthresholded and thresholded) for the contrasts between positive versus indifferent brands and positive versus fictitious logos in the stimulus detailed analysis. The two top row maps represent the decision stage (before the response), and the two bottom row maps represent the period after the response (passive visualization). In the unthresholded images the significant clusters are outlined in white (for z > 2.3), the vmPFC is outlined in green. Sagittal views for x = −04 (MNI152 coordinates).
Four local maxima from the cluster in the vmPFC in the contrast positive versus indifferent in the conventional analysis were selected for further analysis. The parameter estimates of these voxels are represented in Figure 7 both for the conventional analysis and for the stimulus detailed analysis. For the conventional GLM analysis, all the four local maxima significantly activated when positive brands were involved. On the contrary, in the stimulus detailed analysis there were deactivations, more prominent in the anterior subregions (ventral paracingulate gyrus and ventral medial frontal pole). After the response, however, the vmPFC was extensively activate.
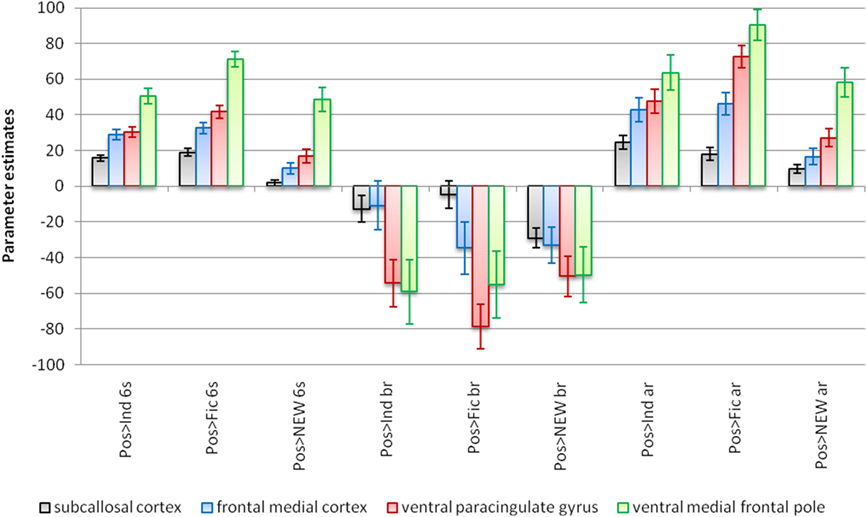
Figure 7. Parameter estimates for the stimuli in four local maxima in the vmPFC (subcallosal cortex: −6, 32, −10; frontal medial cortex: 2, 36, −14; ventral paracingulate gyrus: −2, 48, −2; ventral medial frontal pole: −2, 58, 4). The bar graphs identified with the suffix 6 s are the conventional GLM-based analysis of fMRI data. The bar graphs identified with the suffix br refer to the participation of the voxel before the response (decision stage). The bar graphs identified with the suffix ar refer to the participation after the decision instant but before the stimulus offset. Pos: positive; Ind: indifferent; Fic: fictitious; NEW: non-emotional words (baseline). MNI152 coordinates. Error bars correspond to confidence intervals of 95%.
Probabilistic Independent Component Analysis
The 164 ICs yielded by PICA account for 86.95% of the variability.
To select the relevant ICs the criteria were: the z statistics of the contrast between the parameter estimates of the positive brands versus the parameter estimates of the indifferent brands, the fictitious logos, and the non-emotional words had to be superior to 2.3 in all the three cases, or inferior to −2.3 in all three cases. This procedure was implemented in the two situations, before and after the response. In this way it was guaranteed that the ICs selected would be significantly more active or more deactivated for positive brands than in the remaining cases.
Neither before the response nor after the response there were ICs with z value inferior to −2.3. On the contrary, two ICs (#17 and #152) had all the considered z values superior to 2.3 in the situation before the response, and four other (#24, #49, #96, and #135) had z values superior to 2.3 in the situation after the response. Only IC #24 included brain activations in the vmPFC. The z values for the three cases are reported in Table 2. Three slices of IC #24 are represented in Figure 8. Besides the vmPFC activation this network also includes active voxels in the precuneus, posterior cingulate gyrus, right and left anterior divisions of the middle temporal gyrus, and deactivation in the occipital fusiform gyrus.
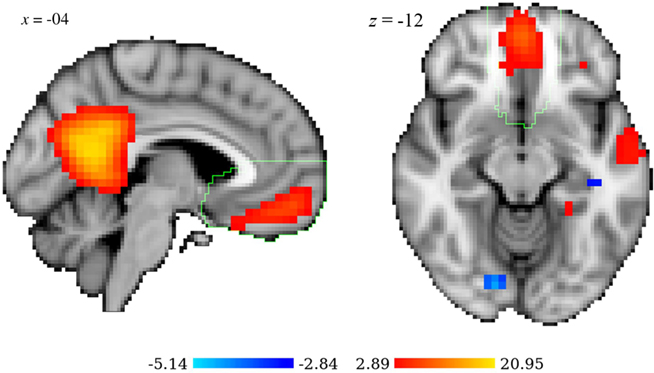
Figure 8. Two views of the network that constitutes the independent component #24: sagittal (x = −04), and axial (z = −12). The vmPFC is outlined in green. Radiological convention. MNI152 coordinates.
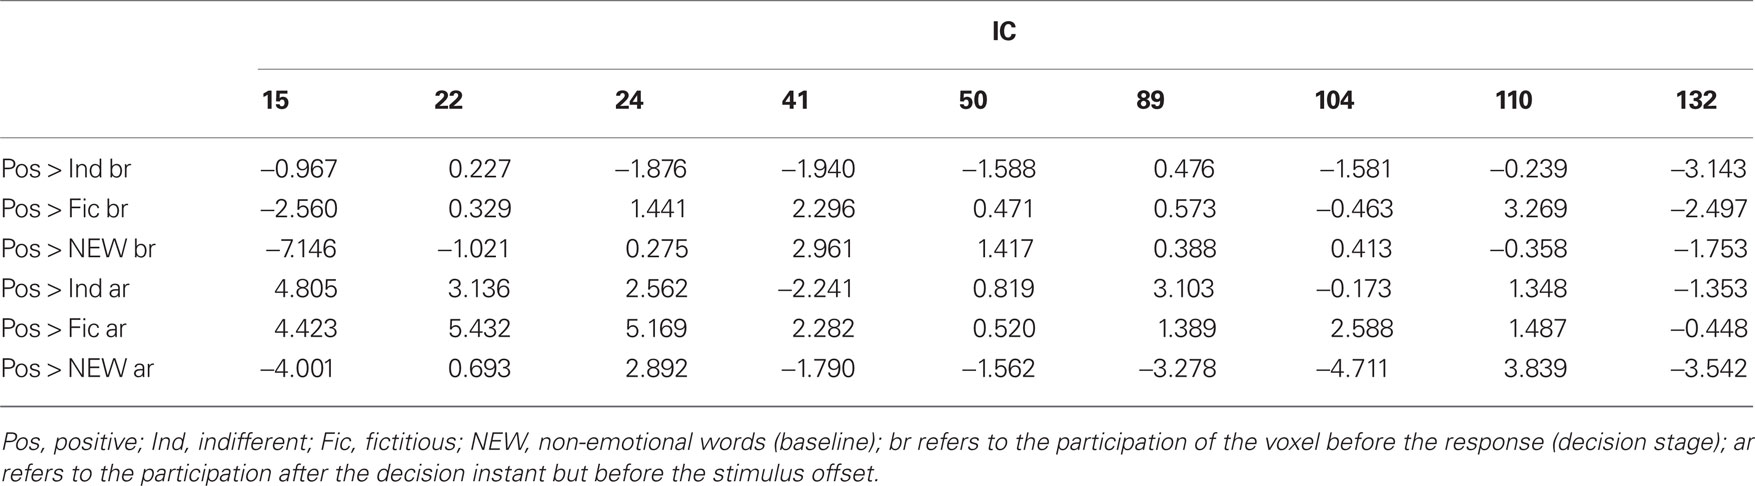
Table 2. Statistic z for all the ICs that had at least one voxel activated or deactivated among those considered in Figure 7.
Table 2 also reports the z values for all the ICs that encompass at least one of the local maxima voxels considered in Figure 7 (activated or deactivated). Only IC #24 has this statistic consistently and significantly positive (for the situation after response). However, ICs #15 and #22 were significantly positive for the situation after the response in the contrast with other logos (indifferent or fictitious). In the situation before the response, IC #132 had significantly negative z values for the contrasts with logos.
Discussion
Most of the neuroimaging studies involving brands use paradigms consisting of choices between pairs of brands or products, i.e., both stimuli are presented simultaneously and subjects have to choose one or the other. However, the structure adopted in our study is different, we believe closer to everyday life; each brand is presented one at a time, meaning that subjects decide about the hedonic value of a particular brand not by comparison. For example, when a consumer chooses a product from a supermarket shelf, s/he does not collect first all the available items and then choose. On the contrary, there is a previous intention summarized in a concept named consideration set, or evoked set (Roberts and Lattin, 1991; Shocker et al., 1991; Petrof and Daghfous, 1996). The consumer confronts each possibility in the shelf against the consideration set until one brand/product is preferred. Thus, the process is not a simple choice among several options, but instead an assessment of the fit between one option and the inner expectations that were previously constructed.
Damásio (1994) from his observations in neurologically impaired patients, proposed that the prefrontal cortex is a crucial structure in decision-making; the vmPFC in particular is thought to be important in decisions of preference including preference for certain brands (Paulus and Frank, 2003; Deppe et al., 2005; Knutson et al., 2007; Koenigs and Tranel, 2008; Luu and Chau, 2009). The results of our conventional GLM analysis, which included data acquired both before and after decision of brand preference, corroborate these findings: activation of the vmPFC was found when comparing positive with indifferent or fictitious brands. However, when we dissected the subjects’ responses and isolated the decision-making period from the moment after the response, we found that, especially for positive brands, the vmPFC was more active after the choice than during the decision process itself, challenging some of the existing literature. And this result was supported both by the GLM time-split analysis and by the PICA analysis.
During the decision process itself, i.e., before the response, the vmPFC was less active for positive brands than for indifferent or fictitious logos. Conversely, the vmPFC was more active after the brand choice was made. Considering the four local maxima in the vmPFC (the subcallosal cortex, the frontal medial cortex, the ventral paracingulate gyrus, and the ventral medial frontal pole), although they were also involved in the conventional analysis when it corresponded to all the period when the stimulus was present, the same voxels of the vmPFC were deactive during the decision period until the response, but active after the response. This pattern was not found with indifferent brands (that subjects recognized as having some meaning to them, but that were not preferred), with fictitious logos (visualized for the first time and about which, likewise, subjects could not have a preformed opinion), and also with non-emotional words.
One of the ICs obtained with the multivariate model-free analysis (PICA) was significantly more relevant in the choice of positive brands than indifferent brands, fictitious logos, or non-emotional words. IC 24 showed extensive activations in the vmPFC, among other brain structures (Figure 8). This network was significantly more active with preferred brands than with indifferent brands, fictitious logos, or non-emotional words only after the response, which reinforces the fact that although important in decisions of preference, the vmPFC is only so after the decision-making process itself. The analysis of the participation of the vmPFC in brain networks represented in other ICs corroborates this hypothesis, because none of the ICs had consistent or significant statistics to support the participation of the vmPFC in the period before the response.
The results of the present study seem to contradict some of the existing theories on the role of the vmPFC in the decision process. On the other hand, our data are supported by Lin et al., (2010) work in which the brand stimuli were also presented one at a time, suggesting as well a late participation of the vmPFC in preference decision-making; or by Li et al. (2010) study that used fMRI and the Iowa Gambling Task to investigate the neural correlates of decision-making. They have demonstrated a group of brain regions that included the dorsolateral prefrontal cortex for working memory, and the insula and posterior cingulate cortex for representations of emotional states. However, the vmPFC was not part neither of the memory nor the emotional networks, but instead was coupling the two processes.
In summary, the results of the present study converge in supporting the notion that the vmPFC may be unimportant in the decision stage concerning brand preference, questioning theories that postulate that the vmPFC is in the origin of brand choice. To complement our findings, further studies that challenge as well conventional research design and neuroimaging methodologies are need to investigate in detail why the vmPFC seems to be involved in brand preference only after the decision process.
Conflict of Interest Statement
The authors declare that the research was conducted in the absence of any commercial or financial relationships that could be construed as a potential conflict of interest.
Footnotes
References
Bechara, A., and Damásio, A. R. (2005). The somatic marker hypothesis: a neural theory of economic decision. Games Econ. Behav. 52, 336–372.
Bechara, A., Damásio, H., Damásio, A. R., and Lee, G. P. (1999). Different contributions of the human amygdala and ventromedial prefrontal cortex to decision-making. J. Neurosci. 19, 5473–5481.
Bechara, A., Damásio, H., Tranel, D., and Damásio, A. R. (1997). Deciding advantageously before knowing the advantageous strategy. Science 275, 1293–1295.
Beckmann, C. F., Jenkinson, M., and Smith, S. M. (2003). General multilevel linear modeling for group analysis in FMRI. Neuroimage 20, 1052–1063.
Beckmann, C. F., and Smith, S. M. (2004). Probabilistic independent component analysis for functional magnetic resonance imaging. IEEE Trans. Med. Imaging 23, 137–152.
Beckmann, C. F., and Smith, S. M. (2005). Tensorial extensions of independent component analysis for multisubject FMRI analysis. Neuroimage 25, 294–311.
Bradley, M. M., and Lang, P. J. (2007). “The international affective picture system (IAPS) in the study of emotion and attention,” in Handbook of Emotion Elicitation and Assessment, eds J. A. Coan, and J. J. B. Allen (New York: Oxford University Press), 29–46.
Chamberlain, L., and Broderick, A. (2007). The application of physiological observation methods to emotion research. Qual. Mark. Res. Int. J. 10, 199–216.
Damásio, A. R. (1994). Descarte’s Error – Emotion, Reason and the Human Brain. New York: Penguin Putnam.
De Luca, M., Beckmann, C. F., De Stefano, N., Matthews, P. M., and Smith, S. M. (2006). FMRI resting state networks define distinct modes of long-distance interactions in the human brain. Neuroimage 29, 1359–1367.
Deppe, M., Schwindt, W., Kugel, H., Plassmann, H., and Kenning, P. (2005). Nonlinear responses within the medial prefrontal cortex reveal when specific implicit information influences economic decision making. J. Neuroimaging 15, 171–182.
Fellows, L. K., and Farah, M. J. (2007). The role of ventromedial prefrontal cortex in decision making: judgment under uncertainty or judgment per se? Cereb. Cortex 17, 2669–2674.
Gusnard, D. A., and Raichle, M. E. (2001). Searching for a baseline: functional imaging and the resting human brain. Nat. Rev. Neurosci. 2, 685–694.
Hyvärinen, A. (1999). Fast and robust fixed-point algorithms for independent component analysis. IEEE Trans. Neural Netw. 10, 626–634.
Jenkinson, M., Bannister, P. R., Brady, J. M., and Smith, S. M. (2002). Improved optimization for the robust and accurate linear registration and motion correction of brain images. Neuroimage 17, 825–841.
Jenkinson, M., and Smith, S. M. (2001). A global optimisation method for robust affine registration of brain images. Med. Image Anal. 5, 143–156.
Knutson, B., Rick, S., Wimmer, G. E., Prelec, D., and Loewenstein, G. (2007). Neural predictors of purchases. Neuron 53, 147–156.
Koenigs, M., and Tranel, D. (2008). Prefrontal cortex damage abolishes brand-cued changes in cola preference. Soc. Cogn. Affect. Neurosci. 3, 1–6.
Li, X., Lu, Z.-L., D’argembeau, A., Ng, M., and Bechara, A. (2010). The iowa gambling task in fMRI images. Hum. Brain Mapp. 31, 410–423.
Lin, C.-H., Tuan, H.-P., and Chiu, Y.-C. (2010). Medial frontal activity in brand-loyal consumers: a behavior and near-infrared ray study. J. Neurosci. Psychol. Econ. 3, 59–73.
Luu, S., and Chau, T. (2009). Decoding subjective preference from single-trial near-infrared spectroscopy signals. J. Neural Eng. 6, 016003.
Mehrabian, A. (1995). Framework for a comprehensive description and measurement of emotional states. Genet. Soc. Gen. Psychol. Monogr. 121, 339–361.
Mehrabian, A., and De Wetter, R. (1987). Experimental test of an emotion-based approach to fitting brand names to products. J. Appl. Psychol. 72, 125–130.
Minka, T. P. (2000). Automatic Choice of Dimensionality for PCA. Technical Report 514, Cambridge: MIT Media Lab Vision and Modeling Group.
Morris, J. D. (1995). Observations: SAM: the self-assessment manikin – an efficient cross-cultural measurement of emotional response. J. Advert. Res. 35, 63–68.
Paulus, M. P., and Frank, L. R. (2003). Ventromedial prefrontal cortex activation is critical for preference judgments. Neuroreport 14, 1311–1315.
Rangel, A., Camerer, C. F., and Montague, P. R. (2008). A framework for studying the neurobiology of value-based decision making. Nat. Rev. Neurosci. 9, 545–556.
Roberts, J., and Lattin, J. (1991). Development and testing of a model of consideration set composition. J. Mark. Res. 28, 429–440.
Russell, J. A., and Mehrabian, A. (1977). Evidence for a three-factor theory of emotions. J. Res. Pers. 11, 273–294.
Schaefer, M., and Rotte, M. (2007). Favorite brands as cultural objects modulate reward circuit. Neuroreport 18, 141–145.
Shocker, A., Ben-Akiva, M., Boccara, B., and Nedungadi, P. (1991). Consideration set influences on consumer decision-making and choice: issues, models, and suggestions. Mark. Lett. 2, 181–197.
Smith, S. M., Jenkinson, M., Woolrich, M. W., Beckmann, C. F., Behrens, T. E., Johansen-Berg, H., Bannister, P. R., De Luca, M., Drobnjak, I., Flitney, D. E., Niazy, R. K., Saunders, J., Vickers, J., Zhang, Y., De Stefano, N., Brady, J. M., and Matthews, P. M. (2004). Advances in functional and structural MR image analysis and implementation as FSL. Neuroimage 23(Suppl. 1), S208–S219.
Tom, S. M., Fox, C. R., Trepel, C., and Poldrack, R. A. (2007). The neural basis of loss aversion in decision-making under risk. Science 315, 515–518.
Woolrich, M. W., Behrens, T. E., Beckmann, C. F., Jenkinson, M., and Smith, S. M. (2004). Multilevel linear modelling for FMRI group analysis using Bayesian inference. Neuroimage 21, 1732–1747.
Woolrich, M. W., Jbabdi, S., Patenaude, B., Chappell, M., Makni, S., Behrens, T. E., Beckmann, C. F., Jenkinson, M., and Smith, S. M. (2009). Bayesian analysis of neuroimaging data in FSL. Neuroimage 45, S173–S186.
Woolrich, M. W., Ripley, B. D., Brady, J. M., and Smith, S. M. (2001). Temporal autocorrelation in univariate linear modeling of FMRI data. Neuroimage 14, 1370–1386.
Keywords: neuromarketing, brands, emotion, preference, multivariate analysis, FMRI
Citation: Santos JP, Seixas D, Brandão S and Moutinho L (2011) Investigating the role of the ventromedial prefrontal cortex in the assessment of brands. Front. Neurosci. 5:77. doi: 10.3389/fnins.2011.00077
Received: 15 December 2010;
Accepted: 21 May 2011;
Published online: 03 June 2011.
Edited by:
Julia Trommershaeuser, New York University, USAReviewed by:
Ming Hsu, University of California Berkeley, USAJamie D. Roitman, University of California San Francisco, USA
Copyright: © 2011 Santos, Seixas, Brandão and Moutinho. This is an open-access article subject to a non-exclusive license between the authors and Frontiers Media SA, which permits use, distribution and reproduction in other forums, provided the original authors and source are credited and other Frontiers conditions are complied with.
*Correspondence: José Paulo Santos, Instituto Superior da Maia, Avenida Carlos Oliveira Campos, Castelo da Maia, 4475-690 Avioso (São Pedro), Maia, Portugal. e-mail: jpsantos@ismai.pt