
- Department of Psychology, University of Victoria, Victoria, BC, Canada
We applied the event-related brain potential (ERP) technique to investigate the involvement of two neuromodulatory systems in learning and decision making: The locus coeruleus–norepinephrine system (NE system) and the mesencephalic dopamine system (DA system). We have previously presented evidence that the N2, a negative deflection in the ERP elicited by task-relevant events that begins approximately 200 ms after onset of the eliciting stimulus and that is sensitive to low-probability events, is a manifestation of cortex-wide noradrenergic modulation recruited to facilitate the processing of unexpected stimuli. Further, we hold that the impact of DA reinforcement learning signals on the anterior cingulate cortex (ACC) produces a component of the ERP called the feedback-related negativity (FRN). The N2 and the FRN share a similar time range, a similar topography, and similar antecedent conditions. We varied factors related to the degree of cognitive deliberation across a series of experiments to dissociate these two ERP components. Across four experiments we varied the demand for a deliberative strategy, from passively watching feedback, to more complex/challenging decision tasks. Consistent with our predictions, the FRN was largest in the experiment involving active learning and smallest in the experiment involving passive learning whereas the N2 exhibited the opposite effect. Within each experiment, when subjects attended to color, the N2 was maximal at frontal–central sites, and when they attended to gender it was maximal over lateral-occipital areas, whereas the topology of the FRN was frontal–central in both task conditions. We conclude that both the DA system and the NE system act in concert when learning from rewards that vary in expectedness, but that the DA system is relatively more exercised when subjects are relatively more engaged by the learning task.
Introduction
Adaptive decision making depends on both fast and efficient processing of stimulus events for effective responding (e.g., Servan-Schreiber et al., 1990) and slow trial-to-trial learning of action values for optimizing the selection process (e.g., Schultz et al., 1997). The catecholinergic neuromodulatory systems that distribute norepinephrine (NE) and dopamine (DA) have been implicated in these two groups of processes, respectively (Servan-Schreiber et al., 1990; Schultz et al., 1997). Further, putative manifestations of these systems have been identified in the human electroencephalogram (EEG; Holroyd and Coles, 2002; Nieuwenhuis et al., 2005a,b; Warren et al., 2011). However, the way these two systems interact has yet to be explored.
The locus coeruleus–norepinephrine system (NE system) is believed to play a key role in facilitating fast and effective processing of task-relevant stimuli (Usher et al., 1999). The locus coeruleus (LC) is a neuromodulatory nucleus in the midbrain that briefly enhances cortical processing in reaction to motivationally salient or conflict-inducing events (Usher et al., 1999; Gilzenrat et al., 2002). The LC is the primary source of NE to the cortex and other regions (Berridge and Waterhouse, 2003), where NE release increases the responsivity of individual neurons and improves the signal-to-noise ratio of associated neural networks (Servan-Schreiber et al., 1990). Single-cell recordings from the LC in monkeys show that the LC releases NE in phasic bursts to motivationally salient events, and periods of greater phasic release of NE are associated with better performance in target discrimination tasks (Usher et al., 1999). The NE system is also auto-inhibitory, such that phasic bursts of NE are followed by a refractory-like1 period lasting ∼500 ms characterized by reduced or arrested NE supply to the cortex.
In a previous paper (Warren et al., 2011), we proposed that the impact of phasic bursts of NE on cortical processing manifests in the human EEG as an increase in amplitude of the N2, a negative deflection of the human event-related brain potential (ERP) occurring between about 200 and 300 ms after the onset of the eliciting stimulus, the amplitude of which is exercised by unexpected or conflict-inducing events (e.g., Nieuwenhuis et al., 2003). This theory is a modification of a previous “LC–P3 theory” that holds that the phasic bursts of NE produce the P3 – a prominent, positive deflection in the ERP that immediately follows the N2 – rather than the N2 itself (Nieuwenhuis et al., 2005a). Thus, our “modified LC–P3 theory” develops this account by proposing that the LC burst impacts cortical activity somewhat earlier than originally proposed, during the time period of the N2 (∼250 ms post-stimulus), whereas the LC refractory period coincides with P3 generation.
A key prediction of our proposal is that any change in the ERP due to noradrenergic modulation should exhibit a variable scalp distribution dependent on relative engagement of the different cortical areas giving rise to the ERP. This position follows from two key characteristics of the NE system. First, the broadly dispersed efferent projection system of the LC distributes NE to all regions of the cortex, so any given phasic release can modulate neural activity (and the associated N2) anywhere in cortex (Berridge and Waterhouse, 2003; Nieuwenhuis et al., 2007). Second, NE-mediated changes in activity should be greatest in cortical areas that are most engaged by the task at hand because increasing the signal-to-noise ratio in the entire cortex will have the greatest impact in those areas (Nieuwenhuis et al., 2005a, 2011). This position contrasts with theories of the N2 which posit that the N2 is produced specifically by the anterior cingulate cortex (ACC) and should therefore exhibit a relatively fixed topology, maximal at frontal–central regions of the scalp (e.g., van Veen and Carter, 2002a,b; Yeung et al., 2004).
In previous work, we supported the modified LC–P3 theory by demonstrating that the scalp distribution of the N2 varies widely according to task changes that relatively engage different cortical areas (Warren et al., 2011). We presented subjects with pictures of male and female faces that were tinted either blue or yellow. Subjects attended to either the gender or the color of the faces and counted targets in an oddball task. The impact of frequency was isolated by subtracting frequent stimulus trials from infrequent stimulus trials, yielding a difference-wave representative of the change in neural activity specifically caused by differences in stimulus probability (and putatively due to differences in NE recruitment). When subjects attended to the color of the face, the N2 in the difference wave was maximal over frontal–central regions as is often observed in simple oddball tasks (e.g., Nieuwenhuis et al., 2003; Holroyd et al., 2008; but see Folstein and Van Petten, 2007), consistent with arguments that the N2 is generated in the ACC (van Veen and Carter, 2002a,b; Yeung et al., 2004). By contrast, when subjects attended to the gender of the faces the N2 in the difference wave was maximal over lateral-occipital regions, consistent with a relatively large change in activity within the fusiform face-processing area (FFA). This study demonstrated that identical task stimuli (colored faces) presented with identical task designs (standards and deviants) can nevertheless radically alter the topology of the N2 depending on which aspect of the stimuli participants are instructed to attend.
An interesting special case of the N2 occurs when the eliciting stimulus is a feedback stimulus in a reward/no-reward paradigm. A negative feedback stimulus (e.g., that indicates a potential reward was not received) elicits a frontal–central negative deflection in the same time range as the N2, but positive feedback does not (Miltner et al., 1997). This difference is called the feedback-related negativity (FRN), and is usually measured with a difference wave approach whereby the ERP to reward feedback is subtracted from the ERP to error feedback (Holroyd and Krigolson, 2007). It is important to note that the FRN may be characterized by variance in the ERP associated with both negative and positive feedback. Source localization studies suggest that the FRN is generated in, or very close to, the ACC (Gehring and Willoughby, 2002; Miltner et al., 2003; Hewig et al., 2007). Additionally, a neurocomputational theory of this ERP component is based on the seminal observation that rewarding events elicit phasic bursts of dopamine (DA) activity that are utilized by the targets of the DA system (including the ACC) for the purpose of adaptive decision making (Schultz et al., 1997; Holroyd and Coles, 2002). In particular, single-cell recordings from primates show increased phasic DA activity in response to unexpected rewards or reward predictors, and shallow dips from baseline DA activity in response to punishment or to the absence of expected rewards (e.g., Schultz, 2002). Holroyd and Coles (2002) proposed the reinforcement learning theory of the FRN, which holds that the FRN reflects the impact of these phasic DA signals on the ACC such that motor neurons in the ACC are inhibited and disinhibited by phasic increases and decreases of DA, respectively.
Recent evidence suggests that these phasic DA signals specifically modify the amplitude of the N2. According to this position, the ACC produces a negative deflection to unexpected task-relevant events (the N2), including unexpected negative feedback and unexpected reward feedback. However, unexpected reward feedback also elicits a dopamine-induced positive deflection (“the reward positivity”) that is superimposed over the N2 and cancels it out (Holroyd et al., 2008). In other words, unexpected error and reward feedback elicit the N2, but unexpected reward feedback also elicits a reward positivity that obscures the N2, creating the difference observed between the ERPs to positive and negative feedback (the FRN).
To dissociate the reward positivity from the N2, a recent multi-experiment study presented subjects with complicated reward feedback that indicated not only whether a subject had won or lost money, but also what response was required of them for the subsequent trial (Baker and Holroyd, 2011). In one experiment, a stimulus-induced delay in reward processing caused the reward positivity to appear about 100 ms later than usual (peaking at about 350 ms), thereby exposing the N2 on those trials. When the reward-feedback stimulus was simplified in further experiments, the reward positivity appeared earlier and attenuated the N2. Furthermore, factors related to response conflict impacted N2 amplitude and reduced the reward positivity on high-conflict reward trials.
The ACC has been posited to be the neural generator of both the N2 (van Veen and Carter, 2002a,b; Yeung et al., 2004) and the FRN (Holroyd and Coles, 2002). Furthermore, here we have proposed that noradrenergic modulation enhances activity in the ACC and all across the cortex, amplifying the N2 in target areas. Thus, there are three factors that push the amplitude of the N2 at frontal–central scalp locations up and down: ACC activity, noradrenergic modulation, and dopaminergic modulation. If we have any chance of understanding how the frontal–central N2 provides insight into ACC function, we need to understand how these systems interact – otherwise we will be at a loss to interpret N2 data.
To investigate this issue, we employed the same paradigm used in our previous study (Warren et al., 2011), presenting subjects with male or female faces tinted either blue or yellow, with frequent or infrequent category presentations based on either the gender or the color of the faces. But here the stimuli also indicated reward or no-reward, allowing us to simultaneously examine the N2 and the FRN. We manipulated the amplitudes of the reward positivity and the N2 along two independent dimensions. Along one dimension, we varied (across subjects) the degree of participant engagement in a feedback task, which is known to affect FRN amplitude. For example, Yeung et al. (2005) manipulated the degree to which a deliberative strategy was required of subjects, from passively observing reward/no-reward outcomes, to actively making a decision that would result in either reward or no-reward. The FRN was significantly larger when subjects utilized the feedback to optimize their decisions, as opposed to passively collecting rewards (see also Holroyd et al., 2009; Li et al., 2011; Peterson et al., 2011). We implemented this manipulation across three experiments wherein subjects passively collected rewards in Experiment 1 (Passive Experiment), made a decision based on multiple stimulus feature-response combinations in Experiment 2 (Active Experiment), and intermediate to these, made a decision based on relatively simple response–reward contingencies in Experiment 3 (Moderate Experiment). We predicted that the FRN would be largest in the Active Experiment and reduced or absent in the others. By contrast, we predicted that the N2 would be smaller with increasing task engagement because of component overlap with the reward positivity elicited by infrequent rewards.
Along the second dimension we varied N2 amplitude by manipulating (within subjects) the attended dimension of the feedback: Subjects were required to attend to either the color or the gender of the feedback stimuli (male or female faces tinted either blue or yellow). We predicted that switching from color to gender would move the N2 from frontal–central to lateral-occipital regions of the scalp. By contrast, we predicted that the FRN would remain frontal–central irrespective of the attended dimension of the feedback. Further, we predicted that we would observe maximal interference between the two components in the color condition of the Active Experiment, where both the N2 and the reward positivity are frontal–central. These results would validate our claim that the N2 and FRN are produced by distinct neural mechanisms, one that produces a negativity to infrequent events that has a variable scalp distribution consistent with a noradrenergic origin, and one that produces a positivity to rewards and a negativity to no-rewards that has a frontal–central scalp distribution consistent with genesis in the ACC.
Experiment 1: Passive Learning
In the Passive Experiment we sought to replicate the results of our previous study by engaging the NE system and the N2 in an oddball task with minimal involvement of reinforcement learning systems and therefore minimal interference from the FRN. We employed the exact same paradigm as reported in our previous work (Warren et al., 2011) except that instead of counting stimuli associated with a target category (e.g., male faces), subjects counted earnings accrued with each stimulus presentation (e.g., if subjects were told that they would be given 5 cents for each male face); they were asked to report the sum once during the block and a second time at the end of the block. Importantly, because participants were not required to make an overt response on each trial, we expected this task to elicit only a small FRN, if any (Yeung et al., 2005; Holroyd et al., 2009; Li et al., 2011). Further, as we observed previously, we predicted that relative engagement of the FFA in the attend-gender condition would enhance the N2 over lateral-occipital sites, whereas relative engagement of the ACC in the attend-color condition would enhance the N2 over frontal–central sites. Finally, we predicted that the FRN – to the extent that it was present – would not exhibit any changes in scalp topography.
Method
Methods were identical across all four experiments except where indicated.
Participants
Twenty-one people (three males) completed this experiment. For all experiments reported in this paper, participants signed up through the research participation system at the University of Victoria, Canada, and were compensated with extra credit in an undergraduate psychology course or were paid $20.00 Canadian for their time. This project (Experiments 1 through 4) was approved by the human subjects review board at the University of Victoria and conducted in accordance with the ethical standards prescribed in the 1964 Declaration of Helsinki.
Apparatus and procedure
Participants were seated comfortably, approximately 50 cm in front of a computer screen, in an electromagnetically shielded booth. Stimuli consisted of male or female faces (30 examples of each, lifted from black and white photos, excluding hair and contour of head) and tinted either blue or yellow (∼4.4° visual angle). In a previous experiment (Warren et al., 2011), we used a larger set of the same stimuli (40 males and 40 females), but because the error rates in discriminating between male and female faces were high, here we selected a subset of those stimuli: The 75% that were most accurately discriminated previously. For both stimulus dimensions (color, gender), one stimulus type occurred infrequently (20% of all trials). The order of stimulus presentation was randomized with replacement. At the beginning of each block, subjects were instructed by the computer program to keep track of presentations of a specific target stimulus (blue faces, yellow faces, male faces, or female faces), which when presented would indicate a winning trial. The task consisted of eight blocks of 75 trials each (600 total trials), counterbalanced such that each of the four stimulus types (blue males, yellow males, blue females, yellow females) occurred in two blocks as the target, and of those two blocks, once as a frequent target and once as an infrequent target. Stimuli were presented for 1200 ms and were separated by a fixation cross displayed for 300 ms (see Figure 1, Passive Learning, for a graphic representation of the task).
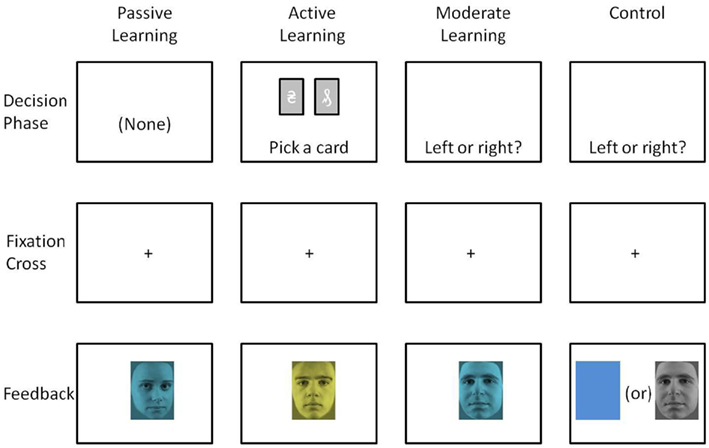
Figure 1. Graphic representation of the four experiments.
Each presentation of the target stimulus category indicated that the subject won $0.05. Subjects were instructed to keep track of the money won and were required to report their count twice per block (at a random trial number about halfway through each block, and at the end of each block). This method yielded 16 reports of the subject’s money count. Subjects reported their count by answering an eight-choice multiple choice question, choosing from several ranges within which the correct count fell (e.g., between $0.30 and $0.50, or between $ 0.55 and $0.75, etc.). We assessed accuracy by dividing the number of correct reports by the number of total reports.
Data acquisition
The EEG was recorded from 41 electrode locations arranged in the standard 10–20 layout using Brain Vision Recorder software (Version 1.3, Brain Products, Munich, Germany). During recording, the EEG data were referenced to the average voltage across channels, sampled at 250 Hz, and amplified (Quick Amp, Brain Products) and filtered through a passband of 0.017–67.5 Hz (90 dB octave roll off). Impedances were below 12 kΩ.
EEG data analysis
The EEG data were filtered off-line through a 0.1- to 20-Hz passband phase-shift-free Butterworth filter and re-referenced to linked mastoids. Ocular artifacts were removed using the algorithm described by Gratton et al. (1983). Trials in which the change in voltage at any channel exceed 35 μV per sampling point were removed. In total, 0.02% of the data were discarded. Thousand ms epochs of data were extracted from the continuous EEG from 200 ms before stimulus onset to 800 ms after. The data were baseline-corrected according to the average amplitude of the EEG over the 200-ms preceding stimulus presentation and ERPs were created by averaging the EEG data for each condition, electrode site, and participant.
To isolate the effect of reward independent of frequency, we subtracted the ERPs associated with reward from the ERPs associated with no-reward yielding an attend-color FRN and attend-gender FRN that were equated for the effect of stimulus probability. This method maximized the signal-to-noise ratio in the ERPs, as opposed to averaging the ERPs separately for the infrequent reward trials, frequent reward trials, infrequent no-reward trials, and frequent no-reward trials. Similarly, to isolate the effect of frequency independent of reward feedback, we subtracted the ERP associated with the frequently occurring stimuli from the ERP associated with the infrequently occurring stimuli, collapsed across reward condition, yielding a difference-wave N2 (dN2) for each task condition (attend-color, attend-gender). Thus, each of the infrequent and frequent ERPs contained equal numbers of reward and no-reward trials such that the difference between these ERPs were equated for the effects of reward. Note that because NE system activity causes a change in the relative activation of the underlying cortical systems (i.e., making ERP components larger), the impact of NE on the ERP is most appropriately measured in a difference wave that isolates that change. We distinguish between the dN2, and the “raw” N2 in light of this consideration. The interaction of the raw N2 and the reward positivity to the four individual conditions was examined separately in an across-group comparison (below).
The amplitudes of the dN2 and FRN were assessed using a base-to-peak measure as follows: For each subject in each condition, the most negative peak between 200 and 280 ms in the attend-color condition, or 300 vs. 380 ms in the attend-gender condition was identified and recorded as the dN2/FRN peak amplitude. The base amplitude of the dN2/FRN was then taken as the most positive voltage prior to the dN2/FRN and these values were subtracted from the dN2/FRN peak amplitude, yielding our base-to-peak measures. This procedure controls for overlap with the P2, a positive deflection that typically immediately precedes the dN2 and that can push the dN2 into positive peak values. Note that because the FRN is not typically preceded by any notable deflection in the difference wave, the base measure is approximately 0 μVs; for this reason the base-to-peak measure of the FRN is equivalent to a peak amplitude measure. However, we chose to assess FRN base-to-peak for consistency with our method for assessing dN2 amplitude.
In assessing the change in component topology across task conditions, we focused on two electrode sites representative of frontal–central and lateral-occipital scalp regions as we did in our previous study, specifically at channel locations FCz and P8. Both the FRN and the dN2 are typically maximal at channel FCz (e.g., Holroyd et al., 2008) and the dN2 was maximal at channel P8 in the attend-gender condition of our previous study (Warren et al., 2011). Single-tailed t-tests were applied to assess the amplitudes of these ERP components at these channels because of our a priori hypotheses of the direction of each difference. For example, we predicted that the dN2 would be larger at channel P8 than at channel FCz for the attend-gender condition; a dN2 that was larger at FCz than at P8 would run contrary to our hypothesis.
Results
Behavioral results
Mean accuracy was 79.2% (SD = 14.4%) for the attend-color condition and 68.5% (SD = 21.2%) for the attend-gender condition. The data of one subject were eliminated from further analysis because the accuracy score was more than 2 SD below the mean in the attend-color condition. For the remaining 20 subjects, mean accuracy was 80.6% (SD = 13.1%) for the attend-color condition and 70% (SD = 20.4%) for the attend-gender condition. This difference approached significance using a two-tailed t-test, t(19) = −2.0, p < 0.10.
EEG results
The raw ERPs, difference waves and scalp distributions are shown in Figure 2. Inspection of the scalp distributions suggests that the attend-color dN2 was maximal over frontal–central sites (FCz, −4.5 μV) whereas the attend-gender dN2 was maximal at lateral-occipital regions (PO8, −3.5 μV). This impression was confirmed with a 2 × 2 ANOVA on dN2 amplitude with electrode (FCz vs. P8) and task (attend-color vs. attend-gender) as repeated factors. There was an effect of task such that the dN2 was larger in the attend-color condition (−4.0 μV) than the attend-gender condition (−2.8 μV), F(1, 19) = 10.8, p < 0.01, η2 = 0.36. There was also an interaction of electrode and task,F(1, 19) = 6.8, p < 0.05, η2 = 0.26, and one-tailed paired samples t-tests revealed that in the attend-color condition, the dN2 was larger at FCz than P8 (−4.5 vs. −3.4 μV), t(19) = −2.0, p < 0.05, whereas in the attend-gender condition the dN2 was larger at P8 than at FCz (−3.2 vs. −2.5 μV), t(19) = 2.0, p < 0.05.
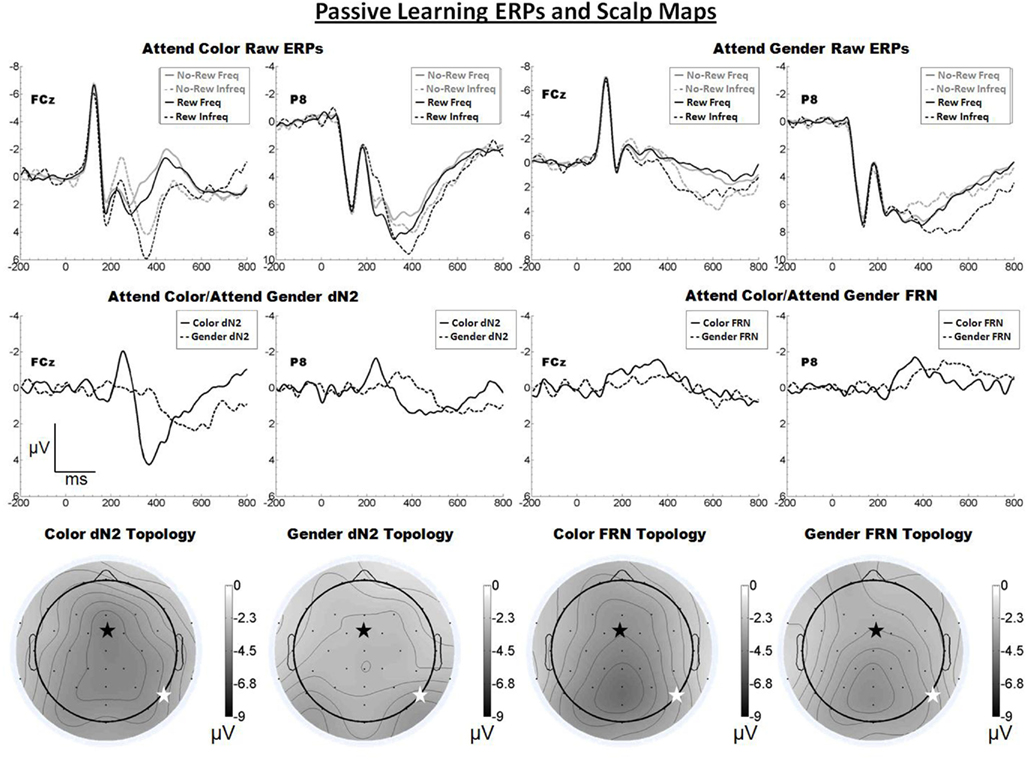
Figure 2. Grand average ERPs for Experiment 1, recorded from channel FCz and P8 (see labels) and scalp distributions associated with the difference waves. The top row shows the “raw” ERPs for each of the frequency by reward conditions across tasks and electrodes. The middle row shows the dN2 and FRN difference waves across task and electrodes. The bottom row shows the scalp distributions of the dN2 and FRN across tasks. The scalp distributions reflect the base-to-peak measure of each of the dN2 and FRN. The black star on the scalp map denotes channel FCz, and the white star denotes P8. Note that negative is plotted up.
Inspection of the scalp distributions in Figure 2 further indicates that the FRN was distributed over posterior, rather than frontal, regions of the head in both the attend-color (Pz, −5.2 μV) and attend-gender (POz, −4.0 μV, followed by Pz, −4.0 μV) conditions. A 2 × 2 ANOVA on FRN amplitude with electrode and task as repeated factors revealed an effect of electrode such that the FRN was larger at FCz than at P8 (−3.5 vs. −2.9 μV), F(1, 19) = 4.8, p < 0.05, η2 = 0.20. There was a trend toward a main effect of task such that the attend-color task yielded a larger FRN than the attend-gender task (−3.5 vs. −2.9 μV), F(1, 19) = 4.0, p < 0.10, η2 = 0.18. There was also a trend toward an interaction of electrode and task,F(1, 19) = 3.2, p < 0.10, η2 = 0.14, and one-tailed paired samples t-tests revealed that in the attend-color condition, the FRN was larger at FCz than P8 (−4.1 vs. −3.0 μV), t(19) = −2.3, p < 0.05, whereas there was no significant difference in the attend-gender condition (FCz: −3.0 μV; P8: −2.9 μV, p > 0.05). An additional check indicated that the FRN was larger at Pz than FCz in the attend-gender condition, t(19) = 2.9, p < 0.01, but not in the attend-color condition, t(19) = 1.4, p > 0.05.
Discussion
We proposed that the dN2 is a manifestation of cortex-wide NE neuromodulation, and predicted that the impact of NE modulation on cortex and therefore the topology of the dN2 should vary according to task demands. By contrast, a standard theory of the FRN holds that it is produced by the impact of DA signals on ACC activity, and therefore that the FRN should appear with a consistent frontal–central scalp topology across task conditions. Here, we replicated our previous finding that the dN2 changes from exhibiting a primarily central scalp distribution when subjects categorize tinted faces based on color to a more lateral-occipital distribution when subjects categorize the same face stimuli based on the gender of the face. Further, although the FRN was larger at frontal central regions in both the attend-color and attend-gender conditions, it was not significantly larger at FCz than P8 in the attend-gender condition, it was relatively small overall (ranging from −2.9 to −4.1 μV), and it exhibited a scalp distribution that was mostly posterior (see Figure 2). These results are inconsistent with the identification of this component with the FRN (Miltner et al., 1997) and indicate that (as predicted) this task did not produce a robust FRN. We conclude that, with minimal interference from the FRN, the dN2 exhibits a prominent yet variable scalp distribution.
Experiment 2: Active Learning
The Active Experiment maximized engagement of the system underlying the FRN by presenting subjects with an apparently complex decision task that encouraged deliberation. Subjects were asked to choose between two elaborate images of tarot cards presented side-by-side on a computer screen by pressing either a left or right key on a keyboard. Six different cards were paired a total of 15 different ways. The subjects were told that with each pairing one card had a better chance of winning than the other, and that they were required to learn which card to pick in any specific pairing (as opposed to finding which of the six cards had the best chance of winning overall). The complexity of the stimulus displays was intended to cultivate a sense that the task was challenging yet learnable (when in fact it was not). In so doing we expected the feedback stimuli to elicit a relatively large FRN with a frontal–central scalp topography for both the attend-gender and attend-color conditions. We further predicted that the FRN would interfere with the production of the dN2 in both the attend-color and attend-gender conditions.
Method
Participants
Twenty people (six males) participated in this study.
Apparatus and procedure
Stimuli and procedure were the same as in the Passive Experiment except where indicated. Each trial began with presentation of two tarot cards appearing on a computer display side-by-side (see Figure 1, Active Learning). Instead of passively counting their accumulated winnings as in the Passive Experiment, subjects were required to choose between the two tarot cards by pressing the appropriate key on the keyboard. The choice screen was displayed until the participant made their decision. When a selection was made the cards were replaced by a fixation cross for 600 ms and then the face-feedback stimulus was presented for 1200 ms. The feedback stimuli were presented and organized in the same manner as in the Passive Experiment.
Tarot cards were detailed images (six images in total) presented in random pairs. Subjects were instructed to try to learn which cards had a better chance of “paying off” in any given pairing, and to maximize their winnings by consistently making the best choice. In addition, subjects were told there would be “hard” blocks in which the pay-off chances for making the right choice were only 10 and 30%, and “easy” blocks in which the pay-off chances were 70 and 90%. Because of the length of the task, the number of trials was reduced from 600 in the Passive Experiment to 400 for the Active Experiment. The task consisted of eight blocks of 50 trials each and the conditions were counterbalanced across blocks as in the Passive Experiment. Additionally, we included only 8 (rather than 16) money count reports (one per block). As in the Passive Experiment, we assessed accuracy in reporting the money count for the Active Experiment by dividing the number of correct reports by the number total reports.
EEG data acquisition and analysis
The EEG data were acquired and analyzed and the dN2 and FRN were assessed in the same way as in the Passive Experiment.
Results
Behavioral results
The mean accuracy was 82.5% (SD = 21.6%) for the attend-color condition and 86.2% (SD = 15.1%) for the attend-gender condition. This effect of task condition on accuracy was not significant (p > 0.05).
EEG results
The raw ERPs, difference waves and scalp maps are shown in Figure 3. Inspection of the scalp distributions suggests that the attend-color dN2 was mostly flat across the scalp but that it exhibited a maximum over lateral-occipital sites (PO7, −3.8 μV). This was also true for the attend-gender dN2 (PO7, −3.7 μV). A 2 × 2 ANOVA on dN2 amplitude with electrode (FCz vs. P8) and task (attend-color vs. attend-gender) as repeated factors yielded no significant effects (all ps > 0.05). The mean dN2 amplitudes were as follows: Attend-color: FCz, −3.1 μV, P8, −3.1 μV; attend-gender: FCz, −3.1 μV, P8, −3.1 μV.
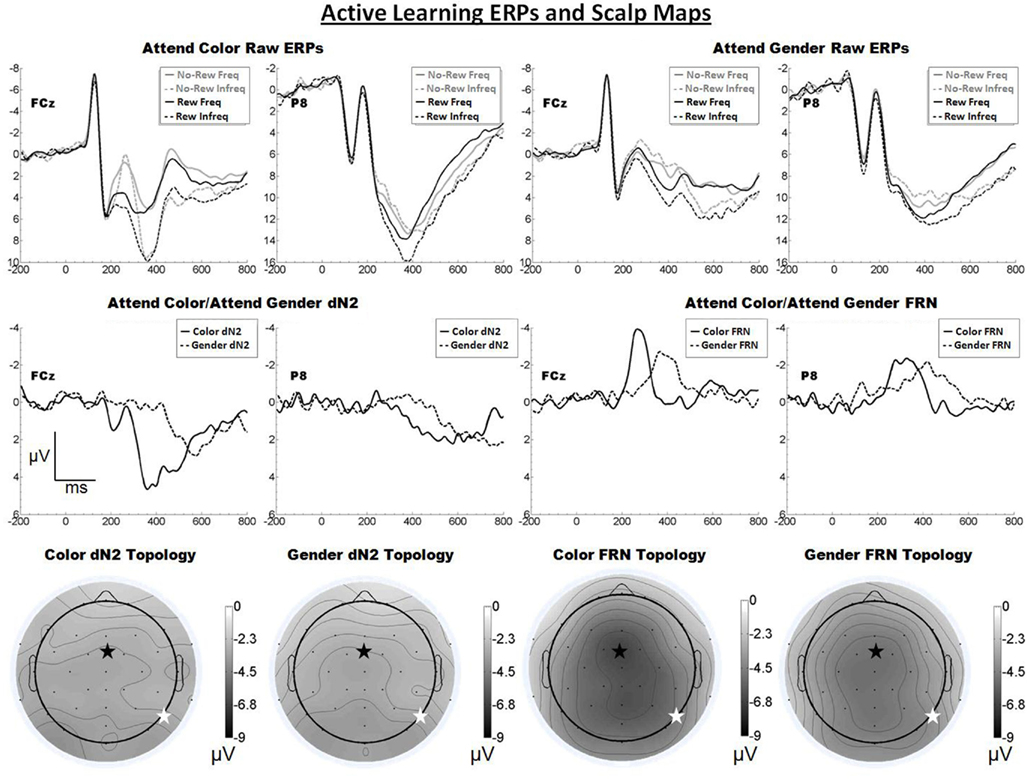
Figure 3. Grand average ERPs for Experiment 2, recorded from channel FCz and P8 (see labels) and scalp distributions associated with the difference waves. The top row shows the “raw” ERPs for each of the frequency by reward conditions across tasks and electrodes. The middle row shows the dN2 and FRN difference waves across task and electrodes. The bottom row shows the scalp distributions of the dN2 and FRN across tasks. The scalp distributions reflect the base-to-peak measure of each of the dN2 and FRN. The black star on the scalp map denotes channel FCz, and the white star denotes P8. Note that negative is plotted up.
Inspection of the scalp distributions of the FRN indicates the FRN was strongly frontal–central in both conditions (attend-color: FCz, −6.7 μV; attend-gender: Cz −5.2 μV followed by CP1, −5.1 μV, and FCz, −5.0 μV). A 2 × 2 ANOVA on FRN amplitude with electrode and task as repeated factors confirmed this impression, revealing an effect of electrode such that the FRN was larger at FCz than at P8 (−5.9 vs. −4.3 μV), F(1, 19) = 14.3, p < 0.01, η2 = 0.43. There was also an effect of task such that the attend-color FRN was larger than the attend-gender FRN (−5.6 vs. −4.5 μV), F(1, 19) = 5.9, p < 0.05, η2 = 0.24. The interaction of electrode and condition was not significant (p > 0.05). Further analysis revealed that in the attend-color condition the FRN was significantly larger at FCz than at P8 (−6.7 vs. −4.6 μV), t(19) = −3.2, p < 0.01, and in the attend-gender condition the FRN was also larger at FCz than at P8 (−5.0 vs. −4.0 μV), t(19) = −2.2, p < 0.05. An additional t-test revealed that the scalp distribution of the attend-gender FRN was not significantly larger at Cz than FCz (p > 0.05).
Discussion
As predicted, increasing the complexity of the stimulus display resulted in a larger FRN for both the attend-color and attend-gender conditions, evidently because these task elements were better able to engage the system that produces the FRN. Further, the FRN appeared frontal central in both conditions, as predicted. By contrast, the dN2 was small and its topology was relatively flat in contrast to the results of the Passive Experiment and our previous work (Warren et al., 2011). We suggest that component overlap with the FRN reduced dN2 amplitude in this task in both the attend-color and attend-gender conditions, a question that we will return to in our across experiments analysis (see below).
Experiment 3: Moderate Learning
The probability manipulation in the Passive Experiment elicited a strong dN2 but the passive nature of the task did not strongly engage the systems that produce the FRN. By contrast, the challenging learning task utilized in the Active Experiment produced a large FRN that strongly attenuated the dN2. In the Moderate Experiment, we sought to utilize a task that would produce both a dN2 and FRN to compare the two components within a single experiment. We therefore simplified the decision task in the Active Experiment such that it would engage (putatively) the DA system sufficiently to produce a FRN, but not so strongly that the FRN would obscure the dN2. We predicted that in this task the dN2 would exhibit a variable scalp distribution across the attend-color and attend-gender conditions, whereas the FRN would not.
Method
Participants
Twenty-two people (five males) participated in this study.
Apparatus and procedure
Stimuli and procedure were the same as in the Passive Experiment and the Active Experiment except where indicated. Instead of passively watching faces or choosing between two tarot cards, on each trial participants made a choice between a left or right key press. The decision screen consisted only of the words “left or right?” (see Figure 1, Moderate Learning). Participants chose between a left or right key press and were subsequently presented with the face-feedback stimulus. Subjects were told that for a random number of consecutive trials, each key had a set probability of “paying off,” and the underlying probabilities would change randomly approximately every 20 trials. Subjects were instructed to try to maximize their winnings by finding and choosing the “better” key during any given set of trials, and to switch their choice whenever they suspected the underlying probabilities had changed. Subjects were told there would be easy blocks of trials with high probabilities of pay-off, and hard blocks of trials with low probabilities of pay-off, just as in the Active Experiment. The decision screen was presented until subjects made a choice whereupon a fixation cross was presented for 500 ms, followed by the face feedback for 1000 ms. Trial numbers were increased to 100 trials per block over eight blocks, counterbalanced across blocks in the same manner as in the Passive Experiment.
Subjects were required to report their exact reward earnings count for each set of trials (starting at zero from the last accuracy test), twice per block, for a total of 16 reports. Responses within $0.25 of the correct count were coded as correct; total accuracy was defined as the number of correct reports divided by the number of total reports (16).
EEG data acquisition and analysis
The EEG data were acquired and analyzed, and the dN2 and FRN were assessed as in the Passive and Active experiments.
Results
Behavioral results
Mean accuracy was 90.3% (SD = 11.5%) in the attend-color condition and 84.7% (SD = 18.5%) in the attend-gender condition. We eliminated the data from three subjects for having either attend-color or attend-gender accuracy scores more than 2 SD below the mean. With these subjects eliminated, attend-color accuracy was 92.8% (SD = 7.6%) and attend-gender accuracy was 90.8% (SD = 8.2%). This difference in accuracy was not significant (p > 0.05).
EEG results
The raw ERPs, difference waves and scalp maps are shown in Figure 4. Inspection of the scalp distributions suggest the attend-color dN2 was mostly frontal central (FCz, 4.5 μV) but with a left-lateral-occipital maximum (PO7, −4.6 μV). A two-tailed t-test indicated these channels were not significantly different (p > 0.05). The attend-gender dN2 was maximal at PO8 (−3.2 μV). The impression of a mostly frontal–central attend-color dN2 was supported by the results of 2 × 2 ANOVA on dN2 amplitude with electrode and task as repeated factors. There was an effect of task such that the attend-color dN2 was larger than the attend-gender dN2 (−4.1 vs. −2.5 μV), F(1, 18) = 13.9, p < 0.01, η2 = 0.44, and there was an interaction of task and electrode such that the attend-color dN2 was larger at FCz than P8 (−4.5 vs. −3.7 μV), whereas the attend-gender dN2 was larger at P8 than FCz (−2.9 vs. −2.1 μV), F(1, 18) = 10.0, p < 0.01, η2 = 0.36. One-tailed paired t-tests indicated these differences were significant, attend-color: t(18) = −1.9, p < 0.05; attend-gender: t(18) = 2.7, p < 0.01.
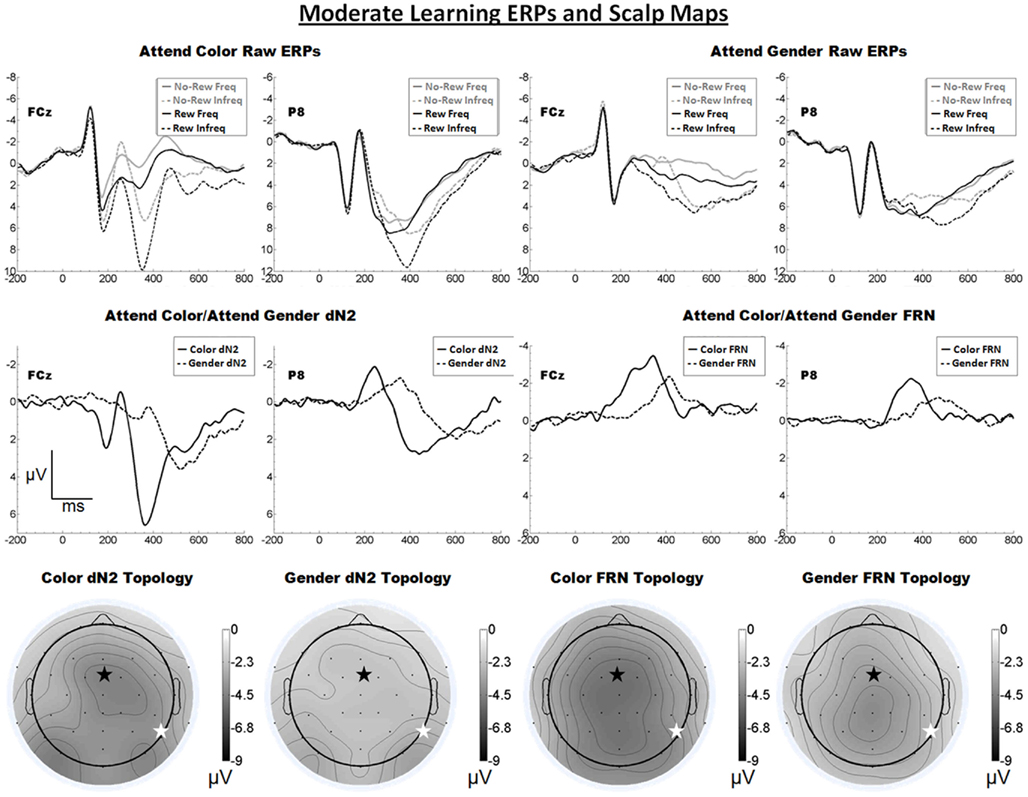
Figure 4. Grand average ERPs for Experiment 3, recorded from channel FCz and P8 (see labels) and scalp distributions associated with the difference waves. The top row shows the “raw” ERPs for each of the frequency by reward conditions across tasks and electrodes. The middle row shows the dN2 and FRN difference waves across task and electrodes. The bottom row shows the scalp distributions of the dN2 and FRN across tasks. The scalp distributions reflect the base-to-peak measure of each of the dN2 and FRN. The black star on the scalp map denotes channel FCz, and the white star denotes P8. Note that negative is plotted up.
By contrast, inspection of the scalp maps in Figure 4 suggests that the attend-color FRN was relatively shallow and maximal at central channels (CPz, −4.6 μV, followed by Pz, −4.5 μV, Cz, −4.5 μV, CP1, −4.5 μV, and FCz, −4.4 μV). The attend-gender FRN was maximal at CPz (−4.2), followed by Cz (−4.0 μV); FCz was the seventh most negative channel (−3.6 μV). Two-tailed t-tests indicated in the attend-color condition the amplitude of the FRN at CPz (where it was maximal) and FCz did not differ significantly (p > 0.05), but in the attend-gender condition the amplitude of the FRN was larger at CPz than FCz, t(18) = 2.6, p < 0.05. A 2 × 2 ANOVA on FRN amplitude revealed an effect of electrode such that the FRN was larger at FCz than at P8 (−4.0 vs. −2.7 μV), F(1, 18) = 10.4, p < 0.01, η2 = 0.37. The effect of task was also significant such that the attend-color task yielded a larger FRN than the attend-gender task (−3.7 vs. −3.0 μV), F(1, 18) = 5.8 p < 0.05, η2 = 0.24. The interaction of electrode and task was not significant (p > 0.05). As in Experiments 1 and 2, we used one-tailed paired samples t-tests comparing FRN amplitude at FCz and P8 in the attend-color and attend-gender conditions. In the attend-color condition, the FRN was significantly larger at FCz than at P8 (−4.4 vs. −2.9 μV), t(18) = −2.9, p < 0.01. In the attend-gender condition, the FRN was also larger at FCz (−3.6 vs. −2.5 μV), t(18) = −2.7, p < 0.01.
Discussion
As predicted, we found that in a task designed to engage the learning system only moderately, a FRN was elicited over central scalp sites irrespective of whether participants attended to the faces or tint of the feedback stimuli. However, the scalp distribution of FRN in the attend-gender distribution was somewhat more parietal than in the attend-color condition, which is indicative of component overlap with the P3; we suggest that the P3 on reward trials was exposed by the reduced FRN in this condition. Also as predicted, the scalp distribution of the dN2 varied between frontal–central and (right) lateral-occipital locations depending on which stimulus attribute participants attended. However, in the attend-color condition the amplitude of the dN2 at left-lateral-occipital location PO7 was comparable to that of FCz. This unexpected anomaly was addressed with the following experiment.
Experiment 4: Control Task
As a control, we ran an additional experiment that followed a more standard approach for eliciting the dN2 and FRN. Namely, we dissociated face processing from color processing entirely by employing the same task as in the Moderate Experiment, but in one condition the stimuli consisted only of yellow and blue colors (without faces), and in a second condition the stimuli consisted of male and female faces (without colors; see Figure 1, Control). In principle, in the previous experiments the mere presence of the information on the unattended dimension could have influenced processing along the attended dimension, thereby disrupting the dN2 or FRN. Thus the control experiment allowed for a pure assessment of these ERP components in a relatively standard oddball task. The Control Experiment was identical to the Moderate Experiment except for this change.
Method
Participants
Nineteen people (five males) participated in this study.
Apparatus and procedure
Stimuli and procedure were exactly the same as in the Moderate Experiment except that in the attend-gender task, monochromatic faces were presented as feedback, and in the attend-color task, blue and yellow rectangles (exact same size as the face stimuli) were presented as feedback (Figure 1, Control).
EEG data acquisition and analysis
The EEG data were acquired and analyzed, and the dN2 and FRN were assessed as in the Passive, Active, and Moderate Experiments.
Results
Behavioral results
Mean accuracy was 94.1% (SD = 9.7%) in the attend-color condition and 88.2% (SD = 16.9%) in the attend-gender condition. We eliminated the data from one subject whose accuracy scores on both the attend-gender and attend-color trials was more than 2 SD below the mean. For the remaining subjects, attend-color accuracy was 95.8% (SD = 6.1%) and attend-gender accuracy was 91.0% (SD = 12.0%). This difference was not significant (p > 0.05).
EEG results
The raw ERPs, difference waves and scalp maps are shown in Figure 5. Inspection of the scalp maps suggests the attend-color dN2 was maximal at frontal–central sites (FCz, −4.8 μV) and the attend-gender dN2 was maximal lateral-occipital sites (PO8, −3.0 μV). This impression was confirmed by a 2 × 2 ANOVA on dN2 amplitude with electrode and task as repeated factors, indicating an effect of task such that the attend-color dN2 was larger than the attend-gender dN2 (−4.3 vs. −2.5 μV), F(1, 17) = 34.0, p < 0.001, η2 = 0.67, and an interaction of task and electrode such that the attend-color dN2 was larger at FCz than P8 (−4.8 vs. −3.8 μV), whereas the attend-gender dN2 was larger at P8 than FCz (−3.0 vs. −2.0 μV), F(1, 17) = 18.0, p < 0.01, η2 = 0.51. One-tailed paired t-tests indicated that these differences were significant, attend-color: t(17) = −2.5, p < 0.05; attend-gender: t(17) = 3.0, p < 0.01.
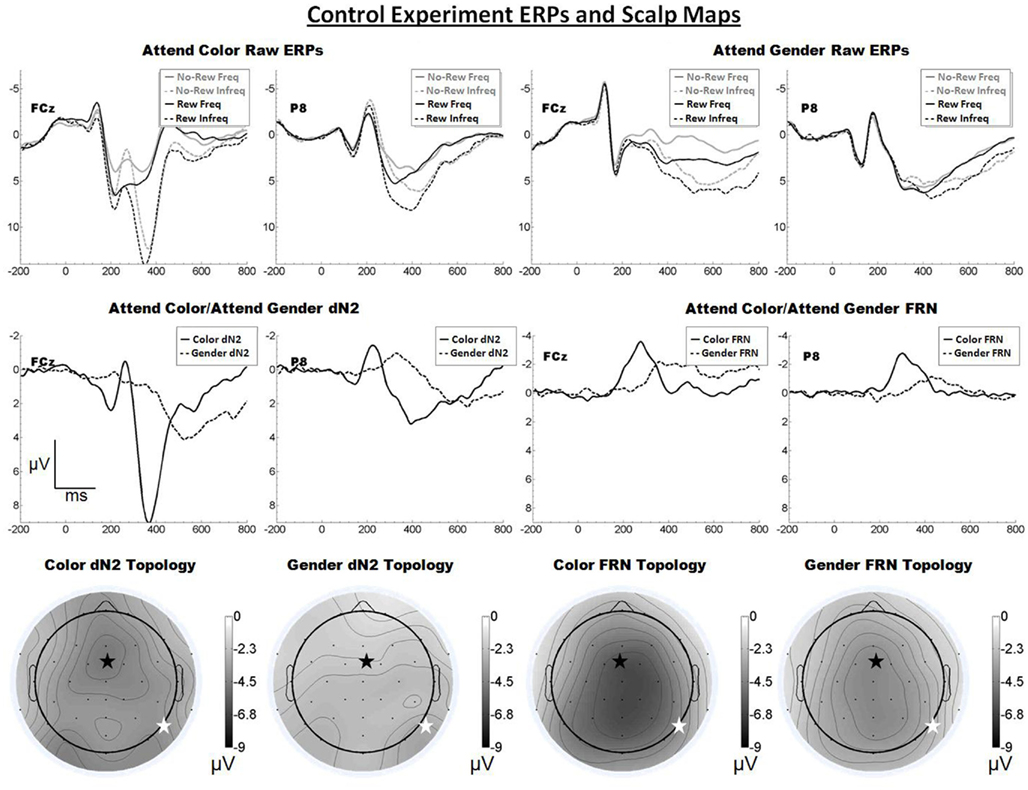
Figure 5. Grand average ERPs for Experiment 4, recorded from channel FCz and P8 (see labels) and scalp distributions associated with the difference waves. The top row shows the “raw” ERPs for each of the frequency by reward conditions across tasks and electrodes. The middle row shows the dN2 and FRN difference waves across task and electrodes. The bottom row shows the scalp distributions of the dN2 and FRN across tasks. The scalp distributions reflect the base-to-peak measure of each of the dN2 and FRN. The black star on the scalp map denotes channel FCz, and the white star denotes P8. Note that negative is plotted up.
By contrast, inspection of the scalp maps in Figure 5 suggests that the attend-color FRN was shallowly distributed over central channels (CPz, −6.5 μV; FCz was the fifth most negative electrode, −6.3 μV). A paired t-test indicated no significant difference between these channels (p > 0.05). The attend-gender FRN also appeared shallowly distributed over central channels (FCz, −4.3 μV, followed by CPz, −4.3 μV). Another paired t-test indicated no significant difference between these channels (p > 0.05). A 2 × 2 ANOVA on FRN amplitude revealed an effect of electrode such that the FRN was larger at FCz than at P8 (−5.3 vs. −3.5 μV), F(1, 17) = 12.8, p < 0.01, η2 = 0.43. The effect of task was also significant (−5.2 vs. −3.6 μV), F(1, 17) = 15.3, p < 0.01, η2 = 0.47, and there was no interaction of electrode and task (p > 0.05). One-tailed paired samples t-tests indicated that the FRN was significantly larger at FCz than P8 in both the attend-color and attend-gender conditions, attend-color: −6.3 vs. −4.1 μV, t(17) = −3.3, p < 0.01; attend-gender:. −4.3 vs. −2.8 μV, t(17) = −3.0, p < 0.01.
Discussion
The Control Experiment confirmed that the scalp distribution of the dN2, but not that of the FRN, is sensitive to the dimension of the eliciting stimulus attended to by the participant. Further, this experiment accounted for the potentially confounding influence of stimulus information along the unattended dimension. The left-lateral-occipital maximum observed in the Moderate Experiment was not reproduced in the Control Experiment, suggesting that inadvertent processing of the irrelevant dimension may have exercised the FFA in the attend-color condition of that experiment. Of course, it is also possible that the left-posterior maximum observed in that condition was simply a statistical fluke.
Between Subjects Analysis (Across Experiments)
Experiments 1–4 confirmed our prediction that the scalp distribution of the FRN would remain frontal central whereas that of the dN2 would change according to task demands. Further, we found that the FRN interfered with the dN2 in conditions where the FRN was large. However, the specific nature of the interference remains to be investigated. To do so, we compared how these components varied across (rather than within) experiments to examine systematically the effects of increasing FRN amplitude on the dN2. For this purpose we focused on the attend-color condition where the effects of the interaction were greatest (because both components in this condition are frontal–central). Furthermore, we compared the results of the Passive, Active, and Moderate Learning Experiments, but not the Control Experiment, as the stimuli in the last experiment deviated from the first three and thus are not fully comparable. Finally, to investigate the specific mechanism driving changes in the FRN and dN2 across experiments, we assessed the base-to-peak amplitude of “raw” N2 in each of the four conditions separately: Frequent reward, frequent no-reward, infrequent reward, and infrequent no-reward. We predicted that, all other things being equal, the raw N2 would be larger to infrequent relative to frequent events (due to NE activity), but that this increase would be attenuated in the case of infrequent rewards (due to overlap with the DA-driven reward positivity).
Method
We began with an across-experiment comparison of dN2 and FRN amplitudes. (It should be noted that these experiments were performed sequentially, rather than treated as three counterbalanced conditions within a single experiment). To analyze the raw N2s for each of the four reward by frequency conditions for each experiment, we quantified the size of the raw-N2 base-to-peak as the change in voltage between the peak of the raw P2 and the peak of the raw N2. The N2 peak was assessed as the maximum negative amplitude in the ERP between 200 and 300 ms after onset of the feedback stimulus, and the raw P2 peak was assessed as the maximum positive voltage between 100 ms after onset of the feedback stimulus and the latency of the N2 peak for each subject and condition.
Lastly, we normalized N2 amplitude across subjects to assess within-subject variance in raw-N2 amplitude across conditions. To do so, we converted the raw-N2 values to z-scores as follows: For each subject, we determined the mean and SD of the raw-N2 values across the infrequent no-reward, infrequent reward, frequent no-reward, and frequent reward conditions. We then divided the difference between each raw-N2 value and the mean raw-N2 value by the SD of the raw-N2 values [see Figure 7 for raw (top) and normalized (bottom) means].
Results
A 3 × 2 mixed ANOVA with component (dN2 vs. FRN) as a repeated factor and Experiment (1–3) as a between subjects factor revealed a significant main effect of component such that the FRN was larger than the dN2 (−5.1 vs. −4.0 μV), F(1, 56) = 6.4, p < 0.05, η2 = 0.10. There was also an interaction of experiment and component indicating that the FRN and dN2 changed in different ways across experiments, F(3, 56) = 10.2, p < 0.001, η2 = 0.27 (Figure 6). The between subjects effect of experiment was not significant (p > 0.05).
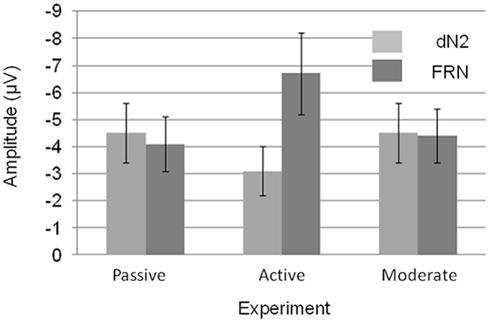
Figure 6. Mean dN2 and FRN base-to-peak amplitudes across experiments. Note that negative is plotted up. Error bars represent 95% within subjects confidence intervals.
We decomposed the interaction of component and experiment with a set of three two-tailed independent samples t-tests (exp. 1 vs. exp. 2, exp. 1 vs. exp. 3, exp. 2 vs. exp. 3) for each component. The dN2 was larger in the Passive Experiment than in the Active Experiment (−4.5 vs. −3.1 μV), t(38) = 2.0, p = 0.05. The dN2 in the Moderate Experiment (−4.5 μV) was not significantly different than in the Passive Experiment (p > 0.05). The dN2 in the Moderate Experiment trended toward being significantly larger than the dN2 in Active Experiment, t(37) = 1.9, p < 0.10. By contrast, the FRN exhibited a different pattern across experiments. The FRN in the Active Experiment was significantly larger than in the Passive Experiment (−6.7 vs. −4.1 μV),t(38) = 3.0, p < 0.01, and also significantly larger than the FRN in the Moderate Experiment (−4.4 μV), t(37) = −2.5, p < 0.05, whereas the FRN between the Passive and Moderate Experiments did not differ significantly (p > 0.05). Levene’s test for equality of variances was significant for the FRN comparison between the Passive and Active, and Active and Moderate Experiments, but the difference remained significant when the correction was applied (p < 0.01, p < 0.05, respectively). These results suggest that the Active Experiment was the critical experiment for demonstrating a change in the dN2 and FRN across experiments: The dN2 was smallest in the Active Experiment and similar between the Passive and Moderate Experiments, whereas the FRN was largest in Active Experiment and similar between the Passive and Moderate Experiments.
To investigate what caused the changes in the dN2 and FRN amplitudes across experiments, we examined the normalized “raw” N2 values (see Methods). We subjected raw-N2 z-scores (Figure 7, bottom) to a 2 × 2 × 3 mixed ANOVA with reward condition (reward vs. no-reward), frequency condition (infrequent vs. frequent) as repeated factors, and Experiment (1–3) as a between subjects factor. This analysis revealed a main effect of reward condition such that rewards produced a less negative raw N2 than no-rewards, F(1, 56) = 19.5, p < 0.001, η2 = 0.26, and a main effect of frequency condition such that the infrequent raw N2 was more negative than the frequent raw N2, F(1, 56) = 27.3, p < 0.001, η2 = 0.33. There was also an interaction of reward condition and frequency condition such that the effect of reward was larger in the infrequent condition than in the frequent condition, F(1, 56) = 6.1, p < 0.05, η2 = 0.10. In addition, experiment interacted with both reward condition,F(2, 56) = 3.6, p < 0.05, η2 = 0.11, and frequency condition, F(2, 56) = 4.7, p < 0.05, η2 = 0.14, such that the difference between frequent and infrequent normalized raw N2s was smallest, and the difference between reward and no-reward normalized raw N2s was largest in the Active Experiment.
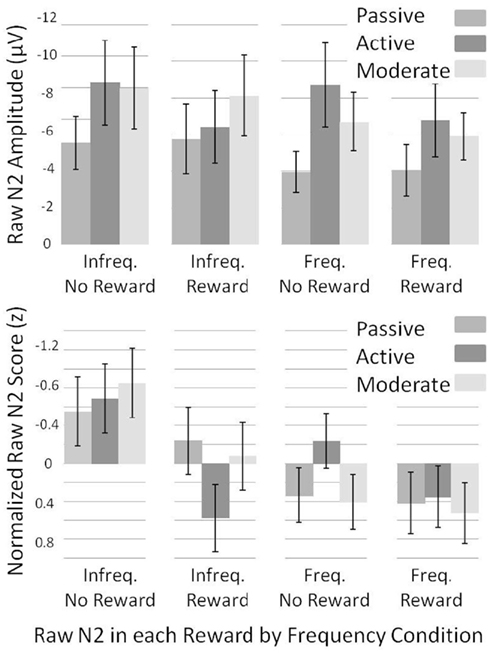
Figure 7. Normalized (bottom) and un-normalized (top) raw-N2 z-scores and amplitudes across experiments for each of the frequency by reward conditions. Note that negative is plotted up. Error bars represent 95% confidence intervals for the mean of each condition by experiment.
We used independent samples t-tests on normalized raw-N2 values to uncover which of the four normalized raw N2s (infrequent no-reward, infrequent reward, frequent no-reward, and frequent reward) best accounted for the change in the FRN and dN2 across experiments (Figure 7, bottom). The infrequent, no-reward raw N2 was similar across experiments (all ps > 0.05), as was the frequent, reward raw N2 (all ps > 0.05). The frequent, no-reward raw N2 was significantly larger in the Active Experiment than in the Passive Experiment, t(38) = −3.0, p < 0.01, whereas the infrequent, reward raw N2 was significantly smaller in the Active Learning than Passive Experiment, t(38) = −3.1, p < 0.005. Results were the same in comparing the Active Experiment with the Moderate Experiment: The frequent, no-reward raw N2 was larger in the Active Experiment, t(37) = −3.1, p < 0.005, whereas the infrequent reward raw N2 was smaller in Active Experiment, t(37) = 2.9, p < 0.01. There were no significant differences between the Passive Learning and Moderate Experiments (all ps > 0.05). These results suggest that the apparent need for greater deliberative strategy in the Active Experiment produced a larger negativity to frequent no-reward trials, and a greater attenuation of the raw N2 on infrequent reward trials.
Discussion
We examined how challenging subjects with an involving learning and decision-making task impacted dN2 and FRN amplitude across experiments. We demonstrated that across three experiments, the task that most engaged a deliberative learning strategy enhanced the FRN and simultaneously attenuated the dN2, albeit the latter finding only trended toward statistical significance for the comparison between the Active vs. Moderate Experiments. We also examined the raw N2s that underlie the dN2 and FRN as a function of frequency, reward, and learning engagement. We converted the raw-N2 values to z-scores to control for between subjects variability in the overall size of the raw N2, and then analyzed how the normalized N2s for each of the frequent reward, frequent no-reward, infrequent reward, and infrequent no-reward conditions changed across experiments according to task demands. Independent samples t-tests on raw-N2 z-scores indicated that the larger FRN and smaller dN2 in the Active Learning experiment were driven both by a larger raw N2 to frequent no-rewards and greater attenuation of the raw N2 to infrequent rewards compared to the Passive Learning and Moderate Experiments. These contrasting changes worked synergistically to increase the amplitude of the FRN but against each other to decrease the amplitude of the dN2.
General Discussion
The modified LC–P3 theory holds that the dN2 is produced by the impact of a brief, cortex-wide increase in cortical NE due to phasic LC firing in response to infrequent, task-relevant events. In support of this, we demonstrated that the dN2 exhibits a scalp distribution that changes according to task specifics in a manner consistent with a noradrenergic origin. Furthermore, the modified LC–P3 theory and the reinforcement learning theory of the FRN together hold that the dN2 and FRN are driven independently by modulation of the raw N2 at frontal–central channels by both the NE system and the DA system. We suggest that whereas NE amplifies the raw N2, DA depresses it, such that these influences interfere with one another in producing scalp potentials over anterior regions of the scalp. We demonstrated that factors which exercise learning and decision-making systems enhance the FRN but attenuate the dN2. Furthermore, we provided evidence that these changes in the FRN and dN2 are driven most strongly by an enhanced negativity to frequent no-rewards and an attenuated positivity to infrequent rewards.
As the name indicates, our account of the relationship between NE system activity and the dN2 is a modification of the original LC–P3 theory (Nieuwenhuis et al., 2005a). Below we review the LC–P3 theory in detail and provide the motivation for our modification to it.
The Original LC–P3 Theory
The P3 is a positive deflection in the ERP typically peaking ∼300–500 ms after the eliciting stimulus. It has a broad, parietal scalp distribution that is thought to represent the summation of activity in multiple, dispersed neural generators (e.g., Johnson, 1993). Nieuwenhuis et al. (2005a) characterize four main categories of conditions that influence P3 amplitude: Subjective probability (unexpected events elicit a larger P3 than expected events), motivational salience (targets elicit a larger P3 than distracters), applied attention (attended stimuli elicit a larger P3 than ignored stimuli, and targets elicit a larger P3 under conditions that demand full attention compared to dual-task conditions), and attention-capturing stimuli (task-irrelevant stimuli that are highly deviant from the stimulus context elicit a larger P3 than less deviant stimuli).
The LC–P3 theory (Nieuwenhuis et al., 2005a) proposes that the P3 is an electrophysiological manifestation of cortex-wide noradrenergic modulation through the LC efferent projection system. In support of the LC–P3 theory, Nieuwenhuis and colleagues presented a comprehensive review of the literature, marshaling abundant evidence that conditions antecedent to phasic LC firing are the same as those conditions that exercise the P3. Additionally, Nieuwenhuis et al. (2005a) refer to psychopharmacological and animal lesion studies for support for the link between the P3 and noradrenergic modulation. By and large, noradrenergic agonists such as clonidine and direct lesions of the LC have been reported to reduce the amplitude of a P3-like potential observed in monkeys (e.g., Pineda et al., 1989; Pineda and Westerfield, 1993; Swick et al., 1994), and Halliday et al. (1994) found that clonidine reduced the amplitude of the P3 in human subjects.
Issues with the Original LC–P3 Theory
The LC–P3 theory possesses considerable explanatory power and accounts for a wide range of existing data. However, two issues warrant further examination. First, neurophysiological evidence indicates that the NE phasic burst arrives in cortex too early to produce the P3 directly. Aston-Jones and Cohen (2005) suggest NE should reach the cortex within approximately 170 ms of target onset, but the P3 typically does not begin for another 50 ms until about 220 ms following target onset (and reaches maximum amplitude from about 300 to 600 ms post-stimulus). Thus there is greater than a 50-ms discrepancy between the time of NE arrival in cortex and the onset of the P3. Although this estimate of the timing of NE arrival is based on single-cell recordings in monkeys, Aston-Jones et al. (1985) demonstrated that conduction speeds in NE-releasing neurons vary across species such that the actual timing of NE arrival in cortex is relatively preserved despite varying axonal distances. Further, P3 onset sometimes occurs after motor response initiation suggesting that the underlying mechanism does not directly implement the stimulus–response mapping (as would be expected if it reflected a signal detection process mediated by the LC) but rather is involved in a subsequent, related process (Ritter et al., 1979; Duncan-Johnson and Donchin, 1982; Krigolson et al., 2008). For example, Krigolson et al. (2008) found that when a target changed location in a continuous tracking task, participants adjusted their motor behavior accordingly even before the change in target location elicited the P3. In contrast, studies in monkeys indicate that (unlike the P3) phasic LC activity consistently precedes behavioral responding and has been strongly associated with processes that lead to the response (e.g., Clayton et al., 2004; Rajkowski et al., 2004).
A second issue with the original LC–P3 theory is related to the “attentional blink,” a deficit in stimulus processing attributed to the LC refractory period (e.g., Usher et al., 1999; Nieuwenhuis et al., 2005a,b; Warren et al., 2009). When two targets are embedded within a rapid serial visual presentation task, the first target can be reported with high accuracy but the second target is reported with significantly worse accuracy if it is presented within a window 200–600 ms after onset of the first target (Raymond et al., 1992); spared accuracy for the second target when it appears within 200 ms of onset of the first is termed “lag-1 sparing.” Nieuwenhuis et al. (2005a,b) argued that the properties of the NE system could account for the attentional blink: They proposed that the onset of the first-target elicits NE system phasic response, with the subsequent flood of NE to the cortex benefiting processing of the first target, and also the second target if the second target is presented within ∼100 ms of the first – thus accounting for lag-1 sparing. After this initial period of effective target processing (∼200 ms from onset of the first target to offset of a second-target presented 100 ms later), the LC is inhibited and cortical levels of NE are not sufficient to process effectively any targets presented 200–600 ms after onset of the first target – accounting for the attentional blink. Consistent with this proposal, McArthur et al. (1999) showed a significant negative correlation between the amplitude of the first-target P3 and second-target accuracy, such that the size and temporal profile of any subject’s attentional blink mirrored the size and temporal profile of that subject’s first-target P3; according to the LC–P3/LC-AB theories, larger bursts of NE to the first target result in larger P3s, followed by a relatively deep or extended refractory periods that produces a larger attentional blink.
Nevertheless, this proposal raises the question: If the P3 reflects the NE burst, which should facilitate stimulus processing, then why does the P3 peak during the period of the attentional blink (between 300 and 500 ms after the first target), which by definition is a period of impaired stimulus processing? Instead, one might predict that the electrophysiological manifestation of NE activity would precede the attentional blink, during the time of effective of stimulus processing associated with lag-1 sparing.
The Modified LC–P3 Theory
Nieuwenhuis and colleagues provide alternative explanations for these apparent discrepancies within the LC–P3 account (see Nieuwenhuis et al., 2005b; Nieuwenhuis and Jepma, 2010). However, the assumption that the dN2 (rather than the P3) reflects the LC-induced enhancement of cortical processing eliminates these issues outright. This modification accounts for the two issues above as follows. First, it aligns the timing of the putative ERP response to NE activity (the dN2, occurring at about 200 ms post-stimulus, as opposed to the P3, which occurs about 300–600 ms post-stimulus) with the actual timing of the phasic NE signal (about 170 ms post-stimulus). Furthermore, unlike P3 onset, the onset of the N2 consistently precedes the overt behavior (e.g., Krigolson et al., 2008); in fact, detailed analyses of RT data to compatible stimuli in a speeded response compatibility task suggests that stimulus information begins to impact the response selection mechanism at about 170 ms post-stimulus (during N2 onset) and exerts the maximal impact on the response selection process about 250 ms post-stimulus (during N2 maximum; Holroyd et al., 2005). Second, the modified theory associates the P3 with the period of impaired cortical processing due to NE depletion (rather than abundance), which corresponds to the time profile of the attentional blink. Additionally, the modified theory provides an ERP correlate of both NE abundance (the dN2) and NE depletion (the P3) in the cortex and naturally accounts for the evidently close relationship between the two ERP components, because the duration of the refractory period of the LC (P3) is directly related to the size of the initial NE burst (N2).
Critically, the evidence reviewed by Nieuwenhuis et al. (2005a) as support for the original LC–P3 theory applies equally well to the modified LC theory. For example, the amplitudes of both the P3 and the N2 are sensitive to the same factors: The P3 is typically preceded by the N2, and in early studies of the impact of stimulus probability on the ERP, these two ERP components were collectively termed the N2/P3 complex because of their tendency to co-vary in amplitude and latency (e.g., Duncan-Johnson and Donchin, 1977; see also Ritter et al., 1979). In fact, all of the antecedent conditions noted by Nieuwenhuis and colleagues to apply to both P3 amplitude and LC phasic activity also apply to N2 amplitude. Thus, both N2 amplitude and P3 amplitude increase with increasing unexpectedness of a task-relevant event, and both are larger to targets than non-targets (e.g., Courchesne et al., 1975; Squires et al., 1975, 1976; Simson et al., 1976; Duncan-Johnson and Donchin, 1977; Ritter et al., 1979; Nieuwenhuis et al., 2003). Both also scale to the amount of attention paid to a stimulus, with a larger N2 and larger P3 to attended vs. unattended stimuli, and to attention-capturing/highly deviant stimuli vs. less deviant stimuli (Hillyard et al., 1971; Courchesne et al., 1975; Squires et al., 1975, 1977; Ford et al., 1976; Daffner et al., 2000a,b; Folstein et al., 2008).
Interaction of the NE and DA Systems
The reinforcement learning theory of the FRN holds that DA dips and bursts modulate ongoing activity in the ACC. Specifically, reward feedback elicits a phasic burst of DA that produces a positivity in the ERP typically between 200 and 300 ms of the eliciting stimulus (Holroyd et al., 2008), whereas no-reward feedback elicits a dip in DA that produces a negative deflection in the same time range (Holroyd and Coles, 2002). Furthermore, the theory holds that DA signals scale according to the degree of expectedness of the feedback, such that infrequent rewards elicit a larger DA burst and reward positivity than frequent rewards, and infrequent no-rewards elicit larger DA dips and negative deflections than frequent no-rewards. Critically, the theory proposes that the FRN reflects DA-dependent modulation of ACC activity but does not specify exactly what neural process is being modulated. However, empirical evidence suggests that the ACC produces a negative deflection (the N2) that perhaps reflects response conflict or a related stimulus/response decision-making process (e.g., Botvinick et al., 2001). Thus it has been argued that the reward positivity elicited by phasic DA activity attenuates the N2 produced in the ACC (Holroyd, 2004; Holroyd et al., 2008). The proposal that dopamine dips increase N2 amplitude by disinhibiting ACC activity has remained unconfirmed (Holroyd and Coles, 2002), perhaps because phasic decreases from baseline DA activity are relatively shallow when compared to the relatively large increases in DA activity associated with phasic bursts.
According to the modified LC–P3 theory, infrequent events elicit a phasic release of NE that enhances cortical processing and produces an amplified negative deflection in the ERP between about 200 and 300 ms after onset of the eliciting stimulus. Critically, NE modifies activity in the same time range as the putative DA signals, including ACC activity when it is present. According to this position, increased NE gives rise to a larger N2 produced in the ACC. Thus, the two factors push and pull the frontal–central N2 associated with ACC activity up and down.
Here we examined the interaction of the NE and DA systems by including both a frequency and reward manipulation within the same experiment. We hold that frequency insofar as it relates to the expectedness of reward or no-reward has an effect on the DA system independent of its effect on the NE system. For the NE system, infrequent events consistently increase NE release and the associated negativity, whereas for the DA system infrequent rewards produce a relatively large burst in DA and associated positivity and infrequent no-rewards elicit a relatively large dip in DA and an associated negativity. Consistent with this, we observed a significant interaction of frequency and reward such that the difference in N2 amplitude between reward and no-reward was larger when rewards and no-rewards were infrequent relative to when they were frequent. This replicates previous work on the effect of reward-expectedness on the FRN (Holroyd et al., 2003, 2009; Hajcak et al., 2007; Baker and Holroyd, 2009).
We further examined the interaction of the NE and DA systems by systematically manipulating the degree of participant engagement in reward tasks – and by extension putatively the degree of DA system engagement – across three experiments. In keeping with the reinforcement learning theory of the FRN, we predicted that the enhanced FRN in the Active Experiment would be driven by both a greater attenuation of the raw N2 to reward feedback and by a greater enhancement of the raw N2 on no-reward trials. Consistent with this, independent samples t-tests on normalized raw-N2 amplitude indicated that in the Active Experiment, the raw N2 to infrequent reward feedback was significantly smaller than the raw N2 to infrequent reward feedback in both the Passive and Moderate Experiments, suggesting that greater DA system engagement resulted in a larger DA-associated positivity that attenuated the raw N2. Similarly, the raw N2 to frequent no-reward feedback was significantly larger in the Active experiment than in the Passive and Moderate Experiments, suggesting a larger DA dip enhanced the raw N2 in the Active Experiment. These differences cannot be attributed to greater engagement of the NE system in the Active Experiment (rather than greater DA system engagement) because greater NE release would have produced a larger negativity to infrequent reward feedback.
The finding of a decrease in the amplitude of the raw-N2 to infrequent reward feedback in the Active Experiment relative to the other experiments is expected in light of previous work associating reward processing with a positive deflection in the ERP that attenuates the N2 (e.g., Holroyd et al., 2008; Baker and Holroyd, 2011). However, the finding of an increased raw N2 to frequent no-reward feedback in the Active Experiment relative to the other experiments to our knowledge constitutes the first evidence of an increased negative deflection elicited by no-reward feedback. Although the reinforcement learning theory of the FRN holds that brief decreases in DA activity in response to unexpected no-reward feedback increase the amplitude of a negative deflection in the ERP (Holroyd and Coles, 2002), the FRN difference-wave approach cannot determine whether the difference between the ERPs is due to a positivity to rewards, a negativity to no-rewards, or both (Holroyd et al., 2008). Our results indicate that the raw N2 is increased to no-reward feedback as predicted by the reinforcement learning theory of the FRN (Holroyd and Coles, 2002), especially under conditions that demand high task engagement.
The raw N2s to infrequent no-rewards and frequent rewards were not statistically different between the Active Experiment and either of the Passive or Moderate Experiments. This raises the question: Why are frequent no-rewards and infrequent rewards particularly sensitive to changes in deliberative strategy, whereas infrequent no-rewards and frequent rewards are relatively insensitive? The answer may have to do with the fact that both the infrequent no-reward feedback and the frequent reward feedback always occurred in the same blocks of trials. In this context rewards accumulated frequently (and therefore no-rewards were infrequent). Perhaps this condition of the Active Experiment is much like the Passive and Moderate experiments, in the sense that subjects could disengage from the task because it was apparently easy. By contrast, subjects would have remained engaged in the blocks where rewards were infrequent and no-rewards frequent. Hence with increasing engagement of learning and decision systems across experiments, subjects may have been similarly unmoved to rewards and no-rewards in easy blocks but differentially reactive to rewards and no-rewards in difficult blocks.
Other Issues
These experiments were intended to exercise the system that produces the FRN differentially – most in the Active Experiment, least in the Passive Experiment, and to an intermediate degree in the Moderate Experiment2. Note that the Active Experiment was characterized by 15 potentially learnable relationships whereas the Moderate Experiment was characterized by only two such relationships (left button vs. right button). Thus although the degree of engagement in the Moderate Experiment was likely larger than in the Passive Experiment, this difference may have been small relative to the Active Experiment.
A second notable issue is the fact that the base-to-peak measure of the raw N2s can fail to capture some variability in the ERP due specifically to the reward positivity. That is, the base-to-peak method is insensitive to positive deflections that go beyond attenuating the N2 to create a positive deflection in the same time range: The most positive value for the raw N2 that can be assessed is 0 μV, because the algorithm finds the most negative value in the N2 time window and subtracts from that the most positive value preceding it. Despite this limitation, the method nevertheless yielded significant differences in the raw N2 across experiments that confirmed our hypotheses.
Finally, we observed a main effect of task such that the attend-color dN2 was larger than the attend-gender dN2, and the attend-color FRN was larger than the attend-gender FRN. This is a replication of our previous dN2 results (Warren et al., 2011). We interpret this effect as being due to both increased latency jitter in the attend-gender condition because of longer categorization latency, and also lower accuracy and confidence in the attend-gender condition, a factor known to attenuate the dN2 (Hillyard et al., 1971).
Conclusion
Both the NE system and the DA system modulate processing in the ACC. However, whereas the NE system includes the ACC among many cortical targets, innervation by the DA system of frontal midline cortex is especially great. Consistent with this distinction, we demonstrated that the dN2, an ERP component that we propose reflects noradrenergic modulation of cortical activity, exhibits a scalp distribution that is maximal at varying locations dependent on the relative engagement of specific cortical areas. By contrast, the FRN, which has been associated with DA system activity, is consistently maximal at scalp locations over the ACC. Furthermore, we demonstrated that under conditions in which the DA system should be highly engaged – specifically, in an apparently complex learning and decision-making task – the neural processes underlying the FRN and dN2 appeared to interfere with one another such that the FRN was enhanced and the dN2 was attenuated. Finally, we demonstrated that negative feedback stimuli (i.e., feedback associated with the absence of a potential reward) were associated with a negative deflection in the ERP that was larger than the raw-N2 typically elicited by motivationally salient events. Taken together, these results paint a picture of two neuromodulatory systems that have relatively independent effects on the ERP despite considerable overlap in the space and time domains as well as shared antecedent conditions. The ACC seems to be at the center of this overlap: recruiting the NE system, which in turn facilitates processing by the ACC and other brain areas, and utilizing DA bursts and dips for the purpose of adaptive decision making. These considerations suggest the ACC plays a crucial role in both fast and efficient processing of task-relevant events and adaptive decision making based on a reinforcement history implemented by the DA system.
Conflict of Interest Statement
The authors declare that the research was conducted in the absence of any commercial or financial relationships that could be construed as a potential conflict of interest.
Footnotes
- ^As opposed to the potassium-mediated refractory period common to individual neurons throughout the brain.
- ^In fact, a linear regression analysis not reported here demonstrated FRN amplitude was significantly predicted by task engagement across experiments, while the dN2 exhibited a trend toward the inverse relationship.
References
Aston-Jones, G., and Cohen, J. D. (2005). An integrative theory of locus coeruleus-norepinephrine function: adaptive gain and optimal performance. Annu. Rev. Neurosci. 28, 403–450.
Aston-Jones, G., Foote, S. L., and Segal, M. (1985). Impulse conduction properties of noradrenergic locus coeruleus axons projecting to monkey cerebrocortex. Neuroscience 15, 765–777.
Baker, T. E., and Holroyd, C. B. (2009). Which way do I go? Neural activation in response to feedback and spatial processing in a virtual T-maze. Cereb. Cortex 19, 1708–1722.
Baker, T. E., and Holroyd, C. B. (2011). Dissociated roles of the anterior cingulate cortex in reward and conflict processing as revealed by the feedback error-related negativity and N200. Biol. Psychol. 87, 25–34.
Berridge, C. W., and Waterhouse, B. D. (2003). The locus coeruleus-noradrenergic system: modulation of behavioral state and state-dependent cognitive processes. Brain Res. Rev. 42, 33–84.
Botvinick, M., Braver, T., Barch, D., Carter, C., and Cohen, J. (2001). Conflict monitoring and cognitive control. Psychol. Rev. 108, 624–652.
Clayton, E. C., Rajkowski, J., Cohen, J. D., and Aston-Jones, G. (2004). Phasic activation of monkey locus ceruleus neurons by simple decisions in a forced-choice task. J. Neurosci. 24, 9914–9920.
Courchesne, E., Hillyard, S. A., and Galambos, R. (1975). Stimulus novelty, task relevance and the visual evoked potential in man. Electroencephalogr. Clin. Neurophysiol. 39, 131–143.
Daffner, K. R., Mesulam, M. M., Scinto, L. F. M., Calvo, V., Faust, R., and Holcomb, P. J. (2000a). An electrophysiological index of stimulus unfamiliarity. Psychophysiology 37, 737–747.
Daffner, K. R., Scinto, L. F. M., Calvo, V., Faust, R., Mesulam, M. M., West, W. C., and Holcomb, P. J. (2000b). The influence of stimulus deviance on electrophysiologic and behavioral responses to novel events. J. Cogn. Neurosci. 12, 393–406.
Duncan-Johnson, C., and Donchin, E. (1977). On quantifying surprise: the variation of event-related potentials with subjective probability. Psychophysiology 14, 456–467.
Duncan-Johnson, C., and Donchin, E. (1982). The P300 component of the event-related brain potential as an index of information processing. Biol. Psychol. 14, 1–52.
Folstein, J. R., and Van Petten, C. (2007). Influence of cognitive control and mismatch on the N2 component of the ERP: a review. Psychophysiology 45, 152–170.
Folstein, J. R., Van Petten, C., and Rose, S. A. (2008). Novelty and conflict in the categorization of complex stimuli. Psychophysiology 45, 467–479.
Ford, J. M., Roth, W. T., and Kopell, B. S. (1976). Auditory evoked potentials to unpredictable shifts in pitch. Psychophysiology 13, 32–39.
Gehring, W. J., and Willoughby, A. R. (2002). The medial frontal cortex and the rapid processing of monetary gains and losses. Science 295, 2279–2282.
Gilzenrat, M., Holmes, B., Rajkowski, J., Aston-Jones, G., and Cohen, J. (2002). Simplified dynamics in a model of noradrenergic modulation of cognitive performance. Neural Netw. 15, 647–663.
Gratton, G., Coles, M., and Donchin, E. (1983). A new method for off-line removal of ocular artifact. Electroencephalogr. Clin. Neurophysiol. 55, 468–484.
Hajcak, G., Moser, J., Holroyd, C. B., and Simons, R. F. (2007). It’s worse than you thought: the feedback negativity and violations of subjective expectancy. Psychophysiology 44, 905–912.
Halliday, R., Naylor, H., Brandeis, D., Callaway, E., Yano, L., and Herzig, K. (1994). The effect of D-amphetamine, clonidine, and yohimbine on human information processing. Psychophysiology 31, 331–337.
Hewig, J., Trippe, R. H., Hecht, H., Coles, M. G. H., Holroyd, C. B., and Miltner, W. H. R. (2007). Decision making in blackjack: an electrophysiological analysis. Cereb. Cortex 17, 865–877.
Hillyard, S. A., Squires, K. C., Bauer, J. W., and Lindsay, P. H. (1971). Evoked potential correlates of auditory signal detection. Science 172, 1357–1360.
Holroyd, C. B. (2004). “A note on the oddball N200 and the feedback ERN,” in Errors, Conflicts, and the Brain: Current Opinions on Performance Monitoring, eds M. Ullsperger and M. Falkenstein (Leipzig: MPI of Cognitive Neuroscience), 211–218.
Holroyd, C. B., and Coles, M. G. H. (2002). The neural basis of human error processing: reinforcement learning, dopamine, and the error-related negativity. Psychol. Rev. 109, 679–709.
Holroyd, C. B., and Krigolson, O. E. (2007). Reward prediction error signals associated with a modified time estimation task. Psychophysiology 44, 913–917.
Holroyd, C. B., Krigolson, O. E., Baker, R., Lee, S., and Gibson, J. (2009). When is an error not a prediction error? An electrophysiological investigation. Cogn. Affect. Behav. Neurosci. 9, 59–70.
Holroyd, C. B., Pakzad-Vaezi, K. L., and Krigolson, O. E. (2008). The feedback correct-related positivity: sensitivity of the event-related brain potential to unexpected positive feedback. Psychophysiology 45, 688–697.
Holroyd, C. B., Yeung, N., Coles, M. G. H., and Cohen, J. D. (2005). A mechanism for error detection in speeded response time tasks. J. Exp. Psychol. 154, 163–191.
Holroyd, C. B., Nieuwenhuis, S., Yeung, N., and Cohen, J. D. (2003). Errors in reward prediction are reflected in the event-related brain potential. Neuroreport 14, 2481–2484.
Johnson, R. Jr. (1993). On the neural generators of the P300 component of the event-related potential. Psychophysiology 30, 90–97.
Krigolson, O. E., Holroyd, C. B., Van Gyn, G., and Heath, M. (2008). Electroencephalic correlates of target and outcome errors. Exp. Brain Res. 190, 401–411.
Li, P., Han, C., Lei, Y., Holroyd, C. B., and Li, H. (2011). Responsibility modulates neural mechanisms of outcome processing: an ERP study. Psychophysiology 48, 1129–1133.
McArthur, G., Budd, T., and Michie, P. (1999). The attentional blink and P300. Neuroreport 10, 3691–3695.
Miltner, W. H. R., Braun, C. H., and Coles, M. G. H. (1997). Event-related brain potentials following incorrect feedback in a time-estimation task: evidence for a “generic” neural system for error detection. J. Cogn. Neurosci. 9, 788–798.
Miltner, W. H. R., Lemke, U., Weiss, T., Holroyd, C. B., Scheffers, M. K., and Coles, M. G. H. (2003). Implementation of error-processing in the human anterior cingulate cortex: a source analysis of the magnetic equivalent of the error-related negativity. Biol. Psychol. 64, 157–166.
Nieuwenhuis, S., Aston-Jones, G., and Cohen, J. D. (2005a). Decision making, the P3, and the locus coeruleus – norepinephrine system. Psychol. Bull. 131, 510–532.
Nieuwenhuis, S., Gilzenrat, M. S., Holmes, B. D., and Cohen, J. D. (2005b). The role of the locus coeruleus in mediating the attentional blink: a neurocomputational theory. J. Exp. Psychol. Gen. 134, 291–307.
Nieuwenhuis, S., de Geus, E. J., and Aston-Jones, G. (2011). The anatomical and functional relationship between the P3 and autonomic components of the orienting response. Psychophysiology 48, 162–175.
Nieuwenhuis, S., and Jepma, M. (2010). “Investigating the role of the noradrenergic system in human cognition,” in Decision Making, Attention & Performance, Vol. XXIII, eds T. Robbins, M. Delgado, and E. Phelps (Oxford: Oxford University Press), 367–385.
Nieuwenhuis, S., van Nieuwpoort, I. C., Veltman, D. J., and Drent, M. L. (2007). Effects of the noradrenergic agonist clonidine on temporal and spatial attention. Psychopharmacology (Berl.) 193, 261–269.
Nieuwenhuis, S., Yeung, N., van den Wildenberg, W., and Ridderinkhof, K. R. (2003). Electrophysiological correlates of anterior cingulate function in a go/no-go task: effects of response conflict and trial type frequency. Cogn. Affect. Behav. Neurosci. 3, 17–26.
Peterson, D. A., Lotz, D. T., Halgren, E., Sejnowski, T. J., and Poizner, H. (2011). Choice modulates the neural dynamics of prediction error processing during rewarded learning. Neuroimage 54, 1385–1394.
Pineda, J. A., Foote, S. L., and Neville, H. J. (1989). Effects of locus coeruleus lesions on auditory, long-latency, event-related potentials in monkey. J. Neurosci. 9, 81–93.
Pineda, J. A., and Westerfield, M. (1993). Monkey P3 in an “oddball” paradigm: pharmacological support for multiple neural sources. Brain Res. Bull. 31, 689–696.
Rajkowski, J., Majczynski, H., Clayton, E., and Aston-Jones, G. (2004). Activation of monkey locus coeruleus neurons varies with difficulty and behavioral performance in a target detection task. J. Neurophysiol. 92, 361–371.
Raymond, J. E., Shapiro, K. L., and Arnell, K. M. (1992). Temporary suppression of visual processing in an RSVP task: an attentional blink? J. Exp. Psychol. Hum. Percept. Perform. 18, 849–860.
Ritter, W., Simson, R., Vaughan, H. G., and Friedman, D. (1979). A brain event related to the making of a sensory discrimination. Science 203, 1358–1361.
Schultz, W., Dayan, P., and Montague, P. R. (1997). A neural substrate of prediction and reward. Science 275, 1593–1599.
Servan-Schreiber, D., Printz, H., and Cohen, J. D. (1990). A network model of catecholamine effects: gain, signal-to-noise ratio, and behavior. Science 249, 892–895.
Simson, R., Vaughan, H. G., and Ritter, W. (1976). The scalp topography of potentials associated with missing visual or auditory stimuli. Electroencephalogr. Clin. Neurophysiol. 40, 33–42.
Squires, K. C., Donchin, E., Herning, R. I., and McCarthy, G. (1977). On the influence of task relevance and stimulus probability on event-related potential components. Electroencephalogr. Clin. Neurophysiol. 42, 1–14.
Squires, N. K., Squires, K. C., and Hillyard, S. A. (1975). Two varieties of long-latency positive waves evoked by unpredictable auditory stimuli in man. Electroencephalogr. Clin. Neurophysiol. 38, 387–401.
Squires, N. K., Wickens, C., Squires, K. C., and Donchin, E. (1976). The effect of stimulus sequence on the waveform of the cortical event-related potential. Science 193, 1142–1146.
Swick, D., Pineda, J. A., and Foote, S. L. (1994). Effects of systemic clonidine on auditory event-related potentials in squirrel monkeys. Brain Res. Bull. 33, 79–86.
Usher, M., Cohen, J. D., Servan-Schreiber, D., Rajkowski, J., and Aston-Jones, G. (1999). The role of locus coeruleus in the regulation of cognitive performance. Science 283, 549–554.
van Veen, V., and Carter, C. S. (2002a). The anterior cingulate as a conflict monitor: fMRI and ERP studies. Physiol. Behav. 77, 477–482.
van Veen, V., and Carter, C. S. (2002b). The timing of action-monitoring processes in the anterior cingulate cortex. J. Cogn. Neurosci. 14, 593–602.
Warren, C. M., Breuer, A. T., Kantner, J., Fiset, D., Blais, C., and Masson, M. J. (2009). Target–distractor interference in the attentional blink implicates the locus coeruleus–norepinephrine system. Psychon. Bull. Rev. 16, 1106–1111.
Warren, C. M., Tanaka, J. W., and Holroyd, C. B. (2011). What can topology changes in the oddball N2 reveal about underlying processes? Neuroreport 22, 870–874.
Yeung, N., Botvinick, M. M., and Cohen, J. D. (2004). The neural basis of error detection: conflict monitoring and the error-related negativity. Psychol. Rev. 111, 931–959.
Keywords: norepinephrine, dopamine, N2, feedback error-related negativity, anterior cingulate cortex, locus coeruleus, event-related potential, fusiform gyrus
Citation: Warren CM and Holroyd CB (2012) The impact of deliberative strategy dissociates ERP components related to conflict processing vs. reinforcement learning. Front. Neurosci. 6:43. doi: 10.3389/fnins.2012.00043
Received: 07 November 2011; Accepted: 19 March 2012;
Published online: 03 April 2012.
Edited by:
Itzhak Aharon, The Interdisciplinary Center, IsraelReviewed by:
Eldad Yechiam, Technion – Israel Institute of Technology, IsraelPatrick Simen, Oberlin College, USA
Copyright: © 2012 Warren and Holroyd. This is an open-access article distributed under the terms of the Creative Commons Attribution Non Commercial License, which permits non-commercial use, distribution, and reproduction in other forums, provided the original authors and source are credited.
*Correspondence: Christopher M. Warren, Department of Psychology, University of Victoria, P. O. Box 3050, Victoria, BC, Canada V8W 3P5. e-mail: cwarren@uvic.ca