 Peter Iversen1
 Kim Mouridsen2
 Mikkel B. Hansen2
 Svend B. Jensen3,4
 Michael Sørensen1,5
 Lasse K. Bak6
 Helle S. Waagepetersen6
 Arne Schousboe6
 Peter Ott5
 Hendrik Vilstrup5Susanne Keiding1,5,7
 Albert Gjedde1,2,7*
- 1Department of Nuclear Medicine and PET Centre, Aarhus University Hospital, Aarhus, Denmark
- 2Center of Functionally Integrative Neuroscience, Aarhus University, Aarhus, Denmark
- 3Department of Nuclear Medicine, Aalborg University Hospital, Aalborg, Denmark
- 4Department of Chemistry and Biochemistry, Aalborg University, Aalborg, Denmark
- 5Department of Hepatology and Gastroenterology, Aarhus University Hospital, Aarhus, Denmark
- 6Department of Drug Design and Pharmacology, Faculty of Health and Medical Sciences, University of Copenhagen, Copenhagen, Denmark
- 7Brain Research and Integrative Neuroscience Laboratory, Department of Neuroscience and Pharmacology, Faculty of Health and Medical Sciences, University of Copenhagen, Copenhagen, Denmark
In patients with impaired liver function and hepatic encephalopathy (HE), consistent elevations of blood ammonia concentration suggest a crucial role in the pathogenesis of HE. Ammonia and acetate are metabolized in brain both primarily in astrocytes. Here, we used dynamic [11C]acetate PET of the brain to measure the contribution of astrocytes to the previously observed reduction of brain oxidative metabolism in patients with liver cirrhosis and HE, compared to patients with cirrhosis without HE, and to healthy subjects. We used a new kinetic model to estimate uptake from blood to astrocytes and astrocyte metabolism of [11C]acetate. No significant differences of the rate constant of oxidation of [11C]acetate (k3) were found among the three groups of subjects. The net metabolic clearance of [11C]acetate from blood was lower in the group of patients with cirrhosis and HE than in the group of healthy subjects (P < 0.05), which we interpret to be an effect of reduced cerebral blood flow rather than a reflection of low [11C]acetate metabolism. We conclude that the characteristic decline of whole-brain oxidative metabolism in patients with cirrhosis with HE is not due to malfunction of oxidative metabolism in astrocytes. Thus, the observed decline of brain oxidative metabolism implicates changes of neurons and their energy turnover in patients with HE.
Introduction
Hepatic encephalopathy (HE) is a common and recurrent complication of liver cirrhosis. Increased blood ammonia is held to be a key pathogenic factor (Ott and Vilstrup, 2014). Compared to patients with cirrhosis without HE and healthy subjects, patients with cirrhosis and HE type C had low cerebral oxygen metabolism (CMRO2) and cerebral blood flow (CBF) in inverse proportion to arterial blood ammonia concentration (Iversen et al., 2009; Dam et al., 2013). Both variables rise to normal after recovery from HE (Dam et al., 2013), indicating that low values of CMRO2 and CBF during HE are related to the encephalopathy rather than to the cirrhosis. Oxygen delivery to the brain by the circulation did not limit the magnitude of CMRO2, suggesting that the reduction of CBF is secondary to the reduction of CMRO2 (Iversen et al., 2009; Gjedde et al., 2010). In brain, ammonia reacts with glutamate dehydrogenase and glutamine synthetase to form glutamate and glutamine, respectively, the former of which is linked to oxidative metabolism. The disposal of ammonia in the brain takes place mainly via formation of glutamine by glutamine synthetase which is located exclusively in astrocytes. This is the basis for the present hypothesis that the reduction in CMRO2 during cirrhosis with HE reflects reduced oxidative metabolism in astrocytes.
Acetate is converted to acetyl-CoA and undergoes subsequent oxidative metabolism in the TCA cycle of most cells. However, in the brain, acetate is metabolized in the astrocytes because the monocarboxylate transporter 2 (MCT2), the only MCT of neurons, fails to recognize acetate to the same extent as MCT1 located in endothelial cells and astrocytes (Waniewski and Martin, 1998; Patel et al., 2010). Therefore, measurement of acetate metabolism commonly is used to assess the oxidative metabolism of astrocytes (Patel et al., 2010). In the present study, we used positron emission tomography (PET) with tracer [1-11C]acetate ([11C]acetate) to assess the oxidative metabolism of astrocytes in patients with cirrhosis, with or without HE, as well as in healthy subjects.
Each subject had PET with [11C]acetate immediately after the measurements of CMRO2 and CBF, published separately (Iversen et al., 2009). A model of cerebral acetate kinetics was developed for the present report. Based on the findings of reduced CMRO2 in patients with cirrhosis and HE (Iversen et al., 2009) and the restriction of the ammonia and acetate metabolism to astrocytes, we tested the hypothesis that [11C]acetate metabolism is reduced in the patients with HE, as a measure of oxidative metabolism by astrocytes. Failure to uphold the hypothesis would mean that effects of ammonia in astrocytes do not explain the reduced oxidative metabolism measured in HE.
Materials and Methods
Subjects
According to the design of the study, each of 21 subjects, seven in each of the groups of patients with cirrhosis and HE type C, patients with cirrhosis without HE, and healthy subjects, was scheduled to have an [11C]acetate PET study after the completion of measurements of CMRO2 and CBF (Iversen et al., 2009; Gjedde et al., 2010). However, only six patients with HE completed the [11C]acetate study. In three other subjects admitted to the study, the design could not be fulfilled because of technical failure of one of the three successive PET measurements. The [11C]acetate measurements could be completed in only five of the seven healthy subjects. In the group of patients with cirrhosis, one of the seven patients was unable to inhale [15O]oxygen and was excluded from the previous presentation of the oxygen and blood flow data. Thus, six patients with HE, seven patients with cirrhosis without HE, and five healthy subjects completed the [11C]acetate studies. Clinical and laboratory characteristics therefore differ in minor respects from those given in the oxygen consumption and blood flow paper (Iversen et al., 2009; Gjedde et al., 2010) (Table 1). At the time of the study, the patients received no specific treatment for HE.
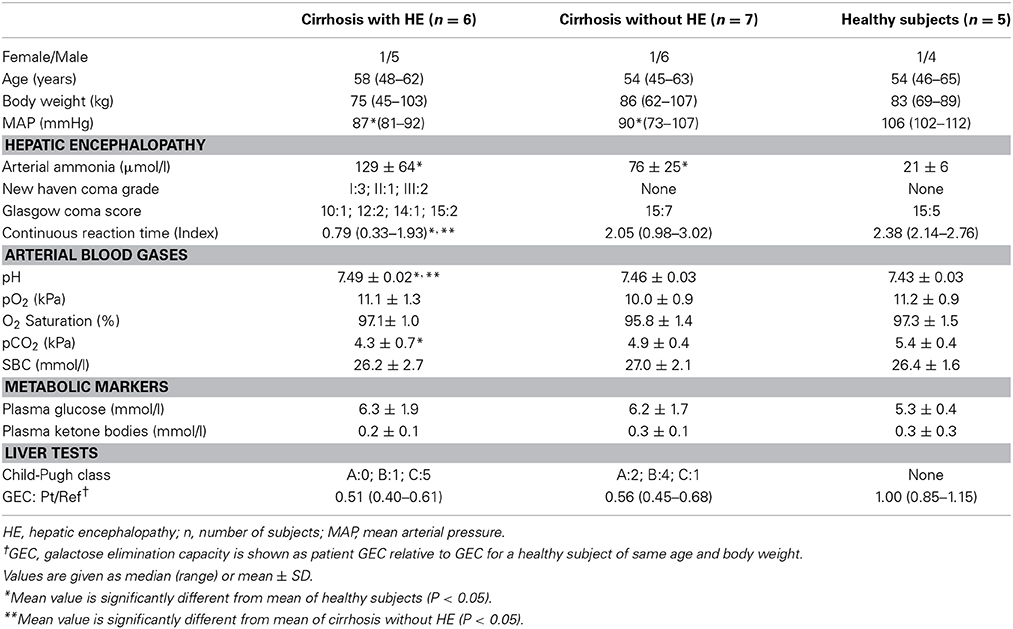
Table 1. Patient Characteristics (revised from Iversen et al., 2009).
Ethics
The study was performed in accordance with the Helsinki II Declaration and approved by the Ethics Committee of Aarhus County. We obtained informed consent from each participant. The radiation dose averaged 2.45 mSv ([11C]acetate).
Tracer Production
[11C]Carbon dioxide was produced in the Aarhus PET Center's 16.8 MeV PETtrace cyclotron (GE Medical Systems, Uppsala, Sweden) and a slight modified procedure of Roeda et al. (2002) was applied to convert [11C]carbon dioxide to [11C]acetate. Briefly, we trapped 11CO2 in a 10-ml vial containing methylmagnesium chloride (1 ml, approximately 100 mmol/l). After complete trapping, we added sterile acetic acid (9 ml, 1 mmol/l) to quench the Grignard solution. We purified the product by passing it over H+ and Ag+ cartridges and then trapped the [11C]acetate on an OH cartridge. We washed the product twice with 10 ml of sterile water. Finally, we used 10 ml of sterile citrate buffer (pH 4.7) to elute the [11C]acetate from the OH cartridge through a 0.22 μm filter into a sterile product vial. We measured the activity of the final product and used a sterile needle and syringe to withdraw approximately 0.3 ml of the formulation for quality control. Typical synthesis time was 7 min (±2 min) with a yield of 6 GBq (±2 GBq) after EOS with 10 min bombardment with 40 μA.
PET Recordings
The subjects were told not to take drugs or food for 8 h before the studies but were free to drink water. Catheters were placed percutaneously in a radial artery for blood sampling and in a cubital vein for intravenous injections of the tracers. The subjects were placed in the supine position with their head within the 15 cm field-of-view of the tomograph (ECAT EXACT HR 47, CTI, Knoxville, TN), equipped with a neck shield as previously described (Iversen et al., 2009).
In each subject, the PET recording with [11C]acetate took place after completion of the measurements of CMRO2 and CBF (Iversen et al., 2009). A median dose of 459 MBq (range 128–580 MBq) [11C]acetate were given as intravenous injection during the initial 20 s of a dynamic PET recording of the brain using a protocol that comprised 50 frames of 18 × 5 s, 12 × 10 s, 7 × 30 s, 1 × 120 s, and 12 × 180 s for a total of 45 min. Attenuation correction, radioactivity decay correction and reconstruction procedures were as described previously (Iversen et al., 2009).
Blood Samples
During the [11C]acetate PET recordings, we manually collected 0.5 ml arterial blood samples at the following intervals: 18 every 5th s, 9 every 10th s, 12 every 60th s, and every 5th min for a total of 45 min. Blood [11C] radioactivity concentrations were measured in a well counter (Packard Instruments Co., Meriden, CT, USA), cross-calibrated with the tomograph and corrected for radioactive decay to the start of the scanning. Arterial plasma concentration of ammonia (van Anken and Schiphorst, 1974) was significantly higher in the patients than in healthy subjects and tended to be higher in the patients with HE than in the patients without HE, although this difference was not significant (Table 1).
Magnetic Resonance Imaging
T1-weighted magnetic resonance imaging (MRI) was performed in each subject for definition of specific brain regions for the PET measurements by co-registration as previously described (Iversen et al., 2009).
Tracer Kinetic Analysis
The kinetic analysis of [11C]acetate uptake from blood and metabolism in astrocytes is complicated by rapid metabolism of [11C]acetate to [11C]CO2. This requires a model that includes three successive steps: transport of [11C]acetate from blood to brain cells (K1; ml blood (cm−3 brain tissue) min−1), backflux from cells to blood (rate constant k2; min−1), metabolism of [11C]acetate to [11C]acetyl-CoA and [11C]CO2 (k3; min−1), flux of [11C]CO2 out of the brain to the blood circulation (k5; min−1) and specifically into the apparent distribution volume in the vascular space (V0; ml blood (cm−3 brain tissue)) (Figure 1). We symbolize the volume of distribution of labeled molecules remaining in the vascular bed of the brain by the term V0, assumed to include effects of labeled tracer metabolites such as [11C]CO2, as described below. As the [11C]acetate conversion to [11C]CO2 is irreversible, the model has no rate constant for the conversion of 11C-labeled metabolites to the [11C]acetate itself. The constant k3 is a measure of the rate constant for the oxidative metabolism of blood-borne [11C]acetate in the astrocytes. We note that this may be different from the net whole-brain metabolic clearance of acetate.
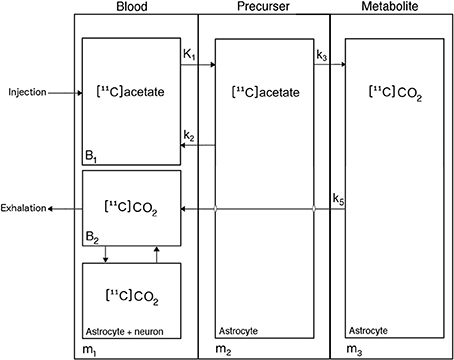
Figure 1. Kinetic model of [11C]acetate metabolism in human brain. [11C]Acetate enters the astrocytes from blood through either carrier-mediated transport (MCT1) or passive diffusion, characterized by the unidirectional clearance K1, [11C]Acetate in the astrocytes either return to blood, characterized by the rate constant k2, or is converted to [11C]acetyl-CoA, thereby entering the tricarboxylic acid (TCA) cycle, where it is joined into amino acids produced from oxaloacetate and α-ketoglutarate, irreversible processes characterized by the rate constant k3, before it is converted to [11C]CO2, which leaves the cell by passive diffusion into the blood, characterized by the rate constant k5.
We used a statistical non-linear mixed effects model to estimate the parameters of the kinetic model K1k2k3k5V0 (Williams and Ette, 2000) described by the following equations:
where m1, m2, and m3 are the tracer quantities in compartments 1–3 (Figure 1); c1(t) is the arterial tracer concentration of compartment 1 as function of time t after onset of recording; and u and T are dummy time variables. This approach avoids “overfitting” to the measured data in individual subjects by simultaneously fitting the model to all subjects, admitting different kinetic parameters in each of the three groups of subjects but allowing only modest deviations within each group. The latter was ensured by modeling subjects as random effects. In contrast, a two-step procedure with individual model fitting followed by parameter averaging and group testing may lead to “overfitting” and variance inflation in the first step and in the second step. The procedure overcomes a potentially poor match between the group-models with averaged kinetic coefficients compared to individual time activity curves that may occur when the averaging step is performed irrespectively and independently of the measured data.
The kinetic model was fitted to the PET data from whole-brain and each of nine predefined brain regions of each subject (cerebellum, frontal, parietal, temporal and occipital lobes, striatum, thalamus, total gray matter, and total white matter), see Results. We obtained estimates of rate constants and clearances defined by the model, including the net metabolic clearance of [11C]acetate K as K1k3/(k2 + k3) (Gjedde, 1982) listed in Table 2. We also estimated the k3/k5 ratio as an oxidative index, expressing the relative rates of oxidative metabolism in astrocytes and flow-dependent removal of [11C]-metabolites from brain tissue to blood.
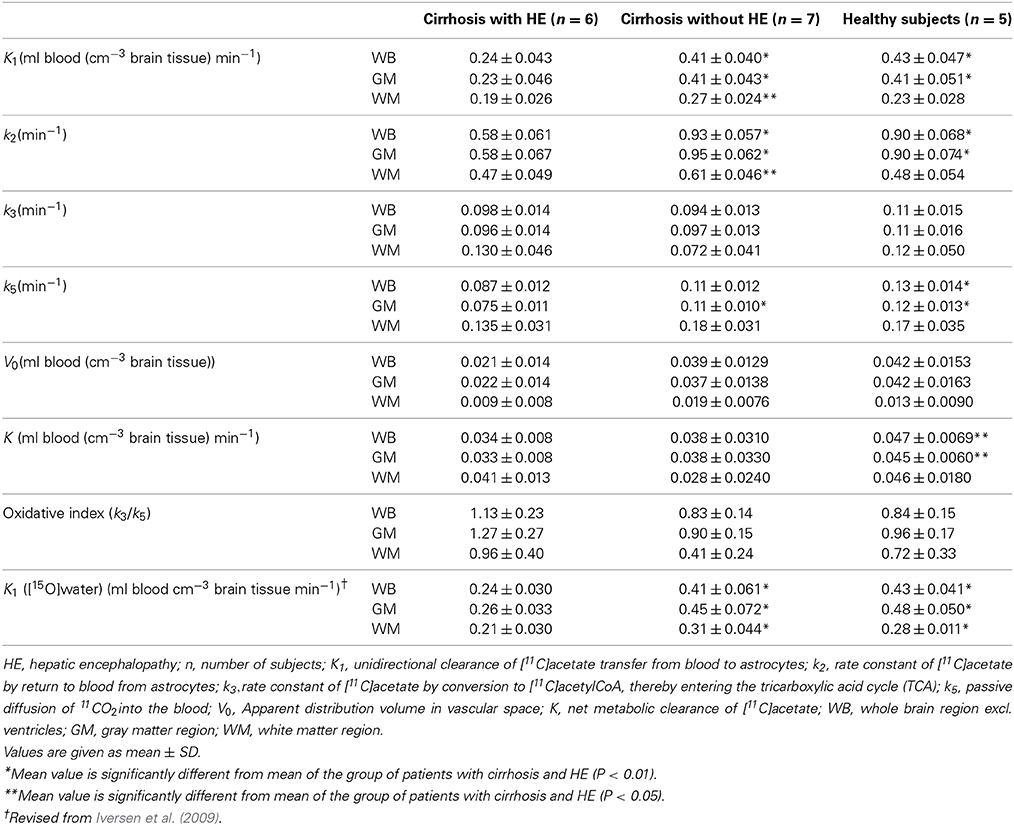
Table 2. Parameters of brain [11C]acetate metabolism.
We did not make any specific correction for the appearance of [11C]CO2 in blood. The question of the accumulation of [11C]CO2 in blood, produced from the metabolism of [11C]acetate, has been dealt with on a number of occasions (e.g., Shields et al., 1992). In the accompanying editorial, Gjedde (1992) stated that “[if] the distribution of [11C]CO2 initially follows blood flow, reflecting rapid transfer into the tissue, it may be sufficient simply to calculate tissue curves that assume instant steady state with the blood, at half the blood level.” After administration of [11C]acetate, Shields et al. found that [11C]-labeled carbon dioxide, 1–2 min after injection of [11C]acetate, represented a constant proportion of about 60% of the [11C]-activity in blood, and that brain tissue [11C]-activity followed blood [11C]-activity at approximately the same level. This means that the carbon dioxide activities in blood and brain tissue kinetically can be attributed to part of the vascular background. In the present analysis, the vascular background volume V0 was included specifically for this reason. We tested this assertion by confirming the absent relation of the estimates of V0 to the estimates of the flow-sensitive parameters K1, k2, and k5, and the V0 estimates' poor relation to the estimates of k3, which is an indicator of the capacity for metabolism of [11C]acetate in brain tissue.
Statistics
We observed no significant left-right differences for any of the present kinetic parameter estimates in any of the predefined regions, and we therefore report the estimates of the kinetic parameters as averages for right and left brain regions. We used a Two-Way ANOVA test to compare the oxidative indices between groups, with probability values of less than 0.05 as the threshold of statistical significance. We also determined the significance of relations among selected individually estimated rate constants for whole-brain, using linear regression with probability values of less than 0.05 as the threshold of statistical significance.
Results
The rate constant of oxidation of [11C]acetate, k3, used here to represent the efficiency of oxidative metabolism of [11C]acetate in astrocytes, did not reveal any significant differences among the three groups of subjects, in any of the brain regions studied (Table 2).
Figure 2 illustrates the observation that the average summed [11C]-activity was lower in the group of patients with cirrhosis and HE compared to the group of patients with cirrhosis without HE and that of healthy subjects. These differences were not significantly related to differences of k3 among the three groups of subjects, for any brain region.
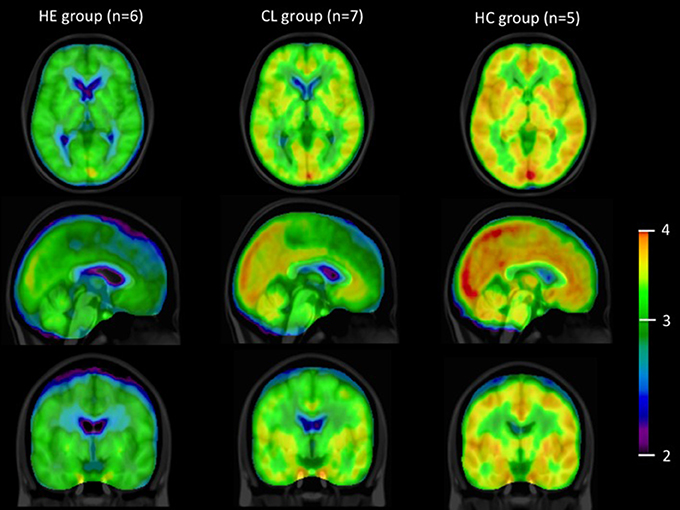
Figure 2. [11C]acetate PET images. Summed average [11C]-PET images from time of injection of [11C]acetate to 45 min in the groups of patients with cirrhosis and HE (HE), patients with cirrhosis without HE (CL) and healthy subjects (HC), n, number of subjects. Data are presented on a logarithmic scale.
The group of patients with cirrhosis and HE had lower whole-brain and gray-matter unidirectional clearances K1 of [11C]acetate from blood to brain tissue than the groups of patients without HE and healthy subjects (both P < 0.01). There were no significant differences of K1 between the patients without HE and the healthy subjects. The highest values of K1 were seen in cerebellum, occipital and parietal cortices, and the lowest values in striatum, thalamus, and frontal and temporal cortices.
Whole-brain individual estimates of K1 and k3 of [11C]acetate were not significantly correlated (Figure 3A). In contrast, whole-brain individual estimates of K1 were significantly correlated to k2 and k5 (both P < 0.0001), but not to V0 (P = 0.82) as shown in (Figures 3B–D).

Figure 3. Individual parameter estimates. Patients with cirrhosis and hepatic encephalopathy (HE) ( ), patients with cirrhosis without HE (
 ), and healthy subjects (
 ). (A) Rate constant of whole brain astrocyte oxidative metabolism, k3vs. unidirectional clearance from blood-to-brain tissue of [11C]acetate, K1. (B) Rate constant for return of [11C]acetate from the astrocytes to blood, k2 vs. K1. (C) Passive diffusion of [11C]CO2 from the astrocytes into the blood, k5 vs. K1. (D) Apparent distribution volume in vascular space, V0 vs. K1. Solid line indicates a tendency.
The group of patients with cirrhosis and HE had significantly lower whole-brain and gray-matter metabolic clearances K of [11C]acetate than healthy subjects (Table 2). White matter had significantly lower values of K in all three groups of subjects compared to whole-brain and gray matter regions (Table 2), but the decline was less pronounced in the group of cirrhosis patients with HE.
Discussion
In this study we fitted a novel model of [11C]acetate metabolism in brain tissue to brain [11C]acetate PET recordings. Figure 4 presents the time courses of the whole-brain [11C]-concentrations observed and those predicted by three different models for each of the three groups of subjects. The models include a simple flow model (K1, k2, V0), an irreversible metabolism model (K1, k2, k3, V0), and the current model with metabolite efflux (K1, k2, k3, k5, V0). The different time courses illustrate the discrimination among the predictions of the three formulations of the model, i.e., with the rate constants set to zero or not. We note that the present model fitted the data best.
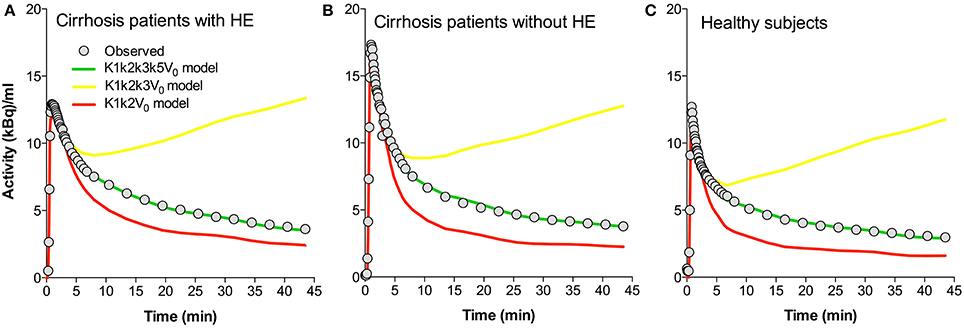
Figure 4. Predicted time-activity curves for three whole-brain model configurations. (A) Average data sets for patients with cirrhosis and hepatic encephalopathy (HE). (B) Patients with cirrhosis without HE. (C) Healthy subjects. Each panel shows the observed values, the fitted values using a K1k2k3k5V0 model (“full” model), and the predicted behaviors of the K1k2k3V0 and K1k2V0 models. K1, unidirectional clearance from blood-to-brain tissue of [11C]acetate. k2, rate constant for return of [11C]acetate from the astrocytes to blood. k3, rate constant of whole brain astrocyte oxidative metabolism. k5, passive diffusion of [11C]O2 from the astrocytes into the blood. V0, apparent distribution volume in vascular compartment.
The rate constant of oxidation of [11C]acetate in astrocytes (k3 of [11C]acetate) was not significantly different between the three groups of subjects (Table 2) and the net clearance of [11C]acetate (K) was not related to the arterial blood ammonia concentration or to the rate of oxygen consumption (Figures 5A,B). A possible explanation could be relatively lower aerobic glycolysis during HE, in which the consumption of glucose is replaced by acetate, with lower generation of lactate at normal brain tissue oxygen tensions (Gjedde et al., 2010). Lower generation of lactate in oligodendrocytes, lower blood flow, and up-regulation of the MCT1 transporters have been seen in other conditions, such as induced ischemia and epilepsy (Tseng et al., 2003; Rinholm et al., 2011).
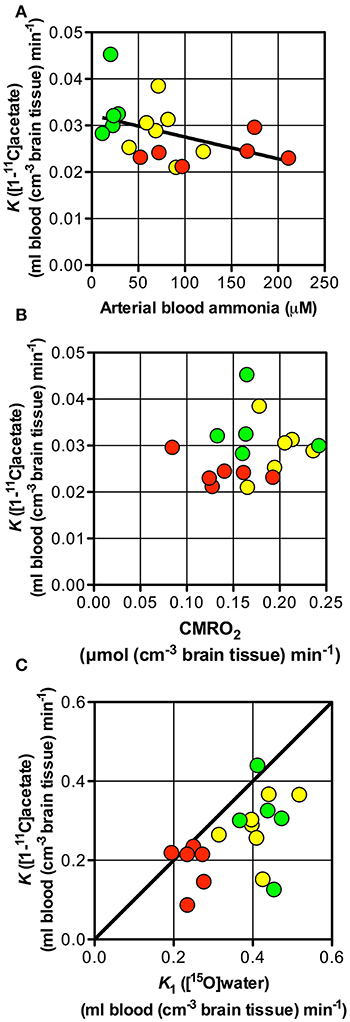
Figure 5. Net metabolic clearance and unidirectional clearance from blood-to-brain tissue of [11C]acetate vs. arterial blood ammonia, unidirectional clearance of H2[15O] and cerebral metabolic rate of oxygen. Patients with cirrhosis and hepatic encephalopathy (HE) (), patients with cirrhosis without HE (), and healthy subjects (). (A) Net metabolic clearance of [11C]acetate, K vs. arterial blood ammonia concentration (the latter from Iversen et al., 2009). (B) Net metabolic clearance of [11C]acetate, K vs. cerebral metabolic rate of oxygen, CMRO2 (the latter from Iversen et al., 2009). (C) Unidirectional clearance from blood-to-brain tissue of [11C]acetate, K1 vs. that K1 of H2[15O] (the latter from Iversen et al., 2009); the straight line shows line of identity. Solid line indicates a tendency.
The close correlation between K1of [11C]acetate and CBF (calculated as K1 of H152O/0.85) (Iversen et al., 2009) as seen in Figure 5C, suggests that [11C]acetate uptake from blood is flow-determined by virtue of the great capacity of acetate transport by MCT1 across the blood-brain barrier and from the interstitial space into the astrocytes. The position of the observations just below the line of identity indicates an extraction fraction of [11C]acetate that is not much lower than that of [15O]water. This indicates that estimates of the K1 of [11C]acetate might be used as indices of CBF. Significant correlations of the estimates of K1 to k2 (P = 0.0001) and k5 (P = 0.0001), respectively (Figures 3B,C), can be explained by flow-dependence of K1, k2, and k5.
The higher k3/k5 ratio in patients with HE than in the two other group of subjects (Table 2) suggests that the oxidative metabolism of the astrocytes declines less than the rates of metabolite washout by the blood flow in patients with HE compared to subjects without HE.
Figure 2 shows all species of radioactivity within each of the three groups of subjects. The kinetic model deciphers the separate populations of labeled molecules, and their dynamic relationships, shown here to reveal similar fractions of the acetate pools being converted to substrates of the TCA cycles of the three groups. Of course, if significant differences of pharmacologically active pools of acetate existed, they would be reflected in different metabolic fluxes of acetate, but here we deal exclusively with tracer amounts of acetate, used solely to determine the enzyme activity of conversion to Acetyl-CoA in the three groups. There is practically no unlabeled acetate present. Of course, when ammonia concentrations differ, their metabolic fluxes would differ in proportion to the concentration differences.
The model used in this study is more complex than previously published models of Wyss et al. (2009), Lanz et al. (2012), emphasizing the observation that the previous models had only two parameters (K1 and k2) compared to the current model with five parameters (K1, k2, k3, k5, and V0). Wyss et al. (2009) interpret the clearance of activity (k2 in their model) as loss of [11C]CO2 generated by glial oxidation, and they found this not to be affected by increased CBF in their rat model. It is unclear how the (Wyss et al., 2009) model would account for the clearance of acetate as independent from the clearance of CO2. In the present model, K1, k2, and k5 all depend strongly on the rate of blood flow, K1 as a clearance, k2 and k5 as fractional clearances.
Astrocytic oxidative metabolism is generally held to be of the order of 20% only of the total brain oxidative metabolism (Hyder et al., 2010). In the present study. the blood flow reduction is likely to be the consequence rather than the cause of low oxygen metabolic rate is compromised, as previously reported (Gjedde et al., 2010).
The passive diffusion of monocarboxylic acids is known to be considerably lower than the facilitated diffusion across endothelial and other cell membranes (Cremer et al., 1979). Indeed, the actual uptake into neurons is much less than into astrocytes because of deficient facilitated rather than passive diffusion in the present study. In addition, the k3 magnitudes were shown not to differ, regardless of how large a proportion of the activity of the acetyl-CoA synthetase, estimated in the present study, actually reflected action in neurons.
In the HE condition, brain content of glutamine is likely to be elevated and could a potential confounder in the current study. The so-called “trojan horse” hypothesis claims that the enlarged glutamine pool is destructive to astrocytes, which would tend to be at variance with current evidence (Brusilow et al., 2010) and that the rate of oxidation of labeled acetate (k3) is unchanged in the present study.
As far as we know, the current study is the first to test and model a pathological state using [11C]acetate PET in humans, except for the one PET study with [11C]acetate of acute alcohol intoxication by Volkow et al. (2013), which did not report a detailed kinetic model. In previous studies, we demonstrated that ammonia has no inhibitory effect on the tricarboxylic acid cycle activity in cultured astrocytes (Johansen et al., 2007; Bak et al., 2009). In the same studies TCA cycle of cultured neurons (mainly glutamatergic) were not inhibited by ammonia as well. Thus, reduction of neuronal oxidative metabolism due to increased GABAergic tone (Hyder et al., 2006) could be an indirect mechanism by which increased ammonia reduces whole-brain oxidative metabolism of neurons in this condition (Gjedde et al., 1978, 2010; Leke et al., 2011; Schousboe et al., 2014).
In conclusion, the present study does not support the working hypothesis that the reduction in CMRO2 during HE in patients with cirrhosis reflects reduced oxidative metabolism by astrocytes. Hence, the reduced CMRO2 during HE is likely to be related to metabolic effects of the condition of HE in neurons.
Financial Support
Danish Council for Independent Research, Medical Sciences (09-065565) and the A. P. Møller Foundation for the Advancement of Medical Sciences (080255).
Conflict of Interest Statement
The authors declare that the research was conducted in the absence of any commercial or financial relationships that could be construed as a potential conflict of interest.
References
Bak, L. K., Iversen, P., Sørensen, M., Keiding, S., Vilstrup, H., Ott, P., et al. (2009). Metabolic fate of isoleucine in a rat model of hepatic encephalopathy and in cultured neural cells exposed to ammonia. Metab. Brain Dis. 24, 135–145. doi: 10.1007/s11011-008-9123-4
Pubmed Abstract | Pubmed Full Text | CrossRef Full Text | Google Scholar
Brusilow, S. W., Koehler, R. C., Traystman, R. J., and Cooper, A. J. (2010). Astrocyte glutamine synthetase: importance in hyperammonemic syndromes and potential target for therapy. Neurotherapeutics 7, 452–470. doi: 10.1016/j.nurt.2010.05.015
Pubmed Abstract | Pubmed Full Text | CrossRef Full Text | Google Scholar
Cremer, J. E., Cunningham, V. J., Pardridge, W. M., Braun, L. D., and Oldendorf, W. H. (1979). Kinetics of blood-brain barrier transport of pyruvate, lactate and glucose in suckling, weanling and adult rats. J. Neurochem. 33, 439–445. doi: 10.1111/j.1471-4159.1979.tb05173.x
Pubmed Abstract | Pubmed Full Text | CrossRef Full Text | Google Scholar
Dam, G., Keiding, S., Munk, O. L., Ott, P., Vilstrup, H., Bak, L. K., et al. (2013). Hepatic encephalopathy is associated with decreased cerebral oxygen metabolism and blood flow, not increased ammonia uptake. Hepatology 57, 258–265. doi: 10.1002/hep.25995
Pubmed Abstract | Pubmed Full Text | CrossRef Full Text | Google Scholar
Gjedde, A. (1982). Calculation of cerebral glucose phosphorylation from brain uptake of glucose analogs in vivo: a re-examination. Brain Res. 257, 237–274. doi: 10.1016/0165-0173(82)90018-2
Pubmed Abstract | Pubmed Full Text | CrossRef Full Text | Google Scholar
Gjedde, A., Keiding, S., Vilstrup, H., and Iversen, P. (2010). No oxygen delivery limitation in hepatic encephalopathy. Metab. Brain Dis. 25, 57–63. doi: 10.1007/s11011-010-9179-9
Pubmed Abstract | Pubmed Full Text | CrossRef Full Text | Google Scholar
Gjedde, A., Lockwood, A. H., Duffy, T. E., and Plum, F. (1978). Cerebral blood flow and metabolism in chronically hyperammonemic rats: effect of an acute ammonia challenge. Ann. Neurol. 3, 325–330. doi: 10.1002/ana.410030409
Pubmed Abstract | Pubmed Full Text | CrossRef Full Text | Google Scholar
Hyder, F., Patel, A. B., Gjedde, A., Rothman, D. L., Behar, K. L., and Shulman, R. G. (2006). Neuronal-glial glucose oxidation and glutamatergic-GABAergic function. J. Cereb. Blood Flow Metab. 26, 865–877. doi: 10.1038/sj.jcbfm.9600263
Pubmed Abstract | Pubmed Full Text | CrossRef Full Text | Google Scholar
Hyder, F., Sanganahalli, B. G., Herman, P., Coman, D., Maandag, N. J., Behar, K. L., et al. (2010). Neurovascular and neurometabolic couplings in dynamic calibrated fMRI: transient oxidative neuroenergetics for block-design and event-related paradigms. Front. Neuroenergetics 2:18. doi: 10.3389/fnene.2010.00018
Pubmed Abstract | Pubmed Full Text | CrossRef Full Text | Google Scholar
Iversen, P., Sørensen, M., Bak, L. K., Waagepetersen, H. S., Vafaee, M. S., Borghammer, P., et al. (2009). Low cerebral oxygen consumption and blood flow in patients with cirrhosis and an acute episode of hepatic encephalopathy. Gastroenterology 136, 863–871. doi: 10.1053/j.gastro.2008.10.057
Pubmed Abstract | Pubmed Full Text | CrossRef Full Text | Google Scholar
Johansen, M. L., Bak, L. K., Schousboe, A., Iversen, P., Sorensen, M., Keiding, S., et al. (2007). The metabolic role of isoleucine in detoxification of ammonia in cultured mouse neurons and astrocytes. Neurochem. Int. 50, 1042–1051. doi: 10.1016/j.neuint.2007.01.009
Pubmed Abstract | Pubmed Full Text | CrossRef Full Text | Google Scholar
Lanz, B., Uffmann, K., T., Wyss, M., Weber, B., Buck, A., and Gruetter, R. (2012). A two-compartment mathematical model of neuroglial metabolism using [1-(11)C] acetate. J. Cereb. Blood Flow Metab. 32, 548–559. doi: 10.1038/jcbfm.2011.162
Pubmed Abstract | Pubmed Full Text | CrossRef Full Text | Google Scholar
Leke, R., Bak, L. K., Iversen, P., Sorensen, M., Keiding, S., Vilstrup, H., et al. (2011). Synthesis of neurotransmitter GABA via the neuronal tricarboxylic acid cycle is elevated in rats with liver cirrhosis consistent with a high GABAergic tone in chronic hepatic encephalopathy. J. Neurochem. 117, 824–832. doi: 10.1111/j.1471-4159.2011.07244.x
Pubmed Abstract | Pubmed Full Text | CrossRef Full Text | Google Scholar
Ott, P., and Vilstrup, H. (2014). Cerebral effects of ammonia in liver disease: current hypotheses. Metab. Brain Dis. doi: 10.1007/s11011-014-9494-7. [Epub ahead of print].
Pubmed Abstract | Pubmed Full Text | CrossRef Full Text | Google Scholar
Patel, A. B., de Graaf, R. A., Rothman, D. L., Behar, K. L., and Mason, G. F. (2010). Evaluation of cerebral acetate transport and metabolic rates in the rat brain in vivo using 1H-[13C]-NMR. J. Cereb. Blood Flow Metab. 30, 1200–1213. doi: 10.1038/jcbfm.2010.2
Pubmed Abstract | Pubmed Full Text | CrossRef Full Text | Google Scholar
Rinholm, J. E., Hamilton, N. B., Kessaris, N., Richardson, W. D., Bergersen, L. H., and Attwell, D. (2011). Regulation of oligodendrocyte development and myelination by glucose and lactate. J. Neurosci. 31, 538–548. doi: 10.1523/JNEUROSCI.3516-10.2011
Pubmed Abstract | Pubmed Full Text | CrossRef Full Text | Google Scholar
Roeda, D., Dolle, F., and Crouzel, C. (2002). An improvement of [11C]acetate synthesis—non-radioactive contaminants by irradiation-induced species emanating from the [11C]carbon dioxide production target. Appl. Radiat. Isot. 57, 857–860. doi: 10.1016/S0969-8043(02)00224-5
Pubmed Abstract | Pubmed Full Text | CrossRef Full Text | Google Scholar
Schousboe, A., Waagepetersen, H. S., Leke, R., and Bak, L. K. (2014). Effects of hyperammonemia on brain energy metabolism: controversial findings in vivo and in vitro. Metab Brain Dis. doi: 10.1007/s11011-014-9513-8. [Epub ahead of print].
Pubmed Abstract | Pubmed Full Text | CrossRef Full Text | Google Scholar
Shields, A. F., Graham, M. M., Kozawa, S. M., Kozell, L. B., Link, J. M., Swenson, E. R., et al. (1992). Contribution of labeled carbon dioxide to PET imaging of carbon-11-labeled compounds. J. Nucl. Med. 33, 581–584.
Tseng, M. T., Chan, S. A., and Schurr, A. (2003). Ischemia-induced changes in monocarboxylate transporter 1 reactive cells in rat hippocampus. Neurol. Res. 25, 83–86. doi: 10.1179/016164103101200978
Pubmed Abstract | Pubmed Full Text | CrossRef Full Text | Google Scholar
van Anken, H. C., and Schiphorst, M. E. (1974). A kinetic determination of ammonia in plasma. Clin. Chim. Acta 56, 151–157. doi: 10.1016/0009-8981(74)90223-X
Pubmed Abstract | Pubmed Full Text | CrossRef Full Text | Google Scholar
Volkow, N. D., Kim, S. W., Wang, G. J., Alexoff, D., Logan, J., Muench, L., et al. (2013). Acute alcohol intoxication decreases glucose metabolism but increases acetate uptake in the human brain. Neuroimage 64, 277–283. doi: 10.1016/j.neuroimage.2012.08.057
Pubmed Abstract | Pubmed Full Text | CrossRef Full Text | Google Scholar
Waniewski, R. A., and Martin, D. L. (1998). Preferential utilization of acetate by astrocytes is attributable to transport. J. Neurosci. 18, 5225–5233.
Williams, P. J., and Ette, E. I. (2000). The role of population pharmacokinetics in drug development in light of the food and drug administration's 'Guidance for Industry: population pharmacokinetics'. Clin. Pharmacokinet. 39, 385–395. doi: 10.2165/00003088-200039060-00001
Pubmed Abstract | Pubmed Full Text | CrossRef Full Text | Google Scholar
Wyss, M. T., Weber, B., Treyer, V., Heer, S., Pellerin, L., Magistretti, P. J., et al. (2009). Stimulation-induced increases of astrocytic oxidative metabolism in rats and humans investigated with 1-11C-acetate. J. Cereb. Blood Flow Metab. 29, 44–56. doi: 10.1038/jcbfm.2008.86
Pubmed Abstract | Pubmed Full Text | CrossRef Full Text | Google Scholar
Keywords: astrocytes, brain energy metabolism, kinetic modeling, mitochondria, positron emission tomography
Citation: Iversen P, Mouridsen K, Hansen MB, Jensen SB, Sørensen M, Bak LK, Waagepetersen HS, Schousboe A, Ott P, Vilstrup H, Keiding S and Gjedde A (2014) Oxidative metabolism of astrocytes is not reduced in hepatic encephalopathy: a PET study with [11C]acetate in humans. Front. Neurosci. 8:353. doi: 10.3389/fnins.2014.00353
Received: 12 August 2014; Accepted: 14 October 2014;
Published online: 03 November 2014.
Edited by:
Sebastian Cerdan, Instituto de Investigaciones Biomedicas Alberto Sols, SpainReviewed by:
Kevin L. Behar, Yale University, USASebastian Cerdan, Instituto de Investigaciones Biomedicas Alberto Sols, Spain
Copyright © 2014 Iversen, Mouridsen, Hansen, Jensen, Sørensen, Bak, Waagepetersen, Schousboe, Ott, Vilstrup, Keiding and Gjedde. This is an open-access article distributed under the terms of the Creative Commons Attribution License (CC BY). The use, distribution or reproduction in other forums is permitted, provided the original author(s) or licensor are credited and that the original publication in this journal is cited, in accordance with accepted academic practice. No use, distribution or reproduction is permitted which does not comply with these terms.
*Correspondence: Albert Gjedde, Brain Research and Integrative Neuroscience Laboratory, Department of Neuroscience and Pharmacology, Panum Institute, University of Copenhagen (University, Governmental), 3 Blegdamsvej, Copenhagen, DK-2200 N Capital Region, Denmark e-mail: gjedde@sund.ku.dk