 Christopher S. McCarthy
 Avinash Ramprashad
 Carlie Thompson
 Ioana L. Coman
 Wendy R. Kates
- Department of Psychiatry and Behavioral Sciences, Center for Psychiatric Neuroimaging, State University of New York at Upstate Medical University, Syracuse, NY, USA
This paper examined whether FreeSurfer—generated data differed between a fully—automated, unedited pipeline and an edited pipeline that included the application of control points to correct errors in white matter segmentation. In a sample of 30 individuals, we compared the summary statistics of surface area, white matter volumes, and cortical thickness derived from edited and unedited datasets for the 34 regions of interest (ROIs) that FreeSurfer (FS) generates. To determine whether applying control points would alter the detection of significant differences between patient and typical groups, effect sizes between edited and unedited conditions in individuals with the genetic disorder, 22q11.2 deletion syndrome (22q11DS) were compared to neurotypical controls. Analyses were conducted with data that were generated from both a 1.5 tesla and a 3 tesla scanner. For 1.5 tesla data, mean area, volume, and thickness measures did not differ significantly between edited and unedited regions, with the exception of rostral anterior cingulate thickness, lateral orbitofrontal white matter, superior parietal white matter, and precentral gyral thickness. Results were similar for surface area and white matter volumes generated from the 3 tesla scanner. For cortical thickness measures however, seven edited ROI measures, primarily in frontal and temporal regions, differed significantly from their unedited counterparts, and three additional ROI measures approached significance. Mean effect sizes for edited ROIs did not differ from most unedited ROIs for either 1.5 or 3 tesla data. Taken together, these results suggest that although the application of control points may increase the validity of intensity normalization and, ultimately, segmentation, it may not affect the final, extracted metrics that FS generates. Potential exceptions to and limitations of these conclusions are discussed.
Introduction
FreeSurfer1 (FS) is a freely available fully automated brain image morphometric software package that allows for the measurement of neuroanatomic volume, cortical thickness, surface area, and cortical gyrification of regions of interest (ROIs) throughout the brain. FS was designed around an automated workflow that encompasses several standard image processing steps necessary to achieve a final brain parcellation within the subject's space; however, manual image editing is allowed after each stage to ensure quality control. The first stage performs skull stripping and motion artifact correction, the second performs gray-white matter segmentation (Fischl et al., 2002), and the third segments 34 ROIs based on anatomic landmarks (Desikan et al., 2006). Another critical function that FS provides is the ability to construct surface-based representations of the cortex, from which cortical thickness, neuroanatomic volume, and surface area can be derived. Manual measurement of the volumes of specific ROIs is an arduous, labor-intensive task, and is subject to inter-rater variability. FS offers consistency in its fully automated processing, which is ideal for either single- or multi-site studies with large sample sizes. In general, validation studies have demonstrated that FS can produce measurements that are comparable to those derived from manual tracing of brain regions (Fischl et al., 2002; Tae et al., 2008; Bhojraj et al., 2011). FS has also been shown to be a highly reliable method for automated cortical thickness measurements across scanner strength and pulse sequence in all regions of the brain, with minor variability being attributed to cytoarchitectural differences of certain ROIs and difficulties with surface reconstructions in temporal lobe regions (Han et al., 2006; Fjell et al., 2009).
However, strictly implementing the automated procedures in FS can result in variability in the accuracy of segmentation for some ROIs. For example, Cherbuin et al. (2009) showed that absolute hippocampal volumes measured with FS were significantly larger than those of manual tracings, with reported 23 and 29% overestimation of left and right hippocampal volumes, respectively. Closer inspection revealed that this was due to inclusions of surrounding high intensity voxel structures as well as misidentification of pockets of cerebrospinal fluid as hippocampal tissue (Cherbuin et al., 2009). Other studies suggest that the temporal lobe and nearby regions are troublesome areas of the brain for FS to measure accurately (Desikan et al., 2006; Oguz et al., 2008). The presence of either excess dura matter, closely adjacent temporal bone or cerebellum can potentially lead to inclusions which may affect volume and ROI segmentation (Desikan et al., 2010). Moreover, some neuropathological conditions, which lead to enlarged ventricles like normal pressure hydrocephalus or Alzheimer's disease may affect white matter segmentation steps and thus may lead to greater necessity of editing the FS images of patients with similar conditions (Moore et al., 2012). Magnetic Resonance (MR) imaging acquisition artifacts can also lead to over-inclusion of white matter.
Given the propensity of FS to include areas of the brain extraneous to the ROI, investigators have the option of interrupting the automated process and its output. This can be done via skull stripping the brain, via the addition of control points to correct intensity normalization, via direct manual edits of white matter boundaries, or via a combination of these manual editing methods. These manual edits alter the white matter surface so that it more fully includes white matter structures and does not mistakenly segment gray matter or non-brain tissue as white matter. Manually editing the skull strip can ensure that it is more precise than the automatically completed procedure implemented by FS, and not affected by altered local anatomy in pathological states (Fennema-Notestine et al., 2006). This may improve the segmentation of white matter and lead to less control point placement in the next stage of quality control human intervention.
We reviewed 82 previous studies published primarily between 2006 and 2013 (see Table 1) that utilized FS, discovering a great deal of variability in the extent to which investigators utilized skull stripping, control point or white matter editing options (see Table 1 for review criteria). Two of the studies obtained their samples from previously established databases. Of those 82 studies, 36 utilized 3 tesla (T) or higher MRI scanners, with 8 of those electing the fully automated procedure (31%). The remaining 18 chose to manually edit their 3T data using different combinations of skull stripping, control points, and white matter editing options (69%). The remaining studies utilized 1.5T MRI scanners with 26 choosing the fully automated procedure (46%). Thirty-one 1.5T studies implemented some combination of manual intervention (54%). Scanner strength did not robustly affect whether or not a study decided to edit their data. Fujimoto et al. (2014) compared 3T and 7T data, and reported only editing 7T data for residual hyperintensities in the temporal lobe while leaving the 3T unedited. Pfefferbaum et al. (2012) compared 3T data to 1.5T data, and chose to edit the 3T images more extensively. The heterogeneity in the papers we reviewed underlines the lack of a standard protocol for deciding whether to interrupt the FS segmentation process and manually edit.
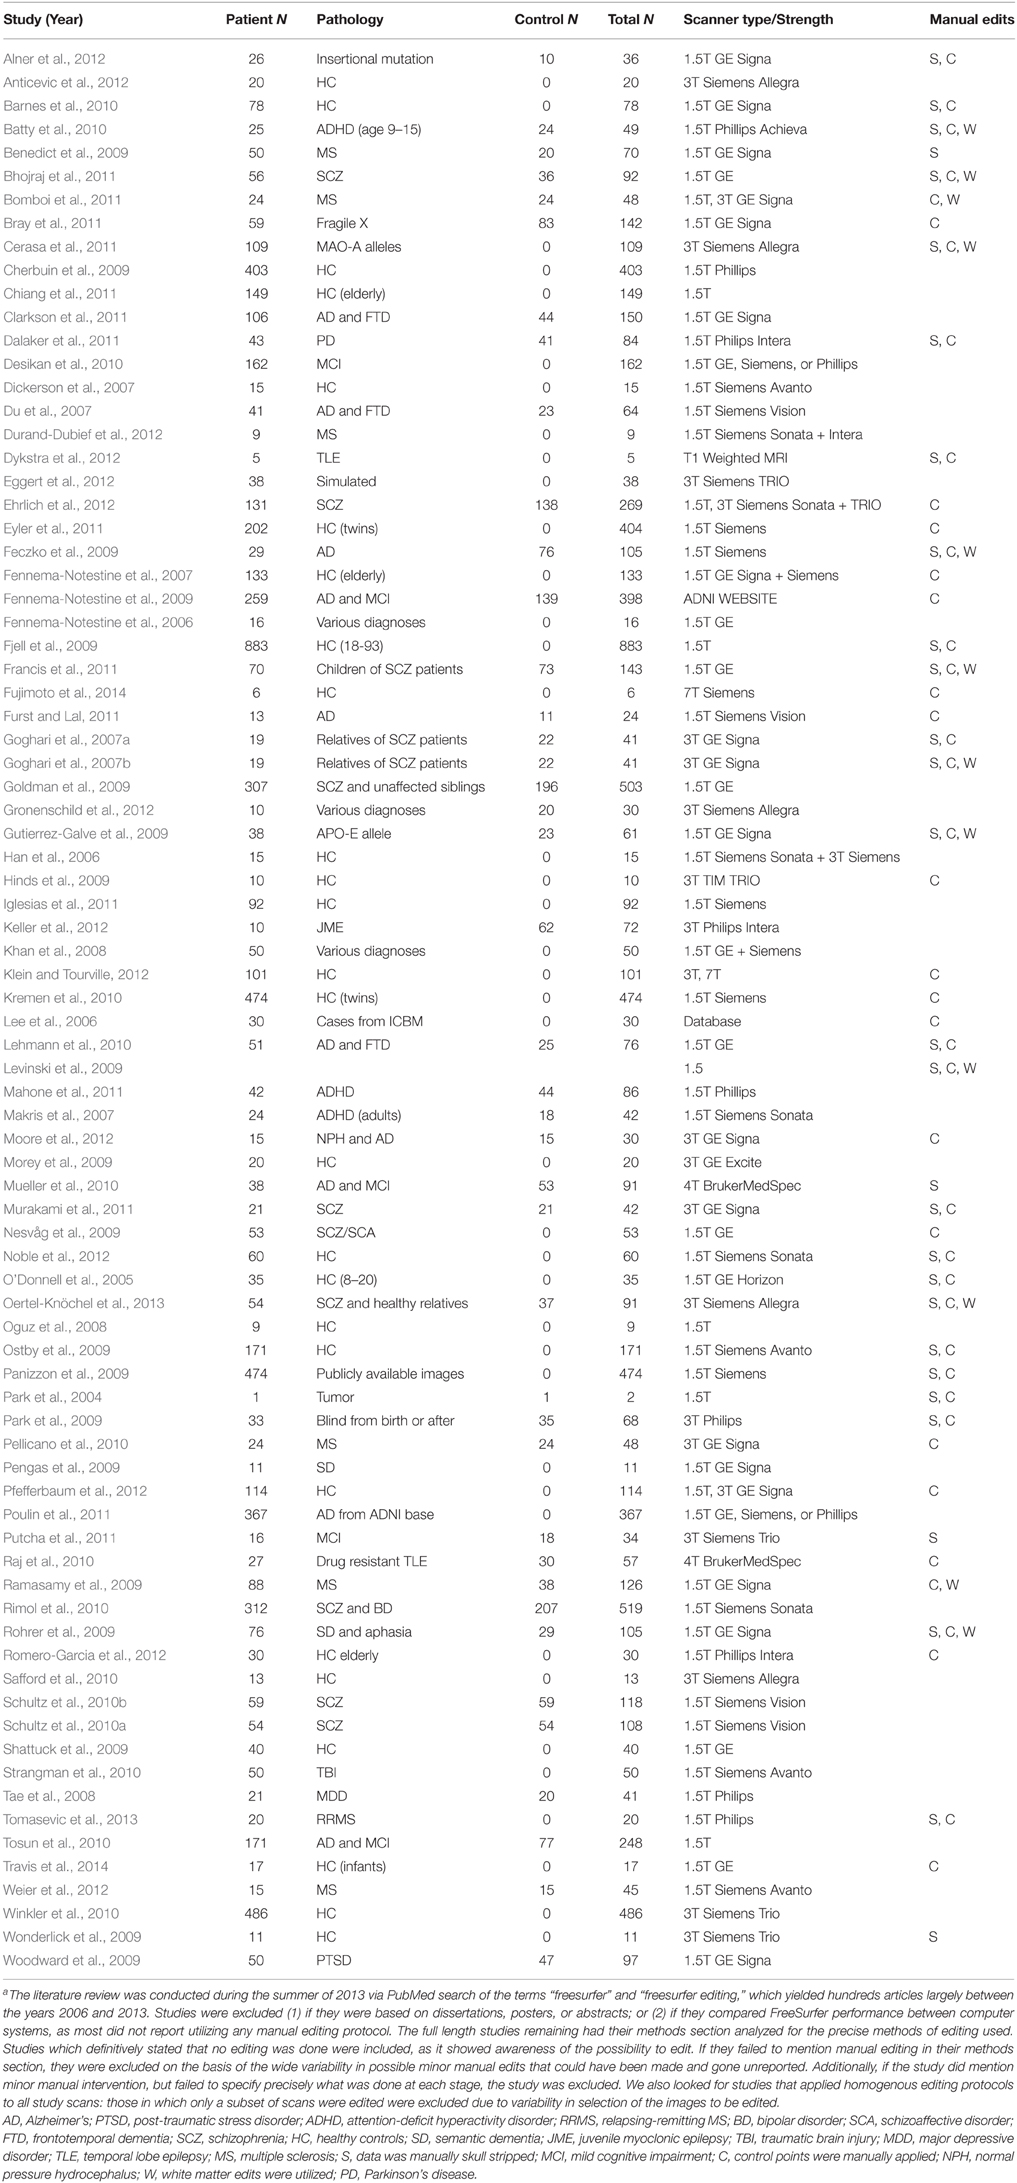
Table 1. Methodological variations in articles utilizing FreeSurfer, published between 2006 and 2013a.
Given that there is no standard protocol for the decision to interrupt the fully automated FS pipeline to manually edit the images, this paper seeks to establish the extent to which editing affects the final measurements that FS provides. Conceivably, time consuming manual interventions may only marginally affect the edited data sets, leading one to believe that the editing of this data may only be necessary for specific ROIs. To that end, our study is constructed around the following question: To what extent do the FreeSurfer-generated data for each region of interest differ significantly between the edited and unedited (i.e., fully automated) methods of measurement? Accordingly, we compare the means and variances of surface area, white matter volumes, and cortical thickness derived from edited and unedited datasets for each of the 34 ROIs. Note that surface area was chosen instead of gray matter volume, since surface area has been shown to be genetically and phenotypically independent of cortical thickness (Panizzon et al., 2009; Winkler et al., 2010) and, therefore, more informative than gray matter volume. Moreover, we compare effect sizes between edited and unedited conditions in a small sample of individuals with 22q11.2 deletion syndrome (22q11DS) and neurotypical controls, in order to determine whether or not editing FS output would alter the sample size necessary to detect significant differences in surface area, white matter, or cortical thickness. We hypothesize that the values generated by the edited method will differ from those of the unedited method, and that the edited method will produce larger effect sizes.
Materials and Methods
Participants
Data used in this study were selected from an ongoing longitudinal study focusing on biomarkers for psychosis in 22q11.2 deletion syndrome (Kates et al., 2011a). The procedures of the longitudinal study were approved by the Institutional Review Board at SUNY Upstate Medical University. Participants were recruited through the SUNY Upstate International Center for the Evaluation, Treatment and Study of Velo-Cardio-Facial Syndrome and from the community, and all participants provided informed consent. Imaging data and neuropsychiatric testing data were acquired at four visits, about 3 years apart. For the first three time points, images were acquired on a 1.5T scanner; for the fourth time point, images were acquired on a 3T scanner.
The subsample with imaging data from the 1.5T MR scanner was drawn from a larger sample of 116 participants who returned for the third time point of the longitudinal study. The subsample consisted of the first 30 participants (stratified by study group) whose Time 3 imaging data were processed, roughly corresponding to the order in which the participants returned for Time 3. They consisted of 20 with 22Q11.2 deletion syndrome (22q11DS) (8 male; mean age 17.54, SD 1.9) and 10 community controls (4 male; mean age 17.18, SD 1.21).
The subsample of participants whose imaging data was from the 3T MR scanner consisted of 21 subjects who returned for the fourth time point and had been included in the subsample with 1.5T MR dataset. Nine additional subjects were matched by age, gender, and diagnosis to the remaining participants from the 1.5T MR subsample. The mean age of the 22q11DS group was 20.74, SD 2.1, and the mean age of the control group was 20.42, SD 1.06.
This study was approved by the Institutional Review Board of SUNY Upstate Medical University, and all participants provided signed, informed consent in accordance with the Declaration of Helsinki.
The individuals who implemented the FS processing pipeline were blind to the diagnostic status of study participants.
Imaging Study
The 1.5T imaging data were acquired in the axial plane on a 1.5T Philips Interra scanner (Philips Medical Systems, Best, The Netherlands) utilizing the following T1-weighted inversion recovery, turbo gradient echo (TFE) 3-D pulse sequence: echo time = 4.6 ms; repetition time = 20 ms; 2 repetitions; matrix size 256 × 154; field of view = 24 cm; multishot = 32; TFE pre-inversion recovery = 394 ms, 1.5 mm slice thickness (Kates et al., 2011b).
The 3T imaging data were acquired in the sagittal plane on a 3T Siemens Magnetom Trio Tim scanner (syngo MR B17, Siemens Medical Solutions, Erlangen, Germany) utilizing an ultrafast gradient echo 3D sequence (MPRAGE) with PAT k-space-based algorithm GRAPPA and the following parameters: echo time = 3.31 ms; repetition time = 2530 ms; matrix size 256 × 256; field of view = 256 mm, slice thickness = 1 mm.
Image Analysis
Imaging Data Preprocessing
Preprocessing of 1.5T imaging data consisted of generating an isotropic brain image with non-brain tissue removed, and aligning that image along the anterior-posterior commissure. This was accomplished by importing the raw 1.5T MRI images into the imaging software program, BrainImage (available from the Center for Interdisciplinary Brain Sciences Research, Stanford University), where we performed an initial intensity correction, an automatic brain mask creation, followed by a manual editing step of the brainmask (Subramaniam et al., 1997). After the final manual editing, the skull was removed from the image and the brain image was saved in Analyze file format for import into the imaging software package, 3DSlicer (www.slicer.org; Fedorov et al., 2012). In 3DSlicer, the skull-stripped brains were aligned along the anterior and posterior commissure axis, and then re-sampled into isotropic voxels (0.9375 mm3) using a cubic spline interpolation transformation.
Preproccessing of 3T images also consisted of generating an isotropic brain image with non-brain tissue removed. However, instead of using BrainImage to remove non-brain tissue, we used the initial, preprocessing step in the FS pipeline. The resulting brain mask was imported into 3DSlicer, and manually edited using the same steps included in the protocol cited above. Afterwards, the skull was removed from the image and the brain image was aligned along the anterior and posterior commissure axis using a cubic spline transformation and kept at the same resolution as the initial data, isotropic voxels (1 mm3).
At that point, both 1.5T and 3T edited and aligned brain masks were subject to the FreeSurfer segmentation process, described below.
FS Segmentation Process
The preprocessed images were imported into the automated brain segmentation software FreeSurfer (FS) installed on a Dell Optiplex machine using the Ubuntu 12.04 operating system. In addition to resampling of the image into 0.9375 mm3 using a cubic spline transformation during preprocessing as described above, the FS segmentation process resampled the images into 1 mm3 as part of its motion correction step. Cortical reconstruction and volumetric segmentation was performed with the Freesurfer image analysis suite, which is documented and freely available for download online (http://surfer.nmr.mgh.harvard.edu/). The technical details of these procedures are described in prior publications (Dale and Sereno, 1993; Dale et al., 1999; Fischl et al., 1999a,b, 2001, 2002, 2004a,b; Fischl and Dale, 2000; Ségonne et al., 2004; Han et al., 2006; Jovicich et al., 2006).
Briefly, the FS segmentation process included: the segmentation of the subcortical white matter and deep gray matter volumetric structures (including hippocampus, amygdala, caudate, putamen, ventricles) (Fischl et al., 2002, 2004a); intensity normalization (Sled et al., 1998); tessellation of the gray matter white matter boundary; automated topology correction (Fischl et al., 2001; Ségonne et al., 2007); and surface deformation following intensity gradients to optimally place the gray/white and gray/cerebrospinal fluid borders at the location where the greatest shift in intensity defines the transition to the other tissue class (Dale and Sereno, 1993; Dale et al., 1999; Fischl and Dale, 2000). Once the cortical models were complete, a number of deformable procedures were performed including surface inflation (Fischl et al., 1999a), registration to a spherical atlas which utilizes individual cortical folding patterns to match cortical geometry across subjects (Fischl et al., 1999b), parcellation of the cerebral cortex into units based on gyral and sulcal structure (Fischl et al., 2004b; Desikan et al., 2006), and creation of a variety of surface based data including maps of curvature and sulcal depth. Details of the methods involved have been described extensively elsewhere (Fischl and Dale, 2000; Salat et al., 2004).
Final Steps of Fully Automated (Unedited) Pipeline
Following the successful completion of the FS reconstruction process, the FS directories were duplicated, and one copy immediately underwent the final reconstruction stream without manual intervention. Cortical thickness, surface area and white matter volume measurements were extracted for selected Region of Interest (ROIs) and the directories were backed up to a remote and secure location. Cortical thickness measurements were computed by looking at the average distance, calculated using a spatial lookup table, between the white matter and pial surfaces generated by FS (Fischl and Dale, 2000). This group of FS data without any manual intervention will be referred to as “unedited.”
Final Steps of Manual Intervention (Edited) Method
The second copy of the data were manually inspected for defects that could affect the accuracy of the final cortical measurements. The full protocols for processing and editing both 1.5T and 3T data are provided in Supplementary Material; however a brief description of the process follows. In the coronal view, starting posteriorly, with the opposite hemisphere of the brain obstructed in order to minimize human error, each slice was inspected for errors in the surfaces created by FS. An error can be described as an instance where one of the surfaces drawn by FS includes or excludes voxels incorrectly. These errors are most often caused by motion artifacts in the more posterior sections of the brain, and by hyperintensities around the temporal and orbitofrontal lobes. Control Points, manually inserted targets that adjust a voxel's intensity value to 110, were inserted within adjacent white matter regions in order to correct surface errors as described on the FS website2. Where appropriate, hyperintensities, and extraneous tissue were removed from the brain volume as well, as described in the White Matter Edits tutorial on the FS website3. Once completed, the process was repeated for the opposite hemisphere. After all errors were corrected, the brain was re-run through the second reconstruction stream beginning at the module where control point adjusted voxels are taken into account. This process was repeated up to four times to ensure all errors in FS surfaces were corrected.
Following successful correction of the FS surfaces, the final reconstruction step was run and cortical thickness and volume measurements were extracted for all ROIs. Manually-corrected data, hereafter referred to as “edited,” were then compared with the unedited data.
Statistical Analyses
Analyses comparing the unedited and edited volumes and cortical thickness values for each ROI were run separately in SPSS (v22) for the 1.5T and 3T data. Accordingly, for both the 1.5T and the 3T data, the variance was calculated for each ROI, based on the total sample of 30 individuals, and the Levene's test was used to compare the variance of each edited ROI to that of each unedited ROI. Intraclass correlation coefficients between edited and unedited ROIs were calculated based on the total sample as well, and paired t-tests were conducted in order to determine if the means differed significantly between edited and unedited ROIs. The Bonferroni correction was applied to the 34 paired t-tests that we performed for each set of measures (i.e., surface area, white matter volume, thickness) at each field strength.
As noted above, we also generated effect sizes for the mean surface areas/white matter volumes/cortical thickness values between the 20 individuals with 22q11DS and the 10 controls, in order to determine the differences in effect sizes that the edited vs. unedited methods yielded. This would allow one to determine the sample sizes for edited vs. unedited methods that would be necessary to detect significant differences in volume/cortical thickness between individuals with 22q11DS and controls. To determine whether effect sizes for the edited method differed significantly from effect sizes for the unedited method, we calculated paired t-tests across all ROIs. Bonferroni corrections were applied to paired t-tests as described above. In addition, we calculated the arithmetic difference in effect size for each edited vs. unedited ROI (by subtracting the unedited value from the edited value).
Results
Figure 1 compares MR images with and without manual intervention with control points. Means and standard deviations for surface area, white matter volume, and cortical thickness for each ROI, separated by scanner field strength, are provided in Table 2. The differences between edited and unedited measures are represented by Bland—Altman plots in Figure 2. Variances and intraclass correlation coefficients for all ROIs, separated by scanner field strength, are provided in Table 3. Effect sizes are provided in Table 4 and box plots representing effect sizes are provided in Figure 3.
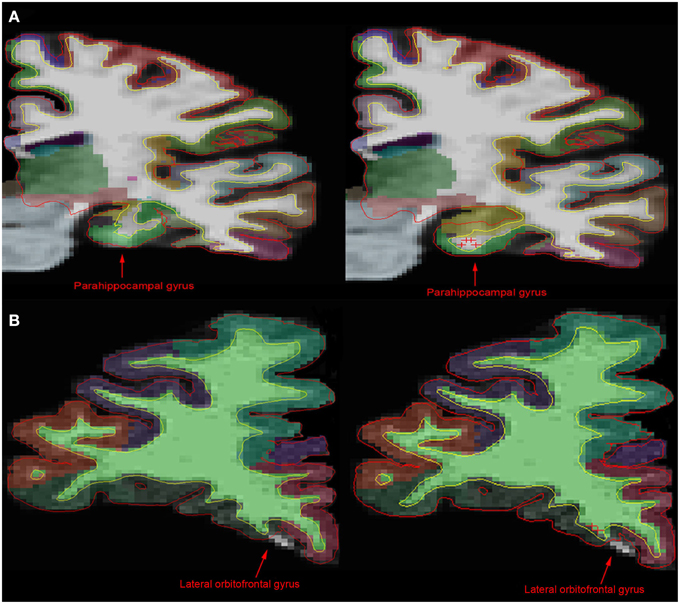
Figure 1. Comparison of MR images before and after manual intervention. (A) In comparison with the unedited 1.5T image (left), the manually edited brain image (right) shows a more accurate portrayal of the parahippocampal gyrus, the hippocampus and the white matter boundary. (B) However, in the 3T brain images, there is little difference between the unedited (left) and the manually edited (right) images. The manual intervention implemented in the 3T brain was intended to include white matter and gray matter incorrectly being excluded from the lateral orbitofrontal gyrus area. Control points on this slice in addition to edits on anterior and posterior brain slices had no significant effect on the exclusion. This shows that although control points can have an effect on white matter and pial surface, as well as cortical parcellation, it is inconsistent.
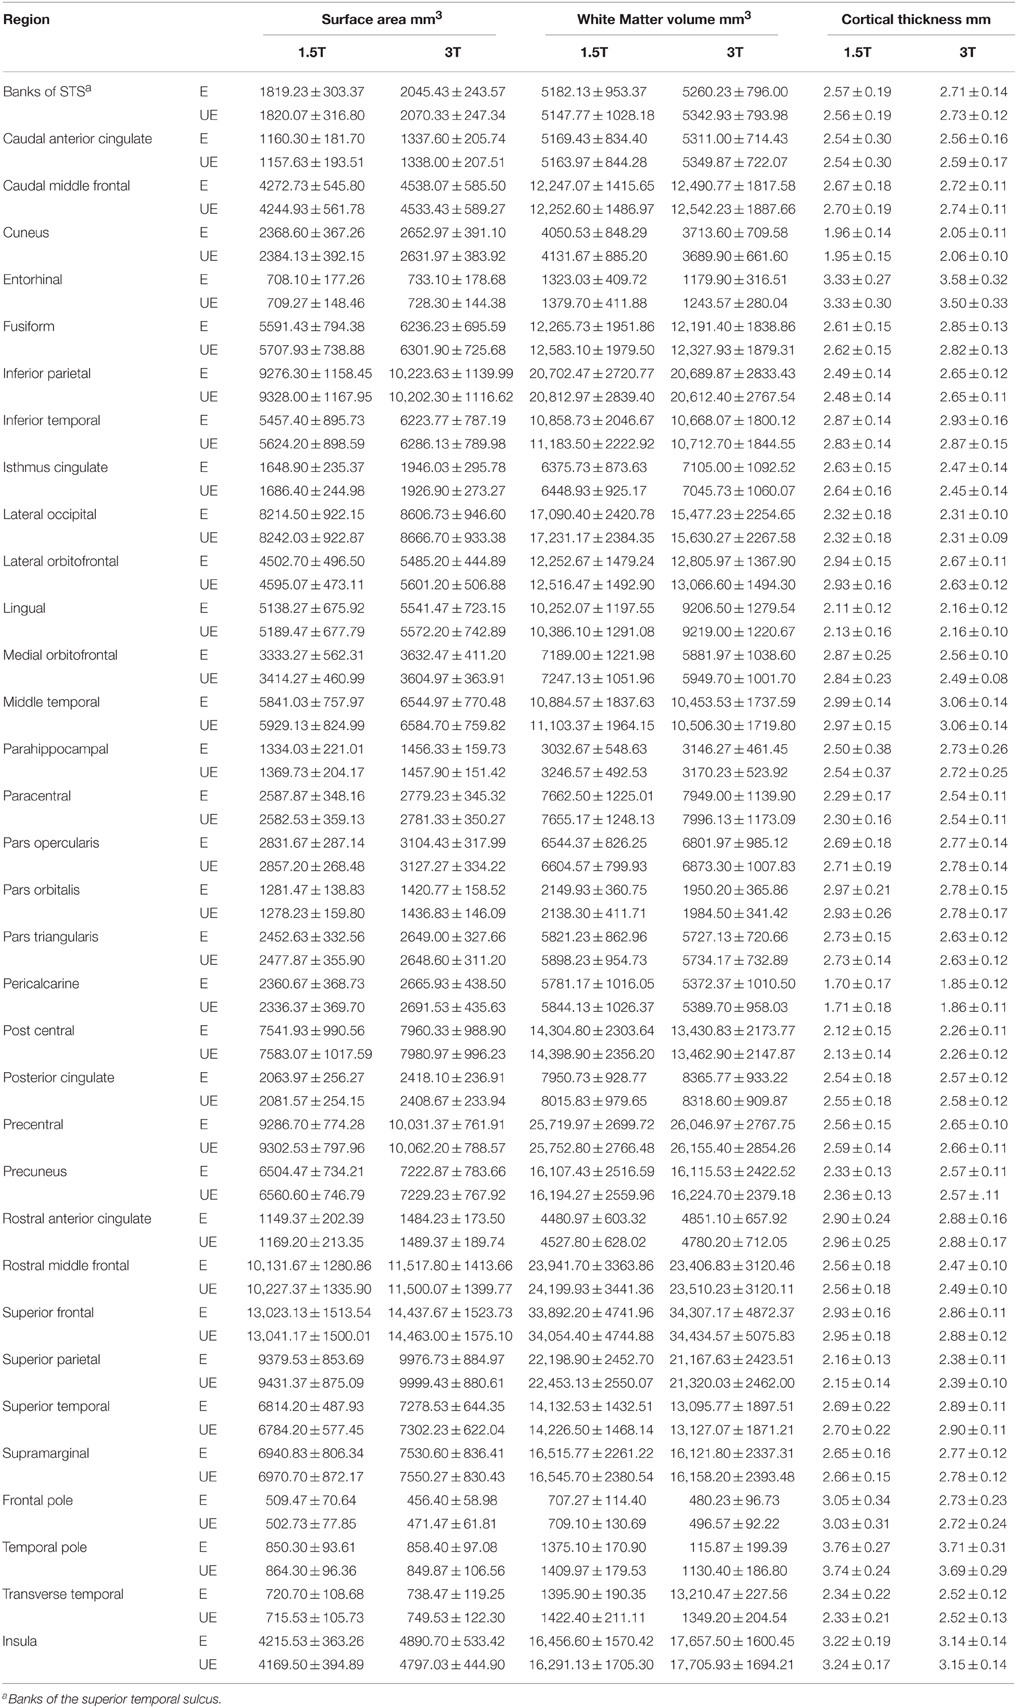
Table 2. Means and standard deviations of scanner-specific surface area, volume and cortical thickness values for FreeSurfer regions of interest.
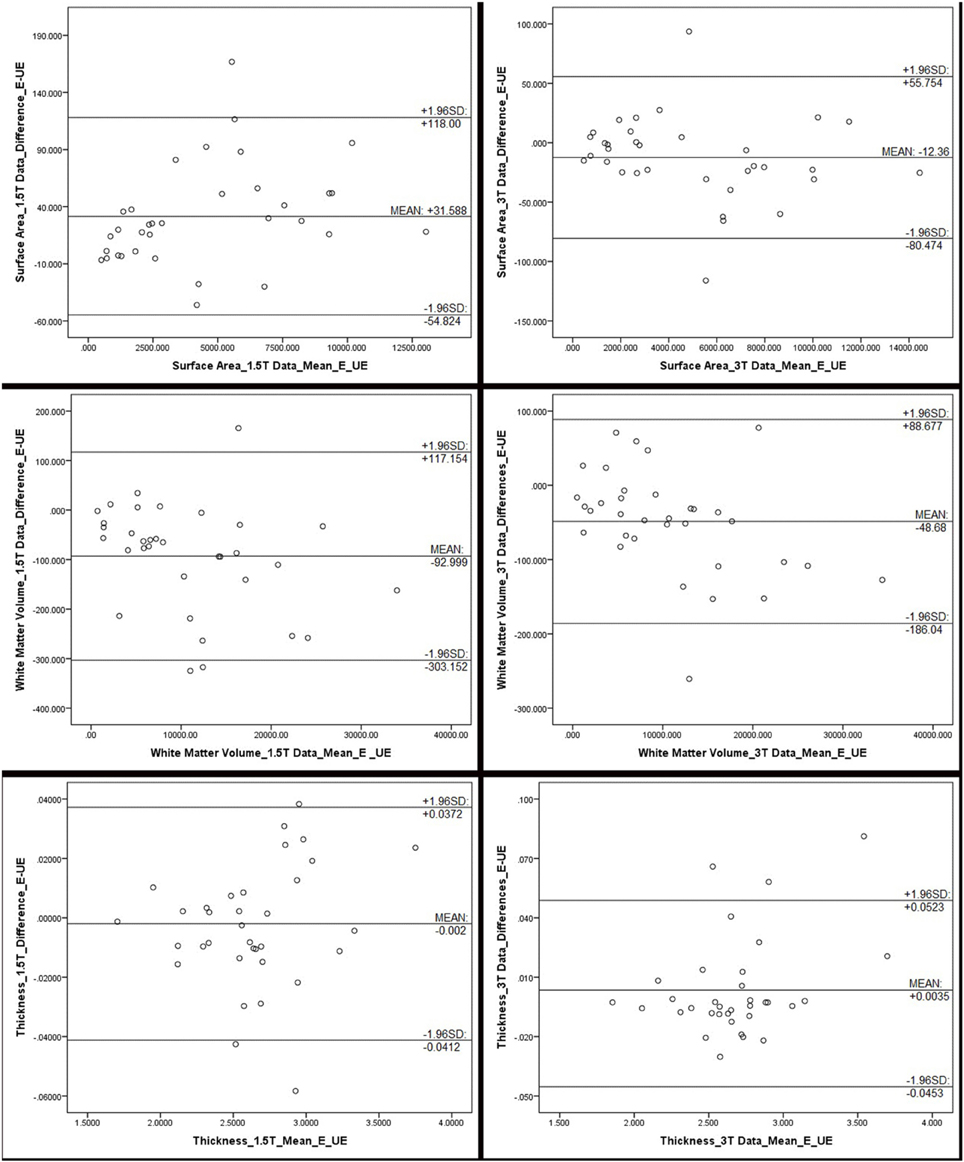
Figure 2. Bland Altman plots, representing the differences between edited and unedited measures of surface area, white matter volume and cortical thickness for each field strength. The difference between the edited and unedited measure of each region of interest is plotted against the average of the two measures. Mean, and 95% limits, of agreement are provided in each plot. These plots indicate that, for the most part, the two methods are producing somewhat similar results, although all plots show a fairly wide range of values. Outliers, beyond the 95% agreement limit, indicating poor agreement, include: for surface area (1.5T): inferior temporal gyrus; surface area (3T): lateral orbitofrontal gyrus and insula; white matter volume (1.5T): insula, fusiform gyrus, inferior temporal gyrus; white matter volumes (3T): lateral orbitofrontal gyrus; thickness (1.5T): rostral anterior cingulate, pars orbitalis, and parahippocampal gyrus; thickness (3T): entorhinal cortex, inferior temporal gyrus, and medial orbitofrontal gyrus.
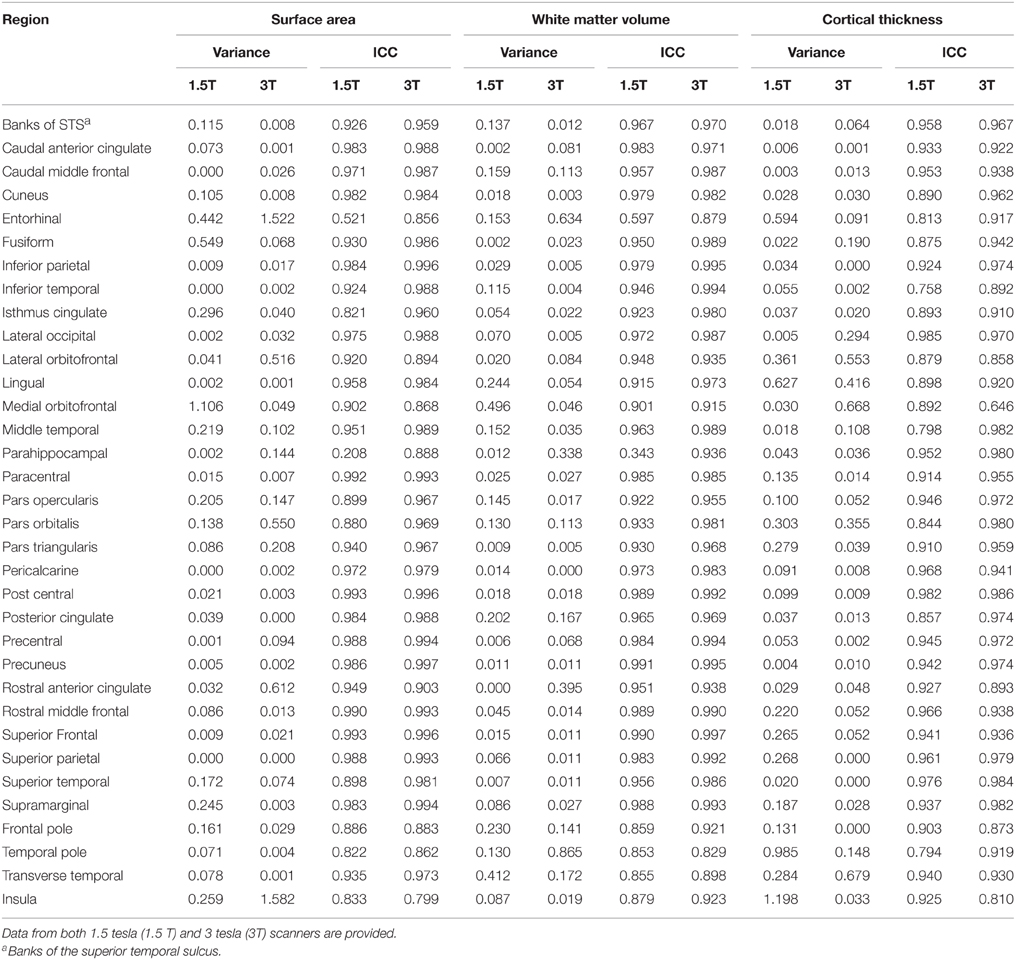
Table 3. Variances and intraclass correlation coefficients (ICC), based on comparisons of “edited” and “unedited” processing pipelines measuring surface area, white matter volume and cortical thickness.
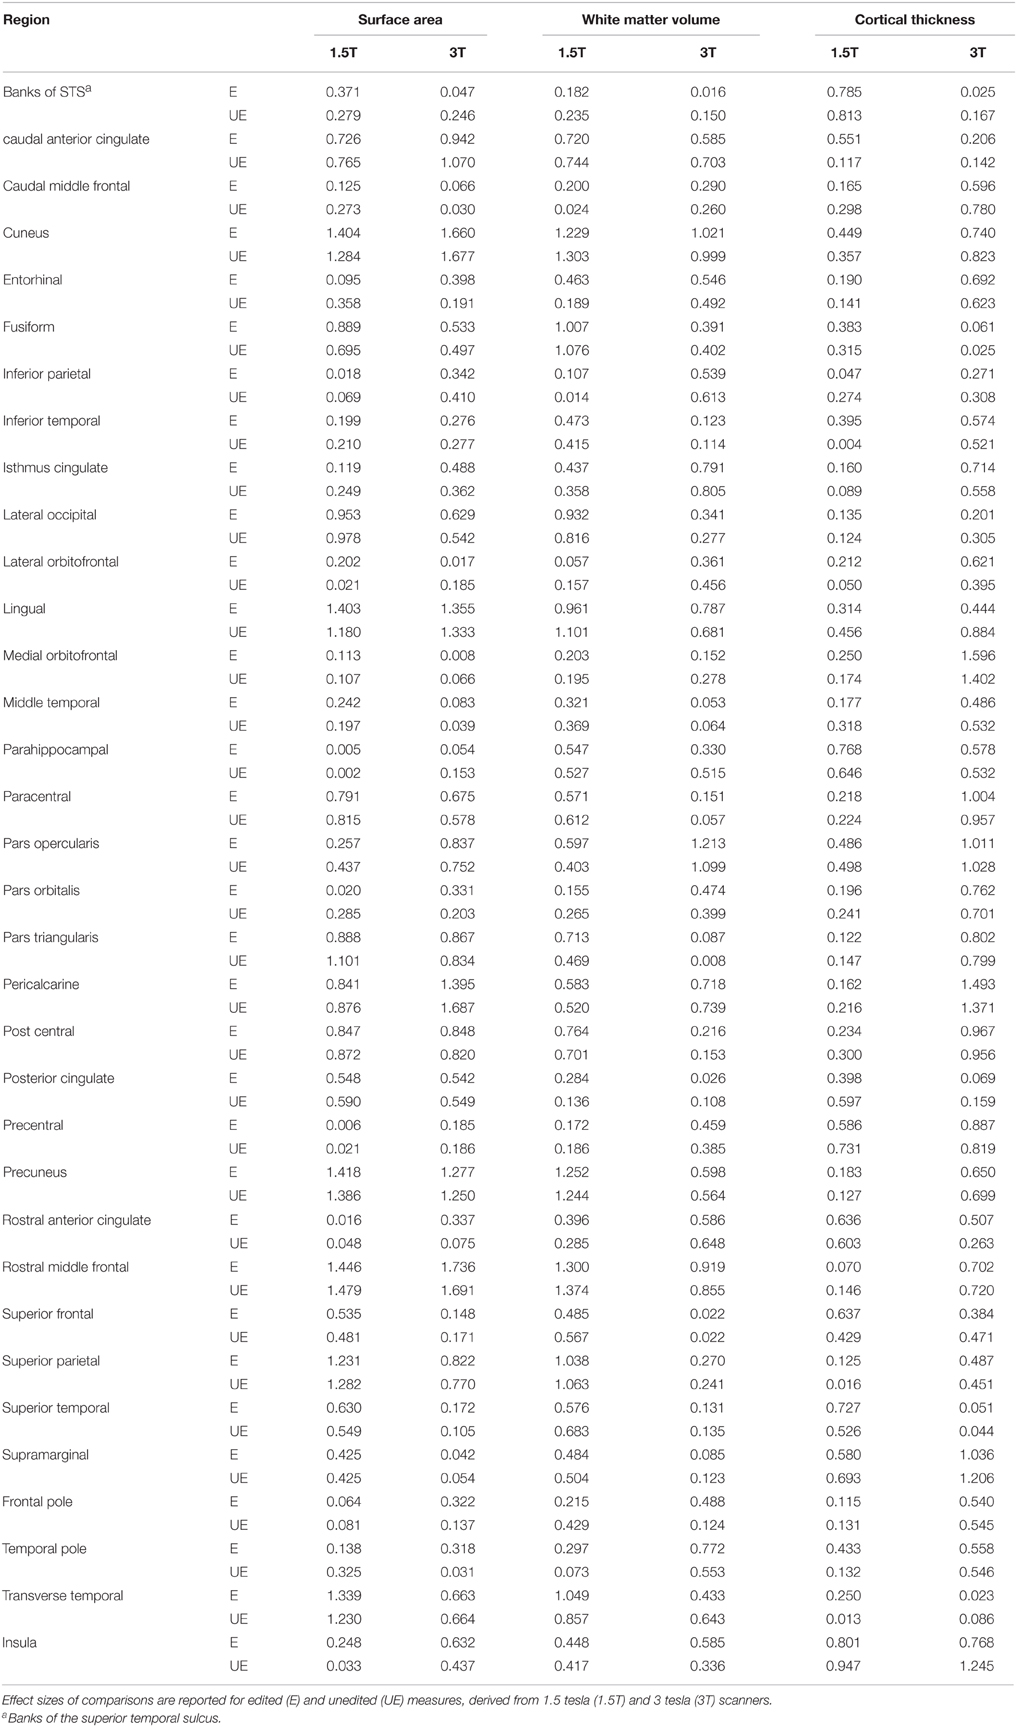
Table 4. Effect sizes (Cohen's d) based on comparisons of means of surface area, white matter volumes and cortical thickness, between individuals with 22q11.2 deletion syndrome (N = 20) and typical controls (N = 10).
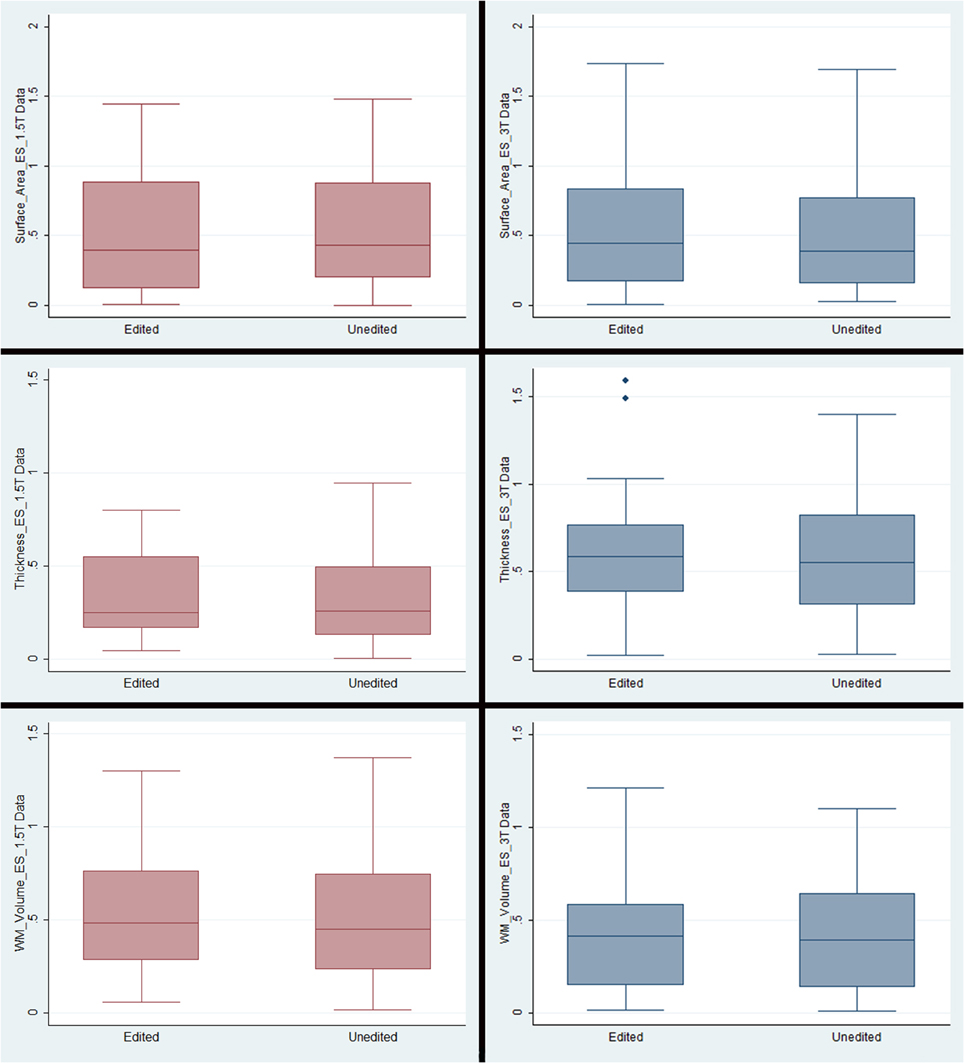
Figure 3. Box plots representing means and standard deviations of effect sizes for each measurement type/field strength. Note that the only outliers were in the cortical thickness plots for the 3T data. The outlying regions of interest were pericalcarine thickness (1.49) and medial orbitofrontal thickness (1.60).
Philips 1.5T Data
Surface Area Measures
Levene's test indicated that the variance of each edited region of interest did not differ significantly from its unedited counterpart. Intraclass correlation analyses between unedited and edited surface areas yielded coefficients ranging from 0.82 to 0.99 for 32 out of the 34 ROIs. The only exceptions were entorhinal cortex areas (0.52) and parahippocampal gyrus areas (0.21). After Bonferroni correction, paired t-tests indicated that mean areas did not differ significantly between any unedited and edited ROIs.
Paired t-tests indicated that the mean effect size for surface areas did not differ significantly from the mean effect size for unedited areas. Moreover, the mean arithmetic difference in effect size between all edited and unedited surface area ROIs was −0.011 (SD 0.12). The regions for which the difference in effect size between edited and unedited methods exceeded either 0.20 or −0.20 (indicating small effect sizes) for was the entorhinal cortex (−0.26), lingual area (0.22), pars orbitalis (−0.27), and pars triangularis (−0.21).
White Matter Volumes
No significant differences were observed in variances of white matter volumes between edited and unedited ROIs. Intraclass correlation analyses between unedited and edited white matter volumes yielded coefficients ranging from 0.85 to 0.99 for 32 out of 34 ROIs. Similar to surface areas, the exceptions were entorhinal cortex (0.60) and parahippocampal gyrus (0.34) volumes. Mean volumes did not differ significantly between 32 of the 34 pairs of unedited and edited regions. Exceptions were the lateral orbitofrontal (p < 0.001) cortex and the superior parietal lobule (p < 0.001).
The mean effect size for edited measures of white matter volumes did not differ significantly from the mean effect size for unedited measures. The mean arithmetic difference in effect size between all edited and unedited white matter ROIs was −0.018 (SD 0.11). The regions with the largest differences in effect sizes between edited and unedited methods for measuring white matter volumes were the entorhinal cortex (0.27), the pars triangularis (0.24), the frontal pole (−0.21) and the temporal pole (0.22).
Cortical Thickness
No significant differences were observed in variances of cortical thickness between edited and unedited ROIs. Intraclass correlation analyses between unedited and edited measures of cortical thickness yielded coefficients ranging from 0.84 to 0.985 for 31 out of 34 ROIs. Exceptions included entorhinal cortex (0.81), inferior temporal gyrus (0.76) and the temporal pole (0.79). Mean cortical thickness did not differ significantly between 32 of the 34 pairs of unedited and edited regions. Exceptions were the precentral gyrus (p < 0.001) and the rostral anterior cingulate (p < 0.001).
The mean effect size for edited measures of cortical thickness did not differ significantly from the mean effect size for unedited measures. The mean arithmetic difference in effect size between all edited and unedited measures of cortical thickness was −0.03 (SD 0.16). The regions with the largest differences in effect size between edited and unedited methods were the caudal anterior cingulate (0.43), fusiform gyrus (−0.23), inferiorparietal lobule (0.39), rostral anterior cingulate (0.21), superior frontal gyrus (0.20), supramarginal gyrus (0.30) and temporal pole (0.24). Note that the majority of these values were positive, indicating that the effect sizes for the edited method tended to be larger than those for the unedited method used to measure cortical thickness.
Siemens 3T Data
Surface Area Measures
For the 3T data, Levene's test similarly indicated that the variance of each edited region of interest did not differ significantly from its unedited counterpart. Intraclass correlation analyses between unedited and edited surface areas yielded coefficients ranging from 0.86 to 0.99 for 33 out of 34 ROIs. Exceptions included the insula (0.799). Paired t-tests indicated that mean surface areas did not differ significantly between any pairs of unedited and edited regions. However, several regions tended to differ, including the fusiform gyrus (p = 0.002), the lateral orbitofrontal area (p = 0.003), and the inferior temporal lobe (p = 0.004).
For the 3T data, the mean effect sizes for edited and unedited measures of surface area did not differ. The mean arithmetic difference in effect size between edited and unedited surface area ROIs was −0.028 (SD 0.12). The regions with the largest differences in effect sizes between the edited and unedited methods were the entorhinal cortex (0.21), pericalcarine cortex (−0.29), the rostral anterior cingulate (0.26), and the temporal pole (0.287).
White Matter Volumes
No significant differences were observed in the variances of white matter volumes between edited and unedited ROIs. Intraclass correlation analyses between unedited and edited white matter volumes yielded coefficients ranging from 0.90 to 1.00 for all ROIs. After Bonferonni correction, the mean white matter volumes did not differ significantly between any pairs of unedited and edited regions, however the fusiform gyrus (p < 0.005) and the pars orbitalis (p < 0.005) approached significance.
The mean effect size for edited measures of white matter volume did not differ significantly from the mean effect size for unedited measures. The mean arithmetic difference in effect size between edited and unedited white matter ROIs was −0.013 (SD 0.11). The regions with the largest differences in effect size between the unedited and edited methods were the frontal pole (0.369), temporal pole (0.22), transverse temporal cortex (0.21) and insula (0.25).
Cortical Thickness
No significant differences in the 3T data were observed in variances of cortical thickness between edited and unedited ROIs. Intraclass correlation analyses between unedited and edited measures of cortical thickness yielded coefficients ranging from 0.86 to 0.986 for 32 out of 34 ROIs. Exceptions included medial orbitofrontal cortex (0.65) and the insula (0.81). In contrast to 1.5T data, mean cortical thickness differed significantly between 7 of the 34 pairs of unedited and edited regions, including the banks of the superior temporal sulcus, entorhinal cortex, fusiform gyrus, inferior temporal gyrus, lateral orbitofrontal cortex, medial orbitofrontal cortex and rostral middle frontal cortex (all p < 0.001). Moreover, an additional 3 ROIs approached significance, including the superior frontal gyrus (p < 0.003), precentralgyrus (p < 0.004) and the caudal middle frontal gyrus (p < 0.004).
The mean effect size for edited measures of cortical thickness did not differ significantly from the mean effect size for unedited measures. The mean arithmetic difference in effect size between edited and unedited measures of cortical thickness was 0.07 (SD 0.15). The regions with the largest differences in effect sizes were the lateral orbitofrontal cortex (0.226), the lingual gyrus (−0.439), the rostral anterior cingulate (0.244) and the insula (−0.47).
Discussion
In the last 5 years, FreeSurfer (FS) has become the standard for obtaining cortical metrics from MRI images due to its ease of configuration, accurate results, and high reproducibility (Fischl et al., 2002; Tae et al., 2008; Bhojraj et al., 2011). However, there has been a lack of consensus around whether or not additional manual editing is required in order to increase the ability to detect effects between groups. This is the first study, to the best of our knowledge, to directly compare FS's fully automated method to that of FS's semi-automated manual intervention method that utilizes control points to alter gray-white matter boundaries. Overall we found very few differences between methodological approaches, although we do note specific exceptions below.
1.5T Data
We found few differences between methodological approaches when using the FS segmentation process to obtain surface areas from 1.5T images. The absence of differences in variance, and the high level of intraclass correlation coefficients between the regions in edited and unedited brains support previous studies that have established the consistency and reproducibility of the fully automated FS segmentation process (Fischl et al., 2002). As found in previous studies, the regions where differences were observed, i.e., the entorhinal cortex and parahippocampal gyrus, are common locations for imaging artifacts (Oguz et al., 2008; Desikan et al., 2010). These results support previous research into FS's difficulty obtaining measurements in similar scenarios, rather than suggesting a difference between the two methods (Desikan et al., 2010). This is supported by an absence of significant differences in the mean volumes and mean effect sizes between the two methods for measuring surface areas.
Although some differences were observed in white matter volume variance, the absence of consistently larger effect sizes for either method further indicates that the differences should not be viewed as a higher level of accuracy in volume segmentation for either method. One exception may be the lateral orbitofrontal cortex, for which we observed significant differences in mean volume. Due to motion which causes commonly-occurring imaging artifacts, the lateral orbitofrontal cortex is a region where raters make numerous corrections (i.e., using control points) during the FS pipeline. Although in our data, the difference in effect size between our patient and control samples was negligible for this region, that may not be the case for other populations and therefore automated white matter volumes derived for this region in general, when using a 1.5T scanner, should be viewed with caution.
As described in the methods section, cortical thickness is derived from the distance between the white matter surface, which follows the border between white and gray matter, and the pial surface, which follows the border between gray matter and cerebrospinal fluid. Since manually inserting control points affects where those surfaces are positioned, the differences between the methods should be most pronounced in cortical thickness measurements. Although there was an absence of difference in the variance, ICC's, and mean cortical thickness for most regions, the difference in effect sizes was surprising. The caudal anterior cingulate, superior frontal gyrus, supramarginal gyrus, and temporal pole all had effect sizes which favored the edited method, but do not typically require many control points. On the other hand, the region that favored the unedited method, the fusiform gyrus, usually needs heavier manual correction to exclude hyper intensities. Although further exploration is needed in order to determine what specifically caused the unexpected results, it is possible that errors in the automated segmentation are more pronounced in 22q11DS due to enlarged ventricles, and that fusiform gyrus matter was incorrectly excluded in the unedited brains, giving the appearance of a larger effect then was actually present. Nonetheless, the lack of consistently significant differences in variances and mean cortical thickness volumes between the edited methods further supports the notion that manual intervention for 1.5T images in FS's automated process does not provide an increase in ability to detect an effect size between groups commensurate with the human hours required.
3T Data
The results for surface area and white matter volume in 3T data are similar to what was observed for the 1.5T data, and suggest that consistency in method is most likely more important than the choice between the fully automated and the manual-edit procedures. This is corroborated by similar effect sizes observed for both the manual and automated process, with the exception of temporal and occipital lobe structures affected by the issues described above.
Although no significant differences were observed in cortical thickness variance between the two groups, a notable difference in the results between the 1.5T and 3T data were 7 regions with differences in mean cortical thickness. The relatively large number of regions in the 3T for which we observed differences, and the fact that the same differences weren't present in 1.5T data warrant further explanation. In particular, the superior temporal sulcus, and the lateral and medial orbitofrontal cortices typically require manual editing in both the 1.5T and 3T data.
It is possible that due to the higher contrast in 3T scans, the control points had greater success in correcting misplaced surfaces than in the 1.5 scans, potentially resulting in more accurate surfaces and cortical thickness measurements. This would have been supported by larger effect sizes in those regions for the brains which had been edited. However, such an effect was only observed for the lateral orbitofrontal cortex, and overall the differences between effect sizes for any region were evenly split between the edited and unedited methods. Therefore, it is evident that although there were differences between the two methods, editing the brain images didn't translate into our ability to detect group differences more readily with one method or the other.
Limitations
Artifacts due to intensity inhomogeneity, head motion, reduced signal to noise ratio, and partial volume effects can all lead to reduced image quality, alterations in intensity values and, ultimately, errors in image segmentation. These issues may be magnified in higher field-strength data secondary to increases in B1 field inhomogeneity (Marques et al., 2010), potentially necessitating more manual editing of higher field-strength images. Acquiring and averaging multiple acquisitions, which improves signal-to-noise and contrast-to-noise ratios, and reduces motion artifacts, can address these issues (Kochunov et al., 2006; Winkler et al., 2010). The present analyses were based on a single sequence acquisition, which therefore constitutes a limitation to our study. Multiple sequence acquisition carries trade-offs in both scanning cost and time, which can deter researchers. In the present study, the sample consisted, in part, of school-aged children with intellectual disability and, in many cases, attention deficit hyperactivity disorder. Accordingly, we had to strike a balance between optimizing the quality of our images while maintaining a timeframe that our sample would tolerate. This may have necessitated more manual intervention to correct errors in segmentation.
Although we observed similarities in the metrics we extracted from the different regions of the brain, we did not conduct an overlap analysis to determine whether the ROIs had a high level of spatial overlap. It is possible that the regions appear to be similar numerically, but have different boundaries with one methodological approach more accurately denoting the region it represents. Another limitation is that both the 1.5T and 3T data used were manually skull stripped prior to implementing the FS pipeline: if brains were run fully automated, they would be subject to the automated skull stripping module included within FS. However, we do not believe that had a significant effect on our results, and previous research supports this notion (Fennema-Notestine et al., 2006). Our processing pipeline may have also been limited by the fact that we did not assess the quality of the images (e.g., signal to noise ratio) prior to processing the data, which may have affected the extent to which manual interventions were needed.
Conclusions
This study is significant in that it shows that the additional time and cost necessary to manually correct the FS segmentation process does not necessarily increase one's ability to detect differences in cortical measurements between groups. Future studies should be conducted with larger and more diverse samples in order to provide additional insight into the differences between methods. In addition, since the temporal and frontal lobe contain numerous regions affected by disorders like Alzheimer disease and schizophrenia, and many of the differences we observed were within those lobes, additional research should focus on methods which can increase the segmentation accuracy specifically in those regions.
Authors Contributions
WK, IC, and CM designed the study. CM, CT, and JB completed all image processing for the study. IC and WK completed all statistical analyses of the imaging data. AR, CM, and WK wrote the manuscript. All authors revised the manuscript for accuracy and intellectual content, and all authors approved the final manuscript.
Conflict of Interest Statement
The authors declare that the research was conducted in the absence of any commercial or financial relationships that could be construed as a potential conflict of interest.
Acknowledgments
This research was supported by the National Institutes of Health, MH064824, to WK. The authors thank Margaret Mariano for her editorial assistance.
Supplementary Material
The Supplementary Material for this article can be found online at: http://journal.frontiersin.org/article/10.3389/fnins.2015.00379
Footnotes
1. ^http://web.archive.org/web/20150901150339/http://surfer.nmr.mgh.harvard.edu/fswiki.
2. ^http://web.archive.org/web/20150901145928/https://surfer.nmr.mgh.harvard.edu/fswiki/FsTutorial/ControlPoints_freeview.
3. ^http://web.archive.org/web/20150901150038/https://surfer.nmr.mgh.harvard.edu/fswiki/FsTutorial/WhiteMatterEdits_freeview.
References
Alner, K., Hyare, H., Mead, S., Rudge, P., Wroe, S., Rohrer, J. D., et al. (2012). Distinct neuropsychological profiles corresponded to distribution of cortical thinning in inherited prion disease caused by insertional mutation. J. Neurol. Neurosurg. Psychiatry 83, 109–114. doi: 10.1136/jnnp-2011-300167
Anticevic, A., Repovs, G., Dierker, D. L., Harwell, J. W., Coalson, T. S., Barch, D. M., et al. (2012). Automated landmark identification for human cortical surface-based registration. Neuroimage 59, 2539–2547. doi: 10.1016/j.neuroimage.2011.08.093
Barnes, J., Ridgway, G. R., Bartlett, J., Henley, S. M., Lehmann, M., Hobbs, N., et al. (2010). Head size, age and gender adjustment in MRI studies: a necessary nuisance? Neuroimage 53, 1244–1255. doi: 10.1016/j.neuroimage.2010.06.025
Batty, M. J., Liddle, E. B., Pitiot, A., Toro, R., Groom, M. J., Scerif, G., et al. (2010). Cortical gray matter in attention-deficit/hyperactivity disorder: a structural magnetic resonance imaging study. J. Am. Acad. Child Adolesc. Psychiatry 49, 229–238. doi: 10.1097/00004583-201003000-00006
Benedict, R. H., Ramasamy, D., Munschauer, F., Weinstock-Guttman, B., and Zivadinov, R. (2009). Memory impairment in multiple sclerosis: correlation with deep grey matter and mesial temporal atrophy. J. Neurol. Neurosurg. Psychiatry 80, 201–206. doi: 10.1136/jnnp.2008.148403
Bhojraj, T. S., Sweeney, J. A., Prasad, K. M., Eack, S., Rajarethinam, R., Francis, A. N., et al. (2011). Progressive alterations of the auditory association areas in young non-psychotic offspring of schizophrenia patients. J. Psychiatr. Res. 45, 205–212. doi: 10.1016/j.jpsychires.2010.05.018
Bomboi, G., Ikonomidou, V. N., Pellegrini, S., Stern, S. K., Gallo, A., Auh, S., et al. (2011). Quality and quantity of diffuse and focal white matter disease and cognitive disability of patients with multiple sclerosis. J. Neuroimaging 21, e57–e63. doi: 10.1111/j.1552-6569.2010.00488.x
Bray, S., Hirt, M., Jo, B., Hall, S. S., Lightbody, A. A., Walter, E., et al. (2011). Aberrant frontal lobe maturation in adolescents with fragile X syndrome is related to delayed cognitive maturation. Biol. Psychiatry 70, 852–858. doi: 10.1016/j.biopsych.2011.05.038
Cerasa, A., Quattrone, A., Gioia, M. C., Magariello, A., Muglia, M., Assogna, F., et al. (2011). MAO A VNTR polymorphism and amygdala volume in healthy subjects. Psychiatry Res. 191, 87–91. doi: 10.1016/j.pscychresns.2010.11.002
Cherbuin, N., Anstey, K. J., Réglade-Meslin, C., and Sachdev, P. S. (2009). In vivo hippocampal measurement and memory: a comparison of manual tracing and automated segmentation in a large community-based sample. PLoS ONE 4:e5265. doi: 10.1371/journal.pone.0005265
Chiang, G. C., Insel, P. S., Tosun, D., Schuff, N., Truran-Sacrey, D., Raptentsetsang, S., et al. (2011). Identifying cognitively healthy elderly individuals with subsequent memory decline by using automated MR temporoparietal volumes. Radiology 259, 844–851. doi: 10.1148/radiol.11101637
Clarkson, M. J., Cardoso, M. J., Ridgway, G. R., Modat, M., Leung, K. K., Rohrer, J. D., et al. (2011). A comparison of voxel and surface based cortical thickness estimation methods. Neuroimage 57, 856–865. doi: 10.1016/j.neuroimage.2011.05.053
Dalaker, T. O., Zivadinov, R., Ramasamy, D. P., Beyer, M. K., Alves, G., Bronnick, K. S., et al. (2011). Ventricular enlargement and mild cognitive impairment in early parkinson's disease. Mov. Disord. 26, 297–301. doi: 10.1002/mds.23443
Dale, A. M., Fischl, B., and Sereno, M. I. (1999). Cortical surface-based analysis. I. segmentation and surface reconstruction. Neuroimage 9, 179–194. doi: 10.1006/nimg.1998.0395
Dale, A. M., and Sereno, M. I. (1993). Improved localization of cortical activity by combining EEG and MEG with MRI cortical surface reconstruction: a linear approach. J. Cogn. Neurosci. 5, 162–176. doi: 10.1162/jocn.1993.5.2.162
Desikan, R. S., Cabral, H. J., Settecase, F., Hess, C. P., Dillon, W. P., Glastonbury, C. M., et al. (2010). Automated MRI measures predict progression to alzheimer's disease. Neurobiol. Aging 31, 1364–1374. doi: 10.1016/j.neurobiolaging.2010.04.023
Desikan, R. S., Ségonne, F., Fischl, B., Quinn, B. T., Dickerson, B. C., Blacker, D., et al. (2006). An automated labeling system for subdividing the human cerebral cortex on MRI scans into gyral based regions of interest. Neuroimage 31, 968–980. doi: 10.1016/j.neuroimage.2006.01.021
Dickerson, B. C., Miller, S. L., Greve, D. N., Dale, A. M., Albert, M. S., Schacter, D. L., et al. (2007). Prefrontal-hippocampal-fusiform activity during encoding predicts intraindividual differences in free recall ability: an event-related functional-anatomic MRI study. Hippocampus 17, 1060–1070. doi: 10.1002/hipo.20338
Du, A. T., Schuff, N., Kramer, J. H., Rosen, H. J., Gorno-Tempini, M. L., Rankin, K., et al. (2007). Different regional patterns of cortical thinning in alzheimer's disease and frontotemporal dementia. Brain 4, 1159–1166. doi: 10.1093/brain/awm016
Durand-Dubief, F., Belaroussi, B., Armspach, J. P., Dufour, M., Roggerone, S., Vukusic, S., et al. (2012). Reliability of longitudinal brain volume loss measurements between 2 sites in patients with multiple sclerosis: comparison of 7 quantification techniques. AJNR. Am. J. Neuroradiol. 33, 1918–1924. doi: 10.3174/ajnr.A3107
Dykstra, A. R., Chan, A. M., Quinn, B. T., Zepeda, R., Keller, C. J., Cormier, J., et al. (2012). Individualized localization and cortical surface-based registration of intracranial electrodes. Neuroimage 59, 3563–3570. doi: 10.1016/j.neuroimage.2011.11.046
Eggert, L. D., Sommer, J., Jansen, A., Kircher, T., and Konrad, C. (2012). Accuracy and reliability of automated gray matter segmentation pathways on real and simulated structural magnetic resonance images of the human brain. PLoS ONE 7:e45081. doi: 10.1371/journal.pone.0045081
Ehrlich, S., Brauns, S., Yendiki, A., Ho, B. C., Calhoun, V., Schulz, S. C., et al. (2012). Associations of cortical thickness and cognition in patients with schizophrenia and healthy controls. Schizophr. Bull. 38, 1050–1062. doi: 10.1093/schbul/sbr018
Eyler, L. T., Prom-Wormley, E., Panizzon, M. S., Kaup, A. R., Fennema-Notestine, C., Neale, M. C., et al. (2011). Genetic and environmental contributions to regional cortical surface area in humans: a magnetic resonance imaging twin study. Cereb. Cortex 21, 2313–2321. doi: 10.1093/cercor/bhr013
Feczko, E., Augustinack, J. C., Fischl, B., and Dickerson, B. C. (2009). An MRI-based method for measuring volume, thickness and surface area of entorhinal, perirhinal, and posterior parahippocampal cortex. Neurobiol. Aging 30, 420–431. doi: 10.1016/j.neurobiolaging.2007.07.023
Fedorov, A., Beichel, R., Kalpathy-Cramer, J., Finet, J., Fillion-Robin, J-C., Pujol, S., et al. (2012). 3D slicer as an image computing platform for the quantitative imaging network. Magn. Reson. Imaging. 30, 1323–1341. doi: 10.1016/j.mri.2012.05.001
Fennema-Notestine, C., Gamst, A. C., Quinn, B. T., Pacheco, J., Jernigan, T. L., Thal, L., et al. (2007). Feasibility of multi-site clinical structural neuroimaging studies of aging using legacy data. Neuroinformatics 5, 235–245. doi: 10.1007/s12021-007-9003-9
Fennema-Notestine, C., Hagler, D. J. Jr., McEvoy, L. K., Fleisher, A. S., Wu, E. H., Karow, D. S., et al. (2009). Structural MRI biomarkers for preclinical and mild alzheimer's disease. Hum. Brain Mapp. 30, 3238–3253. doi: 10.1002/hbm.20744
Fennema-Notestine, C., Ozyurt, I. B., Clark, C. P., Morris, S., Bischoff-Grethe, A., Bondi, M. W., et al. (2006). Quantitative evaluation of automated skull-stripping methods applied to contemporary and legacy images: effects of diagnosis, bias correction, and slice location. Hum. Brain Mapp. 27, 99–113. doi: 10.1002/hbm.20161
Fischl, B., and Dale, A. M. (2000). Measuring the thickness of the human cerebral cortex from magnetic resonance images. Proc. Natl. Acad. Sci. U.S.A. 97, 11050–11055. doi: 10.1073/pnas.200033797
Fischl, B., Liu, A., and Dale, A. M. (2001). Automated manifold surgery: constructing geometrically accurate and topologically correct models of the human cerebral cortex. IEEE Trans. Med. Imaging. 20, 70–80. doi: 10.1109/42.906426
Fischl, B., Salat, D. H., Busa, E., Albert, M., Dieterich, M., Haselgrove, C., et al. (2002). Whole brain segmentation: automated labeling of neuroanatomical structures in the human brain. Neuron 33, 341–355. doi: 10.1016/S0896-6273(02)00569-X
Fischl, B., Salat, D. H., van der Kouwe, A. J., Makris, N., Ségonne, F., Quinn, B. T., et al. (2004a). Sequence-independent segmentation of magnetic resonance images. Neuroimage 23, S69–S84. doi: 10.1016/j.neuroimage.2004.07.016
Fischl, B., Sereno, M. I., and Dale, A. M. (1999a). Cortical surface-based analysis. II: inflation, flattening, and a surface-based coordinate system. Neuroimage 9, 195–207. doi: 10.1006/nimg.1998.0396
Fischl, B., Sereno, M. I., Tootell, R. B., and Dale, A. M. (1999b). High-resolution intersubject averaging and a coordinate system for the cortical surface. Hum. Brain. Mapp. 8, 272–284.
Fischl, B., van der Kouwe, A., Destrieux, C., Halgren, E., Ségonne, F., Salat, D. H., et al. (2004b). Automatically parcellating the human cerebral cortex. Cereb. Cortex 14, 11–22. doi: 10.1093/cercor/bhg087
Fjell, A. M., Westlye, L. T., Amlien, I., Espeseth, T., Reinvang, I., Raz, N., et al. (2009). High consistency of regional cortical thinning in aging across multiple samples. Cereb. Cortex 19, 2001–2012. doi: 10.1093/cercor/bhn232
Francis, A. N., Bhojraj, T. S., Prasad, K. M., Kulkarni, S., Montrose, D. M., Eack, S. M., et al. (2011). Abnormalities of the corpus callosum in non-psychotic high-risk offspring of schizophrenia patients. Psychiatry Res. 191, 9–15. doi: 10.1016/j.pscychresns.2010.09.007
Fujimoto, K., Polimeni, J. R., van der Kouwe, A. J., Reuter, M., Kober, T., Benner, T., et al. (2014). Quantitative comparison of cortical surface reconstructions from MP2RAGE and multi-echo MPRAGE data at 3 and 7 T. Neuroimage 90, 60–73. doi: 10.1016/j.neuroimage.2013.12.012
Furst, A. J., and Lal, R. A. (2011). Amyloid-beta and glucose metabolism in alzheimer's disease. J. Alzheimers Dis. 26(Suppl. 3), 105–116. doi: 10.3233/JAD-2011-0066
Goghari, V. M., Rehm, K., Carter, C. S., and MacDonald, A. W. (2007a). Sulcal thickness as a vulnerability indicator for schizophrenia. Br. J. Psychiatry 191, 229–233. doi: 10.1192/bjp.bp.106.034595
Goghari, V. M., Rehm, K., Carter, C. S., and MacDonald, A. W. III. (2007b). Regionally specific cortical thinning and gray matter abnormalities in the healthy relatives of schizophrenia patients. Cereb. Cortex 17, 415–424. doi: 10.1093/cercor/bhj158
Goldman, A. L., Pezawas, L., Mattay, V. S., Fischl, B., Verchinski, B. A., Chen, Q., et al. (2009). Widespread reductions of cortical thickness in schizophrenia and spectrum disorders and evidence of heritability. Arch. Gen. Psychiatry 66, 467–477. doi: 10.1001/archgenpsychiatry.2009.24
Gronenschild, E. H., Habets, P., Jacobs, H. I., Mengelers, R., Rozendaal, N., van Os, J., et al. (2012). The effects of FreeSurfer version, workstation type, and macintosh operating system version on anatomical volume and cortical thickness measurements. PLoS ONE 7:e38234. doi: 10.1371/journal.pone.0038234
Gutierrez-Galve, L., Lehmann, M., Hobbs, N. Z., Clarkson, M. J., Ridgway, G. R., Crutch, S., et al. (2009). Patterns of cortical thickness according to APOE genotype in alzheimer's disease. Dement. GeriatrCogn. Disord. 28, 476–485. doi: 10.1159/000258100
Han, X., Jovicich, J., Salat, D., van der Kouwe, A., Quinn, B., Czanner, S., et al. (2006). Reliability of MRI-derived measurements of human cerebral cortical thickness: the effects of field strength, scanner upgrade and manufacturer. Neuroimage 32, 180–194. doi: 10.1016/j.neuroimage.2006.02.051
Hinds, O., Polimeni, J. R., Rajendran, N., Balasubramanian, M., Amunts, K., Zilles, K., et al. (2009). Locating the functional and anatomical boundaries of human primary visual cortex. Neuroimage 46, 915–922. doi: 10.1016/j.neuroimage.2009.03.036
Iglesias, J. E., Liu, C. Y., Thompson, P. M., and Tu, Z. (2011). Robust brain extraction across datasets and comparison with publicly available methods. IEEE Trans. Med. Imaging 30, 1617–1634. doi: 10.1109/TMI.2011.2138152
Jovicich, J., Czanner, S., Greve, D., Haley, E., van der Kouwe, A., Gollub, R., et al. (2006). Reliability in multi-site structural MRI studies: effects of gradient non-linearity correction on phantom and human data. Neuroimage 30, 436–443. doi: 10.1016/j.neuroimage.2005.09.046
Kates, W. R., Antshel, K. M., Faraone, S. V., Fremont, W. P., Higgins, A. M., Shprintzen, R. J., et al. (2011a). Neuroanatomic predictors to prodromal psychosis in velocardiofacial syndrome (22q11.2 deletion syndrome): a longitudinal study. Biol. Psychiatry 69, 945–952. doi: 10.1016/j.biopsych.2010.10.027
Kates, W. R., Bansal, R., Fremont, W., Antshel, K. M., Hao, X., Higgins, A. M., et al. (2011b). Mapping cortical morphology in youth with velocardiofacial (22q11.2 deletion) syndrome. J. Am. Acad. Child Adolesc. Psychiatry 50, 272–282.e2. doi: 10.1016/j.jaac.2010.12.002
Keller, S. S., Gerdes, J. S., Mohammadi, S., Kellinghaus, C., Kugel, H., Deppe, K., et al. (2012). Volume estimation of the thalamus using freesurfer and stereology: consistency between methods. Neuroinformatics 10, 341–350. doi: 10.1007/s12021-012-9147-0
Khan, A. R., Wang, L., and Beg, M. F. (2008). FreeSurfer-initiated fully-automated subcortical brain segmentation in MRI using large deformation diffeomorphic metric mapping. Neuroimage 41, 735–746. doi: 10.1016/j.neuroimage.2008.03.024
Klein, A., and Tourville, J. (2012). 101 labeled brain images and a consistent human cortical labeling protocol. Front. Neurosci. 6:171. doi: 10.3389/fnins.2012.00171
Kochunov, P., Lancaster, J. L., Glahn, D. C., Purdy, D., Laird, A. R., Gao, F., et al. (2006). Retrospective motion correction protocol for high-resolution anatomical MRI. Hum. Brain Mapp. 27, 957–962. doi: 10.1002/hbm.20235
Kremen, W. S., Prom-Wormley, E., Panizzon, M. S., Eyler, L. T., Fischl, B., Neale, M. C., et al. (2010). Genetic and environmental influences on the size of specific brain regions in midlife: the VETSA MRI study. Neuroimage 49, 1213–1223. doi: 10.1016/j.neuroimage.2009.09.043
Lee, J. K., Lee, J. M., Kim, J. S., Kim, I. Y., Evans, A. C., and Kim, S. I. (2006). A novel quantitative cross-validation of different cortical surface reconstruction algorithms using MRI phantom. Neuroimage 31, 572–584. doi: 10.1016/j.neuroimage.2005.12.044
Lehmann, M., Rohrer, J. D., Clarkson, M. J., Ridgway, G. R., Scahill, R. I., Modat, M., et al. (2010). Reduced cortical thickness in the posterior cingulate gyrus is characteristic of both typical and atypical alzheimer's disease. J. Alzheimers Dis. 20, 587–598. doi: 10.3233/JAD-2010-1401
Levinski, K., Sourin, A., and andZagorodnov, V. (2009). Interactive surface-guided segmentation of brain MRI data. Comput. Biol. Med. 39, 1153–1160. doi: 10.1016/j.compbiomed.2009.10.008
Mahone, E. M., Ranta, M. E., Crocetti, D., O'Brien, J., Kaufmann, W. E., Denckla, M. B., et al. (2011). Comprehensive examination of frontal regions in boys and girls with attention-deficit/hyperactivity disorder. J. Int. Neuropsychol. Soc. 17, 1047–1057. doi: 10.1017/S1355617711001056
Makris, N., Biederman, J., Valera, E. M., Bush, G., Kaiser, J., Kennedy, D. N., et al. (2007). Cortical thinning of the attention and executive function networks in adults with attention-deficit/hyperactivity disorder. Cereb. Cortex 17, 1364–1375. doi: 10.1093/cercor/bhl047
Marques, J. P., Kober, T., Krueger, G., van der Zwaag, W., and van de Moortele, P-F. (2010). MP2RAGE, a self bias-field corrected sequence for improved segmentation and T1-mapping at high field. Neuroimage 49, 1271–1281. doi: 10.1016/j.neuroimage.2009.10.002
Moore, D. W., Kovanlikaya, I., Heier, L. A., Raj, A., Huang, C., Chu, K. W., et al. (2012). A pilot study of quantitative MRI measurements of ventricular volume and cortical atrophy for the differential diagnosis of normal pressure hydrocephalus. Neurol. Res. Int. 2012:718150. doi: 10.1155/2012/718150
Morey, R. A., Petty, C. M., Xu, Y., Hayes, J. P., Wagner, H. R. II., Lewis, D. V., et al. (2009). A comparison of automated segmentation and manual tracing for quantifying hippocampal and amygdala volumes. Neuroimage 45, 855–866. doi: 10.1016/j.neuroimage.2008.12.033
Mueller, S. G., Schuff, N., Yaffe, K., Madison, C., Miller, B., and Weiner, M. W. (2010). Hippocampal atrophy patterns in mild cognitive impairment and alzheimer's disease. Hum. Brain Mapp. 31, 1339–1347. doi: 10.1002/hbm.20934
Murakami, M., Takao, H., Abe, O., Yamasue, H., Sasaki, H., Gonoi, W., et al. (2011). Cortical thickness, gray matter volume, and white matter anisotropy and diffusivity in schizophrenia. Neuroradiology 53, 859–866. doi: 10.1007/s00234-010-0830-2
Nesvåg, R., Saetre, P., Lawyer, G., Jonsson, E. G., and Agartz, I. (2009). The relationship between symptom severity and regional cortical and grey matter volumes in schizophrenia. Prog. Neuropsychopharmacol. Biol. Psychiatry 33, 482–490. doi: 10.1016/j.pnpbp.2009.01.013
Noble, K. G., Houston, S. M., Kan, E., and Sowell, E. R. (2012). Neural correlates of socioeconomic status in the developing human brain. Dev. Sci. 15, 516–527. doi: 10.1111/j.1467-7687.2012.01147.x
O'Donnell, S., Noseworthy, M. D., Levine, B., and Dennis, M. (2005). Cortical thickness of the frontopolar area in typically developing children and adolescents. Neuroimage 24, 948–954. doi: 10.1016/j.neuroimage.2004.10.014
Oertel-Knöchel, V., Knöchel, C., Rotarska-Jagiela, A., Reinke, B., Prvulovic, D., Haenschel, C., et al. (2013). Association between psychotic symptoms and cortical thickness reduction across the schizophrenia spectrum. Cereb. Cortex 23, 61–70. doi: 10.1093/cercor/bhr380
Oguz, I., Cates, J., Fletcher, T., Whitaker, R., Cool, D., Aylward, S., et al. (2008). “Cortical correspondence using entropy-based particle systems and local features,” in 5th IEEE International Symposium on Biomedical Imaging: From Nano to Macro, 2008. ISBI 2008 (Paris), 1637–1640.
Ostby, Y., Tamnes, C. K., Fjell, A. M., Westlye, L. T., Due-Tonnessen, P., and Walhovd, K. B. (2009). Heterogeneity in subcortical brain development: a structural magnetic resonance imaging study of brain maturation from 8 to 30 years. J. Neurosci. 29, 11772–11782. doi: 10.1523/JNEUROSCI.1242-09.2009
Panizzon, M. S., Fennema-Notestine, C., Eyler, L. T., Jernigan, T. L., Prom-Wormley, E., Neale, M., et al. (2009). Distinct genetic influences on cortical surface area and cortical thickness. Cereb. Cortex 19, 2728–2735. doi: 10.1093/cercor/bhp026
Park, H. J., Kubicki, M., Westin, C. F., Talos, I. F., Brun, A., Peiper, S., et al. (2004). Method for combining information from white matter fiber tracking and gray matter parcellation. AJNR. Am. J. Neuroadiol. 25, 1318–1324.
Park, H. J., Lee, J. D., Kim, E. Y., Park, B., Oh, M. K., Lee, S., et al. (2009). Morphological alterations in the congenital blind based on the analysis of cortical thickness and surface area. Neuroimage 47, 98–106. doi: 10.1016/j.neuroimage.2009.03.076
Pellicano, C., Gallo, A., Li, X., Ikonomidou, V. N., Evangelou, I. E., Ohayon, J. M., et al. (2010). Relationship of cortical atrophy to fatigue in patients with multiple sclerosis. Arch. Neurol. 67, 447–453. doi: 10.1001/archneurol.2010.48
Pengas, G., Pereira, J. M., Williams, G. B., and Nestor, P. J. (2009). Comparative reliability of total intracranial volume estimation methods and the influence of atrophy in a longitudinal semantic dementia cohort. J. Neuroimaging 19, 37–46. doi: 10.1111/j.1552-6569.2008.00246.x
Pfefferbaum, A., Rohlfing, T., Rosenbloom, M. J., and Sullivan, E. V. (2012). Combining atlas-based parcellation of regional brain data acquired across scanners at 1.5 T and 3.0 T field strengths. Neuroimage 60, 940–951. doi: 10.1016/j.neuroimage.2012.01.092
Poulin, S. P., Dautoff, R., Morris, J. C., Barrett, L. F., Dickerson, B. C., and Alzheimer's Disease Neuroimaging Initiative. (2011). Amygdala atrophy is prominent in early alzheimer's disease and relates to symptom severity. Psychiatry Res. 194, 7–13. doi: 10.1016/j.pscychresns.2011.06.014
Putcha, D., Brickhouse, M., O'Keefe, K., Sullivan, C., Rentz, D., Marshall, G., et al. (2011). Hippocampal hyperactivation associated with cortical thinning in alzheimer's disease signature regions in non-demented elderly adults. J. Neurosci. 31, 17680–17688. doi: 10.1523/JNEUROSCI.4740-11.2011
Raj, A., Mueller, S. G., Young, K., Laxer, K. D., and Weiner, M. (2010). Network-level analysis of cortical thickness of the epileptic brain. Neuroimage 52, 1302–1313. doi: 10.1016/j.neuroimage.2010.05.045
Ramasamy, D. P., Benedict, R. H., Cox, J. L., Fritz, D., Abdelrahman, N., Hussein, S., et al. (2009). Extent of cerebellum, subcortical and cortical atrophy in patients with MS: a case-control study. J. Neurol. Sci. 282, 47–54. doi: 10.1016/j.jns.2008.12.034
Rimol, L. M., Hartberg, C. B., Nesvåg, R., Fennema-Notestine, C., Hagler, D. J. Jr., Pung, C. J., et al. (2010). Cortical thickness and subcortical volumes in schizophrenia and bipolar disorder. Biol. Psychiatry 68, 41–50. doi: 10.1016/j.biopsych.2010.03.036
Rohrer, J. D., Warren, J. D., Modat, M., Ridgway, G. R., Douiri, A., Rossor, M. N., et al. (2009). Patterns of cortical thinning in the language variants of frontotemporal lobar degeneration. Neurology 72, 1562–1569. doi: 10.1212/WNL.0b013e3181a4124e
Romero-Garcia, R., Atienza, M., Clemmensen, L. H., and Cantero, J. L. (2012). Effects of network resolution on topological properties of human neocortex. Neuroimage 59, 3522–3532. doi: 10.1016/j.neuroimage.2011.10.086
Safford, A. S., Hussey, E. A., Parasuraman, R., and Thompson, J. C. (2010). Object-based attentional modulation of biological motion processing: spatiotemporal dynamics using functional magnetic resonance imaging and electroencephalography. J. Neurosci. 30, 9064–9073. doi: 10.1523/JNEUROSCI.1779-10.2010
Salat, D. H., Buckner, R. L., Snyder, A. Z., Greve, D. N., Desikan, R. S., Busa, E., et al. (2004). Thinning of the cerebral cortex in aging. Cereb. Cortex 14, 721–730. doi: 10.1093/cercor/bhh032
Schultz, C. C., Koch, K., Wagner, G., Roebel, M., Nenadic, I., Gaser, C., et al. (2010a). Increased parahippocampal and lingual gyrification in first-episode schizophrenia. Schizophr. Res. 123, 137–144. doi: 10.1016/j.schres.2010.08.033
Schultz, C. C., Koch, K., Wagner, G., Roebel, M., Schachtzabel, C., Nenadic, I., et al. (2010b). Psychopathological correlates of the entorhinal cortical shape in schizophrenia. Eur. Arch. Psychiatry Clin. Neurosci. 260, 351–358. doi: 10.1007/s00406-009-0083-4
Ségonne, F., Dale, A. M., Busa, E., Glessner, M., Salat, D., Hahn, H. K., et al. (2004). A hybrid approach to the skull stripping problem in MRI. Neuroimage 22, 1060–1075. doi: 10.1016/j.neuroimage.2004.03.032
Ségonne, F., Pacheco, J., and Fischl, B. (2007). Geometrically accurate topology-correction of cortical surfaces using nonseparating loops. IEEE Trans. Med. Imaging 26, 518–529. doi: 10.1109/TMI.2006.887364
Shattuck, D. W., Prasad, G., Mirza, M., Narr, K. L., and Toga, A. W. (2009). Online resource for validation of brain segmentation methods. Neuroimage 45, 431–439. doi: 10.1016/j.neuroimage.2008.10.066
Sled, J. G., Zijdenbos, A. P., and Evans, A. C. (1998). A nonparametric method for automatic correction of intensity nonuniformity in MRI data. IEEE Trans. Med. Imaging 17, 87–97. doi: 10.1109/42.668698
Strangman, G. E., O'Neil-Pirozzi, T. M., Supelana, C., Goldstein, R., Katz, D. I., and Glenn, M. B. (2010). Regional brain morphometry predicts memory rehabilitation outcome after traumatic brain injury. Front. Hum. Neurosci. 4:182. doi: 10.3389/fnhum.2010.00182
Subramaniam, B., Hennessey, J. G., Rubin, M. A., Beach, L. S., and Reiss, A. L. (1997). “Software and methods for quantitative imaging in neuroscience: the Kennedy Krieger Institute Human Brain Project,” in Neuroinformatics: An Overview of the Human Brain Project, eds S. H. Koskow and M. F. Huerta (Mahwah, NJ: Lawrence Erlbaum), 335–360.
Tae, W. S., Kim, S. S., Lee, K. U., Nam, E. C., and Kim, K. W. (2008). Validation of hippocampal volumes measured using a manual method and two automated methods (FreeSurfer and IBASPM) in chronic major depressive disorder. Neuroradiology 50, 569–581. doi: 10.1007/s00234-008-0383-9
Tomasevic, L., Zito, G., Pasqualetti, P., Filippi, M., Landi, D., Ghazaryan, A., et al. (2013). Cortico-muscular coherence as an index of fatigue in multiple sclerosis. Mult. Scler. 19, 334–343. doi: 10.1177/1352458512452921
Tosun, D., Schuff, N., Truran-Sacrey, D., Shaw, L. M., Trojanowski, J. Q., Aisen, P., et al. (2010). Relations between brain tissue loss, CSF biomarkers, and the ApoE genetic profile: a longitudinal MRI study. Neurobiol. Aging 31, 1340–1354. doi: 10.1016/j.neurobiolaging.2010.04.030
Travis, K. E., Curran, M. M., Torres, C., Leonard, M. K., Brown, T. T., Dale, A. M., et al. (2014). Age-related changes in tissue signal properties within cortical areas important for word understanding in 12- to 19-month-old infants. Cereb. Cortex 24, 1948–1955. doi: 10.1093/cercor/bht052
Weier, K., Beck, A., Magon, S., Amann, M., Naegelin, Y., Penner, I. K., et al. (2012). Evaluation of a new approach for semi-automatic segmentation of the cerebellum in patients with multiple sclerosis. J. Neurol. 259, 2673–2680. doi: 10.1007/s00415-012-6569-4
Winkler, A. M., Kochunov, P., Blangero, J., Almsay, L., Zilles, K., Fox, P. T., et al. (2010). Cortical thickness or grey matter volume? The importance of selecting the phenotype for imaging genetics studies. Neuroimage 53, 1135–1146. doi: 10.1016/j.neuroimage.2009.12.028
Wonderlick, J. S., Ziegler, D. A., Hosseini-Varnamkhasti, P., Locascio, J. J., Bakkour, A., van der Kouwe, A., et al. (2009). Reliability of MRI-derived cortical and subcortical morphometric measures: effects of pulse sequence, voxel geometry, and parallel imaging. Neuroimage 44, 1324–1333. doi: 10.1016/j.neuroimage.2008.10.037
Keywords: FreeSurfer, intensity normalization, control points, white matter edits, interactive, semi-automatic
Citation: McCarthy CS, Ramprashad A, Thompson C, Botti J-A, Coman IL and Kates WR (2015) A comparison of FreeSurfer-generated data with and without manual intervention. Front. Neurosci. 9:379. doi: 10.3389/fnins.2015.00379
Received: 14 July 2015; Accepted: 29 September 2015;
Published: 21 October 2015.
Edited by:
Kevin J. Black, Washington University School of Medicine, USACopyright © 2015 McCarthy, Ramprashad, Thompson, Botti, Coman and Kates. This is an open-access article distributed under the terms of the Creative Commons Attribution License (CC BY). The use, distribution or reproduction in other forums is permitted, provided the original author(s) or licensor are credited and that the original publication in this journal is cited, in accordance with accepted academic practice. No use, distribution or reproduction is permitted which does not comply with these terms.
*Correspondence: Wendy R. Kates, katesw@upstate.edu