 Marco Aiello
 Carlo Cavaliere
 Marco Salvatore
- IRCCS SDN, Istituto Ricerca Diagnostica Nucleare, Naples, Italy
In recent years, brain connectivity is gaining ever-increasing interest from the interdisciplinary research community. The study of brain connectivity is characterized by a multifaceted approach providing both structural and functional evidence of the relationship between cerebral regions at different scales. Although magnetic resonance (MR) is the most established imaging modality for investigating connectivity in vivo, the recent advent of hybrid positron emission tomography (PET)/MR scanners paved the way for more comprehensive investigation of brain organization and physiology. Due to the high sensitivity and biochemical specificity of radiotracers, combining MR with PET imaging may enrich our ability to investigate connectivity by introducing the concept of metabolic connectivity and cometomics and promoting new insights on the physiological and molecular bases underlying high-level neural organization. This review aims to describe and summarize the main methods of analysis of brain connectivity employed in MR imaging and nuclear medicine. Moreover, it will discuss practical aspects and state-of-the-art techniques for exploiting hybrid PET/MR imaging to investigate the relationship of physiological processes and brain connectivity.
Introduction
Currently, one of the main challenges in neuroscience is to gain an understanding of how brain activity generates behavior and, in more detail, how neural information is segregated and integrated. Anatomical and physiological studies support the idea that cognitive processes depend on interactions among distributed neuronal populations and brain regions (Sporns, 2013); brain connectivity (BC) refers to the structural and functional characterization of those interactions. Four different but related types of connectivity are currently being investigated by neuroscientists: anatomical or structural, functional, metabolic and effective connectivity (Horwitz, 2003; Lee et al., 2003).
Neuroimaging plays a crucial role in BC investigation and magnetic resonance (MR) imaging (MRI) is commonly used to assay structural and functional connectivity, comprising the majority of in vivo BC studies (Buckner et al., 2013). The recent development of hybrid positron emission tomography (PET)/MR scanners allows for more thorough investigation of BC and its underlying physiological processes (Wehrl et al., 2013; Riedl et al., 2014; Aiello et al., 2015; Tahmasian et al., 2015).
PET integrated with MRI yields both high sensitivity and specificity due to the use of radiotracers. [18F] fluorodeoxyglucose (FDG) is the most widely used radiotracer, primarily for estimating glucose consumption in both neurological and oncological studies. Previous studies have demonstrated a close linkage between functional activity, blood flow, and glucose utilization (Jueptner and Weiller, 1995). Glucose metabolism, as estimated by FDG-PET, and oxygen consumption, as estimated by functional MRI (fMRI), are in turn related to cerebral blood flow (CBF), which delivers O2 and glucose to the brain (Attwell and Iadecola, 2002).
The across-subjects covariance of FDG-PET images yields a measure of metabolic connectivity that relates to functional connectivity due to the physiological coupling of glucose and oxygen metabolism. This has led to an increase in the importance of PET/MRI as a multi-modality probe of BC, resulting in the development of the concept of cometomics, which combines connectivity with metabolic information (Wehrl et al., 2014).
This review will provide the reader with a comprehensive taxonomy of different BC methods involved in PET/MRI and the techniques used to employ those methods.
Brain Connectivity
Brain Connectivity involves anatomical pathways and interactions, as well as communication between distinct units of the central nervous system. These units are categorized into micro-(individual neurons), meso-(columns), or macro-(regions) scales (Pawela and Biswal, 2011). Notably, the imaging methods presented here provide suitable non-invasive estimations of different aspects of BC, but “actual” BC is generally determined only through the use of invasive techniques or histological assessment of ex vivo or post-mortem samples (Thomas et al., 2014).
Before the recent explosion of BC studies, a great deal of brain mapping consisted of functional segregation and localization of those functions; the current trend reflects a paradigm shift from segregation to integration wherein functional segregation must be viewed in the context of functional integration and vice versa (Friston, 2011). The theory of functional integration rests on the analysis of how different regions in a neuronal system interact, and results in the identification of networks of interactions among specialized brain areas. Once identified, such networks can be also characterized by analysis of their topological properties (Fornito et al., 2013; Sporns, 2014).
BC is a multifaceted concept: it can be subdivided into structural and functional domains, each further divided into static and dynamic components (Pawela and Biswal, 2011; Lang et al., 2012). Static connectivity can be measured by anatomical properties using a number of imaging methods, including high-resolution MRI (Mechelli et al., 2005; Alexander-Bloch et al., 2013), PET imaging, diffusion tensor imaging (DTI), and histology (myelination). Dynamic connectivity can be measured by a wide variety of techniques, particularly those with a fast time scale capable of measuring causality, such as EEG and MEG, or that can provide information about the spatial distribution and strength of connections, such as resting-state functional connectivity MRI (rs-fcMRI).
The technological development of imaging modalities, especially with the advent of hybrid scanners, along with the advancement of computation methods aimed to infer different aspects of BC, are boosting BC research. The proliferation of multiple methods for the estimation of BC requires the user to be aware of the specific details of the method and its appropriate neurophysiological interpretation. For example, in the case of functional connectivity (FC), deriving the same conclusions from multiple techniques it is not trivial. It is often unclear which aspects of co-varying neural activity are being assessed by any particular computation of FC (Horwitz, 2003). The following sections will provide a taxonomy of BC methods involved in PET/MR studies: structural connectivity via diffusion tractography (DT), FC via resting state functional MRI (rs-fMRI), and metabolic connectivity via FDG-PET, with a particular emphasis on metabolic connectivity, as it is strictly related to PET imaging and therefore less commonly reviewed than structural and FC.
Structural Connectivity
Structural Connectivity (SC) is defined as the map of structural cortical/subcortical connections (connectome) and is derived mainly from diffusion-weighted imaging (DWI). Although this concept is broadly accepted, many issues regarding acquisition, processing, visualization and integration of SC with other BC maps remain debated.
Many acquisition parameters can affect data quality, including the number of directions investigated and the maximum b-value used (Mori and Zhang, 2006). Moreover, issues linked to specific patients populations (e.g., brain anatomy distortion, cerebral edema, or white matter lesions) have to be taken into account in the determination of SC as for other measures of BC (Cavaliere et al., 2014). Image processing to create SC maps can involve employing different tractography algorithms and diffusion models, including a deterministic or probabilistic approach, locally greedy or globally optimal processing, and single- or multi-diffusion model. The choice of diffusion model affects network properties of SC maps (Bastiani et al., 2012). After fiber reconstruction, the number of trajectories or other voxel-wise indices of fiber integrity, such as fractional anisotropy or mean diffusivity, can be used to weight the connectivity strength between brain regions. Other, more complex, measures to quantify connection weights include estimation of axon diameter and density using tailored DWI acquisitions (Alexander et al., 2010) or analysis of myelination by magnetization transfer imaging (van den Heuvel et al., 2009). The covariance across subjects of morphological properties (such as atrophy and cortical thickness) between brain regions is also relevant to SC; this is usually referred as structural covariance (Mechelli et al., 2005; Lerch et al., 2006; Alexander-Bloch et al., 2013) and has been demonstrated to be suitable for understanding various pathological conditions (Bernhardt et al., 2014; Valk et al., 2015). Methodologically speaking, structural covariance is estimated using high-resolution MRI and, given the common static feature, can be achieved with the same approaches employed in investigating metabolic connectivity as described in Section Metabolic Connectivity.
Functional Connectivity
FC is defined as “temporal correlations between spatially remote neurophysiological events” (Friston et al., 1993a) and was first described using multiunit systems of neural activity recording and subsequently by tomographic imaging with 15O-PET activation studies (Friston et al., 1993b). The wide, interdisciplinary increase in FC studies in neuroimaging began after the identification of two phenomena: the blood oxygenation level dependent (BOLD) signal (Ogawa et al., 1990), as measured by fMRI, which has better spatial and temporal resolution than PET imaging, and resting-state fMRI, a significant temporal correlation in fMRI signal in subjects who were not cognitively engaged (Biswal, 2012).
Raichle et al. (2001) demonstrated experimentally that the majority of the brain's energy consumption occurs at resting-state and activity increases by < 5% during focused mental tasks. This study also coined the term default mode network (DMN) to describe the most prominent resting state network (RSN) connecting the medial temporal lobe, the medial prefrontal cortex, the posterior cingulate cortex, the ventral precuneus, and parts of the parietal cortex.
FC methods possess a common statistical nature, nevertheless, each different measure may be assessing a different aspect of interregional interactions. As a result, the concept of functional and effective connectivity are extensively debated and, at times, believed “elusive” (Horwitz, 2003; Lee et al., 2003; Fingelkurts et al., 2005).
Different computational methods have been employed to investigate and define the functional relationship between distinct cortical regions. The classical and most intuitive method is seed based analysis (SBA), which consists of selecting of a region of interest (ROI) as a seed and generating a connectivity map by computing which regions or voxels are functionally connected to the seed according to a predefined metric, most commonly the Pearson correlation coefficient between BOLD time courses. SBA plays an essential role as a technique for FC estimation, as well as for independent component analysis (ICA; Himberg et al., 2004; Esposito et al., 2005). ICA evaluates the fMRI signal as a linear mixture of various signals, which predominantly originate from fluctuations of neuronal, cardiac and respiratory sources. Both SBA and ICA are successfully employed in clinical and behavioral research (Lee et al., 2013).
Other rs-fMRI-derived FC metrics that capture different FC properties in voxel-wise maps have recently been introduced. These metrics are of particular interest in PET/MRI probes (Aiello et al., 2015). The Degree of Centrality (DC; Buckner et al., 2009; Martuzzi et al., 2011; Tomasi and Volkow, 2012), employs Pearson's correlation coefficient as a metric for estimation of functional connectivity between each pair of voxels, assigning to each voxel a global number of functional connections between it and all other voxels across the brain. Regional Homogeneity (ReHo) is a voxel-based measure of brain activity that estimates the degree of synchronization between the time series of a given voxel and its nearest neighbors (Zang et al., 2004). Fractional Amplitude of Low Frequency Fluctuations (fALFF, Zou et al., 2008; Zuo et al., 2010) is equal to the power within the low-frequency range (0.01–0.1 Hz) divided by the total power in the entire detectable frequency range for the time course of each voxel and quantifies the amplitude of low frequency oscillations (LFOs), thus representing the relative contribution of LFOs to the whole frequency range. A recent PET/MR study (Tomasi et al., 2013) demonstrated that the amplitude of the fluctuations of RSNs is relevant in modeling energy consumption in FC.
The spatial extent of the physiological phenomena probed by these measures also differs. fALFF contrast is measured by single voxel signal, and is thus independent of the spatial range of the underlying connectivity processes. On the other hand, ReHo serves as a measurement of short-range functional connectivity (amongst neighboring cells) while DC is essentially weighted by long-range functional connectivity due to the fact that distant voxels far outnumber neighboring ones.
Metabolic Connectivity
Metabolic images, such as FDG-PET scans, are traditionally studied following intensity-based analysis. Metabolic connectivity (MC) aims, in general, to analyze FDG-PET data in terms of covariance across subjects.
Due to the limited temporal resolution of PET images and the steady-state nature of typical FDG-PET scans, the source of signal variability mainly lies in within-group variance, as opposed to rs-fMRI functional connectivity, where dynamical signal variations enable the study of the covariance of subjective signal fluctuations. Therefore, two regions of the brain are considered metabolically connected based on whether the estimation of their glucose consumption significantly correlates across subjects in a specific group.
As with FC, MC can be estimated using different approaches. First, Horwitz et al. (1984) proposed that anatomical regions with correlated glucose uptake values are functionally associated, and the strength of the association is proportional to the magnitude of correlation. This method, thereafter referred to as Interregional Correlation Analysis (IRCA), is principally similar to SBA and estimates the correlation between mean values of glucose metabolic rate (GMR) of pre-defined brain regions. This approach demonstrated MC networks for the first time and documented their potential as biomarkers in Alzheimer's disease and many subsequent studies confirmed its suitability for MC research (Table 1).
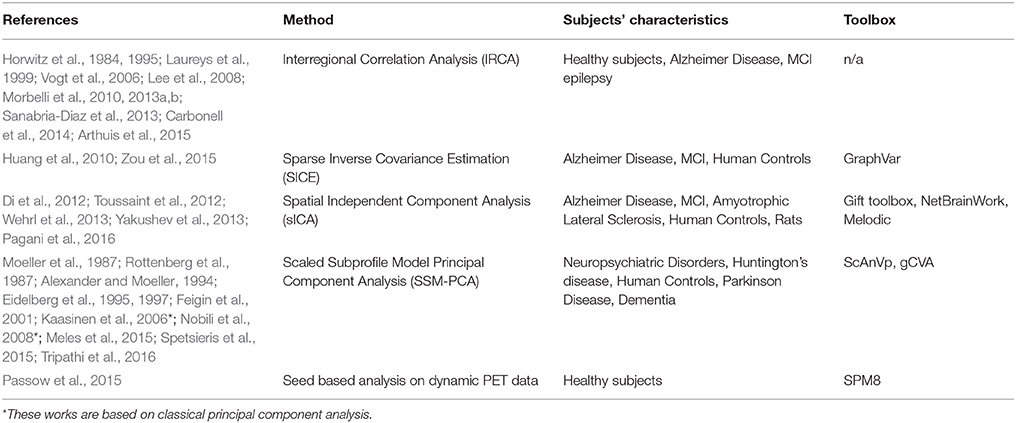
Table 1. Summary of different approaches for the estimation of metabolic connectivity.
As for SBA, pairwise correlation captures a limited aspect of information and does not provide a complete account of multi-regional interactions, resulting in the development of other computational approaches for MC.
Sparse inverse covariance estimation (SICE; Huang et al., 2010; Zou et al., 2015) yields the correlation between a pair of ROIs, given all other regions, and further demonstrated the relevance of MC in AD studies.
Another global approach is the scaled subprofile model principal component analysis (SSM-PCA; Moeller et al., 1987) that was first successfully employed in AIDS dementia complex and then widely employed for MC characterization of various diseases (Table 1).
Pre-processing of FDG-PET data in terms of spatial and intensity normalization is a common denominator of the MC methods listed in Table 1. Intensity normalization (i.e., scaling of tracer uptake to a reference region) is in most cases essential for analyses of non-quantitative data, as is the case for static FDG-PET. A reference region can be chosen either pathologically, as a region not affected by brain pathology, or with data-driven approaches (Dukart et al., 2013). Alternately, z-value transformation can be employed for intensity normalization in studies of the relationship between FDG-PET and other variables (Chételat et al., 2008).
Since MC analyzes the covariance across subjects while FC analyzes covariance across timepoints, computational tools and FC methods can be used on PET data by simulating a temporal sequence of PET data from a group of subjects by concatenating spatially normalized PET scans from different subjects (Di et al., 2012). The most current approaches include temporal information from FDG-PET dynamical acquisition as well (Wehrl et al., 2013; Passow et al., 2015); in these methods covariance between glucose uptake timecourses of different regions also contributes to MC estimation.
Since the FDG-PET signal is mainly derived from gray matter, partial volume effect may confound the estimation of actual glucose uptake and, subsequently, MC. PET/MRI can exploit the anatomical detail of MRI for partial volume correction of FDG-PET data (Quarantelli et al., 2004) or gray matter density can be removed as a confounding variable by regression in a correlation analysis (Aiello et al., 2015). Although MC methods have been extensively employed with FDG-PET imaging, they are also applicable to other PET tracers (Kaasinen et al., 2006), static images such as anatomical maps from high resolution MRI (as described above for structural covariance networks) and, in principle, to metabolic maps from MR spectroscopic imaging. Though MC methods are inherently designed for group studies, some statistical approaches that compute a subject score for the corresponding disease-related pattern of MC (Niethammer and Eidelberg, 2012; Toussaint et al., 2012) revealed the potential to also employ MC in differential diagnosis.
Neurophysiological Considerations
The physiological mechanisms underlying neural activity, and thus BC, have been a matter of debate in the last century. The early principle that changes in blood flow are a function of tight coupling between energy requirements and the supplies of glucose and oxygen (Roy and Sherrington, 1890) has been contradicted by evidence from PET and fMRI experiments (Lin et al., 2010). PET imaging showed that levels of aerobic glycolysis are not strictly related to levels of brain energy metabolism, and are different across brain regions (Vaishnavi et al., 2010).
Buckner et al. (2008) also consider PET/MR imaging to provide valuable information for understanding the physiology underlying BC; since the DMN emerges from hemodynamic measures of blood flow that are indirectly linked to neural activity, they address whether or not vascular characteristics can account for the default network's anatomy. FDG-PET studies provide evidence that regions within the default network show disproportionately high resting glucose metabolism relative to other brain regions and that DMN anatomy does not rely on vascular coupling (Gusnard and Raichle, 2001; Vogt et al., 2006). These studies suggest the great potential of integrated PET/MRI studies for the investigation of the relationship between FC and glucose metabolism.
Recent studies have investigated the relationship between energy consumption and FC using in vivo imaging techniques, with PET and MR acquired separately (Nishida et al., 2008; Li et al., 2012; Liang et al., 2013; Tomasi et al., 2013; Passow et al., 2015; Soddu et al., 2015). Preclinical studies using a hybrid scanner (Wehrl et al., 2013) showed that FDG-PET and BOLD fMRI resting-state networks agree to some extent, but show a significantly different pattern of cortical activation. In humans, Riedl et al. (2014) demonstrated a relationship between GMR and FC changes in regions activated by visual stimuli.
In a simultaneous PET/MR study by Aiello et al. (2015), the authors found a heterogeneous correlation between the spatial distributions of PET and rs-fMRI-derived metrics across both anatomic regions and functional networks, with the strongest correlation for the DMN (Figure 1).
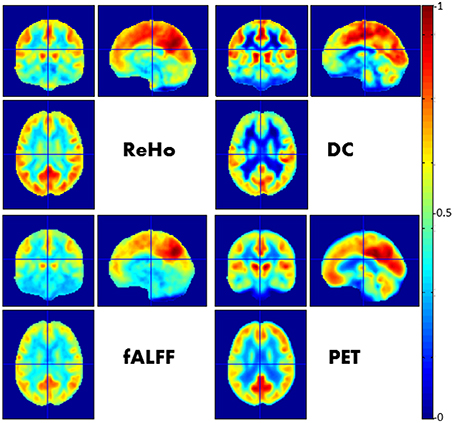
Figure 1. Relationship between FC imaged by rs-fMRI and glucose metabolism imaged by FDG-PET. In this figure a visual comparison between different voxel-wise maps of FC (namely ReHo, DC, fALFF) and PET images is presented. Each map was obtained by averaging spatially normalized maps over 23 neurologically healthy subjects and afterwards normalized with respect the maximum value. See Aiello et al. (2015) for further details.
SC plays a fundamental role in higher levels of brain organization, although its underlying physiological phenomenon (e.g., water diffusion along axonal path) is certainly different than glucose and oxygen metabolism. Effectively, SC constitutes the routes of communication for FC and MC and contributes to the energetic cost of connectivity through wiring efficiency (Bullmore and Sporns, 2012; Tomasi et al., 2013; Aiello et al., 2015).
Relationship between BC Measures
The study of the relationship between different BC measures is of great interest in the neuroscience community. Rather than study each single modality in isolation, the investigation of mutual connections between BC modalities can provide valued insights into the brain's mechanisms of organization. Neuroimaging findings currently provide strong supporting for the existence of a relationship between the anatomical architecture of the brain and RSNs (Honey et al., 2009; Das et al., 2014; Goñi et al., 2014; Wang et al., 2014). Neuroimaging studies have shown a close linkage between SC and FC in other brain systems besides the DMN, such as the executive control network, salience network and primary motor and visual network (van den Heuvel et al., 2009). In other cases, differences between SC and FC emerged (Wang et al., 2014); areas can show FC without a direct anatomical connection (Deco et al., 2013). Moreover, there is also scientific evidence that dynamic variations of FC occur in the human brain in fixed anatomical pathways (Hutchison et al., 2013). These findings suggest that the FC-SC relationship needs to be modeled as a complex, dynamic system (Deco et al., 2013; Das et al., 2014; Minati et al., 2015).
According to the economic principle of the brain, minimizing wiring and metabolic energy costs results in a more efficient tradeoff between wiring costs and extent of structural and/or functional connectivity among spatially distinct brain regions (Das et al., 2014). However, there is strong evidence that metabolic costs are controlled dynamically within an upper limit imposed by the anatomical architecture of the network. Brain networks are often functionally activated or configured less expensively than they could be within anatomical constraints, to ensure the frugal use of metabolic resources (Bullmore and Sporns, 2012). Diaschisis further supports the idea of MC-SC coupling (Feeney and Baron, 1986; Sestini et al., 2010).
Practical Considerations
Simultaneous PET/MR imaging allows acquisition of different biological properties (e.g., glucose/oxygen metabolism or perfusion/glucose metabolism) at the same time, and therefore likely under the same physiological conditions. This alleviates problems associated with capturing multiple parameters on different time scales. While FDG-PET measures glucose uptake integrated over minutes, starting from radiotracer administration, FC is estimated by rs-fMRI acquired each few seconds. There are different approaches to managing this discrepancy, both with simultaneous and sequential scanning: off-scanner injection of radiotracer (Tomasi et al., 2013; Aiello et al., 2015; Passow et al., 2015), following clinical recommendations for neurological FDG-PET imaging, or in-MR injection, where FDG is administered during MRI acquisition (Newberg et al., 2005; Musiek et al., 2012; Chonde et al., 2013).
Regarding the spatial correspondence between PET and MR, the inherent co-registration carried out by simultaneous PET/MR imaging is particularly useful when the pattern of a specific PET tracer (such as [18F]choline, [11C]raclopride, or [18F]DOPA) does not completely reflect the brain anatomy, causing potential failure of retrospective fusion algorithms.
Another advantage of simultaneous PET/MRI in BC studies lies in the ability to mitigate the problem of blurred PET images due to the subjects' motion, which is often a dramatic problem in cases of dementia, movement disorders and disorders of consciousness (Soddu et al., 2011). With simultaneous PET/MRI, PET data can be motion corrected by exploiting the high temporal resolution of simultaneously acquired rs-fMRI (Catana et al., 2011).
Current MR-based attenuation correction (AC) produces slightly spatially biased metabolic patterns relative to CT-based AC (Andersen et al., 2014; Hitz et al., 2014), with significantly lower PET values in fronto-parietal portions of the neocortex, and significantly higher values in subcortical and basal regions of the brain. These differences must be taken into account during the interpretation of glucose metabolism distribution from PET/MRI studies.
Conclusions
The concept of the brain connectivity has been reviewed in light of opportunities presented by PET/MRI. The aim was to provide to the reader with an overview of methodological issues arising from different fields of MRI and nuclear medicine. From critical analysis of the scientific literature, one can see the importance of a leading role in neuroimaging studies for PET/MRI.
Author Contributions
MA: Conceived the work, wrote and revised the manuscript. CC: Wrote and revised the manuscript. MS: Wrote and revised the manuscript.
Conflict of Interest Statement
The authors declare that the research was conducted in the absence of any commercial or financial relationships that could be construed as a potential conflict of interest.
Acknowledgments
The financial contributions “5 per mille” and RRC-2015-2360454 from MOH partially funded this work.
References
Aiello, M., Salvatore, E., Cachia, A., Pappatà, S., Cavaliere, C., Prinster, A., et al. (2015). Relationship between simultaneously acquired resting-state regional cerebral glucose metabolism and functional MRI: a PET/MR hybrid scanner study. Neuroimage 113, 111–121. doi: 10.1016/j.neuroimage.2015.03.017
Alexander, D. C., Hubbard, P. L., Hall, M. G., Moore, E. A., Ptito, M., Parker, G. J., et al. (2010). Orientationally invariant indices of axon diameter and density from diffusion MRI. Neuroimage 52, 1374–1389. doi: 10.1016/j.neuroimage.2010.05.043
Alexander, G. E., and Moeller, J. R. (1994). Application of the scaled subprofile model to functional imaging in neuropsychiatric disorders: a principal component approach to modeling brain function in disease. Hum. Brain Mapp. 2, 79–94. doi: 10.1002/hbm.460020108
Alexander-Bloch, A., Giedd, J. N., and Bullmore, E. (2013). Imaging structural co-variance between human brain regions. Nat. Rev. Neurosci. 14, 322–336. doi: 10.1038/nrn3465
Andersen, F. L., Ladefoged, C. N., Beyer, T., Keller, S. H., Hansen, A. E., Højgaard, L., et al. (2014). Combined PET/MR imaging in neurology: MR-based attenuation correction implies a strong spatial bias when ignoring bone. Neuroimage 84, 206–216. doi: 10.1016/j.neuroimage.2013.08.042
Arthuis, M., Micoulaud-Franchi, J. A., Bartolomei, F., McGonigal, A., and Guedj, E. (2015). Resting cortical PET metabolic changes in psychogenic non-epileptic seizures (PNES). J. Neurol. Neurosurg. Psychiatry 86, 1106–1112. doi: 10.1136/jnnp-2014-309390
Attwell, D., and Iadecola, C. (2002). The neural basis of functional brain imaging signals. Trends Neurosci. 25, 621–625. doi: 10.1016/S0166-2236(02)02264-6
Bastiani, M., Shah, N. J., Goebel, R., and Roebroeck, A. (2012). Human cortical connectome reconstruction from diffusion weighted MRI: the effect of tractography algorithm. Neuroimage 62, 1732–1749. doi: 10.1016/j.neuroimage.2012.06.002
Bernhardt, B. C., Valk, S. L., Silani, G., Bird, G., Frith, U., and Singer, T. (2014). Selective disruption of socio-cognitive structural brain networks in autism and alexithymia. Cereb. Cortex 24, 3258–3267. doi: 10.1093/cercor/bht182
Biswal, B. B. (2012). Resting state fMRI: a personal history. Neuroimage 62, 938–944. doi: 10.1016/j.neuroimage.2012.01.090
Buckner, R. L., Andrews-Hanna, J. R., and Schacter, D. L. (2008). The brain's default network. Ann. N.Y. Acad. Sci. 1124, 1–38. doi: 10.1196/annals.1440.011
Buckner, R. L., Krienen, F. M., and Thomas Yeo, B. T. (2013). Opportunities and limitations of intrinsic functional connectivity MRI. Nat. Neurosci. 16, 832–837. doi: 10.1038/nn.3423
Buckner, R. L., Sepulcre, J., Talukdar, T., Krienen, F. M., Liu, H., Hedden, T., et al. (2009). Cortical hubs revealed by intrinsic functional connectivity: mapping, assessment of stability, and relation to Alzheimer's disease. J. Neurosci. 29, 1860–1873. doi: 10.1523/JNEUROSCI.5062-08.2009
Bullmore, E., and Sporns, O. (2012). The economy of brain network organization. Nat. Rev. Neurosci. 13, 336–349. doi: 10.1038/nrn3214
Carbonell, F., Charil, A., Zijdenbos, A. P., Evans, A. C., and Bedell, B. J. (2014). β-Amyloid is associated with aberrant metabolic connectivity in subjects with mild cognitive impairment. J. Cereb. Blood Flow Metab. 34, 1169–1179. doi: 10.1038/jcbfm.2014.66
Catana, C., Benner, T., van der Kouwe, A., Byars, L., Hamm, M., Chonde, D. B., et al. (2011). MRI-assisted PET motion correction for neurologic studies in an integrated MR-PET scanner. J. Nucl. Med. 52, 154–161. doi: 10.2967/jnumed.110.079343
Cavaliere, C., Aiello, M., Di Perri, C., Fernandez-Espejo, D., Owen, A. M., and Soddu, A. (2014). Diffusion tensor imaging and white matter abnormalities in patients with disorders of consciousness. Front. Hum. Neurosci. 8:1028. doi: 10.3389/fnhum.2014.01028
Chételat, G., Desgranges, B., Landeau, B., Mézenge, F., Poline, J. B., de la Sayette, V., et al. (2008). Direct voxel-based comparison between grey matter hypometabolism and atrophy in Alzheimer's disease. Brain J. Neurol. 131, 60–71. doi: 10.1093/brain/awm288
Chonde, D. B., Abolmaali, N., Arabasz, G., Guimaraes, A. R., and Catana, C. (2013). Effect of MRI acoustic noise on cerebral fludeoxyglucose uptake in simultaneous MR-PET imaging. Invest. Radiol. 48, 302–312. doi: 10.1097/RLI.0b013e3182839fbc
Das, T. K., Abeyasinghe, P. M., Crone, J. S., Sosnowski, A., Laureys, S., Owen, A. M., et al. (2014). Highlighting the structure-function relationship of the brain with the ising model and graph theory. BioMed Res. Int. 2014:237898. doi: 10.1155/2014/237898
Deco, G., Jirsa, V. K., and McIntosh, A. R. (2013). Resting brains never rest: computational insights into potential cognitive architectures. Trends Neurosci. 36, 268–274. doi: 10.1016/j.tins.2013.03.001
Di, X., Biswal, B. B., and Alzheimer's Disease Neuroimaging Initiative (2012). Metabolic brain covariant networks as revealed by FDG-PET with reference to resting-state fMRI networks. Brain Connect. 2, 275–283. doi: 10.1089/brain.2012.0086
Dukart, J., Perneczky, R., Förster, S., Barthel, H., Diehl-Schmid, J., Draganski, B., et al. (2013). Reference cluster normalization improves detection of frontotemporal lobar degeneration by means of FDG-PET. PLoS One 8:e55415. doi: 10.1371/journal.pone.0055415
Eidelberg, D., Moeller, J. R., Antonini, A., Kazumata, K., Dhawan, V., Budman, C., et al. (1997). The metabolic anatomy of Tourette's syndrome. Neurology 48, 927–933. doi: 10.1212/WNL.48.4.927
Eidelberg, D., Moeller, J. R., Ishikawa, T., Dhawan, V., Spetsieris, P., Przedborski, S., et al. (1995). The metabolic topography of idiopathic torsion dystonia. Brain 118, 1473–1484. doi: 10.1093/brain/118.6.1473
Esposito, F., Scarabino, T., Hyvarinen, A., Himberg, J., Formisano, E., Comani, S., et al. (2005). Independent component analysis of fMRI group studies by self-organizing clustering. Neuroimage 25, 193–205. doi: 10.1016/j.neuroimage.2004.10.042
Feeney, D. M., and Baron, J. C. (1986). Diaschisis. Stroke 17, 817–830. doi: 10.1161/01.STR.17.5.817
Feigin, A., Leenders, K. L., Moeller, J. R., Missimer, J., Kuenig, G., Spetsieris, P., et al. (2001). Metabolic network abnormalities in early Huntington's disease: an [18F] FDG PET study. J. Nucl. Med. 42, 1591–1595.
Fingelkurts, A. A., Fingelkurts, A. A., and Kähkönen, S. (2005). Functional connectivity in the brain—is it an elusive concept? Neurosci. Biobehav. Rev. 28, 827–836. doi: 10.1016/j.neubiorev.2004.10.009
Fornito, A., Zalesky, A., and Breakspear, M. (2013). Graph analysis of the human connectome: promise, progress, and pitfalls. Neuroimage 80, 426–444. doi: 10.1016/j.neuroimage.2013.04.087
Friston, K. J. (2011). Functional and effective connectivity: a review. Brain Connect. 1, 13–36. doi: 10.1089/brain.2011.0008
Friston, K. J., Frith, C. D., and Frackowiak, R. S. J. (1993a). Time-dependent changes in effective connectivity measured with PET. Hum. Brain Mapp. 1, 69–79. doi: 10.1002/hbm.460010108
Friston, K. J., Frith, C. D., Liddle, P. F., and Frackowiak, R. S. J. (1993b). Functional connectivity: the principal-component analysis of large (PET) data sets. J. Cereb. Blood Flow Metab. 13, 5–14. doi: 10.1038/jcbfm.1993.4
Goñi, J., van den Heuvel, M. P., Avena-Koenigsberger, A., de Mendizabal, N. V., Betzel, R. F., Griffa, A., et al. (2014). Resting-brain functional connectivity predicted by analytic measures of network communication. Proc. Nat. Acad. Sci. 111, 833–838. doi: 10.1073/pnas.1315529111
Gusnard, D. A., and Raichle, M. E. (2001). Searching for a baseline: functional imaging and the resting human brain. Nat. Rev. Neurosci. 2, 685–694. doi: 10.1038/35094500
Himberg, J., Hyvärinen, A., and Esposito, F. (2004). Validating the independent components of neuroimaging time series via clustering and visualization. Neuroimage 22, 1214–1222. doi: 10.1016/j.neuroimage.2004.03.027
Hitz, S., Habekost, C., Fürst, S., Delso, G., Förster, S., Ziegler, S., et al. (2014). Systematic comparison of the performance of integrated whole-body PET/MR imaging to conventional PET/CT for 18F-FDG brain imaging in patients examined for suspected dementia. J. Nucl. Med. 55, 923–931. doi: 10.2967/jnumed.113.126813
Honey, C. J., Sporns, O., Cammoun, L., Gigandet, X., Thiran, J. P., Meuli, R., et al. (2009). Predicting human resting-state functional connectivity from structural connectivity. Proc. Natl. Acad. Sci. U.S.A. 106, 2035–2040. doi: 10.1073/pnas.0811168106
Horwitz, B. (2003). The elusive concept of brain connectivity. Neuroimage 19, 466–470. doi: 10.1016/S1053-8119(03)00112-5
Horwitz, B., Duara, R., and Rapoport, S. I. (1984). Intercorrelations of glucose metabolic rates between brain regions: application to healthy males in a state of reduced sensory input. J. Cereb. Blood Flow Metab. 4, 484–499. doi: 10.1038/jcbfm.1984.73
Horwitz, B., McIntosh, A. R., Haxby, J. V., Furey, M., Salerno, J. A., Schapiro, M. B., et al. (1995). Network analysis of PET-mapped visual pathways in Alzheimer type dementia. Neuroreport 6, 2287–2292. doi: 10.1097/00001756-199511270-00005
Huang, S., Li, J., Sun, L., Ye, J., Fleisher, A., Wu, T., et al. (2010). Learning brain connectivity of Alzheimer's disease by sparse inverse covariance estimation. Neuroimage 50, 935–949. doi: 10.1016/j.neuroimage.2009.12.120
Hutchison, R. M., Womelsdorf, T., Allen, E. A., Bandettini, P. A., Calhoun, V. D., Corbetta, M., et al. (2013). Dynamic functional connectivity: promise, issues, and interpretations. Neuroimage 80, 360–378. doi: 10.1016/j.neuroimage.2013.05.079
Jueptner, M., and Weiller, C. (1995). Review: does measurement of regional cerebral blood flow reflect synaptic activity?—Implications for PET and fMRI. Neuroimage 2, 148–156. doi: 10.1006/nimg.1995.1017
Kaasinen, V., Maguire, R. P., Hundemer, H. P., and Leenders, K. L. (2006). Corticostriatal covariance patterns of 6–[18F] fluoro–L–dopa and [18F] fluorodeoxyglucose PET in Parkinson's disease. J. Neurol. 253, 340–348. doi: 10.1007/s00415-005-0993-7
Lang, E. W., Tomé, A. M., Keck, I. R., Górriz-Sáez, J. M., and Puntonet, C. G. (2012). Brain connectivity analysis: a short survey. Comput. Intell. Neurosci. 2012, 8. doi: 10.1155/2012/412512
Laureys, S., Goldman, S., Phillips, C., Van Bogaert, P., Aerts, J., Luxen, A., et al. (1999). Impaired effective cortical connectivity in vegetative state: preliminary investigation using PET. Neuroimage 9, 377–382. doi: 10.1006/nimg.1998.0414
Lee, D. S., Kang, H., Kim, H., Park, H., Oh, J. S., Lee, J. S., et al. (2008). Metabolic connectivity by interregional correlation analysis using statistical parametric mapping (SPM) and FDG brain PET; methodological development and patterns of metabolic connectivity in adults. Eur. J. Nucl. Med. Mol. Imag. 35, 1681–1691. doi: 10.1007/s00259-008-0808-z
Lee, L., Harrison, L. M., and Mechelli, A. (2003). A report of the functional connectivity workshop, Dusseldorf 2002. Neuroimage 19, 457–465. doi: 10.1016/S1053-8119(03)00062-4
Lee, M. H., Smyser, C. D., and Shimony, J. S. (2013). Resting-state fMRI: a review of methods and clinical applications. Am. J. Neuroradiol. 34, 1866–1872. doi: 10.3174/ajnr.A3263
Lerch, J. P., Worsley, K., Shaw, W. P., Greenstein, D. K., Lenroot, R. K., Giedd, J., et al. (2006). Mapping anatomical correlations across cerebral cortex (MACACC) using cortical thickness from MRI. Neuroimage 31, 993–1003. doi: 10.1016/j.neuroimage.2006.01.042
Li, Z., Zhu, Y., Childress, A. R., Detre, J. A., and Wang, Z. (2012). Relations between BOLD fMRI-derived resting brain activity and cerebral blood flow. PLoS ONE 7:e44556. doi: 10.1371/journal.pone.0044556
Liang, X., Zou, Q., He, Y., and Yang, Y. (2013). Coupling of functional connectivity and regional cerebral blood flow reveals a physiological basis for network hubs of the human brain. Proc. Natl. Acad. Sci. U.S.A. 110, 1929–1934. doi: 10.1073/pnas.1214900110
Lin, A. L., Fox, P. T., Hardies, J., Duong, T. Q., and Gao, J. H. (2010). Nonlinear coupling between cerebral blood flow, oxygen consumption, and ATP production in human visual cortex. Proc. Natl. Acad. Sci. U.S.A. 107, 8446–8451. doi: 10.1073/pnas.0909711107
Martuzzi, R., Ramani, R., Qiu, M., Shen, X., Papademetris, X., and Constable, R. T. (2011). A whole-brain voxel based measure of intrinsic connectivity contrast reveals local changes in tissue connectivity with anesthetic without a priori assumptions on thresholds or regions of interest. Neuroimage 58, 1044–1050. doi: 10.1016/j.neuroimage.2011.06.075
Mechelli, A., Friston, K. J., Frackowiak, R. S., and Price, C. J. (2005). Structural covariance in the human cortex. J. Neurosci. 25, 8303–8310. doi: 10.1523/JNEUROSCI.0357-05.2005
Meles, S. K., Tang, C. C., Teune, L. K., Dierckx, R. A., Dhawan, V., Mattis, P. J., et al. (2015). Abnormal metabolic pattern associated with cognitive impairment in Parkinson's disease: a validation study. J. Cereb. Blood Flow Metab. 35, 1478–1484. doi: 10.1038/jcbfm.2015.112
Minati, L., Chiesa, P., Tabarelli, D., D'Incerti, L., and Jovicich, J. (2015). Synchronization, non-linear dynamics and low-frequency fluctuations: analogy between spontaneous brain activity and networked single-transistor chaotic oscillators. Chaos 25, 033107. doi: 10.1063/1.4914938
Moeller, J. R., Strother, S. C., Sidtis, J. J., and Rottenberg, D. A. (1987). Scaled subprofile model: a statistical approach to the analysis of functional patterns in positron emission tomographic data. J. Cereb. Blood Flow Metab. 7, 649–658. doi: 10.1038/jcbfm.1987.118
Morbelli, S., Arnaldi, D., Capitanio, S., Picco, A., Buschiazzo, A., and Nobili, F. (2013b). Resting metabolic connectivity in Alzheimer's disease. Clin. Trans. Imag. 1, 271–278. doi: 10.1007/s40336-013-0027-x
Morbelli, S., Perneczky, R., Drzezga, A., Frisoni, G. B., Caroli, A., van Berckel, B. N., et al. (2013a). Metabolic networks underlying cognitive reserve in prodromal Alzheimer disease: a European Alzheimer disease consortium project. J. Nucl. Med. 54, 894–902. doi: 10.2967/jnumed.112.113928
Morbelli, S., Piccardo, A., Villavecchia, G., Dessi, B., Brugnolo, A., Piccini, A., et al. (2010). Mapping brain morphological and functional conversion patterns in amnestic MCI: a voxel-based MRI and FDG-PET study. Eur. J. Nucl. Med. Mol. Imaging 37, 36–45. doi: 10.1007/s00259-009-1218-6
Mori, S., and Zhang, J. (2006). Principles of diffusion tensor imaging and its applications to basic neuroscience research. Neuron 51, 527–539. doi: 10.1016/j.neuron.2006.08.012
Musiek, E. S., Chen, Y., Korczykowski, M., Saboury, B., Martinez, P. M., Reddin, J. S., et al. (2012). Direct comparison of FDG-PET and ASL-MRI in Alzheimer's disease. Alzheimers Dement. 8, 51–59. doi: 10.1016/j.jalz.2011.06.003
Newberg, A. B., Wang, J., Rao, H., Swanson, R. L., Wintering, N., Karp, J. S., et al. (2005). Concurrent CBF and CMRGlc changes during human brain activation by combined fMRI-PET scanning. Neuroimage 28, 500–506. doi: 10.1016/j.neuroimage.2005.06.040
Niethammer, M., and Eidelberg, D. (2012). Metabolic brain networks in translational neurology: concepts and applications. Ann. Neurol. 72, 635–647. doi: 10.1002/ana.23631
Nishida, M., Juhász, C., Sood, S., Chugani, H. T., and Asano, E. (2008). Cortical glucose metabolism positively correlates with gamma-oscillations in nonlesional focal epilepsy. Neuroimage 42, 1275–1284. doi: 10.1016/j.neuroimage.2008.06.027
Nobili, F., Salmaso, D., Morbelli, S., Girtler, N., Piccardo, A., Brugnolo, A., et al. (2008). Principal component analysis of FDG PET in amnestic MCI. Eur. J. Nucl. Med. Mol. Imag. 35, 2191–2202. doi: 10.1007/s00259-008-0869-z
Ogawa, S., Lee, T. M., Kay, A. R., and Tank, D. W. (1990). Brain magnetic resonance imaging with contrast dependent on blood oxygenation. Proc. Natl. Acad. Sci. U.S.A. 87, 9868–9872. doi: 10.1073/pnas.87.24.9868
Pagani, M., Öberg, J., De Carli, F., Calvo, A., Moglia, C., Canosa, A., et al. (2016). Metabolic spatial connectivity in amyotrophic lateral sclerosis as revealed by independent component analysis. Hum. Brain Mapp. 37, 942–953. doi: 10.1002/hbm.23078
Passow, S., Specht, K., Adamsen, T. C., Biermann, M., Brekke, N., Craven, A. R., et al. (2015). Default-mode network functional connectivity is closely related to metabolic activity. Hum. Brain Mapp. 36, 2027–2038. doi: 10.1002/hbm.22753
Pawela, C., and Biswal, B. (2011). Brain connectivity: a new journal emerges. Brain Connect. 1, 1. doi: 10.1089/brain.2011.0020
Quarantelli, M., Berkouk, K., Prinster, A., Landeau, B., Svarer, C., Balkay, L., et al. (2004). Integrated software for the analysis of brain PET/SPECT studies with partial-volume-effect correction. J. Nucl. Med. 45, 192–201.
Raichle, M. E., MacLeod, A. M., Snyder, A. Z., Powers, W. J., Gusnard, D. A., and Shulman, G. L. (2001). Inaugural Article: a default mode of brain function. Proc. Natl. Acad. Sci. U.S.A. 98, 676–682. doi: 10.1073/pnas.98.2.676
Riedl, V., Bienkowska, K., Strobel, C., Tahmasian, M., Grimmer, T., Förster, S., et al. (2014). Local activity determines functional connectivity in the resting human brain: a simultaneous FDG-PET/fMRI study. J. Neurosci. 34, 6260–6266. doi: 10.1523/JNEUROSCI.0492-14.2014
Rottenberg, D. A., Moeller, J. R., Strother, S. C., Sidtis, J. J., Navia, B. A., Dhawan, V., et al. (1987). The metabolic pathology of the AIDS dementia complex. Ann. Neurol. 22, 700–706. doi: 10.1002/ana.410220605
Roy, C. S., and Sherrington, C. S. (1890). On the regulation of the blood-supply of the brain. J. Physiol. 11, 85–158. doi: 10.1113/jphysiol.1890.sp000321
Sanabria-Diaz, G., Martínez-Montes, E., and Melie-Garcia, L. (2013). Glucose metabolism during resting state reveals abnormal brain networks organization in the Alzheimer's disease and mild cognitive impairment. PLoS ONE 8:e68860. doi: 10.1371/journal.pone.0068860
Sestini, S., Castagnoli, A., and Mansi, L. (2010). The new FDG brain revolution: the neurovascular unit and the default network. Eur. J. Nucl. Med. Mol. Imaging 37, 913–916. doi: 10.1007/s00259-009-1327-2
Soddu, A., Gómez, F., Heine, L., Di Perri, C., Barhi, M. A., Voss, H. U., et al. (2015). Correlation between resting state fMRI total neuronal activity and PET metabolism in healthy controls and patients with disorders of consciousness. Brain Behav. 6. doi: 10.1002/brb3.424
Soddu, A., Vanhaudenhuyse, A., Bahri, M. A., Bruno, M. A., Boly, M., Demertzi, A., et al. (2011). Identifying the default-mode component in spatial IC analyses of patients with disorders of consciousness. Hum. Brain Mapp. 33, 778–796. doi: 10.1002/hbm.21249
Spetsieris, P. G., Ko, J. H., Tang, C. C., Nazem, A., Sako, W., Peng, S., et al. (2015). Metabolic resting-state brain networks in health and disease. Proc. Natl. Acad. Sci. U.S.A. 112, 2563–2568. doi: 10.1073/pnas.1411011112
Sporns, O. (2013). Network attributes for segregation and integration in the human brain. Curr. Opin. Neurobiol. 23, 162–171. doi: 10.1016/j.conb.2012.11.015
Sporns, O. (2014). Contributions and challenges for network models in cognitive neuroscience. Nat. Neurosci. 17, 652–660. doi: 10.1038/nn.3690
Tahmasian, M., Pasquini, L., Scherr, M., Meng, C., Förster, S., Mulej Bratec, S., et al. (2015). The lower hippocampus global connectivity, the higher its local metabolism in Alzheimer disease. Neurology 84, 1956–1963. doi: 10.1212/WNL.0000000000001575
Thomas, C., Frank, Q. Y., Irfanoglu, M. O., Modi, P., Saleem, K. S., Leopold, D. A., et al. (2014). Anatomical accuracy of brain connections derived from diffusion MRI tractography is inherently limited. Proc. Natl. Acad. Sci. U.S.A. 111, 16574–16579. doi: 10.1073/pnas.1405672111
Tomasi, D., and Volkow, N. D. (2012). Aging and functional brain networks. Mol. Psychiatry 17, 549–458. doi: 10.1038/mp.2011.81
Tomasi, D., Wang, G.-J., and Volkow, N. D. (2013). Energetic cost of brain functional connectivity. Proc. Natl. Acad. Sci. U.S.A. 110, 13642–13647. doi: 10.1073/pnas.1303346110
Toussaint, P. J., Perlbarg, V., Bellec, P., Desarnaud, S., Lacomblez, L., Doyon, J., et al. (2012). Resting state FDG-PET functional connectivity as an early biomarker of Alzheimer's disease using conjoint univariate and independent component analyses. Neuroimage 63, 936–946. doi: 10.1016/j.neuroimage.2012.03.091
Tripathi, M., Tang, C. C., Feigin, A., De Lucia, I., Nazem, A., Dhawan, V., et al. (2016). Automated differential diagnosis of early parkinsonism using metabolic brain networks: a validation study. J. Nucl. Med. 57, 60–66. doi: 10.2967/jnumed.115.161992
Vaishnavi, S. N., Vlassenko, A. G., Rundle, M. M., Snyder, A. Z., Mintun, M. A., and Raichle, M. E. (2010). Regional aerobic glycolysis in the human brain. Proc. Natl. Acad. Sci. U.S.A. 107, 17757–17762. doi: 10.1073/pnas.1010459107
Valk, S. L., DiMartino, A., Milham, M., and Bernhardt, B. C. (2015). Multi-center mapping of structural network alterations in autism. Hum. Brain Mapp. 36, 2364–2373. doi: 10.1002/hbm.22776
van den Heuvel, M. P., Mandl, R. C., Kahn, R. S., Hulshoff Pol, H. E., and Hilleke, E. (2009). Functionally linked resting-state networks reflect the underlying structural connectivity architecture of the human brain. Hum. Brain Mapp. 30, 3127–3141. doi: 10.1002/hbm.20737
Vogt, B. A., Leslie, V., and Steven, L. (2006). Cytology and functionally correlated circuits of human posterior cingulate areas. Neuroimage 29, 452–466. doi: 10.1016/j.neuroimage.2005.07.048
Wang, Z., Dai, Z., Gong, G., Zhou, C., and He, Y. (2014). Understanding structural-functional relationships in the human brain a large-scale network perspective. Neuroscientist 21, 290–305. doi: 10.1177/1073858414537560
Wehrl, H. F., Hossain, M., Lankes, K., Liu, C. C., Bezrukov, I., Martirosian, P., et al. (2013). Simultaneous PET-MRI reveals brain function in activated and resting state on metabolic, hemodynamic and multiple temporal scales. Nat. Med. 19, 1184–1189. doi: 10.1038/nm.3290
Wehrl, H. F., Wiehr, S., Divine, M. R., Gatidis, S., Gullberg, G. T., Maier, F. C., et al. (2014). Preclinical and translational PET/MR imaging. J. Nucl. Med. 55(Suppl. 2), 11S–18S. doi: 10.2967/jnumed.113.129221
Yakushev, I., Chételat, G., Fischer, F. U., Landeau, B., Bastin, C., Scheurich, A., et al. (2013). Metabolic and structural connectivity within the default mode network relates to working memory performance in young healthy adults. Neuroimage 79, 184–190. doi: 10.1016/j.neuroimage.2013.04.069
Zang, Y., Jiang, T., Lu, Y., He, Y., and Tian, L. (2004). Regional homogeneity approach to fMRI data analysis. Neuroimage 22, 394–400. doi: 10.1016/j.neuroimage.2003.12.030
Zou, N., Chetelat, G., Baydogan, M. G., Li, J., Fischer, F. U., Titov, D., et al. (2015). Metabolic connectivity as index of verbal working memory. J. Cereb. Blood Flow Metab. 35, 1122–1126. doi: 10.1038/jcbfm.2015.40
Zou, Q.-H., Zhu, C.-Z., Yang, Y., Zuo, X.-N., Long, X.-Y., Cao, Q.-J., et al. (2008). An improved approach to detection of amplitude of low-frequency fluctuation (ALFF) for resting-state fMRI: fractional ALFF. J. Neurosci. Methods 172, 137–141. doi: 10.1016/j.jneumeth.2008.04.012
Keywords: PET, MR, PET/MR, brain connectivity, metabolic networks, resting state networks, connectome
Citation: Aiello M, Cavaliere C and Salvatore M (2016) Hybrid PET/MR Imaging and Brain Connectivity. Front. Neurosci. 10:64. doi: 10.3389/fnins.2016.00064
Received: 28 October 2015; Accepted: 10 February 2016;
Published: 01 March 2016.
Edited by:
Nikolaus Weiskopf, University College London, UKReviewed by:
Boris Bernhardt, Max Planck Institute for Human Cognitive and Brain Sciences, GermanyHans F. Wehrl, University of Tübingen, Germany
Copyright © 2016 Aiello, Cavaliere and Salvatore. This is an open-access article distributed under the terms of the Creative Commons Attribution License (CC BY). The use, distribution or reproduction in other forums is permitted, provided the original author(s) or licensor are credited and that the original publication in this journal is cited, in accordance with accepted academic practice. No use, distribution or reproduction is permitted which does not comply with these terms.
*Correspondence: Marco Aiello, maiello@sdn-napoli