 Alexandra Essebier1
 Patricia Vera Wolf1
 Minh Duc Cao1
 Bernard J. Carroll1
 Sureshkumar Balasubramanian2*
 Mikael Bodén1*
- 1School of Chemistry and Molecular Biosciences, The University of Queensland, St Lucia, QLD, Australia
- 2School of Biological Sciences, Monash University, Melbourne, VIC, Australia
More than 30 human genetic diseases are linked to tri-nucleotide repeat expansions. There is no known mechanism that explains repeat expansions in full, but changes in the epigenetic state of the associated locus has been implicated in the disease pathology for a growing number of examples. A comprehensive comparative analysis of the genomic features associated with diverse repeat expansions has been lacking. Here, in an effort to decipher the propensity of repeats to undergo expansion and result in a disease state, we determine the genomic coordinates of tri-nucleotide repeat tracts at base pair resolution and computationally establish epigenetic profiles around them. Using three complementary statistical tests, we reveal that several epigenetic states are enriched around repeats that are associated with disease, even in cells that do not harbor expansion, relative to a carefully stratified background. Analysis of over one hundred cell types reveals that epigenetic states generally tend to vary widely between genic regions and cell types. However, there is qualified consistency in the epigenetic signatures of repeats associated with disease suggesting that changes to the chromatin and the DNA around an expanding repeat locus are likely to be similar. These epigenetic signatures may be exploited further to develop models that could explain the propensity of repeats to undergo expansions.
1. Introduction
Expansion of short tandem repeats (STRs) in human genes has been shown to cause a range of debilitating neurological diseases (Kovtun and McMurray, 2008; Dion and Wilson, 2009; Cohen-Carmon and Meshorer, 2012). Repeat expansions can be observed in both germline and somatic tissues, but the factors that underlie the expansion of short tandem repeats in general are poorly understood. Changes in epigenetic status surrounding repeat expansions have been shown to be critical for the associated disease pathology in diseases such as Friedreich ataxia (Nakamori and Thornton, 2010; Evans-Galea et al., 2012; Soragni et al., 2014). It has also been suggested that these changes could modulate instability of STRs (Nichol and Pearson, 2002; Gorbunova et al., 2004; Libby et al., 2008; Debacker et al., 2012; Gannon et al., 2012). The Roadmap Epigenomics project (Roadmap Epigenomics Consortium et al., 2015) performed genome-wide epigenetic assays for primary cells and tissue types at unprecedented scale, and offers a timely opportunity to computationally explore the epigenetic context of tri-nucleotide repeats (TNRs) and their association with repeat expansion.
Based on their relative position within a gene, broadly, TNRs can be grouped as “coding” (exonic), and “non-coding” (intronic, intergenic, etc.). The former class includes almost exclusively CAG repeats that lead to polyglutamine stretches in proteins observed in Huntington's disease and most of the spinocerebellar ataxias. In contrast, repeat expansions in introns, 5′ and 3′ UTR regions of genes, are of different types, exemplified by the GAA repeat expansion in Friedreich ataxia, fragile X syndrome and myotonic dystrophy(Lopez-Castel et al., 2010).
A comparison of the triplet repeats (≥6 repeat units) across the human genome revealed that more than 10,000 tandem repeats are present within the genic regions (Willadsen et al., 2013). However, the repeat expansions have been reported in only a handful of cases representing approximately 30 disease conditions, even though in theory all the repeats may have the potential to undergo expansion. This raises the question as to what factors determine the propensity of a given repeat to undergo expansion.
In recent years, experiments on relevant TNR disease model cell types point to an association of heterotransplantation with both coding and non-coding repeat expansions (Dion and Wilson, 2009; Cohen-Carmon and Meshorer, 2012). The formation of heterochromatin appears to be effected via histone modifications as well as DNA methylation at CpG islands at or very near the repeat expansions. The transition into a repressed state is a unifying aspect associated with triplet expansions raising the question, does an epigenetic environment exist that is unique to expanded, disease-associated TNRs? It also raises an interesting possibility of epigenetic features governing the propensity of a given repeat to undergo expansions. We therefore considered whether epigenetic features discerned in normal, healthy cells can help explain and predict if a TNR can, under some circumstance, become unstable and cause disease.
To answer these questions we sought to distinguish between disease-associated TNRs (DA-TNRs), from a set of background TNRs (bg-TNRs; all TNRs, not distinguishing between expanding and those that cause disease) to assess whether we could arrive at common principles. Even though the underlying genes have been cloned for several triplet expansion diseases, a comprehensive dataset with genomic co-ordinates has not been compiled so far, which is essential for the computational exploration of common principles. To achieve this, we first recorded canonical genomic coordinates of DA-TNRs at a base pair level. Having the exact locations to what we refer to as a foreground set, enabled us to precisely link genomic properties to the repeat tract (e.g., histone acetylation and methylation or DNA methylation patterns), and to statistically evaluate their association with repeats en masse, i.e., in relation to a background set.
In this paper, we test which epigenetic marks are enriched for (grouped) repeat loci of interest. We develop three complementary statistical tests to analyse the typical epigenetic context of DA-TNRs and compare them with bg-TNRs, stratified by sequence composition and genic location. This stratification allows us to compare the epigenetic patterns statistically, across a spectrum of cell types, that do not harbor expansions (Roadmap Epigenomics Consortium et al., 2015). Specifically, we stratify repeats by their sequence composition (e.g., CAG), their location in the gene (exon, intron, 5′ UTR and 3′ UTR) or a combination of these two features (e.g., exonic CAG). This paper shows that the expansion-prone repeats differ from random set of repeats in their epigenetic profiles, which suggests that certain epigenetic profiles could be associated with an increased propensity for repeats to undergo expansion.
2. Materials and Methods
2.1. Determining the Genomic Co-ordinates of Triplet Repeats Associated with Repeat Expansion Diseases
We determined the genomic location for 32 known tri-nucleotide repeats associated with disease, relative to human genome build 19 (hg19; UCSC) and the 2009 human reference sequence (GRCh37; NCBI). The position of each disease gene was obtained through the UCSC genome browser and when multiple variants were encountered, the minimum and maximum positions were used. We used RefSeq annotation track on UCSC table browser to generate the gene sequence separated into introns, exons and UTRs. A manual search was carried out to locate each repeat and confirm its position in an exon, intron or UTR region (genic annotation). Where possible, repeat locations were confirmed using the ZIP-seq database of CAG repeats (Xu et al., 2014). ZIP-seq recovered locations for eleven of seventeen CAG DA-TNRs.
The location data for all DA-TNRs are shown in Table 1 but are also made available in the Supplementary Material both as a spreadsheet, which contains references to primary publications, and as a standard BED file, which will allow users to view locations in the UCSC Genome Browser (http://genome.ucsc.edu) and process its content using most genome sequence tools (e.g., BEDTOOLS).
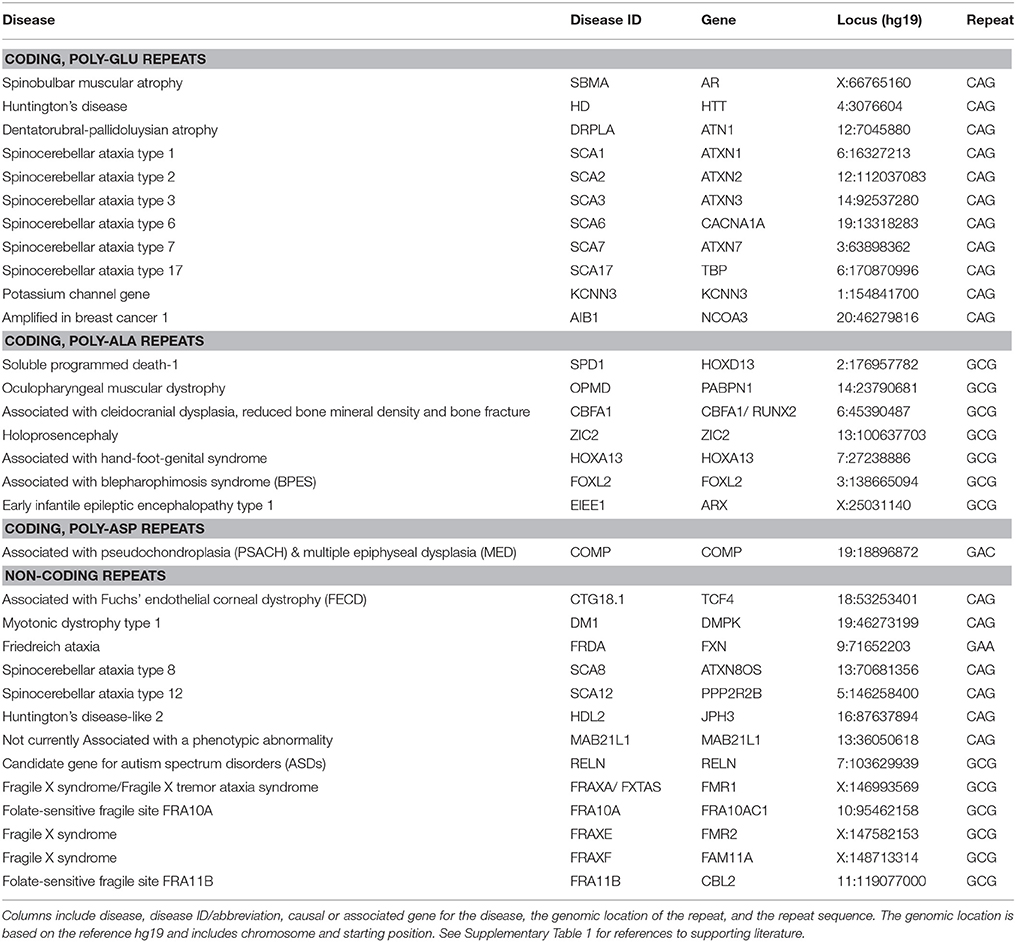
Table 1. Disease-associated tri-nucleotide repeats examined in this study.
We made use of both computationally deciphered TNRs from genome sequences as well as experimentally confirmed TNRs as a statistical background (bg-TNRs) to DA-TNRs. The “computationally deciphered” background was constructed by scanning the whole human genome using Tandem Repeats Finder (Benson, 1999) to identify all repeats which share either genic annotation or sequence repeat unit with one or more DA-TNRs. Zinc finger protein-based immunoprecipitation and sequencing (ZIP-seq) has allowed for genome-wide analysis of TNRs leading to development of a database of CAG repeats located in genes throughout the human genome (Xu et al., 2014). The ZIP-seq database has higher sensitivity than Tandem Repeats Finder and makes up our experimentally determined background of TNRs of length ≥3 repeat units.
2.2. Selection of Epigenetic Marks and Data Sets
To start with, we selected a subset of genomic signatures based on their presumed or demonstrated roles in chromatin structure, DNA replication or repair. Some of these marks have also been associated with repeat instability (Libby et al., 2008; Dion and Wilson, 2009; Nakamori and Thornton, 2010; Datta et al., 2011; Cohen-Carmon and Meshorer, 2012; Debacker et al., 2012; Volle and Delaney, 2012). The Roadmap Epigenomics Project (Roadmap Epigenomics Consortium et al., 2015) and the ENCODE Project (ENCODE Project Consortium, 2012) encompass genome-wide high-quality data sets, which can be utilized to answer specific questions statistically. We selected nine genome-wide assays from the Roadmap Epigenomics data repository, all of the histone modifications designated as core epigenetic markers (available as ChIP-seq data for 111 tissues; see Table 2) and additional markers directly or indirectly implicated in repeat instability (available in 37 or more tissues; see Table 2), allowing an assessment that was relatively unbiased in regards to tissue. We complemented this dataset with genome-wide assays from the ENCODE data repository, covering signatures from human embryonic stem cells (hESC). For the ENCODE data, we used several markers for euchromatin, heterochromatin and nucleosome occupancy, including DNase I hypersensitivity assays (Crawford et al., 2006) and FAIRE (Giresi et al., 2007). We also used a large number of ChIP-seq data sets (Johnson et al., 2007) to probe binding events on DNA and chromatin for a large number of relevant proteins and their modifiers, including histone deacetylase (HDAC), the chromatin insulator CTCF, and an array of histone tail modifications.
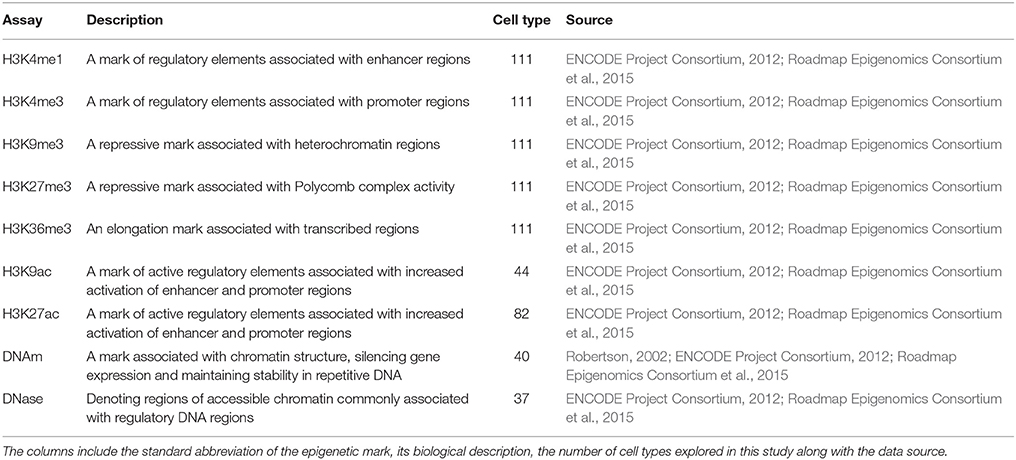
Table 2. Epigenetic marks analyzed in this study.
2.3. Statistical Enrichment Analysis
We developed three methods M1-M3 (summarized in Figure 1) to analyse the epigenetic states around tri-nucleotide repeat regions throughout the genome. We labeled each foreground and background repeat with genomic region (exon, intron, 5′ UTR and 3′ UTR) and canonical tri-nucleotide repeat sequence composition (amongst DA-TNRs there were only four found, of ten possible: GAA.TTC, GAC.GTC, CAG.CTG, and GCG.CGC). Grouped by composition and/or region, DA-TNRs could be compared against similar repeats in the genome. We considered the association of the epigenetic marks and their overlap in individual cell types across repeats grouped by composition and/or region (M1), the overlap of epigenetic marks with specific individual repeats but with no attention to cell type (M2), and the distance of an epigenetic mark from a repeat of interest (M3). These three independent measures provide statistical robustness for assessing the enrichment of the marks around expanded repeats.
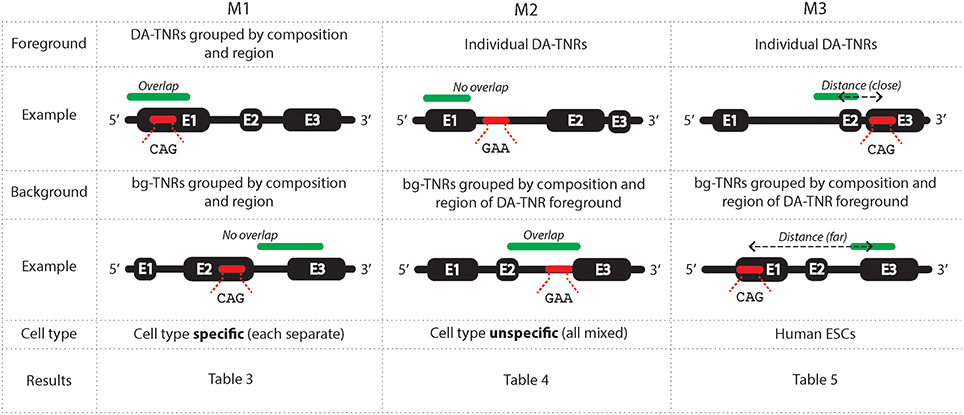
Figure 1. A graphical representation of the three methods used to measure an enrichment of epigenetic environment around DA-TNRs. M1 measures an association between a group of DA-TNRs and an epigenetic mark on basis of overlap within each cell type. M2 measures an association between a specific DA-TNR and an epigenetic mark on basis of their overlap when cell type is ignored. M3 uses a distance from the centre of the repeat to the centre of the epigenetic mark to measure enrichment. Each method makes different use of assays from available cell types, foregrounds and statistical tests to measure enrichment.
M1 determines the enrichment of an epigenetic mark overlapping with a group of DA-TNRs. A contingency matrix is created using counts of grouped DA-TNRs versus bg-TNRs which overlap versus do not overlap an epigenetic mark. Both DA- and bg-TNRs are stratified based on applicable combinations of their genic annotation (exon, intron, 5′ and 3′ UTR) and/or repeat unit sequence (CAG, GCG, GAC, and GAA). For a TNR (DA-TNR or bg-TNR) to be in a histone modified state, M1 requires that either the start or the end point is within the called ChIP-seq broad peak. For a TNR to be DNA methylated, M1 requires that its start or end point is within 200 base pairs of a methylated CpG. This more permissive criterion accommodated that DNA methylation sites are shorter than histone broad peaks. We also used DNase-seq narrow peaks, and they were required to overlap with the TNR, to be counted as a match.
M1 uses the Fisher Exact test on the contingency matrices to assign a p-value for the resulting hypergeometric distribution of counts, measuring the support for the over- or under-enrichment of the epigenetic mark for the defined group of DA-TNRs. (Over-enrichment means that DA-TNRs overlap with the epigenetic mark to a greater extent than bg-TNRs. Under-enrichment means that fewer DA-TNRs overlap with the mark than expected from the counts of overlaps with bg-TNRs.) This method is repeated independently for all different cell types and epigenetic assays. We note the percent of cell types in which the epigenetic mark is found overlapping with the group DA-TNRs to an extent that cannot be explained by comparing against a stratified but otherwise non-specific set of TNRs. This test lacks statistical power for smaller groups of TNRs, e.g., there is only one GAA DA-TNR, and four CAG DA-TNRs annotated within 5′ UTRs. We left p-values uncorrected for multiple tests to discern trends across all epigenetic maps for the same mark, or across sub-sets of maps (say, for specific groups of cell types).
M2 evaluates the enrichment of an epigenetic mark overlapping a specific DA-TNR but across all cell types, relative all bg-TNRs with identical sequence and genic annotation, also sampled indiscriminatively from all cell types. The frequencies accrued from bg-TNRs were used with a binomial test to ascertain the cumulative probability of observing the actual number (or more extreme) of overlaps between the specific DA-TNR and the given epigenetic mark, across the now de-identified cell types. The assumption that the epigenetic status is independent of cell type, implicit in M2, enables us to look at each individual DA-TNR statistically, but this violates the understanding that cell fates are reflected in epigenetic states (Roadmap Epigenomics Consortium et al., 2015). To compensate for multiple tests and this assumption, the p-value is corrected conservatively before reported.
M3 evaluates for a single DA-TNR an enrichment based on the distance to a given epigenetic mark or factor. For M3, a distance was measured from the center of the repeat to the center of the closest region labeled with the mark. We did not stratify on length of repeat as this would reduce the size of groups and therefore the statistical power. While longer repeats increase the chance of overlap with epigenetic marks, DA-TNRs did not demonstrate this tendency over that observed in bg-TNRs, which are similarly length-distributed. For each mark, we created a (kernel-estimated) density of log-transformed absolute distances between (any) bg-TNRs and the corresponding, closest occurrence of that mark. In this estimate, we included all bg-TNRs that had identical sequence and genic annotation as the DA-TNR of interest. From this density we computed a p-value by inspecting the area. We only looked at the left (shorter distance) tail of the density, which means we only assigned a p-value to the DA-TNR of interest if proximity of mark was enriched.
3. Results
3.1. Expansion-Prone Triplet Repeats Have Distinct Epigenetic Features
To compare the features of the disease-associated repeats, we first compiled their reference genomic positions as described above (see Table 1; Supplementary Table 1) and the positions for a stratifiable background set. To assess the differences between the DA-TNRs and bg-TNRs, we probed the enrichment of histone modifications, DNA methylation and DNase I hypersensitivity using the Roadmap Epigenomics project data set (Roadmap Epigenomics Consortium et al., 2015) available for multiple cell types. We generated epigenetic maps for all cell types. Each map identifies all locations of that epigenetic mark that overlap with a TNR in the cell type. The analysis below thus involves a total of 758 epigenetic maps (see Table 2).
Using the M1 method described earlier, for each epigenetic map, we established the significance of the overlap of the epigenetic mark and each grouped DA-TNR, independently for each cell type. Table 3 shows the percentage of different cell types in which DA-TNRs are either over- or under-enriched at p ≤ 0.05 for the tested epigenetic mark. (A small p indicates that the overlap established in bg-TNRs, fails to explain the overlap between an epigenetic mark and DA-TNRs for the epigenetic map.) In all our tests, the same trends are seen with either Tandem Repeats Finder or ZIP-seq backgrounds. We provide complete results for both backgrounds in the Supplementary Tables and have focused on results based on Tandem Repeats Finder below.
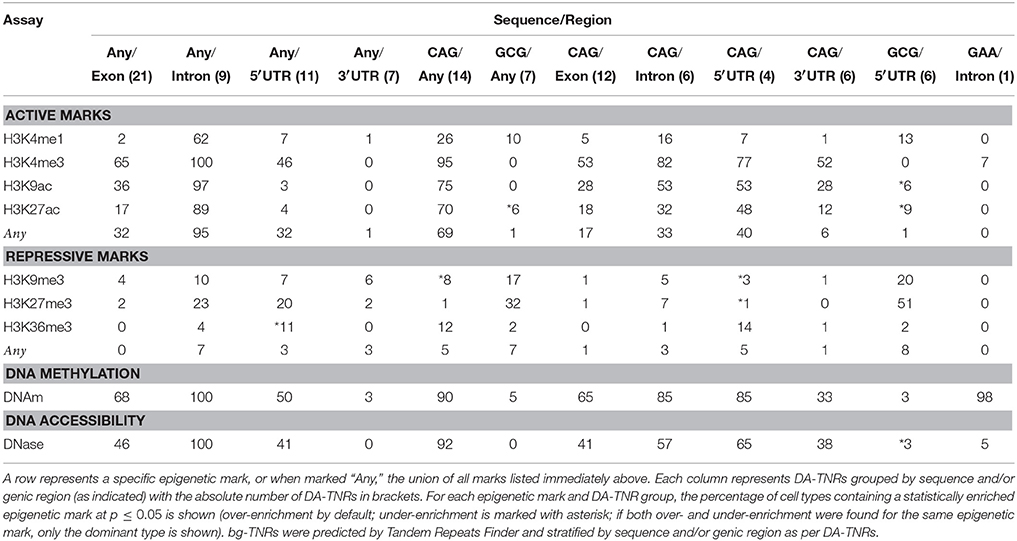
Table 3. Percent of cell types that display over- or under-enrichment for specific epigenetic marks around DA-TNRs per M1 (see Figure 1) where TNRs are grouped by either sequence and/or genic region.
Our analyses revealed that DA-TNRs are more DNA methylated than bg-TNRs are, in a majority of cell types (see Table 3). This trend could be observed in both intronic and exonic tandem repeats, in general for CAG repeats, and even for the sole intronic GAA repeat for Friedreich ataxia. (For FRDA, only one cell type “Brain angular gyrus” is not enriched for DNA methylation.) Hence, it appears that positive methylation status can be attributed to many DA-TNR loci (see Table 2). However, repeats of either GCG or GAC, or those that fall in 3′ UTRs (see also Supplementary Table 1 “M1 DNAm”) form a group of exceptions to this trend, amongst known repeat expansion diseases. For all other tests, the average number of cell types which are enriched for DNA methylation at DA-TNRs exceeds 80%. This is interesting because DNA methylation is also observed in many repeat disease models, in particular upstream of the repeat locus (Dion and Wilson, 2009; Kumari and Usdin, 2009).
Analysis of the histone markers revealed some surprising aspects. We found active histone marks such as H3K4me3, H3K4me1, H3K27ac, and H3K9ac are routinely enriched around locations of many groups of DA-TNRs, in particular those involving the repeat sequence CAG. To quantify their collective enrichment, we refer to the union of all sites for each active mark. Here, on average 27% of all cell types, across all sequence/region permutations, are enriched for active marks (see Table 3, row marked “Any” under section “Active marks”). This was strongest for CAG and intronic repeats, and weakest for 3′ UTR and GCG repeats. This is in contrast to disease models, where expanded TNR loci are associated with silenced chromatin (Dion and Wilson, 2009; Cohen-Carmon and Meshorer, 2012). Indeed, in our analysis, the union of repressive marks displayed almost complete lack of enrichment (see Table 3, row marked “Any” under section “Repressive marks”). That DA-TNRs are enriched for active marks prior to expansion suggest that they are lost in that process. We also note that DNase I is statistically associated with DA-TNRs, with an average of near 60% of cell types having CAG DA-TNRs marked by DNase I at p < 0.05, across all genic regions (Table 3).
3.2. Few Epigenetic Markers Display a Significant Enrichment for Positional Overlap with Disease Associated Triplets
To assess the epigenetic association of each individual DA-TNR, we developed M2 (see Section 2) that compares the frequency of overlap of the DA-TNR and the set of all bg-TNRs with the same genic regions and sequence composition for a given epigenetic mark. For example, the DA-TNR on chromosome X, at locus 66765160 (hg19) is a CAG repeat that is annotated as both exonic and 3′ UTR (see Table 4 - AR). So, we define as background the set of 36 CAG bg-TNRs that are both exonic and 3′ UTR (according to NCBI-RefSeq). The bg-TNRs were then used to determine the frequency of overlap with the epigenetic mark (within 200 base pairs) across all cell types available for it.
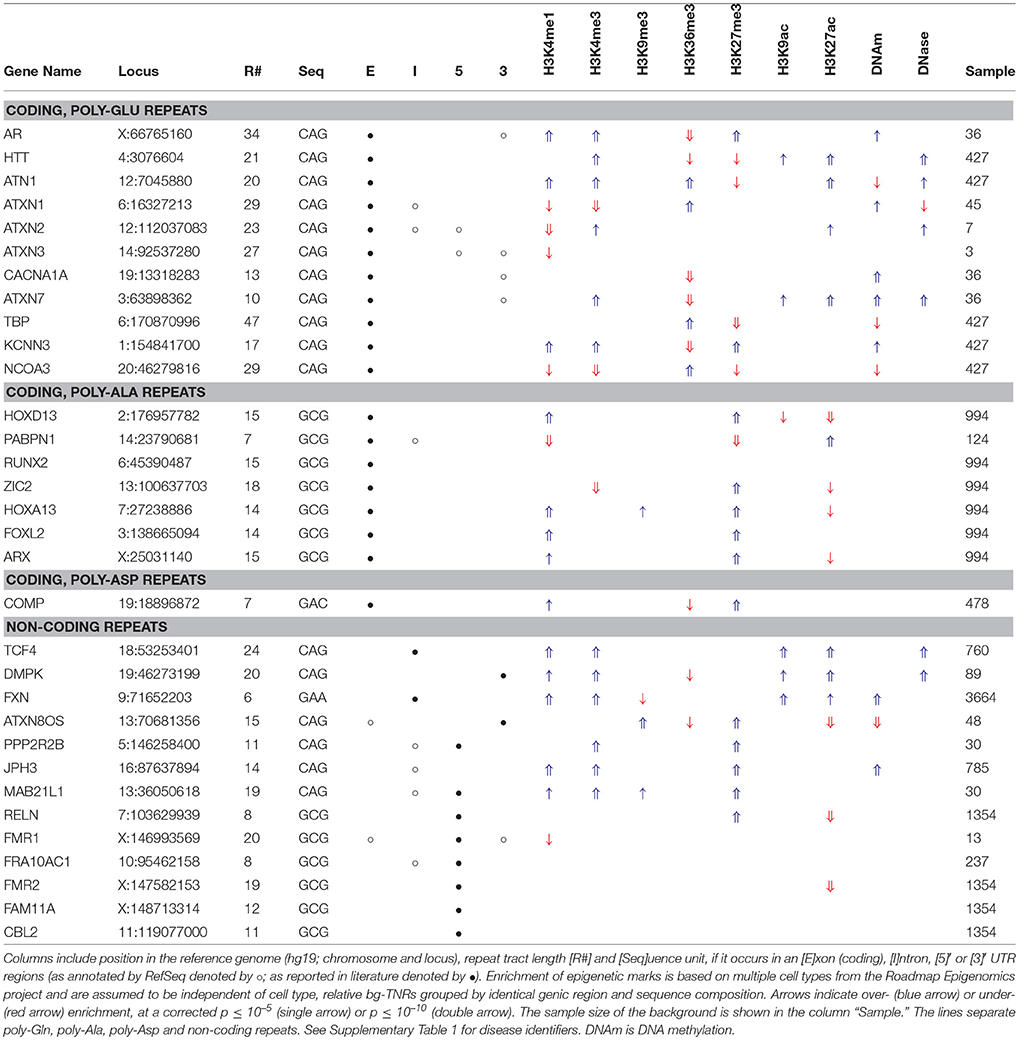
Table 4. Over- and under-enriched epigenetic marks identified by M2 for individual DA-TNRs (see Figure 1).
For a specific epigenetic mark, we then asked the question: can we explain the frequency of overlap between its occurrence and that single DA-TNR locus across the cell types given the distribution of observations in the corresponding set of bg-TNRs? M2 uses the binomial test to evaluate if the DA-TNR has a significantly different signature–by counting the number of cell types in which it overlaps with the epigenetic mark. The test makes two simplifying assumptions: that observations in different cell types are independent, and that relationships between an epigenetic mark and DA-TNRs can be found even when the type of cell is disregarded. The latter violates our biological understanding but allows individual DA-TNRs to be profiled. With all cell types included in the test, the p-values were corrected for multiple tests; the marks that were either over- or under-enriched for the DA-TNR are shown in Table 4. (In Table 4 arrows point up for more, arrows point down for less cell types than expected.)
Our analyses revealed variation in the epigenetic state for individual DA-TNRs across cell types does vary. Many, but not all CAG DA-TNRs are enriched with H3K4me3, and less consistently with H3K9ac and H3K27ac. DNA methylation status is not as clear for individual repeats, as it was when DA-TNRs were viewed in groups. Four (of 32) individual DA-TNRs (all exonic CAG) are under-enriched for methylation. The FXN TNR is flagged as significantly DNA methylated, together with H3K4me1, H3K4me3, H3K9ac, and H3K27ac. In general, this still suggests that the epigenetic state in disease models (Al-Mahdawi et al., 2008; Dion and Wilson, 2009; Kumari and Usdin, 2009) are distinguishable from healthy cell types not in terms of DNA methylation but in terms of the absence of histone marks related to active and open chromatin (see Table 4).
3.3. Enrichment of Other Epigenetic Marks Around TNR Loci
In addition to markers surveyed by the Roadmap Epigenomics project, we also considered FAIRE (Giresi et al., 2007), which measures DNA accessibility akin to DNase I hypersensitivity, and the binding of factors such as histone deacetylases (HDAC). This data are available from ENCODE (ENCODE Project Consortium, 2012).
We established what factors and markers that are close to disease linked TNR loci but not to other, comparable repeat loci. Specifically, we developed M3 (see Section 2) to score co-occurrence in terms of absolute genomic distance, designating a mark as more strongly associated with a locus at an absolute distance d, than a locus at a distance exceeding d (where “absolute” means that we disregard if the mark is upstream or downstream of the locus). By evaluating enrichment in terms of distances we are able to apply a more sensitive test compensating for the lack of cell types.
To ascertain the significance of the enrichment of each epigenetic mark or factor at loci of DA-TNR, as before, we relied on stratified bg-TNRs. We thus know, for each mark, how close it is in general to a repeat, and could assign a p-value to indicate the probability that the distance to the DA-TNR can be explained by chance. Taken together, the distances and p-values for the 20 different epigenetic marks and factors, for each DA-TNR locus are provided in the Supplementary Tables.
Table 5 again lists all known DA-TNRs, together with the genomic regions they overlap with, and this time the marks and factors we found to be significantly near to the locus of the DA-TNR. We noticed that many DA-TNRs are enriched for one or more marks, in general those indicating open chromatin, DNA methylation and specific subsets of histone-3 methylation–in agreement with the results rendered by the overlap enrichment.
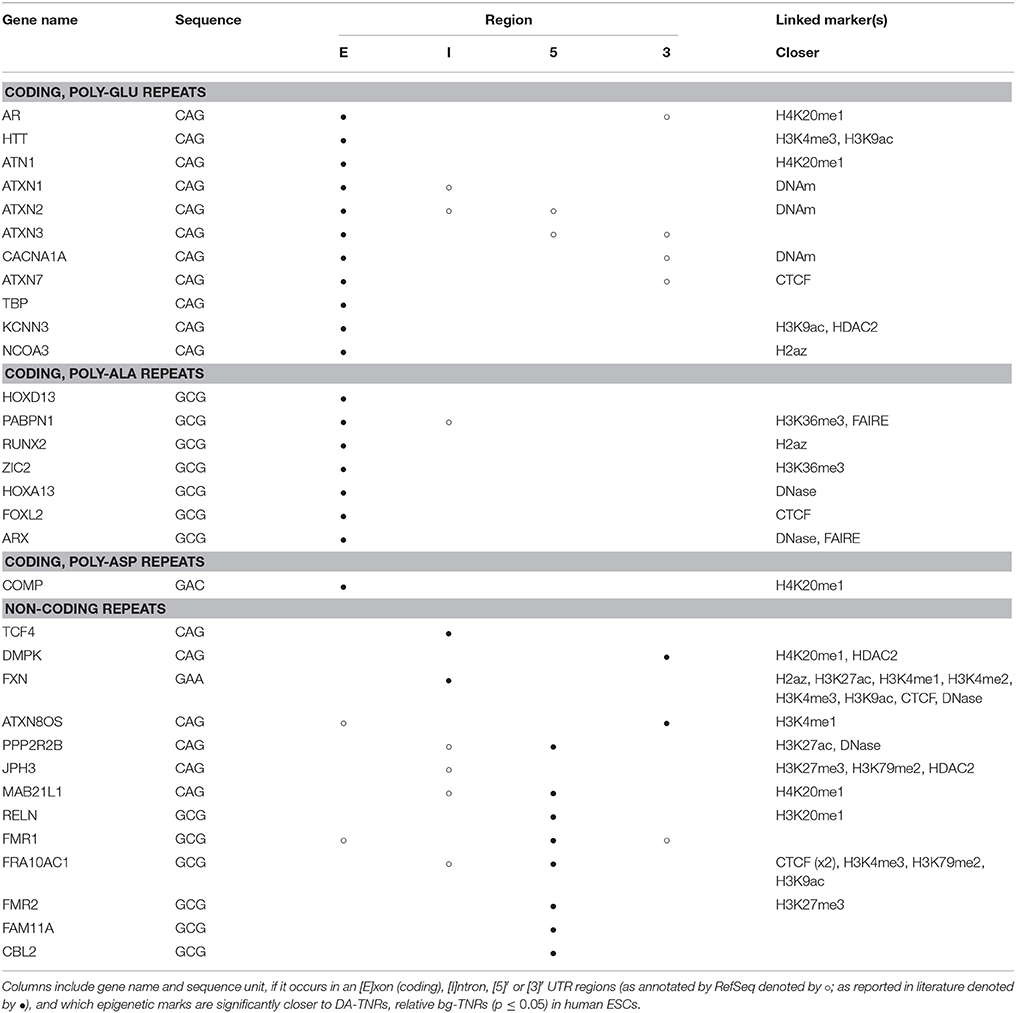
Table 5. Proximity-enriched epigenetic marks in Human ESCs identified by M3 for individual DA-TNRs (see Figure 1).
4. Discussion
Across the range of normal, healthy cell types, we note that several groups of DA-TNRs, and individual DA-TNRs appear in H3K4 mono- and tri-methylated regions; in H3K9 and H3K27 acetylated regions (in particular CAG-repeats; see Table 3), all of which are active marks and indicators of open chromatin (Ernst et al., 2011). We also note that most DA-TNRs when grouped are DNA methylated or at least close to methylated CpGs (see Table 3). The latter observation is generally in line with what is also observed in disease tissue, but the former is not. We generally saw the same trends when using ZIP-seq data as statistical background (see Supplementary Tables). Below we make explicit reference to results based on bg-TNRs identified using Tandem Repeats Finder, because they also cover non-CAG repeats.
4.1. Interpreting the Enrichment of Epigenetic Marks
The enrichment tests above indicate which cell type specific epigenetic marks differ in their distribution around grouped DA-TNRs when compared to a stratified background. This is evidence that DA-TNRs have epigenetic features that are relatively uncommon for stable TNRs. Statistically over- or under-enriched factors in healthy tissues are key targets for future analyses as they may be altered to either cause expansion, or as an effect of expansion.
4.1.1. Chromatin Structure Around DA-TNRs
DNase I or FAIRE are effective markers for DNA accessibility, and are often used to probe the chromatin packaging state. In normal, healthy cells DA-TNRs tend to occur at loci overlapping or proximal to DNase I hypersensitive tracts meaning that DNA is accessible, as illustrated by Table 3 for groups of DA-TNRs and Tables 4, 5 for individual DA-TNRs. FAIRE was proximity-enriched at two DA-TNRs in hESC (see Table 5).
CTCF is a zinc-finger DNA binding protein that plays a role in chromatin insulation, transcriptional regulation and genomic imprinting. It affects higher order chromatin structure and could therefore play a role in repeat instability, particularly in the case of a binding site located 3′ to CAG repeats. Libby et al. (2008) demonstrated this influence on stability at the SCA7/ATXN7 locus and four other CAG repeat loci. We observe that SCA7 and three other DA-TNRs have a CTCF binding site significantly closer than expected by chance in hESC (see Table 5 and Supplementary Tables).
4.1.2. Absence of Repressive Histone Marks in DA-TNRs
Three histone modifications (H3K27me3, H3K9me3, and H4K20me1) are associated with a repressive or heterochromatic environment. These marks were not prevalent around DA-TNRs in normal cell types. The lack of repeats containing these marks in the 758 epigenetic maps from the Roadmap Epigenomics project and over 20 maps extracted from ENCODE's hESC (human embryonic stem cell) is in contrast with observations in disease models (Al-Mahdawi et al., 2008; Dion and Wilson, 2009; Kumari and Usdin, 2009; Cohen-Carmon and Meshorer, 2012). H3K27me3 and H3K36me3 are repressive marks associated with disease models, but we failed to demonstrate a general co-occurrence with DA-TNRs. They were over-enriched in a small number of tissues and also significantly close to very few DA-TNRs, but they also appeared to be under-enriched in a few instances (see Table 3, section “Repressive marks”; also see Table 5). H3K9me3 is also a repressive mark associated with repetitive elements and constitutive heterochromatin (Al-Mahdawi et al., 2008), but we failed to find a clear association with DA-TNRs, with the exception of a weak over-enrichment with GCG TNRs at 5′ UTR (see Table 3). H4K20me1 has been linked to repression and transition to heterochromatin and a number of biological processes including DNA damage repair and DNA replication (Jørgensen et al., 2013). It was only available for the ENCODE data set, but our analysis indicated some support for linking it with DA-TNRs. Six individual DA-TNRs showed significantly closer H4K20 mono-methylation than what would be expected from observing bg-TNRs.
4.1.3. DNA Methylation
DNA methylation plays a silencing role in gene expression, chromatin structure and maintaining genome stability in repetitive DNA (Robertson, 2002). DNA methylation patterns have been shown to be very specific to cell types (Varley et al., 2013) while histone modifications reflect changes in gene transcription across cell types (Koch et al., 2007). Both M1 and M3 consider patterns of overlap and proximity in a cell type specific manner, and are therefore capable to detect both methylation and histone modification patterns. On the other hand, M2 is only seeing an epigenetic signal for repeat loci if it is independent of cell type. We therefore caution against over-interpreting the enrichment of DNA methylation observed by M2. This problem with M2 affects DNA methylation patterns more than histone modifications, as methylation is more cell type specific than histone modifications.
DNA methylation occurs at higher levels in CpGs upstream of the GAA repeat and in some CpGs in the 5′ UTR in FXN (Evans-Galea et al., 2012), and with multiple other repeat expansion models (Dion and Wilson, 2009). Several other ataxia-related phenotypes (SCA1, SCA2, and SCA6) showed close methylation patterns (see Table 4). It is striking that DNA methylation is statistically enriched at sites of DA-TNRs compared to genomically similar sites in a majority of tissues, clearly suggesting that it is a feature of disease, but one which fails to directly explain the transition of a repeat from a normal to an expanded state. Speculatively, a transient state of de-methylation could provide an explanation, as reduced methylation levels are known to promote both contractions and expansions in selected cell lines (Gorbunova et al., 2004). The DNAm states in Figure 2 show that DNA methylation is site specific with different locations around the GAA repeat showing both increases and decreases in DNA methylation of CpGs. This variation seconds the idea of transience in the methylation state around unstable TNRs.
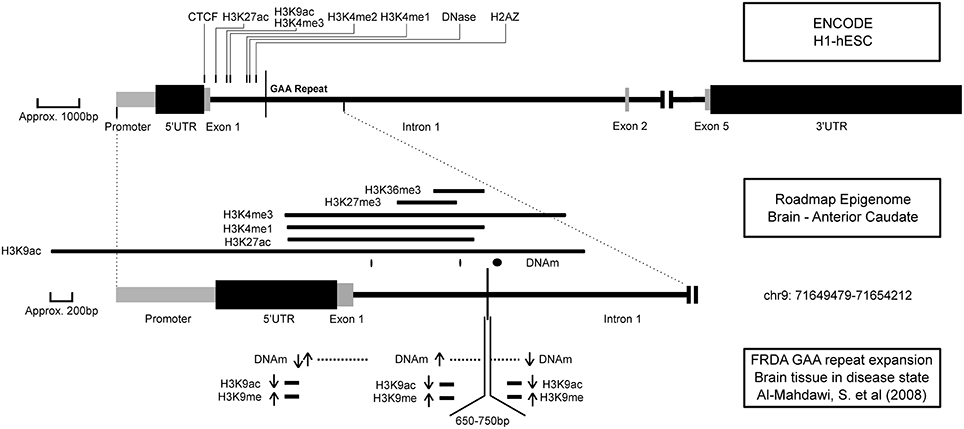
Figure 2. The epigenetic environment of FRDA. A representation of epigenetic marks with their location around the Frataxin gene (NM_000144) across three experimental data sets (named in the right margin). Upper panel: Marks are displayed if they are significantly close to the GAA repeat according to M3. Middle panel: The full-width peaks for each mark around the GAA repeat according to the Roadmap Epigenome for healthy brain tissue. Lower panel: Changes in epigenetic marks as observed in brain tissue, based on differences between normal and diseased state (Al-Mahdawi et al., 2008). Locations where DNAm and histone assays were performed are shown. Arrows indicate a significant increase or decrease in methylation and histone binding at these locations. The size of the GAA repeat expansion in the disease state is also indicated.
The key hypothesis that can be drawn from the above observations is that DA-TNRs are located in an epigenetic environment enriched for markers of open chromatin and active regulation making them susceptible to histone modifications introducing repressive marks, alterations to the chromatin landscape, transcience in methylation state and, ultimately, repeat expansion mutations.
Overall these findings suggest that transcriptionally active regions that harbor repeats may be more prone to DNA mutations thus increasing the propensity of repeats to undergo expansions. For instance, it has been shown that transcriptionally active chromatin recruits homologous recombination at DNA double strand-breaks (Aymard et al., 2014). Homologous recombination is one such mechanism that has been previously suggested to contribute to the expansion of repeats (Zhou et al., 2001).
4.2. Application of Results to a Disease Model
Friedreich ataxia (FRDA) is a loss-of-function disease caused by an expanded intronic GAA repeat in the Frataxin (FXN) gene, and in our analysis it displayed the greatest number of epigenetic marks in its distance profile (see Table 5). Figure 2 indicates the approximate location of these marks as assayed in hESCs and brain tissue, and as observed in disease models, from the data we analyzed and the experimental literature, respectively. The marks from hESCs and brain tissue contribute to an open chromatin environment and indicate a proximal active promoter (Ernst et al., 2011). In combination, they show that epigenetic marks identified as significant in hESCs are also observed near the GAA repeat in a tissue-specific sample including H3K9ac, H3K27ac, H3K4me1, and H3K4me3. An alteration to histone-3, lysine-9, and lysine-27 from acetylation to repressive tri-methylation modifications would cause a transition to a repressive heterochromatic environment (Hahn et al., 2010). In the third set of factors in Figure 2 from diseased brain tissue, the alteration from H3K9ac to H3K9me can be observed. Significant variations in methylation, a loss of H3K9 acetylation and increase in H3K9 methylation around the GAA repeat and 5′ UTR all indicate a repressive heterochromatic environment in the disease state. Based on our statistical analyses of epigenetic marks around the repeat, specific hypotheses can be drawn to address this transition. For example, this is consistent with the findings that suggest that the inhibitors of histone deacetylase increase FXN expression levels (Herman et al., 2006). It would be interesting to assess whether blocking histone methyl transferase to prevent H3K9ac and H3K27ac would promote the stability of the GAA repeat.
5. Conclusion
We note that DA-TNRs are placed in regions ranging from 5′ to 3′ UTR, in exons and introns. While epigenetic states tend to vary widely between such regions and tissues, we have observed consistency of epigenetic states around DA-TNRs that are not associated with bg-TNRs. Since our comparisons are stratified, this consistency of epigenetic state can hypothetically be attributed to the shared biological circumstance–that of expanding under some yet unknown condition.
By using the breadth and depth of DNA and chromatin state data we were able to determine statistical enrichment of epigenetic marks around a repeat expansion locus and to provide qualified support for observations relevant to mechanisms behind repeat expansion itself. However, there are several caveats to what can come out of such analyses. While research has been conducted to investigate the changes in the surrounding genomic context of repeats, how the chromatin structure directly relates to repeat, is still unresolved. Cultured cells and transgenic models provide clues to epigenetic states of repeat expansions, but it is well acknowledged these cells can develop non-physiological epigenetic profiles (Al-Mahdawi et al., 2008). This paper develops a complementary resource for understanding epigenetic states under normal conditions, and a group of methods that when disease tissue becomes available enable the analysis of the epigenetic states linked to repeat instability.
Our statistical analyses brings the scale of epigenetic data offered by recent technologies to bear, to identify a handful of what appear significant epigenetic markers that should be assayed with priority in disease tissues, in particular DNA methylation, H3K4me3, H3K9, and H3K27 acetylation, DNase I hypersensitivity and HDAC. We also note that our analyses support the development of signatures that can be used to identify new repeat loci, with potential to expand.
Author Contributions
AE, PV, and MB collated and evaluated literature data and evidence for DA-TNRs, performed and interpreted analyses. MC, BC, and SB contributed to analyses. AE and MB drafted the manuscript; all authors wrote and approved of the manuscript. SB and MB designed and supervised the study.
Conflict of Interest Statement
The authors declare that the research was conducted in the absence of any commercial or financial relationships that could be construed as a potential conflict of interest.
Acknowledgments
The authors are indebted to Kai Willadsen for collecting data used in this study. This work was supported by the National Health and Medical Research Council (NHMRC) Project grant ID 1004112 and an Australian Research Council (ARC) Future Fellowship (SB). This material is the responsibility of the authors, and does not reflect the views of the NHMRC or the ARC.
Supplementary Material
The Supplementary Material for this article can be found online at: http://journal.frontiersin.org/article/10.3389/fnins.2016.00092
References
Al-Mahdawi, S., Pinto, R. M., Ismail, O., Varshney, D., Lymperi, S., Sandi, C., et al. (2008). The Friedreich ataxia GAA repeat expansion mutation induces comparable epigenetic changes in human and transgenic mouse brain and heart tissues. Hum. Mol. Genet. 17, 735–746. doi: 10.1093/hmg/ddm346
Aymard, F., Bugler, B., Schmidt, C. K., Guillou, E., Caron, P., Briois, S., et al. (2014). Transcriptionally active chromatin recruits homologous recombination at dna double-strand breaks. Nat. Struct. Mol. Biol. 21, 366–374. doi: 10.1038/nsmb.2796
Benson, G. (1999). Tandem repeats finder: a program to analyze DNA sequences. Nucl. Acids Res. 27, 573–580.
Cohen-Carmon, D., and Meshorer, E. (2012). Polyglutamine (polyQ) disorders: the chromatin connection. Nucleus 3, 433–441. doi: 10.4161/nucl.21481
Crawford, G. E., Holt, I. E., Whittle, J., Webb, B. D., Tai, D., Davis, S., et al. (2006). Genome-wide mapping of DNase hypersensitive sites using massively parallel signature sequencing (MPSS). Genome Res. 16, 123–131. doi: 10.1101/gr.4074106
Datta, S., Alam, M. P., Majumdar, S. S., Mehta, A. K., Maiti, S., Wadhwa, N., et al. (2011). Nucleosomal occupancy and CGG repeat expansion: a comparative analysis of triplet repeat region from mouse and human fragile X mental retardation gene 1. Chrom. Res. 19, 445–455. doi: 10.1007/s10577-011-9206-7
Debacker, K., Frizzell, A., Gleeson, O., Kirkham-McCarthy, L., Mertz, T., and Lahue, R. S. (2012). Histone deacetylase complexes promote trinucleotide repeat expansions. PLoS Biol. 10:e1001257. doi: 10.1371/journal.pbio.1001257
Dion, V., and Wilson, J. H. (2009). Instability and chromatin structure of expanded trinucleotide repeats. Trends Genet. 25, 288–297. doi: 10.1016/j.tig.2009.04.007
ENCODE Project Consortium (2012). An integrated encyclopedia of DNA elements in the human genome. Nature 489, 57–74. doi: 10.1038/nature11247
Ernst, J., Kheradpour, P., Mikkelsen, T. S., Shoresh, N., Ward, L. D., Epstein, C. B., et al. (2011). Mapping and analysis of chromatin state dynamics in nine human cell types. Nature 473, 43–49. doi: 10.1038/nature09906
Evans-Galea, M. V., Carrodus, N., Rowley, S. M., Corben, L. A., Tai, G., Saffery, R., et al. (2012). FXN methylation predicts expression and clinical outcome in Friedreich ataxia. Ann. Neurol. 71, 487–497. doi: 10.1002/ana.22671
Gannon, A.-M. M., Frizzell, A., Healy, E., and Lahue, R. S. (2012). Mutsβ and histone deacetylase complexes promote expansions of trinucleotide repeats in human cells. Nucleic Acids Res. 40, 10324–10333. doi: 10.1093/nar/gks810
Giresi, P. G., Kim, J., McDaniell, R. M., Iyer, V. R., and Lieb, J. D. (2007). FAIRE (formaldehyde-assisted isolation of regulatory elements) isolates active regulatory elements from human chromatin. Genome Res. 17, 877–885. doi: 10.1101/gr.5533506
Gorbunova, V., Seluanov, A., Mittelman, D., and Wilson, J. H. (2004). Genome-wide demethylation destabilizes CTG.CAG trinucleotide repeats in mammalian cells. Hum. Mol. Genet. 13, 2979–2989. doi: 10.1093/hmg/ddh317
Hahn, M., Dambacher, S., and Schotta, G. (2010). Heterochromatin dysregulation in human diseases. J. Appl. Physiol. 109, 232–242. doi: 10.1152/japplphysiol.00053.2010
Herman, D., Jenssen, K., Burnett, R., Soragni, E., Perlman, S. L., and Gottesfeld, J. M. (2006). Histone deacetylase inhibitors reverse gene silencing in friedreich's ataxia. Nat. Chem. Biol. 2, 551–558. doi: 10.1038/nchembio815
Johnson, D. S., Mortazavi, A., Myers, R. M., and Wold, B. (2007). Genome-wide mapping of in vivo protein-DNA interactions. Science 316, 1497–1502. doi: 10.1126/science.1141319
Jørgensen, S., Schotta, G., and Sørensen, C. S. (2013). Histone h4 lysine 20 methylation: key player in epigenetic regulation of genomic integrity. Nucl. Acids Res. 41, 2797–2806. doi: 10.1093/nar/gkt012
Koch, C. M., Andrews, R. M., Flicek, P., Dillon, S. C., Clelland, U. G. K., Wilcox, S., et al. (2007). The landscape of histone modifications across 1 of the human genome in five human cell lines. Genome Res. 17, 691–707. doi: 10.1101/gr.5704207
Kovtun, I. V., and McMurray, C. T. (2008). Features of trinucleotide repeat instability in vivo. Cell Res. 18, 198–213. doi: 10.1038/cr.2008.5
Kumari, D., and Usdin, K. (2009). Chromatin remodeling in the noncoding repeat expansion diseases. J. Biol. Chem. 284, 7413–7417. doi: 10.1074/jbc.R800026200
Libby, R. T., Hagerman, K. A., Pineda, V. V., Lau, R., Cho, D. H., Baccam, S. L., et al. (2008). CTCF cis-regulates trinucleotide repeat instability in an epigenetic manner: a novel basis for mutational hot spot determination. PLoS Genet. 4:e1000257. doi: 10.1371/journal.pgen.1000257
Lopez-Castel, A., Cleary, J., and Pearson, C. (2010). Repeat instability as the basis for human diseases and as a potential target for therapy. Nat. Rev. Mol. Cell Biol. 11, 165–170. doi: 10.1038/nrm2854
Nakamori, M., and Thornton, C. (2010). Epigenetic changes and non-coding expanded repeats. Neurobiol. Dis. 39, 21–27. doi: 10.1016/j.nbd.2010.02.004
Nichol, K., and Pearson, C. E. (2002). CpG methylation modifies the genetic stability of cloned repeat sequences. Genome Res. 12, 1246–1256. doi: 10.1101/gr.74502
Roadmap Epigenomics Consortium, Kundaje, A., Meuleman, W., Ernst, J., Bilenky, M., Yen, A., et al. (2015). Integrative analysis of 111 reference human epigenomes. Nature 518, 317–330. doi: 10.1038/nature14248
Robertson, K. D. (2002). DNA methylation and chromatin - unraveling the tangled web. Oncogene 21, 5361–5379. doi: 10.1038/sj.onc.1205609
Soragni, E., Miao, W., Iudicello, M., Jacoby, D., De Mercanti, S., Clerico, M., et al. (2014). Epigenetic therapy for Friedreich ataxia. Ann. Neurol. 76, 489–508. doi: 10.1002/ana.24260
Varley, K. E., Gertz, J., Bowling, K. M., Parker, S. L., Reddy, T. E., Pauli-Behn, F., et al. (2013). Dynamic dna methylation across diverse human cell lines and tissues. Genome Res. 23, 555–567. doi: 10.1101/gr.147942.112
Volle, C. B., and Delaney, S. (2012). CAG/CTG repeats alter the affinity for the histone core and the positioning of dna in the nucleosome. Biochemistry 51, 9814–9825. doi: 10.1021/bi301416v
Willadsen, K., Cao, M. D., Wiles, J., Balasubramanian, S., and Bodén, M. (2013). Repeat-encoded poly-Q tracts show statistical commonalities across species. BMC Genom. 14:76. doi: 10.1186/1471-2164-14-76
Xu, X., Tao, Y., Fu, X., Yu, T., Li, Y., Chen, K., et al. (2014). Zip-seq: genome-wide mapping of trinucleotide repeats at single-base resolution. J. Mol. Cell Biol. 6, 93–96. doi: 10.1093/jmcb/mjt048
Keywords: short tandem repeat, bioinformatics, epigenetics, histone modification, DNA methylation, genome sequence
Citation: Essebier A, Vera Wolf P, Cao MD, Carroll BJ, Balasubramanian S and Bodén M (2016) Statistical Enrichment of Epigenetic States Around Triplet Repeats that Can Undergo Expansions. Front. Neurosci. 10:92. doi: 10.3389/fnins.2016.00092
Received: 09 December 2015; Accepted: 23 February 2016;
Published: 08 March 2016.
Edited by:
Marguerite Evans-Galea, Murdoch Childrens Research Institute, AustraliaReviewed by:
Kyo Yamasu, Saitama University, JapanLaura M. Saba, University of Colorado Denver, USA
Copyright © 2016 Essebier, Vera Wolf, Cao, Carroll, Balasubramanian and Bodén. This is an open-access article distributed under the terms of the Creative Commons Attribution License (CC BY). The use, distribution or reproduction in other forums is permitted, provided the original author(s) or licensor are credited and that the original publication in this journal is cited, in accordance with accepted academic practice. No use, distribution or reproduction is permitted which does not comply with these terms.
*Correspondence: Sureshkumar Balasubramanian, mb.suresh@monash.edu;
Mikael Bodén, m.boden@uq.edu.au