 Xiangzhe Qiu
 Yanjun Zhang*
- Department of Nuclear Medicine, The First Affiliated Hospital of Dalian Medical University, Dalian, China
Recent studies have demonstrated alterations in the topological organization of structural brain networks in diabetes mellitus (DM). However, the DM-related changes in the topological properties in functional brain networks are unexplored so far. We therefore used fluoro-D-glucose positron emission tomography (FDG-PET) data to construct functional brain networks of 73 DM patients and 91 sex- and age-matched normal controls (NCs), followed by a graph theoretical analysis. We found that both DM patients and NCs had a small-world topology in functional brain network. In comparison to the NC group, the DM group was found to have significantly lower small-world index, lower normalized clustering coefficients and higher normalized characteristic path length. Moreover, for diabetic patients, the nodal centrality was significantly reduced in the right rectus, the right cuneus, the left middle occipital gyrus, and the left postcentral gyrus, and it was significantly increased in the orbitofrontal region of the left middle frontal gyrus, the left olfactory region, and the right paracentral lobule. Our results demonstrated that the diabetic brain was associated with disrupted topological organization in the functional PET network, thus providing functional evidence for the abnormalities of brain networks in DM.
Introduction
Diabetes mellitus (DM) has emerged as an important risk factor for cognitive dysfunction and dementia. The observed impairments in cognitive function are hypothesized to be subserved by alterations structure and function in diabetic brain (Mansur et al., 2014). Evidence from previous neuroimaging studies has shown DM-related brain abnormalities, involving global and regional atrophy in frontal, temporal and posterior cortex (Den Heijer et al., 2003; van Elderen et al., 2010; Frøkjaer et al., 2013; Hughes et al., 2013), decreased neuronal activities predominantly in prefrontal and middle temporal gyrus correlated with cognitive dysfunctions (Xia W. et al., 2013; García-Casares et al., 2014a,b), as well as alterations in structural and functional connectivity between different regions (Musen et al., 2012; van Duinkerken et al., 2012; Antenor-Dorsey et al., 2013; Reijmer et al., 2013a; Chen et al., 2015). Recently, a growing number of studies also have provided significant insights into the abnormalities in the functional integration of the entire brain networks (Lyoo et al., 2013; Reijmer et al., 2013b; van Duinkerken et al., 2016). For example, by using cortical thickness (Lyoo et al., 2013) and gray matter volume (van Duinkerken et al., 2016) from magnetic resonance imaging (MRI), studies found that structural brain network was disrupted in type 1 diabetes mellitus (T1DM) patients. Moreover, a study performed diffusion tensor imaging (DTI) and also found damage to the brain white matter network in type 2 diabetes mellitus (T2DM) patients, which was related to slowing of information processing speed (Reijmer et al., 2013b). Network-based measures can be more sensitive to alterations that are not apparent in specific regions because they consider each region's integration into the global unit rather than as an independent entity (Brown et al., 2011). Therefore, studies of the brain network using neuroimaging technology may provide a new approach for the diagnosis and treatment of this disease.
As a conventional functional imaging technology, fluoro-D-glucose positron emission tomography (FDG-PET) can reflect brain activity by detecting changes in the brain glucose metabolism (Sokoloff, 1981; Jueptner and Weiller, 1995), which is different from other types of imaging modality. With respect to DM, several studies have found reduced cerebral glucose metabolism primarily in frontal an temporal regions (Baker et al., 2011; García-Casares et al., 2014a,b; Roberts et al., 2014). Meanwhile, previous studies have suggested that inter-subject correlations of metabolic rates are capable of reflecting functional relationships between regions (Horwitz et al., 1984, 1987; Di et al., 2012; Morbelli et al., 2013). And on this basis, recent studies have constructed functional networks of the human brain from FDG-PET data and further characterized by using graph theoretical approaches (Sanabria-Diaz et al., 2013; Seo et al., 2013; Kim et al., 2015; Yao et al., 2015). Through these approaches, metabolic networks of human brain have been consistently found to have a “small-world” topology, characterized by a high cluster coefficient like a regular network and small path length like a random network (Watts et al., 1998).
Given the existence of metabolic abnormalities in specific brain regions (Baker et al., 2011; Roberts et al., 2014) as well as disruption of structural brain networks in DM patients, it is plausible that the abnormalities of whole brain functional network in DM may be observed by using FDG-PET technique. However, to our knowledge, the DM-related changes in the topological properties in functional network based on FDG-PET data are unexplored so far. Thus, we used graph theoretical analysis and FDG-PET technique to investigate the hypothesis that the topological properties of brain functional network in DM is disrupted. First, we assessed the small-world topology of each network. Second, we investigated the topological parameters of the functional networks (small-world index, normalized clustering coefficient, and normalized characteristic path length) at different connection densities. Finally, we observed the hub regions and evaluated the statistical differences in nodal centrality between the DM and NC groups.
Data and Methods
Subjects
This was a retrospective analysis and all subjects were selected from a data pool in the PET Center of the First Affiliated Hospital of Dalian Medical University. A total of 73 diabetic patients (54 males, 19 females) with a mean age of 57 ± 10 years, and 91 normal individuals (66 males, 25 females) with a mean age of 56 ± 8 years, were selected into this study (Table 1). The subjects met the following criteria: (1) All diabetic patients met the diagnosis proposed by the World Health Organization 1999 (Alberti and Zimmet, 1998) and these patients had peripheral blood glucose levels of >7.0 mmol/L; (2) Most of the normal individuals in the normal control group were individuals recruited during routine health checks. They had no history of diabetes, and their peripheral blood glucose levels were 4.1–5.5 mmol/L; (3) All subjects had no metabolic diseases such as hyperthyroidism or hypothyroidism; (4) All subjects had no prior stroke, transient ischemic attack, epilepsy, headache, brain trauma, mental illness, or carbon monoxide poisoning; (5) All subjects had no severe heart, liver, spleen, pancreas, or kidney diseases; (6) All subjects had no history of heavy drinking; (7) All subjects had no estrogen replacement therapy for postmenopausal women; (8) All subjects had no prior chemotherapy or radiotherapy in the head or neck. Additionally, this study was approved by the Institutional Review Board of the First Affiliated Hospital of Dalian Medical University.
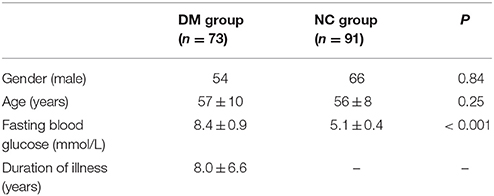
Table 1. Demographic and clinical data of the subjects.
Acquisition of PET Data
The Eclipse RD cyclotron (Siemens AG, Germany) and FDG synthesis device (Siemens ExploraFDG4, Germany) were used to synthesize 18F-FDG, and the resulting radiochemical purity was >95%. All of the subjects were asked to fast at least 6 h before the exam, rested for 15 min in a dark, quiet environment, and received intravenous FDG 0.15 mCi/kg via the cubital vein. Afterward, the subjects continued to rest for 40–50 min and then underwent head PET scans for 3 min. The PET scanner used was a Siemens Biograph 64 HD PET/CT (Siemens AG, Germany), and the spatial resolution of the scanner is 4.2 mm full width at half maximum (FWHM) in axial, sagittal or coronal plane. The PET scan used the 3-dimensional (3D) mode.
Data Preprocessing
Image format conversion, spatial normalization, and smoothing were performed during data processing using the MATLAB platform-based SPM8 software. Spatial normalization was performed using the standard template of the Montreal Neurological Institute, and smoothing was performed using an isotropic Gaussian kernel with an 8 mm full width at half maximum to increase the signal-to-noise ratio (Liu et al., 2014).
Construction of Brain Functional PET Network
In graph theory analysis, the network consists of many nodes and edges that connect the nodes (Rubinov and Sporns, 2010). In this study, we employed anatomically automatic labeled (AAL) to divide the cortex into 90 regions of interest (ROIs; 45 in each hemisphere except cerebellum) represented nodes, which has been broadly used in many structural and functional brain network studies (Yan et al., 2011; Sanabria-Diaz et al., 2013; Wang et al., 2014). The names of the ROIs and their abbreviations are listed in Table 2. The mean glucose metabolism value of each ROI was used to construct functional network. Before performing a correlation analysis, we normalized the mean glucose metabolism value of each ROI (i.e., we divided the mean glucose metabolism value of each ROI by that of the whole brain), and we then used a linear regression model to control for age, gender, and the effect of blood glucose on the local glucose metabolism. The resulting regression residual was used to substitute the local glucose metabolism value for a Pearson correlation analysis to construct the inter-regional correlation matrix for glucose metabolism. It is also noteworthy that the correlation was calculated across subjects in each group and one network was obtained for each group. This method has been employed in other functional brain network studies (Sanabria-Diaz et al., 2013; Liu et al., 2014).
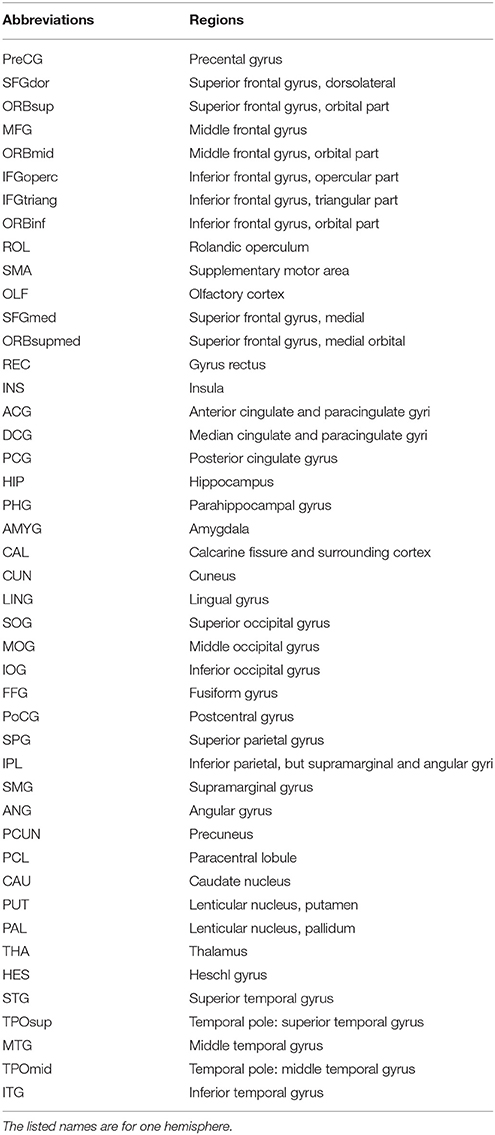
Table 2. Anatomical parcellation defined by automated anatomical labeling atlas and abbreviations for the regions of interest (ROIs).
Graph Theory Analysis of Brain Functional PET Network
We converted the inter-regional correlation coefficient matrix into a binary matrix: in the 90 × 90 correlation coefficient matrix, if the absolute value of the correlation coefficient was above a certain threshold, there was a connection (assigned “1”); otherwise, there was no connection (assigned “0”; Liu et al., 2014; Kim et al., 2015). Currently, researchers have no consensus about how to choose a fixed threshold, we therefore threshold each correlation matrix over a wide range of density (10–40% with a 1% increment), then estimated the properties of the resulting graphs at each threshold value. In present study, the lowest density where the largest component size was 90 was density 10%. The range of density bigger than 10% also ensured that every nodal pairs in both graphs had a connecting path and minimizing the number of false-positive paths (Liu et al., 2014). It also can characterize the network with continuous weighting between nodes, but this will lead to complicated descriptions of statistical features in graph theoretical analysis (He et al., 2007). Therefore, this study used binarized networks to a relatively simpler statistical features descriptions.
Cluster Coefficient
The parameter cluster coefficient C reflects the extent of network clustering (Watts et al., 1998; Sporns et al., 2004). The value of the cluster coefficient Ci of node i was the ratio of the number of actual connecting edges ei between the node and neighboring nodes to the maximum possible number of connecting edges. The mean cluster coefficient of all the nodes in the network was the cluster coefficient C of the network, which was calculated using the following formula:
Note: ki is the number of neighboring nodes of node i.
Characteristic Path Length
The shortest path length depicted the optimal path for the information in one node to reach another node in the network. Information was transmitted faster via the shortest path, thus saving system resources (Latora and Marchiori, 2001). The path between nodes i and j with the smallest number of edges was the shortest path between two nodes, and the number of edges in the path was the shortest path length Lij between nodes i and j. The characteristic path length of the network described the mean shortest path length between any two nodes of the network, which was calculated using the following formula:
“Small-World” Network
Studies have shown that regular networks have a larger cluster coefficient and a longer characteristic path length, while random networks have a smaller cluster coefficient and a shorter characteristic path length (Watts et al., 1998). In-between networks have a relatively large cluster coefficient similar to that of regular networks, and a relatively short characteristic path length similar to that of random networks. In other words, these in-between networks combine the benefits of regular networks and random networks, thus ensuring the efficiency of local and global information transmission. Therefore, these networks with a large cluster coefficient and a short characteristic path length are known as “small-world” networks. To quantify the “small-world” characteristics of these networks, a random network was used as a reference. If the network being studied has a larger cluster coefficient and an approximate shortest path length relative to the random network (normalized clustering coefficient , normalized characteristic path length where the subscript “random” represents a random network and “real” represents a real network), then the network is a “small-world” network. Some researchers have proposed unifying the two metrics into one (σ), and the small-world index σ = γ/λ is used to measure the “small-world” characteristics of the network (Achard, 2006; Humphries et al., 2006). The random network and the corresponding network have the same number of nodes, average degree and degree distribution (Sanabria-Diaz et al., 2010).
Betweenness Centrality
The betweenness centrality defines the centrality of nodes from the perspective of information flow (Freeman, 1977). For any node i in the network, its betweenness centrality B(i) was calculated with the following formula:
where njk is the number of all shortest paths from node j to node k, and njk(i) is the number of shortest paths that go through node i. We used bi = B(i)/B to normalize B(i), where B represents the mean betweenness centrality of all the nodes in the network. When normalized betweenness (bi) is >1.5, node i represents the hub region in the network (Melie-García et al., 2013).
In this study, both the global and nodal parameters were computed by using software packages of GRETNA (Wang et al., 2015).
Statistical Analysis
1. Statistics of the differences in gender, age and blood glucose between the two groups: A two-sample T-test was performed to analyze the difference in age and blood glucose between the two groups, and a chi-square test was performed to analyze the difference in gender between the two groups. No significant difference in gender and age between the two groups was detected (Table 1).
2. Statistics of the difference between the network parameters: We used a non-parametric test to determine whether the difference in the brain network parameters was significant between the diabetic group and the normal group. (1) At different density thresholds, we calculated the normalized cluster coefficient γ, the normalized characteristic path length λ, the small-world index σ, and the betweenness centrality B(i) of each group; (2) assuming that the difference in each network parameter between the two groups was due to randomization, we randomly assigned the two groups of subjects again to form two new groups, and we calculated the correlation coefficient matrix, re-constructed two brain networks, and calculated each parameter for the two networks using different density thresholds; (3) we repeated the randomization, constructed new networks, and calculated the network parameters 1000 times to obtain the distribution of the inter-group differences in the network parameters under different thresholds; (4) we used the 95 percentile points of the distribution as the critical values for one-tailed to analyze whether the null hypothesis with a probability of type I error of 0.05. If the null hypothesis was rejected, then the inter-group difference in the brain network parameters was significant (He et al., 2008).
Results
Changed Cerebral Glucose Metabolism in DM Patients
After controlling for the effect of age, gender, and glucose level, the local brain glucose metabolism rate of the DM group was significantly lower than that of the NC group (Table 3, Figure 1), and there were no significant higher metabolism regions in DM group compared with NC group (P < 0.001, uncorrected). Overall, the DM group presented reduced cerebral glucose metabolism in several frontal and temporal brain areas, which was coherent with the previous studies (Baker et al., 2011; García-Casares et al., 2014a,b; Roberts et al., 2014).
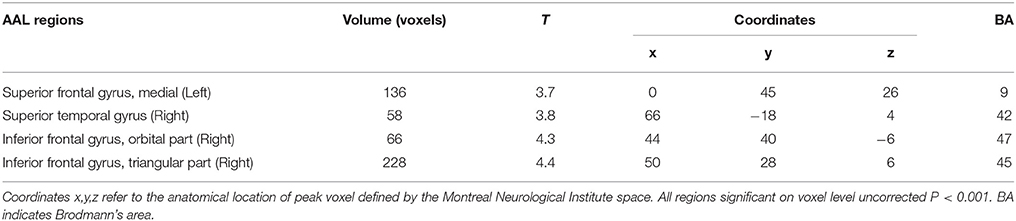
Table 3. The decreased glucose metabolism regions in DM (P < 0.001, uncorrected).
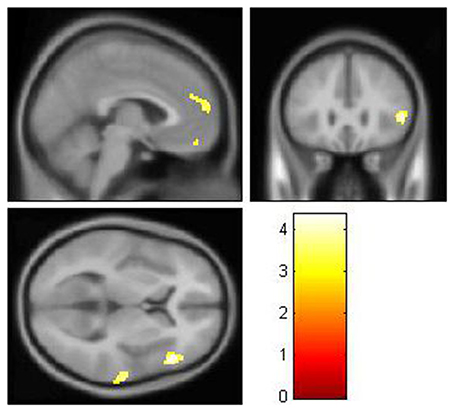
Figure 1. The decreased glucose metabolism regions in DM (P < 0.001, uncorrected). The cluster size >50 voxels. The color bar indicates the T-value. Small-world topology of the functional networksThe brain functional networks of both the DM group and the NC group had the characteristics of “small-world” networks (σ > 1). For example, at all of the density thresholds, both networks had a large normalized cluster coefficient (γ >> 1) and a normalized characteristic path length close to 1 (λ ~ 1; Figure 2).
Small-World Topology of the Functional Networks
The brain functional networks of both the DM group and the NC group had the characteristics of “small-world” networks (σ > 1). For example, at all of the density thresholds, both networks had a large normalized cluster coefficient (γ >> 1) and a normalized characteristic path length close to 1 (λ ~ 1; Figure 2).
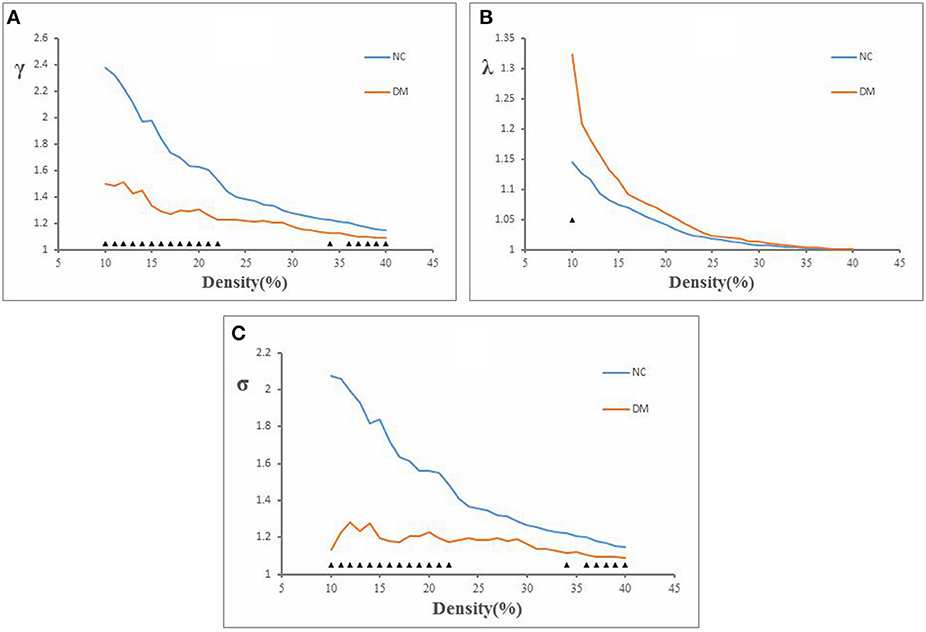
Figure 2. Normalized cluster coefficient (γ), normalized characteristic path length (λ), and small-world index (σ) in DM and NC. (A) The γ from NC and DM. p < 0.05 for DM vs. NC (significant at 10–23, 34, and 36–40%). (B) The λ from NC and DM. p < 0.05 for DM vs. NC (significant at 10%). (C) The σ from NC and DM. p < 0.05 for DM vs. NC (significant at 10–23, 34, and 36–40%).
Altered Small-World Parameters in DM Patients
This study showed that the normalized clustering coefficient γ was significantly smaller in the DM group than in the NC group (density thresholds: 10–22, 34, 36–40%; Figure 2A), the normalized characteristic path length λ was significantly longer in the DM group than in the NC group (density threshold: 10%; Figure 2B), and the small-world index σ was significantly smaller in the DM group than in the NC group (density thresholds: 10–22, 34, 36–40%; Figure 2C) (P < 0.05).
The Distribution of the Hub Regions and Altered Nodal Centrality in DM Patients
To explore the nodal centrality, the functional networks were constructed at a fixed density threshold of 10%, which ensures that all regions were included in the functional networks and minimizing the number of false-positive paths. Furthermore, such a fixed constraint might optimize interregional correlation strengths and therefore be biologically plausible (Bassett and Bullmore, 2006; He et al., 2008).
To identify the hub regions, we measured the normalized betweenness centrality in both networks (see Section Data and Methods). The DM had 21 hub regions (Table 4), and the NC had 19 (Table 5). The two groups shared five hub regions (Figures 3A,B). We used a 1000 non-parametric permutation test and obtained seven hub regions with significant differences between the DM patients and NCs (P < 0.05; Figure 3C). In addition, given that it is no reason to say that there are hub shifts between groups if normalized betweenness centrality distribution are highly correlated between the two groups, we therefore have verified that the normalized betweenness centrality distribution between the two groups are no significantly correlated (R = −0.03, P = 0.77). Compared with NCs, the centrality was significantly reduced in four brain regions: the right rectus, the right cuneus, the left middle occipital gyrus, and the left postcentral gyrus, and it was significantly increased in three brain regions: the orbitofrontal region of the left middle frontal gyrus, the left olfactory region, and the right paracentral lobule in the diabetic patients.
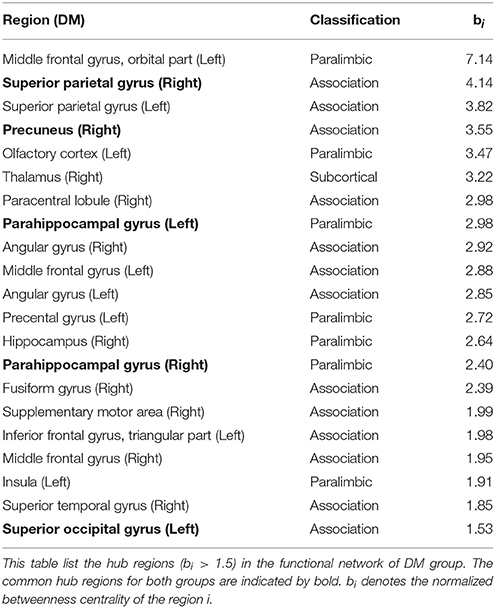
Table 4. The hubs of functional network in DM group.
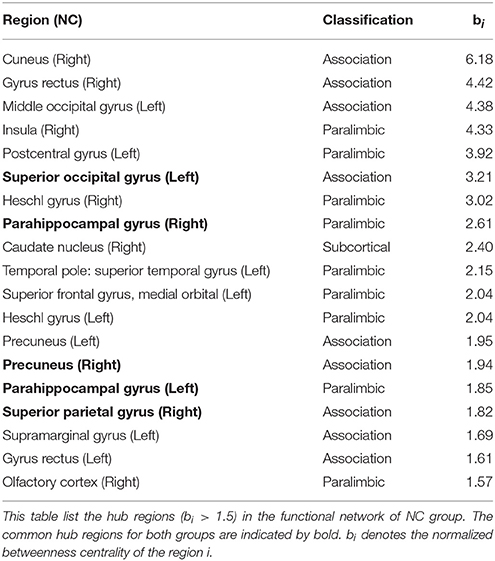
Table 5. The hubs of functional network in NC group.
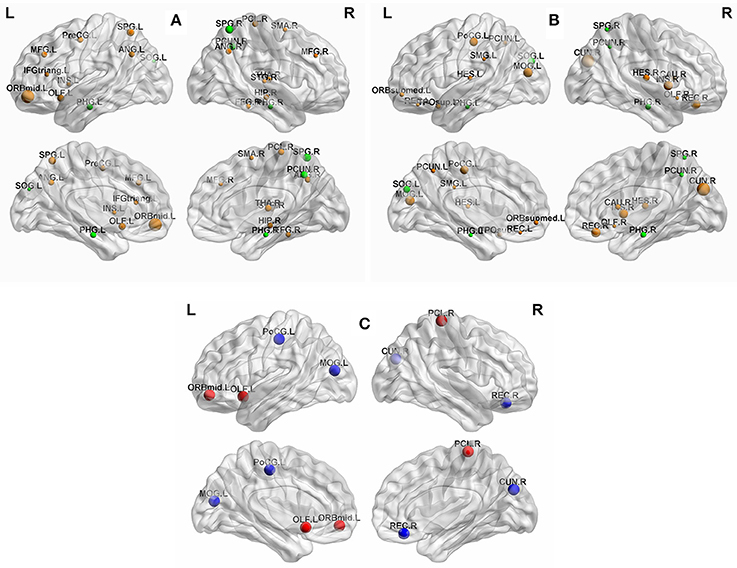
Figure 3. (A) The hub regions in DM. (B) The hub regions in NC. (C) Differences of between-group betweenness centrality in DM and NC (p < 0.05). The green spheres are represented the common hub regions. The sphere diameter denotes normalized betweenness centrality (bi), in this case bi > 1.5. The blue spheres represent betweenness centrality with significant decreases (four hub regions) and the red spheres represent betweenness centrality with significant increases (three hub regions) in DM compared with NC. The fixed density threshold value was 10%. Hubs were visualized with the BrainNet Viewer (http://www.nitrc.org/projects/bnv; Xia M. et al., 2013).
Discussion
Because the local glucose metabolism rate is a possible contributing factor in DM-related functional network, we first showed the reduced glucose metabolism rate in DM group, which is similar to previous findings. Then we focused to demonstrate alterations in the topological organization of functional brain networks in DM patient by using FDG-PET data. Our main findings included the following: (1) Both DM patients and NCs had a small-world topology in functional brain network; (2) The DM group was found to have significantly lower small-world index, lower normalized clustering coefficients, and higher normalized characteristic path length compared with NC group; (3) The spatial distribution of hub regions and nodal centrality were changed in DM group.
Small-World Properties of the Functional Networks
Our results showed that brain functional network of both DM patients and NCs had a small-world properties, which was consistent with many studies of brain structural and functional network constructed from MRI, EEG, and FDG-PET data (He et al., 2008; de Haan et al., 2009; Lo et al., 2010; Sanz-Arigita et al., 2010; Sanabria-Diaz et al., 2013; Liu et al., 2014; Kim et al., 2015). In particular, other PET studies have reported that the human brain functional PET networks of both normal individuals and patients with certain diseases (such as AD and MCI) fit the characteristics of small-world network (Sanabria-Diaz et al., 2013; Seo et al., 2013; Hu et al., 2014; Kim et al., 2015). Unlike regular network or random network, a small-world network is an optimized network for information separation and integration (Bullmore and Sporns, 2009). In this study, the brain functional network of diabetic patients also showed small-world property, suggesting that even in human brains afflicted with certain diseases (such as AD and MCI in other studies), a relatively efficient network was maintained in order to meet the needs of daily activities (Zhao et al., 2012).
Changed in the Small-World Parameters in DM Patients
Although functional PET network in diabetic patients preserved small-world characteristics, several network parameters (γ, λ, σ) were found to be significantly changed. We showed that DM group had significantly lower normalized clustering coefficients and higher normalized characteristic path length as compared with NC group (Figure 2). The cluster coefficient reflected the local efficiency and fault tolerance of the network (Strogatz, 2001). The normalized clustering coefficients of brain functional network was found to be lower in DM patients, indicating that these patients have a reduced ability for local information processing and a lower processing efficiency. Given that short path length ensures the effective integration and prompt transfers of information between distant brain areas (Sporns and Zwi, 2004), our finding of increased normalized characteristic path length in DM network indicated a slower inter-regional information integration and long-distance information transfer in diabetic patients. Our result in functional brain networks were conformed to a recent study about structural brain networks by using DTI data, in which the diabetic group showed significantly lower clustering coefficient and higher characteristic path length compared with control group (Reijmer et al., 2013b). The similar finding in structural and functional brain network analysis may suggest that DM-related alterations in cortical functional networks can be related to structural impairments. Additionally, DM has emerged as an important risk factor for cognitive dysfunction (McCrimmon et al., 2012). Human cognitive $precessing are believed to be built up on a basis of information interactions between interconnected brain regions (Horwitz, 2003; Sporns, 2011). Therefore, the disrupted topological properties in functional network may also contribute to DM-related cognitive impairment.
The Distribution of the Hub Regions in DM Patients and NCS
We also used the betweenness centrality to define important hub regions of the brain network. In this study, if the centrality of a node was 1.5-fold higher than the mean centrality of all of the nodes in the network (Melie-García et al., 2013), the region represented by the node was considered a hub region in the functional network. Figures 3A,B showed hub regions in diabetic patients and normal individuals. We found that 95.2% (20/21) DM hubs (Table 4) and 94.7% (18/19) NC hubs (Table 5) were localized in association and paralimbic regions. Association and paralimbic regions are divided out from the cerebral cortex by using a functional rather than strictly cytoarchitectonic approach (Mesulam, 2000). Studies have shown that association areas help to maintain the integrity of multifunction systems, such as memory and attention, and their function mainly involves intelligence information processing and maintaining advanced mental activities, while paralimbic areas are highly correlated with the prefrontal lobe and many subcortical regions, which are intricately involved in emotions and states of consciousness (Mesulam, 1998; Liu et al., 2014). This result is in line with previous studies that association and paralimbic cortices regions tend to be hubs of brain structural and functional network (He et al., 2008; Tian et al., 2011; Yan et al., 2011; Hu et al., 2014). Meanwhile, five brain regions were identified as the common hubs for both groups, which may indicate that DM poses little impact on these hub regions.
Altered Nodal Centrality in DM Patients
Our analysis showed that the regions with significant reduced centrality were located in the right rectus, the right cuneus, the left middle occipital gyrus, and the left postcentral gyrus in diabetic patients (P < 0.05; Figure 3C, blue sphere area), all of which in present study were found as hub regions in NC group. These hub regions have been reported to be related to DM outcomes in previous neuroimaging studies of the brain structure and function (Cui et al., 2014; Marzelli et al., 2014; Zhang et al., 2014). Cui et al. showed, in their fMRI study, that neural activity was reduced in the cuneus, the middle occipital gyrus, and the postcentral gyrus in DM patients, while changes in neural activity in the cuneus and the postcentral gyrus were associated with cognitive impairment (Cui et al., 2014). Zhang et al. found that DM patients, with or without cognitive impairment, had atrophy of the middle occipital gyrus (Zhang et al., 2014). Matthew et al. found that in DM patients, rectus atrophy was associated with the disease course of diabetes (Marzelli et al., 2014). Several other studies have also reported that disruption of these regions involved in many essential functions were associated with behavioral and cognitive brain functioning. The cuneus is involved in basic visual information processing (Beason-Held et al., 1998; Slotnick and Schacter, 2006). Neural abnormalities in the cuneus were thought to have contributed to poor performance on related cognitive tests (Cui et al., 2014). The middle occipital gyrus is the secondary visual cortex that is involved in the visual spatial and visual perceptive functions (Schurz et al., 2013; Tu et al., 2013), while the postcentral gyrus is part of the primary motor cortex. The decreased of neural activity in the occipital region and postcentral gyrus were found to be associated with visual impairment (Xia W. et al., 2013) and sensory loss (Luo et al., 2012), respectively. The rectus was thought to be part of a circuit that mediates some specific emotional functions in humans (Andreasen et al., 1995). Thus, the observed features from the network models of brain function were consistent with and supportive of the findings from other researches.
The altered hub regions in NC presented structural and functional abnormalities in DM from the above evidence indicated that DM targets some important regions that could disturb the normal functional network. This finding supports the viewpoint that the high level of centrality of hubs makes them points of vulnerability that are susceptible to dysfunction in brain disorders (van den Heuvel and Sporns, 2013), which may be potential pathological mechanism that disrupts the properties of functional brain network in DM. In addition, it should be noted that betweenness centrality as a local property integrates the global information of whole network. The regions of reduced centrality didn't overlap with that of hypometabolism in DM in present study indicated that the disturbances of hub regions may not be explained entirely by structural and functional abnormalities in specific brain regions. Therefore, the mechanism of the normalization betweenness centrality variation correlated to structural and functional changes is very complicated and deserves a detailed study.
Moreover, our results showed that compared with normal individuals, the nodal centrality was significantly increased in the orbitofrontal region of the left middle frontal gyrus, the left olfactory region, and the right paracentral lobule in DM patients (P < 0.05; Figure 3C, red sphere area). The betweenness centrality was defined as the centrality of the node from the perspective of information flow. Thus, the increased in centrality of these hub regions may be a compensatory mechanism for the decrease in centrality of other regions in the process of information exchange (Tijms et al., 2013). That is, the degeneration of some hub regions may also lead to an increased betweenness centrality in other regions (van den Heuvel and Sporns, 2013). To our knowledge, this study was the first base on FDG-PET data to identify hub regions with significant differences in the betweenness centrality between DM patients and NCs. However, more research is needed to confirm whether these changes are also present in other structural and functional networks.
This study has some limitations. First, the results could not survive when we adopted Family-wise Error (FWE) or False Discovery Rate (FDR) to adjust for multiple comparisons. To increase the statistical power, a larger sample size is needed. Second, given that most relevant studies employed AAL-90 template to define the nodes, we also used the same template in order to allow better comparison with previous results. It should be note that AAL-90 atlas is a structure template which do not include the cerebellum, and it may not be appropriate for studying brain functions. Future studies should therefore validate these findings by using other functional parcellations such as Power-264 (Power et al., 2011). Third, partial volume correction was not used in this study, therefore the results may in part reflect structural variation due to DM or other etiology. Fourth, because recent evidence suggests that anticorrelation might have special importance for understanding brain dysfunction in mental illness (Whitfield-Gabrieli and Ford, 2012; Buckner et al., 2013), we used absolute threshold value to binarize the matrix and did not separate the anticorrelation in our study. However, owing to the way PET data are typically normalized (dividing regional values by the global values), the anticorrelation is likely to be introduced (Murphy et al., 2009), which may make the complete interpretation of the sign of correlation more difficult. Thus, new strategies for processing PET data is required to be further study to mitigate the specific issue of normalization. Lastly, the lack of objective and specific neurocognitive assessment limited our interpretation of the results. Thus, further work should be conducted to investigate whether the functional network abnormalities is associated with the trajectories from normal cognition to dementia in diabetes, even in prediabetic stages, which will help to increase understanding of the DM-related cognitive decline.
Conclusion
We have investigated the topological properties of human brain functional networks in DM patients using FDG PET and graph theory analysis. Our result indicated that diabetic brain was related to disrupted topological organization in the functional PET network, which was also compatible with a recent study of brain structural networks. Specifically, we found that the DM patients had significantly reduced nodal centrality of several brain regions. Thus, our findings provided the functional evidence for abnormalities of brain networks in DM.
Author Contributions
Conceived and designed the experiments: XQ, YZ. Performed the experiments: XQ, HF, and DJ. Analyzed the data: XQ, HF, and DJ. Wrote the paper: XQ, YZ.
Conflict of Interest Statement
The authors declare that the research was conducted in the absence of any commercial or financial relationships that could be construed as a potential conflict of interest.
References
Achard, S. (2006). A resilient, low-frequency, small-world human brain functional network with highly connected association cortical hubs. J. Neurosci. 26, 63–72. doi: 10.1523/JNEUROSCI.3874-05.2006
Alberti, K. G., and Zimmet, P. Z. (1998). Definition, diagnosis and classification of diabetes mellitus and its complications. Part 1: diagnosis and classification of diabetes mellitus provisional report of a WHO consultation. Diabet. Med. 15, 539–553.
Andreasen, N. C., O'Leary, D. S., Cizadlo, T., Arndt, S., Rezai, K., Watkins, G. L., et al. (1995). Remembering the past: two facets of episodic memory explored with positron emission tomography. Am. J. Psychiatry 152, 1576–1585.
Antenor-Dorsey, J. A. V., Meyer, E., Rutlin, J., Perantie, D. C., White, N. H., Arbelaez, A. M., et al. (2013). White matter microstructural integrity in youth with type 1 diabetes. Diabetes 62, 581–589. doi: 10.2337/db12-0696
Baker, L. D., Cross, D., Minoshima, S., Belongia, D., Stennis, G., and Craft, S. (2011). Insulin resistance is associated with Alzheimer-like reductions in regional cerebral glucose metabolism for cognitively normal adults with prediabetes or early type 2 diabetes. Arch. Neurol. 68, 51–57. doi: 10.1001/archneurol.2010.225
Bassett, D. S., and Bullmore, E. (2006). Small-world brain networks. Neuroscientist 12, 512–523. doi: 10.1177/1073858406293182
Beason-Held, L. L., Purpura, K. P., Krasuski, J. S., Maisog, J. M., Daly, E. M., Mangot, D. J., et al. (1998). Cortical regions involved in visual texture perception: a fMRI study. Cogn. Brain Res. 7, 111–118. doi: 10.1016/S0926-6410(98)00015-9
Brown, J., A., Terashima, K. H., Burggren, A. C., Ercoli, L. M., Miller, K. J., Small, G. W., et al. (2011). Brain network local interconnectivity loss in aging APOE-4 allele carriers. Proc. Natl. Acad. Sci. U.S.A. 108, 20760–20765. doi: 10.1073/pnas.1109038108
Buckner, R. L., Krienen, F. M., and Yeo, B. T. T. (2013). Opportunities and limitations of intrinsic functional connectivity MRI. Nat. Publ. Gr. 16, 832–837. doi: 10.1038/nn.3423
Bullmore, E., and Sporns, O. (2009). Complex brain networks: graph theoretical analysis of structural and functional systems. Nat. Rev. Neurosci. 10, 186–198. doi: 10.1038/nrn2575
Chen, Y.-C., Xia, W., Qian, C., Ding, J., Ju, S., and Teng, G.-J. (2015). Thalamic resting-state functional connectivity: disruption in patients with type 2 diabetes. Metab. Brain Dis. 30, 1227–1236. doi: 10.1007/s11011-015-9700-2
Cui, Y., Jiao, Y., Chen, Y.-C., Wang, K., Gao, B., Wen, S., et al. (2014). Altered spontaneous brain activity in type 2 diabetes: a resting-state functional MRI study. Diabetes 63, 749–760. doi: 10.2337/db13-0519
de Haan, W., Pijnenburg, Y. A. L., Strijers, R. L. M., van der Made, Y., van der Flier, W. M., Scheltens, P., et al. (2009). Functional neural network analysis in frontotemporal dementia and Alzheimer's disease using EEG and graph theory. BMC Neurosci. 10:101. doi: 10.1186/1471-2202-10-101
Den Heijer, T., Vermeer, S. E., Van Dijk, E. J., Prins, N. D., Koudstaal, P. J., Hofman, A., et al. (2003). Type 2 diabetes and atrophy of medial temporal lobe structures on brain MRI. Diabetologia 46, 1604–1610. doi: 10.1007/s00125-003-1235-0
Di, X., and Biswal, B. B., and Alzheimer's Disease Neu. (2012). Metabolic brain covariant networks as revealed by fdg-pet with reference to resting-state fmri networks. Brain Connect. 2, 275–283. doi: 10.1089/brain.2012.0086
Freeman, L. C. (1977). A set of measures of centrality based on betweenness. Sociometry 40, 35. doi: 10.2307/3033543
Frøkjaer, J. B., Brock, C., Søfteland, E., Dimcevski, G., Gregersen, H., Simrén, M., et al. (2013). Macrostructural brain changes in patients with longstanding type 1 diabetes mellitus - a cortical thickness analysis study. Exp. Clin. Endocrinol. Diabetes 121, 354–360. doi: 10.1055/s-0033-1345120
García-Casares, N., Berthier, M. L., Jorge, R. E., Gonzalez-Alegre, P., Gutiérrez Cardo, A., Rioja Villodres, J., et al. (2014a). Structural and functional brain changes in middle-aged type 2 diabetic patients: a cross-sectional study. J. Alzheimers Dis. 40, 375–386. doi: 10.3233/JAD-131736
García-Casares, N., Jorge, R. E., García-Arnés, J. A., Acion, L., Berthier, M. L., Gonzalez-Alegre, P., et al. (2014b). Cognitive dysfunctions in middle-aged type 2 diabetic patients and neuroimaging correlations: a cross-sectional study. J. Alzheimers Dis. 42, 1337–1346. doi: 10.3233/JAD-140702
He, Y., Chen, Z., and Evans, A. (2008). Structural insights into aberrant topological patterns of large-scale cortical networks in Alzheimer's disease. J. Neurosci. 28, 4756–4766. doi: 10.1523/JNEUROSCI.0141-08.2008
He, Y., Chen, Z. J., and Evans, A. C. (2007). Small-world anatomical networks in the human brain revealed by cortical thickness from MRI. Cereb. Cortex 17, 2407–2419. doi: 10.1093/cercor/bhl149
Horwitz, B. (2003). The elusive concept of brain connectivity. Neuroimage 19, 466–470. doi: 10.1016/S1053-8119(03)00112-5
Horwitz, B., Duara, R., and Rapoport, S. I. (1984). Intercorrelations of glucose metabolic rates between brain regions: application to healthy males in a state of reduced sensory input. J. Cereb. Blood Flow Metab. 4, 484–499. doi: 10.1038/jcbfm.1984.73
Horwitz, B., Grady, C. L., Schlageter, N. L., Duara, R., and Rapoport, S. I. (1987). Intercorrelations of regional cerebral glucose metabolic rates in Alzheimer's disease. Brain Res. 407, 294–306. doi: 10.1016/0006-8993(87)91107-3
Hu, Y., Xu, Q., Shen, J., Li, K., Zhu, H., Zhang, Z., et al. (2014). Small-worldness and gender differences of large scale brain metabolic covariance networks in young adults: a FDG PET study of 400 subjects. Acta Radiol. 56, 204–213. doi: 10.1177/0284185114529106
Hughes, T. M., Ryan, C. M., Aizenstein, H. J., Nunley, K., Gianaros, P. J., Miller, R., et al. (2013). Frontal gray matter atrophy in middle aged adults with type 1 diabetes is independent of cardiovascular risk factors and diabetes complications. J. Diabetes Complications 27, 558–564. doi: 10.1016/j.jdiacomp.2013.07.001
Humphries, M., Gurney, K., and Prescott, T. (2006). The brainstem reticular formation is a small-world, not scale-free, network. Proc. R. Soc. B Biol. Sci. 273, 503–511. doi: 10.1098/rspb.2005.3354
Jueptner, M., and Weiller, C. (1995). Review: does measurement of regional cerebral blood flow reflect synaptic activity? Implications for PET and fMRI. Neuroimage 2, 148–156. doi: 10.1006/nimg.1995.1017
Kim, J., Chey, J., Kim, S.-E., and Kim, H. (2015). The effect of education on regional brain metabolism and its functional connectivity in an aged population utilizing positron emission tomography. Neurosci. Res. 94, 50–61. doi: 10.1016/j.neures.2014.12.009
Latora, V., and Marchiori, M. (2001). Efficient behavior of small-world networks. Phys. Rev. Lett. 87:198701. doi: 10.1103/PhysRevLett.87.198701
Liu, Z., Ke, L., Liu, H., Huang, W., and Hu, Z. (2014). Changes in topological organization of functional PET brain network with normal aging. PLoS ONE 9:e88690. doi: 10.1371/journal.pone.0088690
Lo, C.-Y., Wang, P.-N., Chou, K.-H., Wang, J., He, Y., and Lin, C.-P. (2010). Diffusion tensor tractography reveals abnormal topological organization in structural cortical networks in Alzheimer's disease. J. Neurosci. 30, 16876–16885. doi: 10.1523/JNEUROSCI.4136-10.2010
Luo, C., Chen, Q., Huang, R., Chen, X., Chen, K., Huang, X., et al. (2012). Patterns of spontaneous brain activity in amyotrophic lateral sclerosis: a resting-state {fMRI} study. PLoS ONE 7:e45470. doi: 10.1371/journal.pone.0045470
Lyoo, I. K., Yoon, S., Renshaw, P. F., Hwang, J., Bae, S., Musen, G., et al. (2013). Network-level structural abnormalities of cerebral cortex in type 1 diabetes mellitus. PLoS ONE 8:e71304. doi: 10.1371/journal.pone.0071304
Mansur, R. B., Cha, D. S., Woldeyohannes, H. O., Soczynska, J. K., Zugman, A., Brietzke, E., et al. (2014). Diabetes mellitus and disturbances in brain connectivity: a bidirectional relationship? Neuromolecular Med. 16, 658–668. doi: 10.1007/s12017-014-8316-8
Marzelli, M. J., Mazaika, P. K., Barnea-Goraly, N., Hershey, T., Tsalikian, E., Tamborlane, W., et al. (2014). Neuroanatomical correlates of dysglycemia in young children with type 1 diabetes. Diabetes 63, 343–353. doi: 10.2337/db13-0179
McCrimmon, R. J., Ryan, C. M., and Frier, B. M. (2012). Diabetes and cognitive dysfunction. Lancet 379, 2291–2299. doi: 10.1016/S0140-6736(12)60360-2
Melie-García, L., Sanabria-Diaz, G., and Sánchez-Catasús, C. (2013). Studying the topological organization of the cerebral blood flow fluctuations in resting state. Neuroimage 64, 173–184. doi: 10.1016/j.neuroimage.2012.08.082
Mesulam, M. M. (1998). From sensation to cognition. Brain 121, 1013–1052. doi: 10.1093/brain/121.6.1013
Mesulam, M. M. (ed.). (2000). Principles of Behavioural and Cognitive Neurology. New York, NY: Oxford University Press.
Morbelli, S., Arnaldi, D., Capitanio, S., Picco, A., Buschiazzo, A., and Nobili, F. (2013). Resting metabolic connectivity in Alzheimer's disease. Clin. Transl. Imaging 1, 271–278. doi: 10.1007/s40336-013-0027-x
Murphy, K., Birn, R. M., Handwerker, D. A., Jones, T. B., and Bandettini, P. A. (2009). The impact of global signal regression on resting state correlations: are anti-correlated networks introduced? Neuroimage 44, 893–905. doi: 10.1016/j.neuroimage.2008.09.036
Musen, G., Jacobson, A. M., Bolo, N. R., Simonson, D. C., Shenton, M. E., McCartney, R. L., et al. (2012). Resting-state brain functional connectivity is altered in type 2 diabetes. Diabetes 61, 2375–2379. doi: 10.2337/db11-1669
Power, J. D., Cohen, A. L., Nelson, S. S. M., Wig, G. S., Barnes, K. A., Church, J. A., et al. (2011). Functional network organization of the human brain. Neuron 72, 665–678. doi: 10.1016/j.neuron.2011.09.006
Reijmer, Y. D., Brundel, M., de Bresser, J., Kappelle, L. J., Leemans, A., and Biessels, G. J. (2013a). Microstructural white matter abnormalities and cognitive functioning in type 2 diabetes: a diffusion tensor imaging study. Diabetes Care 36, 137–144. doi: 10.2337/dc12-0493
Reijmer, Y. D., Leemans, A., Brundel, M., Kappelle, L. J., and Biessels, G. J. (2013b). Disruption of the cerebral white matter network is related to slowing of information processing speed in patients with type 2 diabetes. Diabetes 62, 2112–2115. doi: 10.2337/db12-1644
Roberts, R. O., Knopman, D. S., Cha, R. H., Mielke, M. M., Pankratz, V. S., Boeve, B. F., et al. (2014). Diabetes and elevated hemoglobin A1c levels are associated with brain hypometabolism but not amyloid accumulation. J. Nucl. Med. 55, 759–764. doi: 10.2967/jnumed.113.132647
Rubinov, M., and Sporns, O. (2010). Complex network measures of brain connectivity: uses and interpretations. Neuroimage 52, 1059–1069. doi: 10.1016/j.neuroimage.2009.10.003
Sanabria-Diaz, G., Martínez-Montes, E., and Melie-Garcia, L. (2013). Glucose metabolism during resting state reveals abnormal brain networks organization in the alzheimer's disease and mild cognitive impairment. PLoS ONE 8:e68860. doi: 10.1371/journal.pone.0068860
Sanabria-Diaz, G., Melie-García, L., Iturria-Medina, Y., Alemán-Gómez, Y., Hernández-González, G., Valdés-Urrutia, L., et al. (2010). Surface area and cortical thickness descriptors reveal different attributes of the structural human brain networks. Neuroimage 50, 1497–1510. doi: 10.1016/j.neuroimage.2010.01.028
Sanz-Arigita, E. J., Schoonheim, M. M., Damoiseaux, J. S., Rombouts, S. A., Maris, E., Barkhof, F., et al. (2010). Loss of “Small-World” networks in Alzheimer's Disease: graph analysis of fMRI resting-state functional connectivity. PLoS ONE 5:e13788. doi: 10.1371/journal.pone.0013788
Schurz, M., Aichhorn, M., Martin, A., and Perner, J. (2013). Common brain areas engaged in false belief reasoning and visual perspective taking: a meta-analysis of functional brain imaging studies. Front. Hum. Neurosci. 7:712. doi: 10.3389/fnhum.2013.00712
Seo, E. H., Lee, D. Y., Lee, J.-M., Park, J.-S., Sohn, B. K., Lee, D. S., et al. (2013). Whole-brain Functional networks in cognitively normal, mild cognitive impairment, and Alzheimer's Disease. PLoS ONE 8:e53922. doi: 10.1371/journal.pone.0053922
Slotnick, S. D., and Schacter, D. L. (2006). The nature of memory related activity in early visual areas. Neuropsychologia 44, 2874–2886. doi: 10.1016/j.neuropsychologia.2006.06.021
Sokoloff, L. (1981). Relationships among local functional activity, energy metabolism, and blood flow in the central nervous system. Fed. Proc. 40, 2311–2316.
Sporns, O. (2011). The human connectome: a complex network. Ann. N.Y. Acad. Sci. 1224, 109–125. doi: 10.1111/j.1749-6632.2010.05888.x
Sporns, O., Chialvo, D. R., Kaiser, M., and Hilgetag, C. C. (2004). Organization, development and function of complex brain networks. Trends Cogn. Sci. 8, 418–425. doi: 10.1016/j.tics.2004.07.008
Sporns, O., and Zwi, J. D. (2004). The small world of the cerebral cortex. Neuroinformatics 2, 145–162. doi: 10.1385/NI:2:2:145
Tian, L., Wang, J., Yan, C., and He, Y. (2011). Hemisphere- and gender-related differences in small-world brain networks: a resting-state functional MRI study. Neuroimage 54, 191–202. doi: 10.1016/j.neuroimage.2010.07.066
Tijms, B. M., Wink, A. M., de Haan, W., van der Flier, W. M., Stam, C. J., Scheltens, P., et al. (2013). Alzheimer's disease: connecting findings from graph theoretical studies of brain networks. Neurobiol. Aging 34, 2023–2036. doi: 10.1016/j.neurobiolaging.2013.02.020
Tu, S., Qiu, J., Martens, U., and Zhang, Q. (2013). Category-selective attention modulates unconscious processes in the middle occipital gyrus. Conscious. Cogn. 22, 479–485. doi: 10.1016/j.concog.2013.02.007
van den Heuvel, M. P., and Sporns, O. (2013). Network hubs in the human brain. Trends Cogn. Sci. 17, 683–696. doi: 10.1016/j.tics.2013.09.012
van Duinkerken, E., Ijzerman, R. G., Klein, M., Moll, A. C., Snoek, F. J., Scheltens, P., et al. (2016). Disrupted subject-specific gray matter network properties and cognitive dysfunction in type 1 diabetes patients with and without proliferative retinopathy. Hum. Brain Mapp. 37, 1194–1208. doi: 10.1002/hbm.23096
van Duinkerken, E., Schoonheim, M. M., Sanz-Arigita, E. J., IJzerman, R. G., Moll, A. C., Snoek, F. J., et al. (2012). Resting-state brain networks in type 1 diabetic patients with and without microangiopathy and their relation to cognitive functions and disease variables. Diabetes 61, 1814–1821. doi: 10.2337/db11-1358
van Elderen, S. G. C., de Roos, A., de Craen, A. J. M., Westendorp, R. G. J., Blauw, G. J., Jukema, J. W., et al. (2010). Progression of brain atrophy and cognitive decline in diabetes mellitus: a 3-year follow-up. Neurology 75, 997–1002. doi: 10.1212/WNL.0b013e3181f25f06
Wang, J., Qiu, S., Xu, Y., Liu, Z., Wen, X., Hu, X., et al. (2014). Graph theoretical analysis reveals disrupted topological properties of whole brain functional networks in temporal lobe epilepsy. Clin. Neurophysiol. 125, 1744–1756. doi: 10.1016/j.clinph.2013.12.120
Wang, J., Wang, X., Xia, M., Liao, X., Evans, A., and He, Y. (2015). GRETNA: a graph theoretical network analysis toolbox for imaging connectomics. Front. Hum. Neurosci. 9:386. doi: 10.3389/fnhum.2015.00386
Watts, D. J., Watts, D. J., Strogatz, S. H., and Strogatz, S. H. (1998). Collective dynamics of “small-world” networks. Nature 393, 440–442. doi: 10.1038/30918
Whitfield-Gabrieli, S., and Ford, J. M. (2012). Default mode network activity and connectivity in psychopathology. Annu. Rev. Clin. Psychol. 8, 49–76. doi: 10.1146/annurev-clinpsy-032511-143049
Xia, M., Wang, J., and He, Y. (2013). Brainnet viewer: a network visualization tool for human brain connectomics. PLoS ONE 8:e68910. doi: 10.1371/journal.pone.0068910
Xia, W., Wang, S., Sun, Z., Bai, F., Zhou, Y., Yang, Y., et al. (2013). Altered baseline brain activity in type 2 diabetes: a resting-state fMRI study. Psychoneuroendocrinology 38, 2493–2501. doi: 10.1016/j.psyneuen.2013.05.012
Yan, C., Gong, G., Wang, J., Wang, D., Liu, D., Zhu, C., et al. (2011). Sex- and brain size-related small-world structural cortical networks in young adults: a DTI tractography study. Cereb. Cortex 21, 449–458. doi: 10.1093/cercor/bhq111
Yao, Z., Hu, B., Zheng, J., Zheng, W., Chen, X., Gao, X., et al. (2015). A FDG-PET study of metabolic networks in apolipoprotein E ε4 Allele carriers. PLoS ONE 10:e0132300. doi: 10.1371/journal.pone.0132300
Zhang, Y., Zhang, X., Zhang, J., Liu, C., Yuan, Q., Yin, X., et al. (2014). Gray matter volume abnormalities in type 2 diabetes mellitus with and without mild cognitive impairment. Neurosci. Lett. 562, 1–6. doi: 10.1016/j.neulet.2014.01.006
Keywords: PET, FDG, diabetes, network, graph theory, small world
Citation: Qiu X, Zhang Y, Feng H and Jiang D (2016) Positron Emission Tomography Reveals Abnormal Topological Organization in Functional Brain Network in Diabetic Patients. Front. Neurosci. 10:235. doi: 10.3389/fnins.2016.00235
Received: 07 January 2016; Accepted: 12 May 2016;
Published: 27 May 2016.
Edited by:
Jinhui Wang, Hangzhou Normal University, ChinaReviewed by:
Xin Di, New Jersey Institute of Technology, USAMingrui Xia, Beijing Normal University, China
Copyright © 2016 Qiu, Zhang, Feng and Jiang. This is an open-access article distributed under the terms of the Creative Commons Attribution License (CC BY). The use, distribution or reproduction in other forums is permitted, provided the original author(s) or licensor are credited and that the original publication in this journal is cited, in accordance with accepted academic practice. No use, distribution or reproduction is permitted which does not comply with these terms.
*Correspondence: Yanjun Zhang, yjzhang78@163.com