Comparison of gain-like properties of eye position signals in inferior colliculus versus auditory cortex of primates
- 1 Center for Cognitive Neuroscience, Duke University, Durham, NC, USA
- 2 Department of Neurobiology, Duke University, Durham, NC, USA
- 3 Department of Psychology and Neuroscience, Duke University, Durham, NC, USA
We evaluated to what extent the influence of eye position in the auditory pathway of primates can be described as a gain field. We compared single unit activity in the inferior colliculus (IC), core auditory cortex (A1) and the caudomedial belt (CM) region of auditory cortex (AC) in primates, and found stronger evidence for gain field-like interactions in the IC than in AC. In the IC, eye position signals showed both multiplicative and additive interactions with auditory responses, whereas in AC the effects were not as well predicted by a gain field model.
Introduction
Primates have evolved multiple sensory systems that can provide information about the spatial location of objects and events in the environment, but do so in different formats. For example, receptive fields of retinal neurons move in space with movements of the eyes, providing eye-centered spatial information about light sources. In contrast, sound localization relies on interaural time and level differences, as well as on spectral filtering properties of the pinnae (for review, see Middlebrooks and Green, 1991), providing ear- or head-centered spatial information about sound sources.
Because the eyes can move independently with respect to the head, reference frames for visual and auditory spatial information are constantly shifting with respect to one another. Accordingly, considerable research has focused on how the brain incorporates information about eye position into the processing of both visual and auditory signals (Jay and Sparks, 1984, 1987; Stricanne et al., 1996; Cohen and Andersen, 2000; Groh et al., 2001; Werner-Reiss et al., 2003; Fu et al., 2004; Zwiers et al., 2004; Mullette-Gillman et al., 2005, 2009; Schlack et al., 2005; Porter et al., 2006) (see Discussion for additional references on eye position effects in both the auditory and the visual systems).
Some studies (Zipser and Andersen, 1988; Pouget and Sejnowski, 1997) have theorized that eye position signals act at least in part as gain fields that modulate stimulus-evoked activity. Intrinsic to the concept of the eye position signal as a gain field is that eye position can be thought of as a single signal that modulates the responses of the neuron to other sensory inputs in a consistent fashion across a range of values of that other sensory input. Gain modulation implies multiplicative interactions (Salinas and Thier, 2000) – indeed, that is the engineering definition of “gain”. However, many neurophysiologists use the term more loosely to indicate any kind of modulatory pattern, and quantitative analyses to test the whether the responses reflect multiplicative or some other kind of interaction have been lacking. In principle, eye position might also act in an additive fashion, or as a mixture of multiplicative and additive influences.
Whether indeed eye position signals can be conceived of as exerting a consistent modulatory influence on external sensory input, and whether that input is more multiplicative or additive is the subject of the current study. Put another way, we hope to determine whether a neural response (r), being a function of both sound (s) and eye position (e), can be described quantitatively as r μ F(s) × G(e), r μ F(s) + G(e), or some combination of both (Pouget and Sejnowski, 1997; Ben Hamed et al., 2003; Deneve and Pouget, 2003).
The nature of interactions between eye position signals and stimulus-evoked activity has important implications for coordinate transformations. Some models for coordinate transformations involve eye position effects with either multiplicative (Zipser and Andersen, 1988; Pouget and Sejnowski, 1997; Xing and Andersen, 2000; Zwiers et al., 2004) or additive interactions (Groh and Sparks, 1992; Porter et al., 2006), but other models have called for eye position to gate sensory input in a fashion that is not consistent with traditional views of gain fields (the dendrite model of Groh and Sparks, 1992). Such a gating pattern will produce neural responses that are selective for combinations of eye position and sensory input, resulting in auditory receptive fields that shift when the eyes move.
The current study is, to our knowledge, the first to quantitatively evaluate the mathematical nature of eye position modulation in the auditory system: additive, multiplicative, or a mixture of both. We report that the inferior colliculus (IC) shows evidence for both additive and multiplicative interactions between eye position and auditory inputs, but that effects in auditory cortex (AC) are considerably weaker and do not appear to be multiplicative.
Materials and Methods
Subjects and Surgery
Four adult female rhesus monkeys served as subjects for these experiments. All animal procedures were conducted in accordance with the principles of laboratory animal care of the National Institutes of Health (publication 86-23, revised 1985) and were approved by the Institutional Animal Care and Use Committee at Dartmouth College. Surgical and recording procedures are described in detail elsewhere (IC: Porter et al., 2006; AC: Werner-Reiss et al., 2003) and were conducted using suitable anesthesia and analgesics. In brief, subjects underwent sterile surgery for the implantation of a head post, eye coil and recording chamber. Single neuron activity was recorded using standard electrophysiological techniques. Recordings were made from five hemispheres (IC: 2 left; AC: 2 left, 1 right). The present data set consists of 135 IC neurons and 68 AC neurons: 47 in primary auditory cortex (A1) and 21 in caudomedial belt (CM). The neurons in A1 and IC represent a subset of those used for previous analyses (Werner-Reiss et al., 2003; Porter et al., 2006), and were selected based on the response period for analysis (see below).
Experimental Design and Behavioral Task
On each trial subjects were required to fixate an LED at one of eight or nine different locations along the horizontal dimension ranging 20 (in steps of 5) or 24° (in steps of 6) to the left and right of the midline. After 600–900 ms, an auditory stimulus (frozen white noise, 500 ms duration) was presented through a loudspeaker chosen from a set of nine locations, while the animal maintained fixation (see Figure 1). In the AC experiments, fixation continued and three additional sounds from randomly chosen locations were presented, each with a 500 ms duration and a 500 ms intersound interval. We chose an active fixation paradigm as opposed to, for example, a more naturalistic viewing paradigm, because of the great control of eye position it affords.
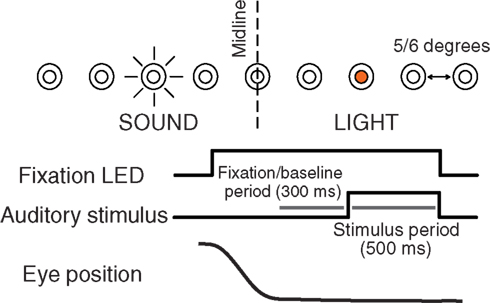
Figure 1. Experimental design. Subjects were required to fixate one of eight to nine LEDs along the horizontal dimension. After fixating for 600–900 ms, a white noise burst was presented for 500 ms from a speaker at an independent location while the subject maintained fixation. In some experiments, fixation continued while a series of three additional sounds were presented (500 ms duration, 500 ms intersound interval). The last 300 ms of the fixation interval before each sound was used to assess baseline activity.
LED and loudspeaker locations were chosen independently and randomly on each trial. Correct performance resulted in a juice or water reward. For each neuron, responses to 8–9 different sound source locations were tested in combination with the same 8–9 different fixation locations. Additional details on the experimental design and behavioral task can be found elsewhere (IC: Porter et al., 2006; AC: Werner-Reiss et al., 2003).
Location of Recording Sites
Anatomical location of the recording sites was determined on the basis of structural MRI scans (1.5 T magnet, 1 mm slices, T1-weighted, gradient echo pulse sequence). Scans were made with four tungsten electrodes marking the edges of the recording grid. The electrodes were readily visible on the images and served as a reference for the reconstruction of recording locations. IC recordings likely include both core and shell regions and no attempts were made to assign neurons to these different subdivisions. AC recordings were subdivided into A1 and CM regions on the basis of anatomical criteria. In accordance with the boundaries identified by anatomical studies (Morel et al., 1993; Kosaki et al., 1997; Rauschecker et al., 1997; Hackett et al., 1998, 2001), A1 recordings were limited to those ≥5 mm rostral from the caudal end of the supratemporal plane, ≥2 mm from the medial end of the supratemporal plane in the region caudal to the insula/circular sulcus, and ≥2 mm from the lateral edge of the supratemporal plane. All recording sites were well caudal of the RT region of core and consisted of sites mainly in putative A1 but potentially also in R. Recordings from CM were limited to those <5 mm rostral from the caudal end of the supratemporal plane and <2 mm from the medial end of the supratemporal plane.
Spike-Counting Windows
For each neuron, spikes were counted in two different time periods. The baseline period consisted of the 300 ms period prior to sound onset. The stimulus period consisted of spikes counted during a window of time tailored for each neuron and based on the excitatory response evident in its peri-stimulus time histogram (PSTH). Figure 2 shows the stimulus periods for all the neurons in the data set, sorted by the center of the stimulus period window.
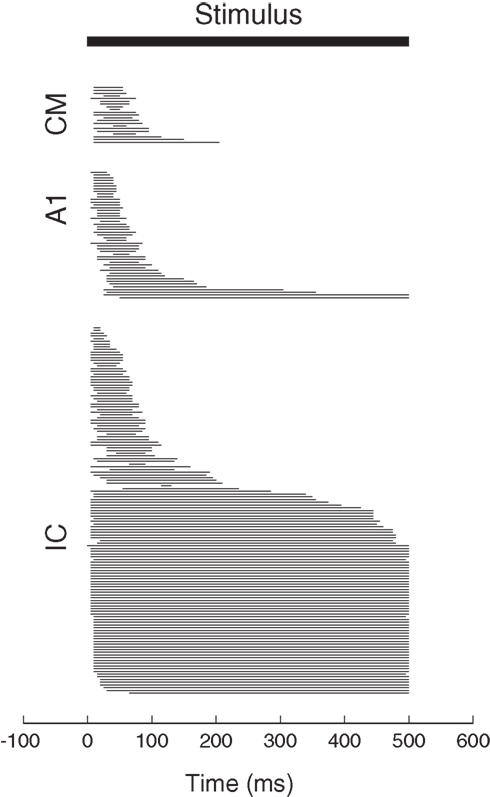
Figure 2. Stimulus period spike-counting windows for the neurons in the present dataset. Each bar represents the period of time detected as the excitatory response period during sound presentation for a neuron in our data set. Cells are sorted by the midpoint of this response period. The response periods of A1 and CM neurons tended to be very brief whereas some IC neurons showed sustained activity throughout the sound presentation.
All spike counts were converted to spike rates to allow for comparison between response periods of different lengths.
Our objective algorithm for identifying the excitatory response was as follows. We constructed the PSTH using 5-ms bins. We calculated the mean bin height and standard deviation during the baseline period. We then smoothed the PSTH by convolution with a filter with points [0.25, 0.5, 0.25]. During the period that the sound was on, we found the point where the discharge level first exceeded the baseline bin height plus 3 SD, and the last point when the discharge level dropped below that point. We discarded neurons whose excitatory response period by this measure was less than 25-ms long or for which the latency was >100 ms after sound onset. We also visually inspected the identification of the excitatory period for every neuron. This algorithm was highly consistent with our subjective judgments of the response period, and no by-hand tweaking was employed. Our data set of 135 IC, 47 A1, and 21 CM neurons reflects the neurons that were included after these criteria were imposed. Inhibitory response patterns were not included in this study.
Statistical Analysis
Assessment of the effects of eye position involved standard statistical tests such as analysis of variance (ANOVA). ANOVAs were conducted on the baseline period for each neuron (one-way, with eye position as the factor) and on the stimulus periods (two way, with eye position and sound location as factors). Table 1 provides the results of this analysis (significance level α μ 0.05).
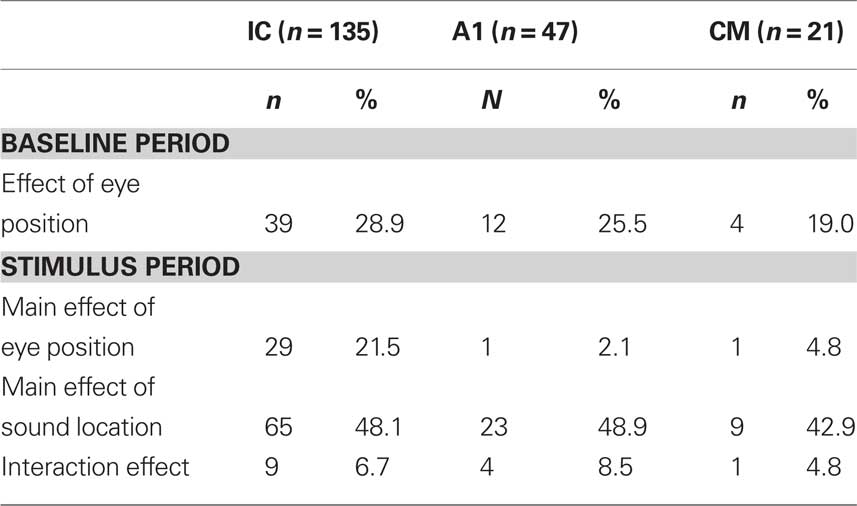
Table 1. Statistical analysis of eye position sensitivity using ANOVA (α = 0.05).
The incidence of eye position sensitivity during the stimulus period in A1 neurons was lower than in our previous reports involving this data set. This appears to be connected to our use of a shorter time window, tightly focused on the brief excitatory auditory burst, and the exclusion of the later inhibitory response period that is evident in many A1 neurons. Eye position signals were evident in the baseline period, however, in all three brain structures.
In principle, the ANOVA should indicate additive effects of eye position as main effects in the baseline and stimulus periods, and multiplicative effects of eye position as interaction effects. However, the ANOVA has several key limitations: (1) It is a measure thresholded by p-value and conducted on individual neurons. Thus, it can miss more subtle effects that may be detectable at the population level; (2) Interaction effects, or the lack thereof, have multiple interpretations. A multiplicative effect of eye position would appear as a main effect and not an interaction term in a neuron that was insensitive to sound location (50% of the neurons in the IC, for example). In addition, interaction effects when they occur can indicate effects that are not gain-like at all, such as receptive fields that change in position; (3) The ANOVA does not compare the eye position effect in the baseline with that observed during the stimulus period. Such a comparison can potentially be informative about the nature of the interaction between eye position and the auditory response.
Therefore, we performed two analyses to evaluate the shape of the eye position effect by, comparing activity during the stimulus period to that during the baseline period, as explained in further detail in the Results section. Trials were divided randomly into two halves, and the stimulus period was taken from one half and the baseline period from the other. For each eye position, the average stimulus period and baseline period responses were calculated. The correlation coefficient across the 8 or 9 eye positions was then computed. This was repeated 10 times with different random subdivisions of the data set. The t-statistic from the Student’s t-test was calculated for each run (one-tailed t-test), and the overall p-value was determined by taking the average of the t-statistic values for each run. The same procedure was followed for the analysis of differential response (stimulus minus baseline periods) as a function of the stimulus period response.
To determine whether individual neurons had significant positive correlation coefficients, the average and standard deviation of its set of correlation coefficients for the ten runs was calculated. The standard deviation was then used to calculate a 95% confidence interval around the mean (±1.96 × SD). If the confidence interval was positive and did not include zero, the individual correlation coefficient was judged to be significant.
Results
Overview
Previous analysis of these (Werner-Reiss et al., 2003; Porter et al., 2006), as well as other data sets (Groh et al., 2001; Zwiers et al., 2004), have focused on the effects of eye position on sensitivity to sound source location in the auditory pathway. These analyses suggested that eye position signals can interact with sound source location tuning, sometimes in a complex way. The overall pattern of responses, for example, matches neither a head- nor an eye-centered frame of reference. Here, we focus on one aspect of the response patterns, the mathematical nature of the interaction between eye position and sound-evoked activity.
The eye position gain field model considers the responses of individual neurons to consist of a systematic combination of two or more signals: in this case, one related to eye position and the other related to the sound. For example, the response of the neuron is conceived of as:
Response μ f(sound) + g(eye position)
in a purely additive model, or:
Response μ f(sound) × g(eye position)
in a purely multiplicative model. These possibilities are illustrated graphically in arguably the simplest possible form in Figure 3A.
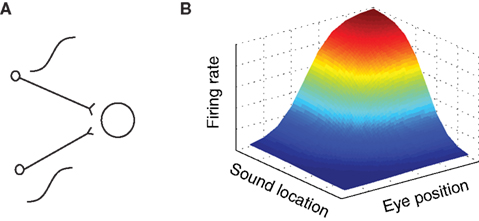
Figure 3. Gain field coding of eye position and sound source location. (A) Gain field network, in which a target neuron directly receives eye position and auditory inputs, illustrated here as sigmoidal in shape. The response of a simulated target neuron for multiplicative interactions is shown in (B). The response is characterized by a systematic combination of both inputs. In principle, input signals need not be sigmoidal and the interaction could be either additive, multiplicative, or a combination of the two.
Suppose a neuron received two inputs, one conveying an eye position signal and the other an auditory signal, such that for each one the tuning curve was sigmoidal in shape (for example). Sigmoidal tuning curves are common among neurons in the auditory system, and indicate that neurons may encode a stimulus parameter in the amount of action potentials (rate coding, Groh et al., 2003; Werner-Reiss and Groh, 2008). If these two inputs combine multiplicatively, the overall response pattern as a function of eye position and sound source location together would exhibit the smooth sigmoidal surface shape illustrated in Figure 3B. The exact shape of the surface reflecting the combination of eye position and sound location would of course depend on the shape of the input signals and whether they are added, multiplied, or a combination of both.
Our strategy for assessing the contribution of gain-like interactions was to use the baseline period, when no sound is presented, as a measure of the eye position signal1. The stimulus period reflects the contribution of both the eye position signal and the auditory signal. Comparison of the responses during these two periods can thus be informative regarding the nature of the interaction between these two signals.
Examples of IC neurons with eye position sensitivity are shown in Figure 4.
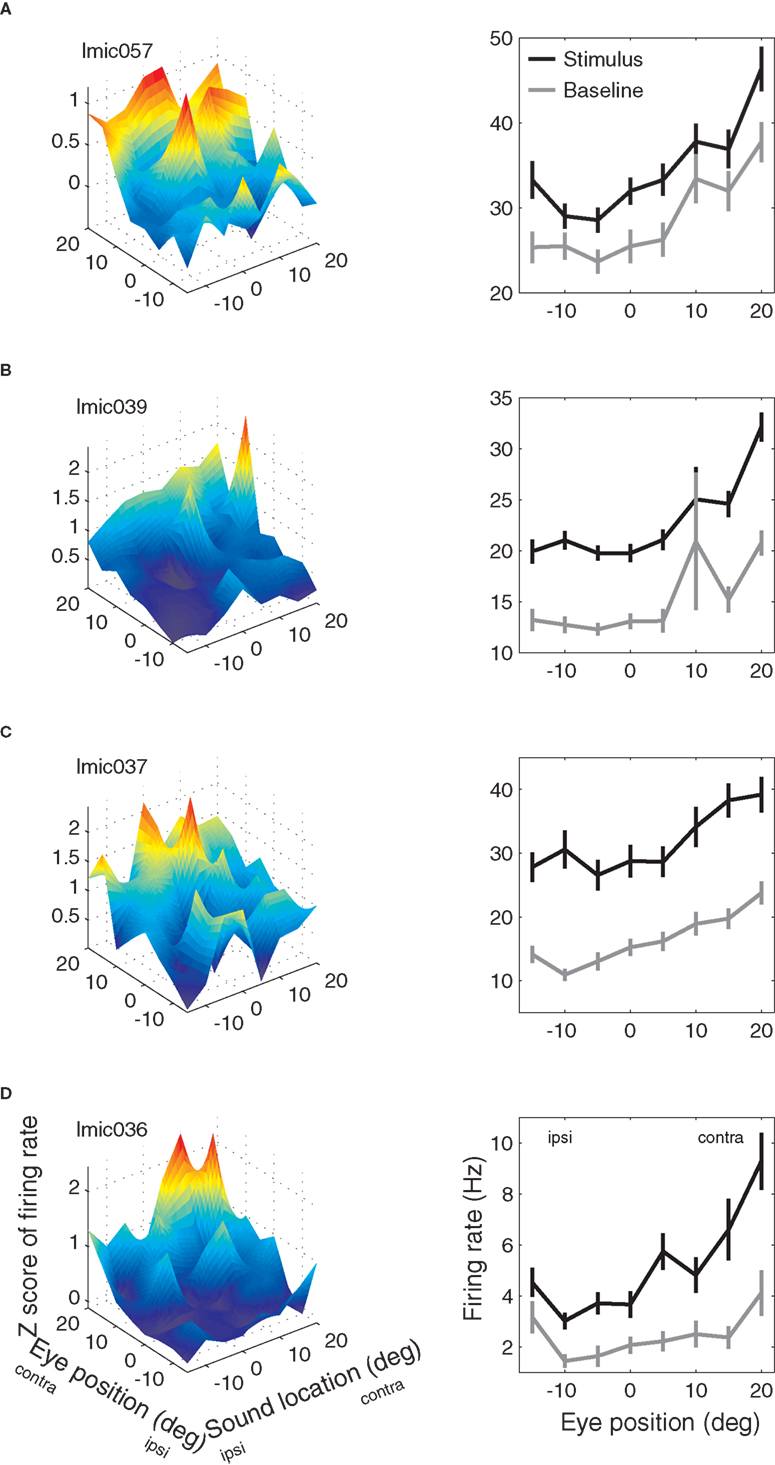
Figure 4. Examples of eye position effects in the inferior colliculus. (A–D) Left column: mean response during the stimulus period as a function of eye position and sound source location. Mean response is expressed as the Z-score of the response compared to the average baseline response. Right column: mean response (in spikes/second) during the baseline (gray) and stimulus (black) periods as a function of eye position (averaged over all sound source locations) for the same neurons as shown in left column.
The panels in the left column show the sensitivity as a function of both eye position and sound location during the stimulus period, whereas the right column shows the sensitivity as a function of eye position during both the baseline (gray line) and stimulus periods (black line, pooled across sound locations). Each of these neurons had a statistically significant effect of eye position according to ANOVA during both the baseline and stimulus periods (main effect, p < 0.05). Furthermore, the effect during the baseline and stimulus periods was similar: the black and gray lines tend to covary. For the top three neurons, the stimulus and baseline lines stay about equally far apart from each other, suggesting that auditory and eye position signals interact additively. For the fourth neuron, the stimulus activity seems to increase more than the baseline does for preferred eye positions. This pattern is suggestive of a multiplicative interaction between the eye position signal and the stimulus-evoked activity.
Quantitative Analysis of Gain Field-Like Effects of Eye Position
To test quantitatively for gain field-like effects, we first compared the effect of eye position during the baseline period to the effect of eye position during the stimulus period. A significant correlation between these two periods would show the presence of a consistent eye position signal that is evident in both periods, and that acts on auditory signals either additively, multiplicatively, or both.
To quantify the similarity of eye position effects during the stimulus and baseline periods across the population of neurons, we calculated the correlation between the responses as a function of eye position during baseline and during the stimulus period:
R[baseline period] versus R[stimulus period]
where R[baseline period] is the average firing rate during the baseline period for each eye position, and R[stimulus period] is the average firing rate after sound onset for that same eye position, averaging across all sound source locations. To minimize spurious correlations due to fluctuations in unit isolation or motivational factors (Metzger et al., 2006), we divided the data randomly into two halves, so that different sets of trials contributed to the calculation of R[baseline period] and R[stimulus period]. We conducted 10 runs with different random splits and averaged the results. We performed this analysis for all auditory responsive neurons with a significant effect of eye position during either the stimulus or baseline periods (main effects of eye position during stimulus or baseline periods, or interaction term with sound location during stimulus period, p < 0.05). Note that we did not adjust this p-value for multiple comparisons. We will return to the issue of the selection of neurons to include in this analysis below.
Consistent with a gain field model, we found a significant positive correlation between the stimulus and baseline periods in IC neurons (Figure 5A, one-tailed t-test, p < 0.05).
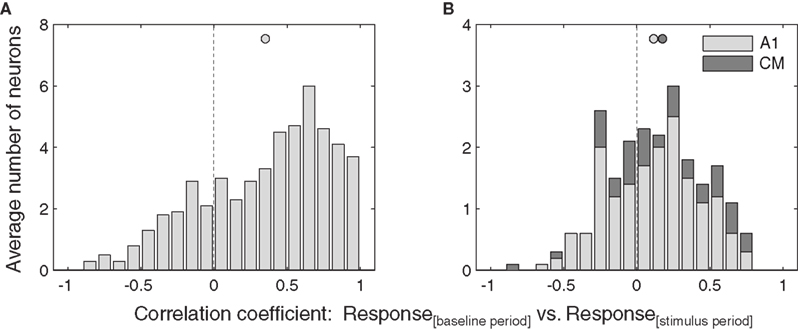
Figure 5. Similarity of eye position effects during baseline and stimulus. Distribution of correlations between responses as a function of eye position during the baseline period and the stimulus period, for all neurons that showed a significant of eye position during either the stimulus or baseline periods. Data from inferior colliculus (A) and auditory cortex (B) are pooled across sound location. Filled circles indicate the mean.
In contrast, the correlation between stimulus and baseline periods in AC were much weaker (Figure 5B), and did not reach significance for A1 or CM individually, although when the auditory cortical data were combined they did reach significance (p < 0.05). A similar pattern held at the level of individual neurons. In the IC, about half (23 of 51, or 45%) showed a significant positive correlation coefficient. In A1, this proportion was considerably smaller (2 of 17, or 12%), and none of the CM neurons were individually significant (0 or 5, or 0%), for an overall AC proportion of 9%.
Additive Versus Multiplicative Effects of Eye Position
The analysis discussed in the previous section suggests that at least a component of the response pattern in IC and perhaps auditory cortical neurons is gain field-like, but it does not establish whether that interaction is additive, multiplicative or a combination of both, as any of these possibilities would produce a significant correlation in the analysis shown above.
In Figure 6A we consider a hypothetical monotonic eye position signal and two possible effects of this signal on an evoked response.
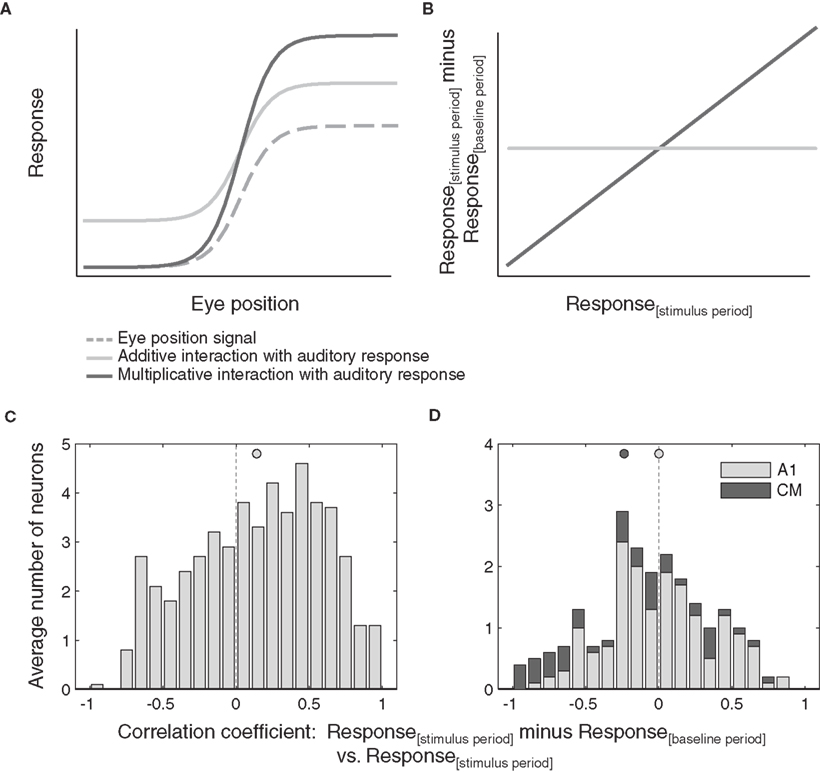
Figure 6. Additive versus multiplicative effects of eye position. (A) Shows hypothetical additive and multiplicative effects of a monotonic eye position signal on an auditory response. The resulting correlation between the response difference (stimulus minus baseline) and the stimulus period response as a function of eye position is shown in (B). (C,D) Distribution of correlations of stimulus responses minus baseline activity versus absolute stimulus responses as a function of eye position, for all neurons that showed significant effect of eye position. Data from inferior colliculus (C) and auditory cortex (D) are pooled across sound location. Filled circles indicate the mean.
In the purely additive case, the evoked response is added to the eye position signal, scaling the response evenly along the entire tuning curve. Such additive scaling is seen in the example neurons in Figures 4A–C. In the purely multiplicative case, evoked responses are scaled proportionally to the magnitude of the eye position signal. Contributions of such multiplicative scaling can be seen in the example neuron in Figure 4D.
Contributions of multiplicative effects of eye position were quantified by calculating the correlation between the magnitude of the difference between the stimulus period and baseline and the magnitude of the stimulus period per se, across eye positions:
R[stimulus period]−R[baseline period] versus R[stimulus period]
We performed this analysis for all auditory responsive neurons with a significant main effect of eye position, again splitting the data into two halves to eliminate spurious correlations. This analysis predicts the pattern of results illustrated in Figure 6B. If scaling is multiplicative, the correlation will be positive (assuming proportional effects; a negative correlation would indicate inversely proportional effects of eye position). Additive scaling on the other hand will result in a correlation around zero.
Figures 6C,D show the observed distributions of correlation coefficients. In the IC (Figure 6C), we found a wide distribution of correlation values that is biased toward positive values (p < 0.05). Auditory responses of a subset of neurons are scaled proportionally to the magnitude of the eye position signal, consistent with multiplicative effects of eye position. In contrast, the distribution of correlation coefficients obtained from AC neurons (Figure 6D) is centered around zero and therefore not consistent with any multiplicative effects of eye position. A similar pattern held when individual neurons were considered: 25% of IC neurons showed significant correlation coefficients (13 of 51) whereas only 4% of AC neurons did (1 of 17 A1 neurons and 0 of 5 CM neurons).
The above analyses were conducted by pooling across sound locations. For the IC, the same pattern was observed when the responses for each sound location were considered separately (Figure 7): there was a statistically significant correlation between the baseline and stimulus periods, and between the stimulus– baseline and stimulus periods (p < 0.05).
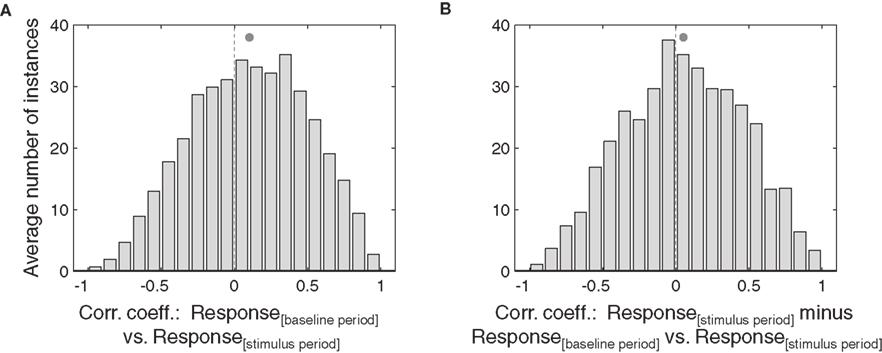
Figure 7. Effects of eye position, for each sound location, in IC neurons. The correlation of baseline versus stimulus period (A) and stimulus minus baseline versus stimulus periods (B) for each IC neuron, broken down by sound location. Each neuron-sound location combination was treated as a separate case. Filled circles indicate the mean.
However, in AC, no statistically significant effects were seen when the data were broken down by sound location (data not shown). This confirms that any gain-like effect in AC is weaker than the one seen in the IC.
Selection of which neurons to include in this analysis had little effect on the overall pattern of results. We repeated the analysis with the entire dataset. This would include neurons that either did not have any effect of eye position or for which the effect was too weak to reach statistical significance using the ANOVA, and therefore might be expected to obscure the effect observed in the more strongly eye position-sensitive subset tested above. As shown in Figure 8, the overall pattern of results was nevertheless maintained: both additive and multiplicative effects were statistically significant at the population level in the IC (p < 0.05, Figures 8A,C).
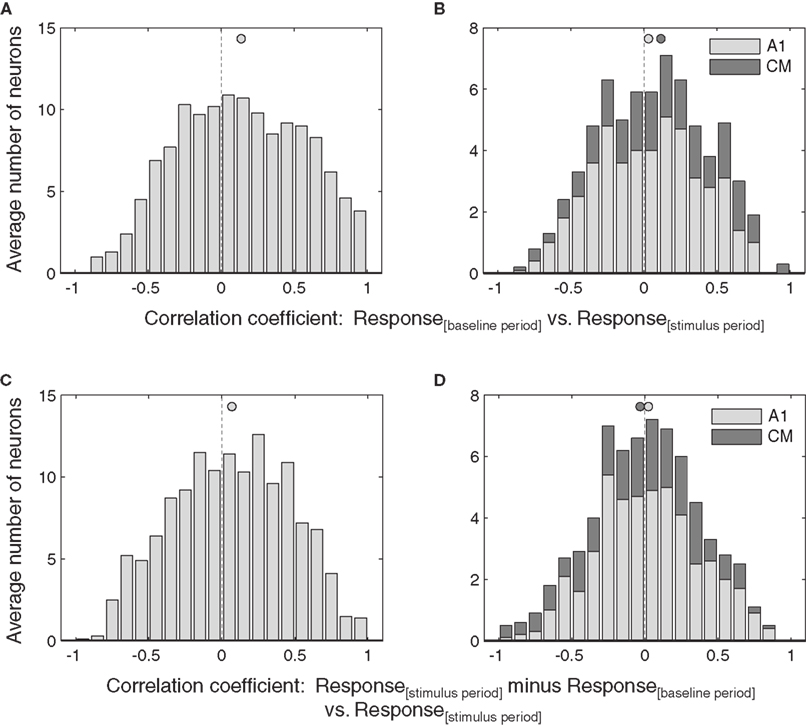
Figure 8. Effects of eye position in the entire population of IC and auditory cortical neurons. The correlation of baseline versus stimulus period (A,B) and stimulus minus baseline versus stimulus periods (C,D) for all the neurons in the data set regardless of whether they were demonstrably sensitive to eye position according to the ANOVA. Activity was pooled across sound location. Filled circles indicate the mean.
In contrast, the weaker additive effect of eye position in AC was no longer significant (Figure 8B), and there was still no evidence of a multiplicative effect (Figure 8D).
We also repeated the analysis comparing the responses during the stimulus period across two sound locations, rather than comparing baseline to stimulus period averaging across sound locations. The idea was to verify, if possible, that a similar pattern applies when comparing across two sounds rather than comparing sounds with silence. However, a caveat is that this analysis should be less able to distinguish additive versus multiplicative components than the baseline versus stimulus period analysis, because the difference in the auditory signal between sound and silence is far larger than the difference in auditory signal between any two sound locations. Indeed, many neurons are not sensitive to sound location (i.e., half of the neurons), and will not show a difference in the average strength of response across the two sound locations. Thus, there may be little to no difference in the auditory signal by which the eye position signal might scale.
In keeping with this limitation, this analysis was successful at replicating the strongest effects we observed with the baseline vs. stimulus period analysis, but not successful with the weaker effects. In particular, the additive analysis was statistically significant for the IC neurons (Figure 9): the distribution of correlation coefficients between the stimulus period responses for two sound locations as a function of eye position was significantly skewed toward positive values (Figure 9A, p < 0.05). However, this was not the case for the distribution of correlation coefficients for the multiplicative analysis (sound A minus sound B vs. sound B). This distribution did not differ from zero (Figure 9B). We repeated this analysis including only neurons with both eye position and sound location sensitivity, and obtained the same result, probably reflecting that even sound-sensitive neurons often show only minor differences in response strength at different sound locations.
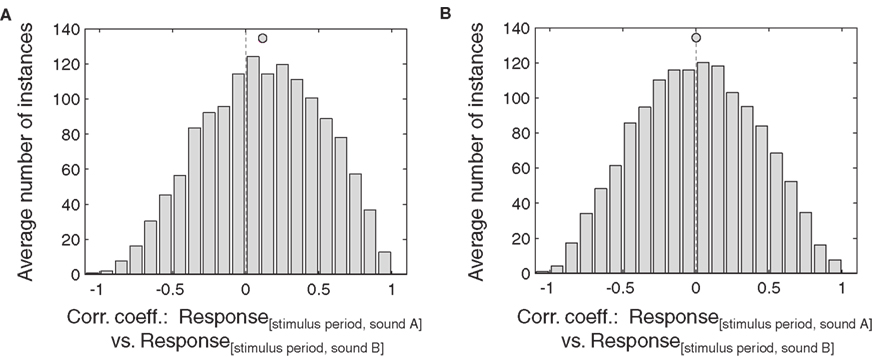
Figure 9. Effects of eye position, comparing stimulus period responses across different sound locations, in IC neurons. This analysis involved comparing the stimulus period responses for one sound location (sound A) against the stimulus responses for another location (sound B). (A) and (B) show the correlation of stimulus period responses for sound A versus sound B (A) and for sound A minus sound B versus sound B (B) for eye position-sensitive IC neurons. Each neuron-sound location combination was treated as a separate case. Filled circles indicate the mean.
In AC, neither the additive (sound A versus sound B) nor the multiplicative (sound A minus sound B versus sound B) analyses produced a distribution of correlation coefficients skewed toward positive values (not shown).
Discussion
The present data provide evidence that a portion of the effect of eye position in the IC behaves in a gain field-like fashion, and that this effect has a multiplicative as well as an additive component.
Eye Position Signals in the Inferior Colliculus
Our results further extend and clarify previous work that showed interactions between eye position signals and stimulus-evoked responses in the IC (Groh et al., 2001; Zwiers et al., 2004; Porter et al., 2006). Although the effects observed in these studies were suggestive of multiplicative interactions, the question remained in some doubt. Groh et al. (2001) attempted to quantify multiplicative effects of eye position on auditory responses, but their analysis did not separate the trials into two halves, which left open the possibility that the claims for a multiplicative nature of the interactions rested on a statistical artifact. By separating eye position signals from non-specific trial-by-trial fluctuations in other signals, the present analysis shows that the magnitude of auditory-evoked responses scales in at least a partly multiplicative way with the magnitude of the eye position effect. However, the finding that eye position tuning exists already during baseline indicates the presence of an additive component as well, so our findings should not be taken as ruling out additive interactions but rather showing the presence of a multiplicative component in the response patterns.
Eye Position Signals in Auditory Cortex
In contrast to the IC, eye position signals in AC showed a weaker tendency to behave like gain fields. To the extent that the pattern resembled a gain field, the interaction of the eye position signals with auditory-evoked activity was mainly additive. These findings suggest that eye position may have a more idiosyncratic impact in AC than in the IC.
Possible Role of Eye Position Signals
Effects of eye position have also been observed in areas of the visuomotor pathway (Sakata et al., 1980; Andersen and Mountcastle, 1983; Andersen et al., 1985, 1990; Galletti and Battaglini, 1989; Boussaoud et al., 1993; Van Opstal et al., 1995; Bremmer et al., 1997a,b; Duhamel et al., 1997; Nakamura et al., 1999; Trotter and Celebrini, 1999). Although such eye position effects are commonly referred to as “gain fields”, caution is warranted before using this term. For example, response patterns supposed to constitute eye position gain fields in parietal cortex may actually reflect a mixture of reference frames, including head-centered reference frames (Mullette-Gillman et al., 2005; 2009). In the IC and AC, the effects of eye position are complex and produce a representation that is not cleanly described in a pure reference frame. The gain-like effects we describe here in the IC represent only a part of the IC’s pattern of eye position sensitivity.
Theoretical accounts of the neural computations underlying coordinate transformations often stress the importance of either multiplicative (for review see Andersen, 1997; Salinas and Thier, 2000; Pouget et al., 2002) or additive (Groh and Sparks, 1992; Porter et al., 2006) operations. However, the cases in which multiplicative interactions may be required for some computational purpose and the cases in which additivity may suffice are not well understood. In what way and to what extent additive and multiplicative effects of eye position in the IC contribute to the computation of coordinate transformations remains unclear.
For coordinate transformations, in principle only additivity is needed: in the vector subtraction model of Groh and Sparks (1992), neurons sensitive to sound location and neurons sensitive to eye position converge on an intermediate stage where a linear signal of eye position is subtracted from a linear signal of sound location. However, neural responses are not strictly linear: at a minimum they have a threshold and a saturating non-linearity. It may be that the multiplicative component of the IC’s eye position signal reflects a deviation from linearity to compensate for these intrinsic non-linearities of neural activity patterns, and an effort to keep the scale of the eye position signal matched to the scale of the sound location signal at the point or points where these signals are combined.
An alternative possibility is that non-linear interactions such as multiplicativity are essential because the coordinate transformation is accomplished using basis functions, as proposed by Pouget and colleagues (Pouget and Sejnowski, 1997; Deneve and Pouget, 2003; see also Ben Hamed et al., 2003). By definition, to serve as a basis function, a representation must exhibit non-linear properties of some form.
Where the coordinate transformation of auditory signals from a head- to an eye-centered frame of reference might be completed is also uncertain. Effects of eye position are present at several stages of the auditory pathway, and there is little difference in overall hybrid reference frame in the IC, AC, and parietal cortex (Groh et al., 2001; Werner-Reiss et al., 2003; Mullette-Gillman et al., 2005, 2009; Porter et al., 2006). A hybrid reference frame has also been reported in the SC (Jay and Sparks, 1987). Thus, the roles of these different structures, and subpopulations within these structures, is currently unclear.
Eye position modulation may also reflect attentional signals. Eye position is often strongly correlated with spatial attention (Yarbus, 1967), and there is increasing evidence that the neural pathways that control eye movements may also control attention (Kustov and Robinson, 1996; Moore and Fallah, 2001). Effects of spatial attention on neuronal activity have previously been described in visual areas such as V1, V2 and V4. These effects may include multiplicative (McAdams and Maunsell, 1999) or additive (Luck et al., 1997) effects, or a combination of both (Reynolds et al., 1999).
Together with our previous work on reference frame in the IC and AC (Groh et al., 2001; Werner-Reiss et al., 2003) our findings emphasize that eye position has multiple distinct effects on neuronal activity in the auditory pathway, resulting in multiplexed signals that may perform different functions in different contexts.
Conflict of Interest Statement
The authors declare that the research was conducted in the absence of any commercial or financial relationships that could be construed as a potential conflict of interest.
Acknowledgments
The data for this project was collected by Uri Werner-Reiss, Kristin Kelly Porter and Ryan Metzger. We thank Dave Bulkin for valuable discussions and Abigail Underhill for technical assistance. This work was supported by grants NS 50942 and NSF 0415634 to Jennifer M. Groh.
Footnote
- ^It should be noted that, although quiet, the setting is not completely silent – steady sounds from the air ventilation system and the hum of the electronics outside the rig, although totaling <30 dB SPL, may nevertheless contribute to activity during this period. Thus the activity during baseline does not necessarily represent only eye position but may include some sound-evoked activity.
References
Andersen, R. A. (1997). Multimodal integration for the representation of space in the posterior parietal cortex. Philos. Trans. R. Soc. Lond., B, Biol. Sci. 352, 1421–1428.
Andersen, R. A., Bracewell, R. M., Barash, S., Gnadt, J. W., and Fogassi, L. (1990). Eye position effects on visual, memory, and saccade-related activity in areas LIP and 7a of macaque. J. Neurosci. 10, 1176–1196.
Andersen, R. A., Essick, G. K., and Siegel, R. M. (1985). Encoding of spatial location by posterior parietal neurons. Science 230, 456–458.
Andersen, R. A., and Mountcastle, V. B. (1983). The influence of the angle of gaze upon the excitability of the light-sensitive neurons of the posterior parietal cortex. J. Neurosci. 3, 532–548.
Ben Hamed, S., Page, W., Duffy, C., and Pouget, A. (2003). MSTd neuronal basis functions for the population encoding of heading direction. J. Neurophysiol. 90, 549–558.
Boussaoud, D., Barth, T. M., and Wise, S. P. (1993). Effects of gaze on apparent visual responses of frontal cortex neurons. Exp. Brain Res. 93, 423–434.
Bremmer, F., Distler, C., and Hoffmann, K. P. (1997a). Eye position effects in monkey cortex. II. Pursuit-and fixation-related activity in posterior parietal areas LIP and 7A. J. Neurophysiol. 77, 962–977.
Bremmer, F., Ilg, U. J., Thiele, A., Distler, C., and Hoffmann, K. P. (1997b). Eye position effects in monkey cortex. I. Visual and pursuit-related activity in extrastriate areas MT and MST. J. Neurophysiol. 77, 944–961.
Cohen, Y. E., and Andersen, R. A. (2000). Reaches to sounds encoded in an eye-centered reference frame. Neuron 27, 647–652.
Deneve, S., and Pouget, A. (2003). Basis functions for object-centered representations. Neuron 37, 347–359.
Duhamel, J. R., Bremmer, F., BenHamed, S., and Graf, W. (1997). Spatial invariance of visual receptive fields in parietal cortex neurons. Nature 389, 845–848.
Fu, K. M. G., Shah, A. S., O’Connell, M. N., McGinnis, T., Eckholdt, H., Lakatos, P., Smiley, J., and Schroeder, C. E. (2004). Timing and laminar profile of eye-position effects on auditory responses in primate auditory cortex. J. Neurophysiol. 92, 3522–3531.
Galletti, C., and Battaglini, P. P. (1989). Gaze-dependent visual neurons in area V3A of monkey prestriate cortex. J. Neurosci. 9, 1112–1125.
Groh, J. M., Kelly, K. A., and Underhill, A. M. (2003). A monotonic code for sound azimuth in primate inferior colliculus. J. Cogn. Neurosci. 15, 1217–1231.
Groh, J. M., and Sparks, D. L. (1992). Two models for transforming auditory signals from head-centered to eye-centered coordinates. Biol. Cybern. 67, 291–302.
Groh, J. M., Trause, A. S., Underhill, A. M., Clark, K. R., and Inati, S. (2001). Eye position influences auditory responses in primate inferior colliculus. Neuron 29, 509–518.
Hackett, T. A., Preuss, T. M., and Kaas, J. (2001). Architectonic identification of the core region in auditory cortex of macaques, chimpanzees, and humans. J. Comp. Neurol. 442, 197–222.
Hackett, T. A., Stepniewska, I., and Kaas, J. H. (1998). Subdivisions of auditory cortex and ipsilateral cortical connections of the parabelt auditory cortex in macaque monkeys. J. Comp. Neurol. 394.
Jay, M. F., and Sparks, D. L. (1984). Auditory receptive fields in primate superior colliculus shift with changes in eye position. Nature 309, 345–347.
Jay, M. F., and Sparks, D. L. (1987). Sensorimotor integration in the primate superior colliculus. II. Coordinates of auditory signals. J. Neurophysiol. 57, 35–55.
Kosaki, H., Hashikawa, T., He, J., and Jones, E. G. (1997). Tonotopic organization of auditory cortical fields delineated by parvalbumin immunoreactivity in macaque monkeys. J. Comp. Neurol. 386.
Kustov, A. A., and Robinson, D. L. (1996). Shared neural control of attentional shifts and eye movements. Nature 384, 74–77.
Luck, S. J., Chelazzi, L., Hillyard, S. A., and Desimone, R. (1997). Neural mechanisms of spatial selective attention in areas V1, V2, and V4 of macaque visual cortex. J. Neurophysiol. 77, 24–42.
McAdams, C. J., and Maunsell, J. H. R. (1999). Effects of attention on orientation-tuning functions of single neurons in macaque cortical area V4. J. Neurosci. 19, 431–441.
Metzger, R. R., Greene, N. T., Porter, K. K., and Groh, J. M. (2006). Effects of reward and behavioral context on neural activity in the primate inferior colliculus. J. Neurosci. 26, 7468.
Middlebrooks, J. C., and Green, D. M. (1991). Sound localization by human listeners. Annu. Rev. Psychol. 42, 135–159.
Moore, T., and Fallah, M. (2001). Control of eye movements and spatial attention. Proc. Natl. Acad. Sci. U.S.A. 98, 1273–1276.
Morel, A., Garraghty, P. E., and Kaas, J. H. (1993). Tonotopic organization, architectonic fields, and connections of auditory cortex in macaque monkeys. J. Comp. Neurol. 335, 437–459.
Mullette-Gillman, O. A., Cohen, Y. E., and Groh, J. M. (2009). Motor-related signals in the intraparietal cortex encode locations in a hybrid, rather than eye-centered reference frame. Cereb. Cortex 19, 1761–1775.
Mullette-Gillman, O. D. A., Cohen, Y. E., and Groh, J. M. (2005). Eye-centered, head-centered, and complex coding of visual and auditory targets in the intraparietal sulcus. J. Neurophysiol. 94, 2331–2352.
Nakamura, K., Chung, H. H., Graziano, M. S. A., and Gross, C. G. (1999). Dynamic representation of eye position in the parieto-occipital sulcus. J. Neurophysiol. 81, 2374–2385.
Porter, K. K., Metzger, R. R., and Groh, J. M. (2006). Representation of eye position in primate inferior colliculus. J. Neurophysiol. 95, 1826–1842.
Pouget, A., Deneve, S., and Duhamel, J. R. (2002). A computational perspective on the neural basis of multisensory spatial representations. Nat. Rev. Neurosci. 3, 741–747.
Pouget, A., and Sejnowski, T. J. (1997). Spatial transformations in the parietal cortex using basis functions. J. Cogn. Neurosci. 9, 222–237.
Rauschecker, J. P., Tian, B., Pons, T., and Mishkin, M. (1997). Serial and parallel processing in rhesus monkey auditory cortex. J. Comp. Neurol. 382, 89–103.
Reynolds, J. H., Chelazzi, L., and Desimone, R. (1999). Competitive mechanisms subserve attention in macaque areas V2 and V4. J. Neurosci. 19, 1736–1753.
Sakata, H., Shibutani, H., and Kawano, K. (1980). Spatial properties of visual fixation neurons in posterior parietal association cortex of the monkey. J. Neurophysiol. 43, 1654–1672.
Salinas, E., and Thier, P. (2000). Gain modulation a major computational principle of the central nervous system. Neuron 27, 15–21.
Schlack, A., Sterbing-D’Angelo, S. J., Hartung, K., Hoffmann, K. P., and Bremmer, F. (2005). Multisensory space representations in the macaque ventral intraparietal area. J. Neurosci. 25, 4616–4625.
Stricanne, B., Andersen, R. A., and Mazzoni, P. (1996). Eye-centered, head-centered, and intermediate coding of remembered sound locations in area LIP. J. Neurophysiol. 76, 2071–2076.
Trotter, Y., and Celebrini, S. (1999). Gaze direction controls response gain in primary visual-cortex neurons. Nature 398, 239–242.
Van Opstal, A. J., Hepp, K., Suzuki, Y., and Henn, V. (1995). Influence of eye position on activity in monkey superior colliculus. J. Neurophysiol. 74, 1593–1610.
Werner-Reiss, U., and Groh, J. M. (2008). A rate code for sound azimuth in monkey auditory cortex: implications for human neuroimaging studies. J. Neurosci. 28, 3747–3758.
Werner-Reiss, U., Kelly, K. A., Trause, A. S., Underhill, A. M., and Groh, J. M. (2003). Eye position affects activity in primary auditory cortex of primates. Curr. Biol. 13, 554–562.
Xing, J., and Andersen, R. A. (2000). Models of the posterior parietal cortex which perform multimodal integration and represent space in several coordinate frames. J. Cogn. Neurosci. 12, 601–614.
Zipser, D., and Andersen, R. A. (1988). A back-propagation programmed network that simulates response properties of a subset of posterior parietal neurons. Nature 331, 679–684.
Keywords: inferior colliculus, auditory cortex, gain field, eye position, primate
Citation: Maier JX and Groh JM (2010). Comparison of gain-like properties of eye position signals in inferior colliculus versus auditory cortex of primates. Front. Integr. Neurosci. 4:121. doi:10.3389/fnint.2010.00121
Received: 14 May 2010;
Paper pending published: 11 June 2010;
Accepted: 02 August 2010;
Published online: 20 August 2010
Edited by:
Sidney A. Simon, Duke University, USAReviewed by:
Mark T. Wallace, Vanderbilt University, USAEmilio Salinas, Wake Forest University, USA
Copyright: © 2010 Maier and Groh. This is an open-access article subject to an exclusive license agreement between the authors and the Frontiers Research Foundation, which permits unrestricted use, distribution, and reproduction in any medium, provided the original authors and source are credited.
*Correspondence: Joost X. Maier, Department of Psychology, Brandeis University, 415 South Street MS062, Waltham, MA 02453, USA. e-mail: joost.maier@gmail.com