Functional roles of distributed synaptic clusters in the mitral–granule cell network of the olfactory bulb
- 1 Institute of Biophysics, National Research Council, Palermo, Italy
- 2 Department of Neurobiology, Yale University School of Medicine, New Haven, CT, USA
- 3 Department of Computer Science, Yale University, New Haven, CT, USA
Odors are encoded in spatio-temporal patterns within the olfactory bulb, but the mechanisms of odor recognition and discrimination are poorly understood. It is reasonable to postulate that the olfactory code is sculpted by lateral and feedforward inhibition mediated by granule cells onto the mitral cells. Recent viral tracing and physiological studies revealed patterns of distributed granule cell synaptic clusters that provided additional clues to the possible mechanisms at the network level. The emerging properties and functional roles of these patterns, however, are unknown. Here, using a realistic model of 5 mitral and 100 granule cells we show how their synaptic network can dynamically self-organize and interact through an activity-dependent dendrodendritic mechanism. The results suggest that the patterns of distributed mitral–granule cell connectivity may represent the most recent history of odor inputs, and may contribute to the basic processes underlying mixture perception and odor qualities. The model predicts how and why the dynamical interactions between the active mitral cells through the granule cell synaptic clusters can account for a variety of puzzling behavioral results on odor mixtures and on the emergence of synthetic or analytic perception.
Introduction
Analysis of the neural basis for odor recognition may have significant impact not only for a better explanation of physiological and behavioral olfactory processes, but also for industrial applications in the development of odor-sensitive devices and applications to the fragrance industry. While the underlying mechanisms are still unknown, experimental findings have given important clues at the level of the activation patterns in the olfactory glomerular layer by comparing the responses to single odors and to mixtures (Johnson et al., 1999; Linster and Hasselmo, 1999; Rubin and Katz, 1999; Linster et al., 2001). At the mitral cell layer, there has been significant experimental evidence that mitral cells contribute to the odor recognition process through sparse (Fantana et al., 2008), spatially distributed (Johnson et al., 1999), and multidimensional (Johnson and Leon, 2007) glomerular activity, which is conserved across species and individuals (Soucy et al., 2009). Classic experimental evidence (Yokoi et al., 1995) has suggested a general role for the reciprocal mitral–granule synapse, and additional evidence suggested that it must undergo a significant remodeling during olfactory experience (Buonviso and Chaput, 2000; Matsuoka et al., 2004; Moreno et al., 2009) and neurogenesis (Mouret et al., 2009; Nissant et al., 2009).
Beyond this data, the processing rules supporting odor perception are controversial (Gervais et al., 2007; Zarzo, 2007). A point of general importance in sensory physiology is whether sensory activity is analytic (or elemental) or synthetic (or configural) (Wilson and Stevenson, 2003; Gottfried et al., 2006; Kadohisa and Wilson, 2006). Analytic refers to the perception of individual components in a mixture, whereas synthetic refers to the creation of a unified percept. An example of analytic perception is taste in that sweet and sour can be combined in a dish and tasted individually. The mixture of blue and yellow to make green is an example of synthetic perception in vision. Which one of these properties applies to any given odor mixture is unclear and often confusing (Kay et al., 2005). For example, it has been shown that structurally very different odors, presumably activating different glomeruli, often showed a robust synthetic response instead of the expected analytic response (Grossman et al., 2008). While different theoretical/computational models have accounted for different aspects of this problem (e.g., Olson, 1994; Linster and Cleland, 2004), several important links between neuronal activity and behavioral results are still missing. One important clue to the possible underlying circuit mechanisms is the recently discovered distributed mitral–granule cell synaptic clusters (Willhite et al., 2006; Soucy et al., 2009), suggesting a clustered connectivity underlying signal processing in the bulb (Phillips et al., 2009). Their functional roles, however, remain to be explored.
To address this issue we have been developing a realistic network model (Migliore et al., 2007; Migliore and Shepherd, 2008). The initial model demonstrated how the mitral–granule cell synapses can self-organize through an activity-dependent process driven by action potentials (APs) propagating in the mitral cell lateral dendrites to form distributed mitral–granule cell clusters. Here we extend the model to study their possible functional consequences. The results suggest how distributed mitral–granule cell synaptic clusters, as those observed experimentally, can modulate mitral cells’ responses with odor experience, and describe a possible mechanism for the emergence of odor properties observed behaviorally.
Materials and Methods
All the simulations were carried out with the NEURON simulation program (Hines and Carnevale, 1997) on a parallel multi-processor IBM Linux cluster (CINECA, Bologna, Italy) or a BlueGene/P (IDRIS, Orly, France) system. The model and simulation files are available for public download under the ModelDB section (accession number 127995) of the Senselab database suite (http://senselab.med.yale.edu).
For the purposes of this paper, and to investigate the possible interactions among a small group of mitral cells, in a simplified but physiologically plausible odor environment, we used a network consisting of five mitral cells (M1–M5 in Figure 1A) uniformly distributed along a 1-mm linear space. Each mitral cell represents the synchronized activity from a single glomerulus (Schoppa and Westbrook, 2002; Gire and Schoppa, 2009), and the ensemble of five mitral cells should be considered as representative of the subset of glomeruli activated during an odor presentation. To explore the synaptic network dynamics, and its interaction with backpropagating mitral cell APs 100 granule cells (Gx, one every 10 μm) forming dendrodendritic contacts along the overlying mitral cell lateral dendrites were added, as schematically shown in Figure 1A. The network is a straightforward extension of the model in Migliore et al. (2007).
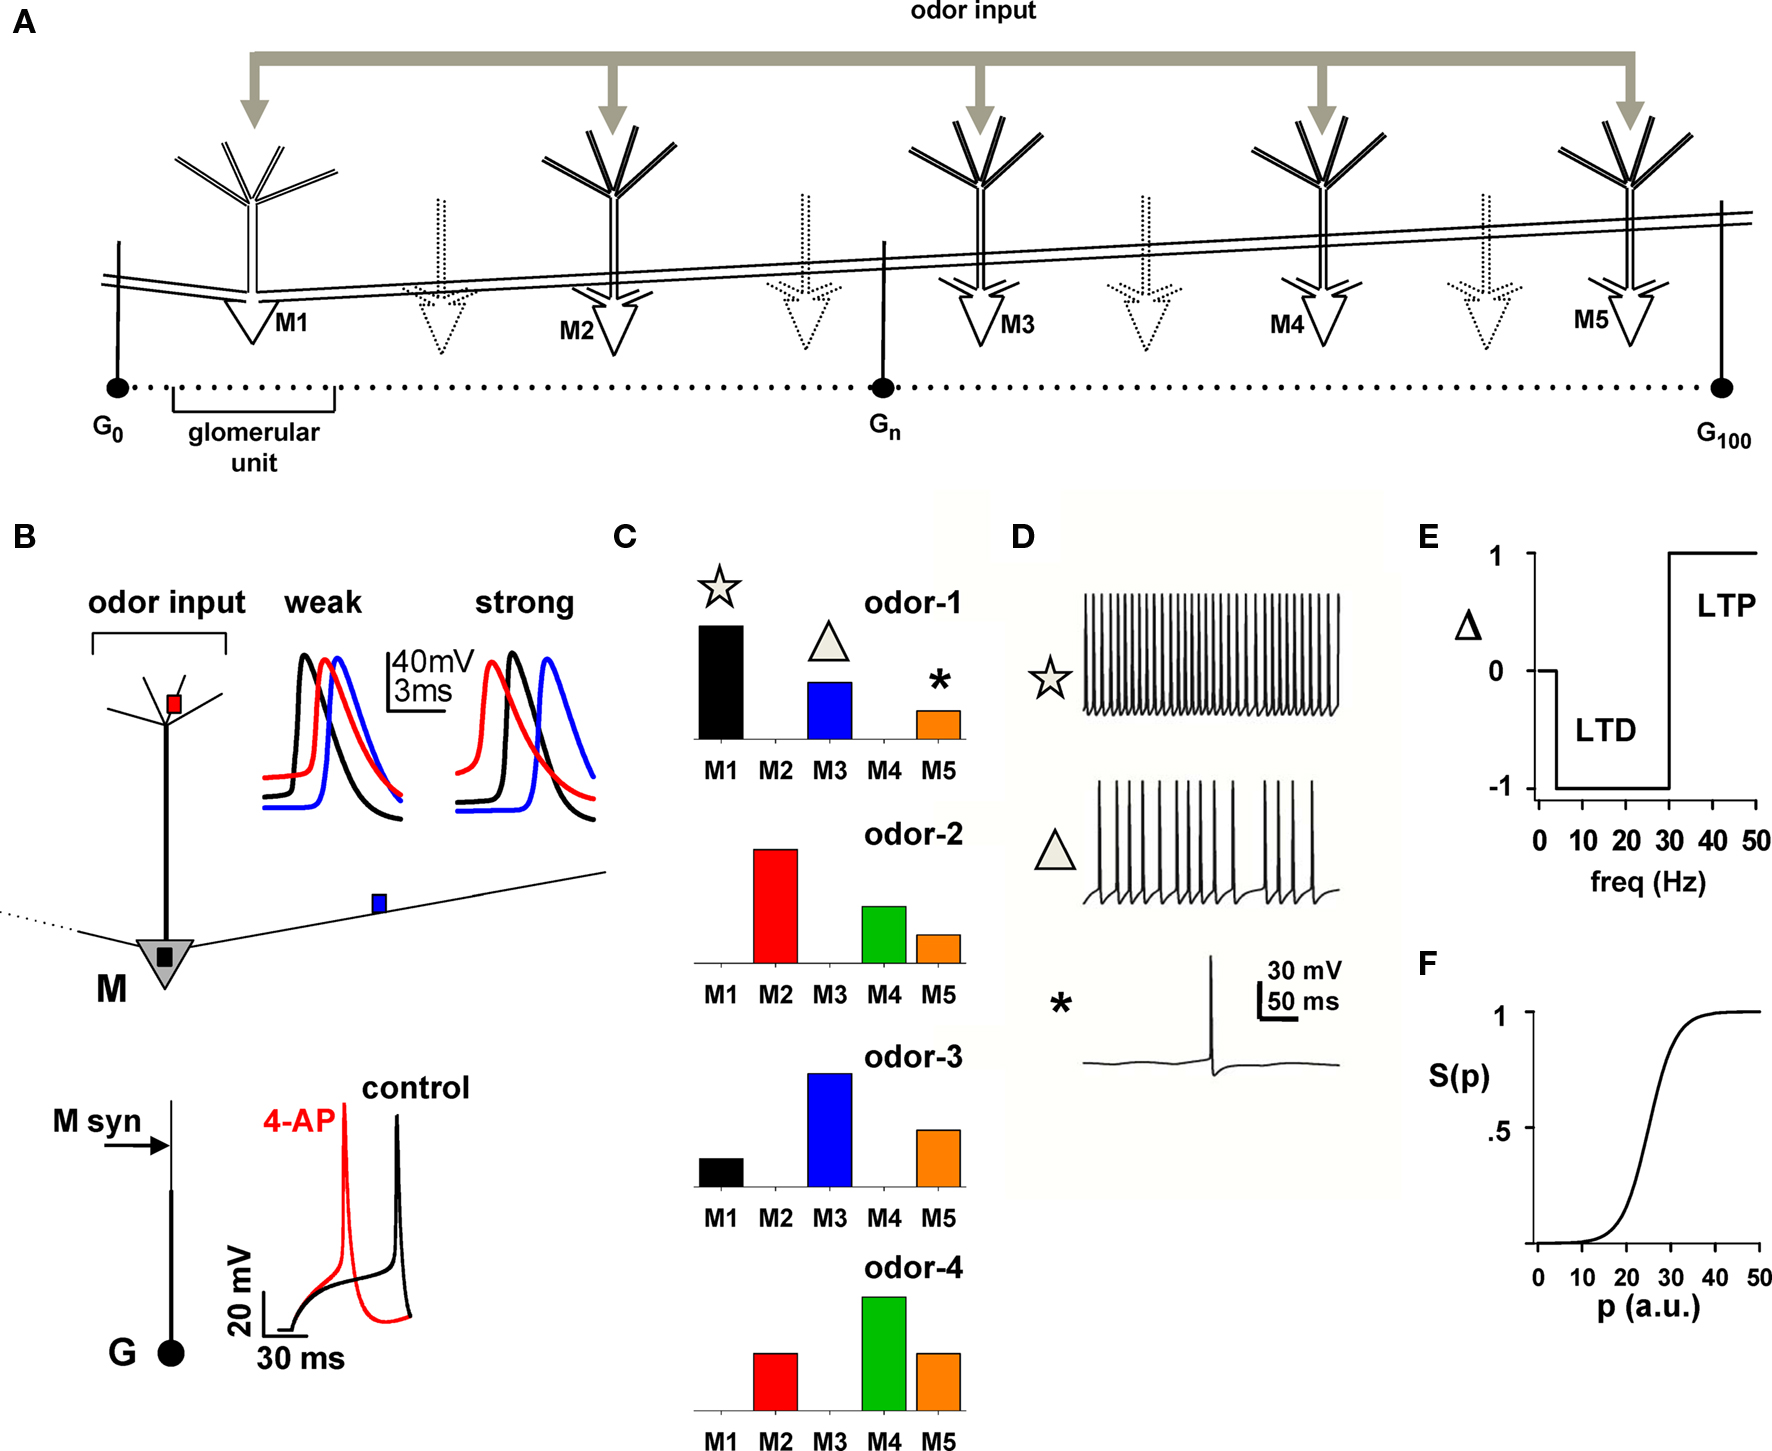
Figure 1. Layout of the basic model for simulating the response of the network to a battery of odors. (A) Schematic arrangement of dendrodendritic synapses between mitral and granule cells; only mitral cells M1–M5 were explicitly modeled; “glomerular unit” indicates a mitral cell and its closest related granule cells. (B) Mitral (M) and Granule (G) cell properties; top: the traces show the membrane potential at different mitral cell locations (colored squares) during a single odor input activation (for clarity, only the first AP is shown); bottom: Traces show the granule cell somatic membrane potential during a somatic current injection (25 pA) under control and after simulated application of 4-aminopyridine, which blocks A-type K+ channels (4-AP, modeled with a 80% reduction of the KA conductance). The arrow on the granule cell dendrite indicates the location of mitral cell synaptic input. (C) The five mitral cells in (A) were stimulated by four odors with different relative strengths, indicated by the bars. (D) Simultaneous recordings of somatic traces for M1, M3, and M5 during a typical activation of odor 1; symbols correlate mitral cell firing with the strength of input in (C). (E,F) Rule for long-term potentiation (LTP) and long-term depression (LTD) of mitral–granule cell reciprocal synapses (from Migliore et al., 2007); the instantaneous frequency of each interspike interval at each synaptic location determines the value of Δ; this is used to update the value of p and, consequently, the peak synaptic conductance as w{exc,inh},p+Δ = gsyn,{exc,inh}.S(p + Δ); the function S(p) determines the current state of a synaptic weight.
Mitral and granule cells’ morphological, active, passive, and synaptic properties were identical to those used in that work (ModelDB accession number 114665), with the exception of longer (1000 μm) mitral cell lateral dendrites. The two typical simulations of a mitral cell in Figure 1B (top, weak and strong insets) show that APs can initiate in the soma (Figure 1B, black traces) or in the tuft (Figure 1B, red traces) for weak (5.6 nS) or strong (8 nS) odor inputs, respectively, and propagate at full amplitude in the secondary dendrites, in agreement with experimental findings (Chen et al., 1997, 2002; Xiong and Chen, 2002; Debarbieux et al., 2003). Granule cells (Figure 1B, bottom) were modeled with a soma and a main radial dendrite (150 μm long) connected to a 100-μm long second-order dendrite representing the medial and distal dendritic tree, which was used to make dendrodendritic synaptic contact with mitral cell(s) lateral dendrite(s). The active properties were such that blocking the potassium A-type K+ current (Figure 1B, bottom, red trace) resulted in a significant effect on the spike latency, with respect to control (Figure 1B, bottom, black trace), in agreement with experimental findings (Schoppa and Westbrook, 1999).
Dendrodendritic coupling between each granule cell and a lateral dendrite of each mitral cell was the same as in Migliore et al. (2007), implemented with a pair of independent reciprocal synapses between a granule cell dendrite (containing AMPA and NMDA channels) with a mitral lateral dendrite (containing GABA channels) at the appropriate distance from the soma. Synapses (excitatory or inhibitory) were activated whenever the corresponding presynaptic compartment reached the threshold of −40 mV (Chen et al., 2000, for 18–28 days old rats).
Odor stimulation of mitral cells was modeled using a synchronous activation, in all tuft compartments, of synaptic inputs with a double exponential conductance change (20 and 200 ms rise and decay time, respectively), and an individual peak conductance in the range 0–0.5 nS. This corresponds to a total aggregate input conductance of up to 10 nS, and it elicits six somatic spikes during a single activation, within the range observed experimentally for the number of APs generated during a respiratory cycle (Cang and Isaacson, 2003).
As has been shown experimentally, odor inputs activate different mitral cells at different strengths. For most simulations, we implemented and used four odors (odors 1–4), with a relative mitral cell tuft activation schematically represented in Figure 1C, which is consistent with the experimental finding suggesting that mitral cells receive sparse glomerular inputs (Fantana et al., 2008). Unless otherwise noted, to simulate an odor presentation, the synaptic inputs in the tuft of each mitral cell were activated at a random frequency in the range 2–10 Hz, corresponding to the natural sniffing frequency during exploratory behavior in rats (Kepecs et al., 2007). To illustrate the overall spiking activity, a typical 500 ms somatic membrane potential of M1, M3, and M5 during presentation of odor 1 is plotted in Figure 1D.
Synaptic Plasticity
The synaptic plasticity rule used was the same as in a previous paper (Migliore et al., 2007). Briefly, each component (inhibitory or excitatory) of each dendrodendritic synapse was independently modified according to the local membrane potential, of the lateral dendrite of the mitral cell or the granule cell synapse, to calculate the instantaneous presynaptic interspike interval (ISI). After each spike, the peak conductance, w, of a given mitral-to-granule or granule-to-mitral synapse was updated from its current value w{exc,inh},p = gsyn,{exc,inh}.S(p) to w{exc,inh},p+Δ = gsyn,{exc,inh}.S(p + Δ), where the function Δ = {0, +1, −1} followed a classical scheme (e.g., Bienenstock et al., 1982; Stanton, 1996) for long-term potentiation (LTP) or long-term depression (LTD) (schematically shown in Figure 1E) and the typical sigmoidal activation function S(p) (Figure 1F; Haykin, 1994) was defined as S(p) = 1/{1 + exp[(p − 25)/3]}. In this way, the weight (i.e., the peak synaptic conductance) of any given synapse could go from a fully depressed (for p ≈ 0) to a fully potentiated state (for p ≈ 50), or vice-versa, in about 50 consecutive spikes of the appropriate frequency. Unless explicitly noted otherwise, p = 0 at the beginning of a simulation, gsyn,exc = 2 nS, and gsyn,inh = 3 nS. To better recognize the variable size and extension of a group of potentiated synapses, we will refer to them as “clusters”.
The plasticity rule described above is non-Hebbian, since it changes a synaptic weight ignoring any postsynaptic activity. We have previously noted and discussed (Migliore et al., 2007) why the formation of active dendrodendritic synaptic clusters does not depend on the specific choice for the functional form used to update the synaptic weights. Nevertheless, for a set of simulations we explicitly tested a Hebbian mechanism, implemented by adding a random and independent background synaptic activity on all the granule cells (eliciting spikes at around 3 Hz) and applying the plasticity rule (Figures 1E,F) when the postsynaptic side was depolarized more than 5 mV, with respect to the resting potential.
It should also be stressed that the main aim of this paper was to investigate the possible functional roles of the mitral–granule cell synaptic network. For this reason, many additional mechanisms, such as those involving juxtaglomerular cells, tufted cells, and olfactory receptor neurons, among many others that can modulate/preprocess an odor input and its recognition, were not included at this stage. We have also made the assumption that mitral ↔ granule cells synapses can independently undergo bidirectional plastic changes (i.e., LTP and LTD) driven by mitral cell activity (i.e., odor exposure) as a robust means to cluster potentiated synapses around active mitral cells (Willhite et al., 2006; Migliore et al., 2007). To date, the experimental evidence for synaptic plasticity in the granule cell layer has been sparse, with only two studies demonstrating LTP and LTD of excitatory synapses on granule cells (Satou et al., 2006; Gao and Strowbridge, 2009).
Results
The network used for all simulations is schematically represented in Figure 2, where we indicate the relative location of the five mitral cells (M1–M5 at 100, 300, 500, 700, and 900 μm, respectively) and the 100 granule cells (5–995 μm). Representative reciprocal synapses are also explicitly indicated in the form GxMy, where x and y are the granule cell and mitral cell number, respectively. The network of interconnections between mitral cell lateral dendrites and granule cell radial dendrites is exceedingly complex. In order to begin to address their functional roles, we use the strategy of first reducing the three-dimensional matrix of the external plexiform layer to a one-dimensional network. This is based on the fact that along its extent a given lateral dendrite forms a one-dimensional linear set of interconnections with the granule cells to which it connects. For this reason, and for the sake of simplicity, our model cells were distributed in a linear, one-dimensional, space with mitral → granule cell synapses colocalized at the same dendritic granule cell location, and the vertical arrangement of the mitral cells used only for visualization. The column of granule cells observed in experiments (cf. Willhite et al., 2006) is thus represented by a cluster of 10 granule cells aligned below each mitral cell, forming a “glomerular unit” (Figure 2A, see bracket around G10) that covers the approximate linear dimension of a single glomerulus. To illustrate the synaptic network dynamics, the weight of each dendrodendritic synapse was represented with a color-coded doublet of squares, shown in Figures 2B1,B2 for the initial conditions. Active synapses are thus shown with different colors, according to their normalized peak synaptic conductance, as illustrated in Figure 2B3.
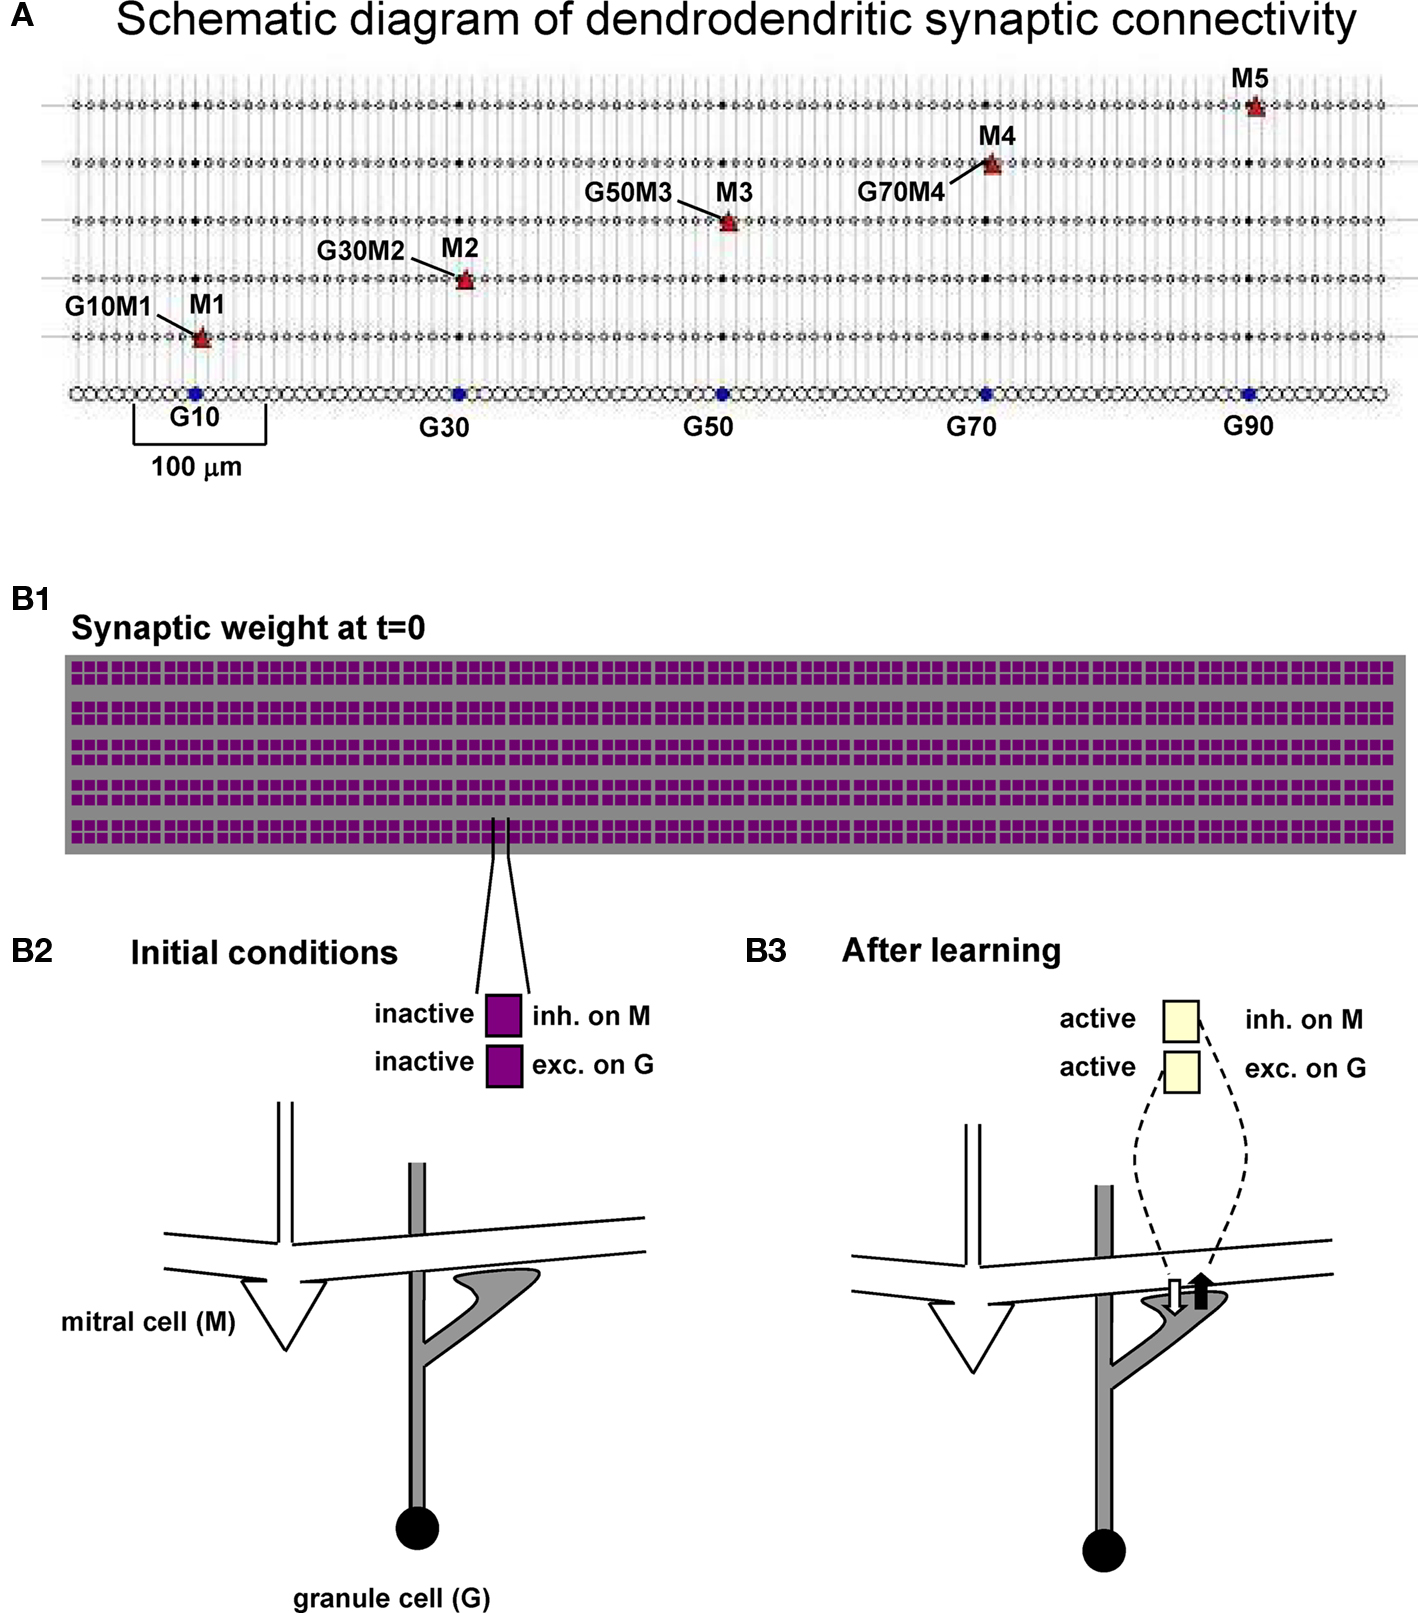
Figure 2. Dendrodendritic synapses form a network of mitral and granule cells. (A) Schematic diagram of the mitral and granule cell network used in all simulations; A few mitral cells and specific dendrodendritic synapses are indicated in the form GxMy, indicating a reciprocal synapse between Granule cell x and Mitral y. (B1) Scheme used to represent the normalized peak conductance (weight) of the excitatory and inhibitory component of all the dendrodendritic synapses during a simulation. (B2,B3) Each dendrodendritic synapse is represented by two color-coded squares, indicating the corresponding synaptic weight.
Clusters of potentiated inhibitory synapses were quantitatively identified by analyzing each GxMy synapse and its first neighbors across all mitral cells. The average value of the normalized weight of the 15 synapses identified by the set G{x − 1;x + 1}M{1;5} was thus calculated, and the synapse was considered part of a cluster if this value was above a predefined threshold of 0.5. The ensemble of synapses with an average weight value above threshold and overlapping neighbors formed a cluster.
Activity-Dependent Cluster Formation
We have previously shown that the formation of clusters of potentiated synapses (i.e., columns) around active mitral cells is a robust process, occurring under a wide range of synaptic peak conductance, the synaptic weight’s initial condition, frequency of odor input activation, and odor strength (see Figure 3 in Migliore et al., 2007). To analyze their possible functional roles, we first investigated the dynamics of the process during broader mitral cell activations (such as those in Figure 1C) that, although still very simplified, are more representative of the distributed glomerular activity generated by an input odor. A typical simulation is illustrated in Figure 3, where we used odors 3, 1, and 4 to activate the network. In order to simplify the analysis odors were activated one at a time for 20 s, a time long enough to allow stable cluster formation for a wide range of input strengths (discussed below, see Figure 5A). The raster plot of mitral cell activity (Figure 3A) clearly shows that the most active mitral cells are those corresponding to the preferred cell for each odor, i.e., M3, M1, and M4 for odors 3, 1, and 4, respectively. The snapshots of the synaptic weights taken at the end of each odor presentation are shown in Figures 3B1–B3, and illustrate the process of cluster formation, as synapses close to the soma of the most active mitral cells undergo LTP during odor presentation. This result shows that once a cluster is formed in response to strong odor stimulation it is not significantly altered during the presentation of different odors (compare the snapshots at different times in Figures 3B1–B3). During the simulation, the conductance of the granule cell synapses close to the soma of the most active mitral cell quickly reached the peak value and did not significantly change for the rest of the simulation, as shown in the typical examples plotted in Figure 3C. A movie of the entire simulation is shown in Supplementary Movie S1. Very similar results were obtained using a smoother S(p) function and frequency dependence for Δ (see Figure S1 in Supplementary Material). This shows that, under conditions of strong stimulation, the inhibitory conductances can be fully potentiated and maintained during different odor presentations.
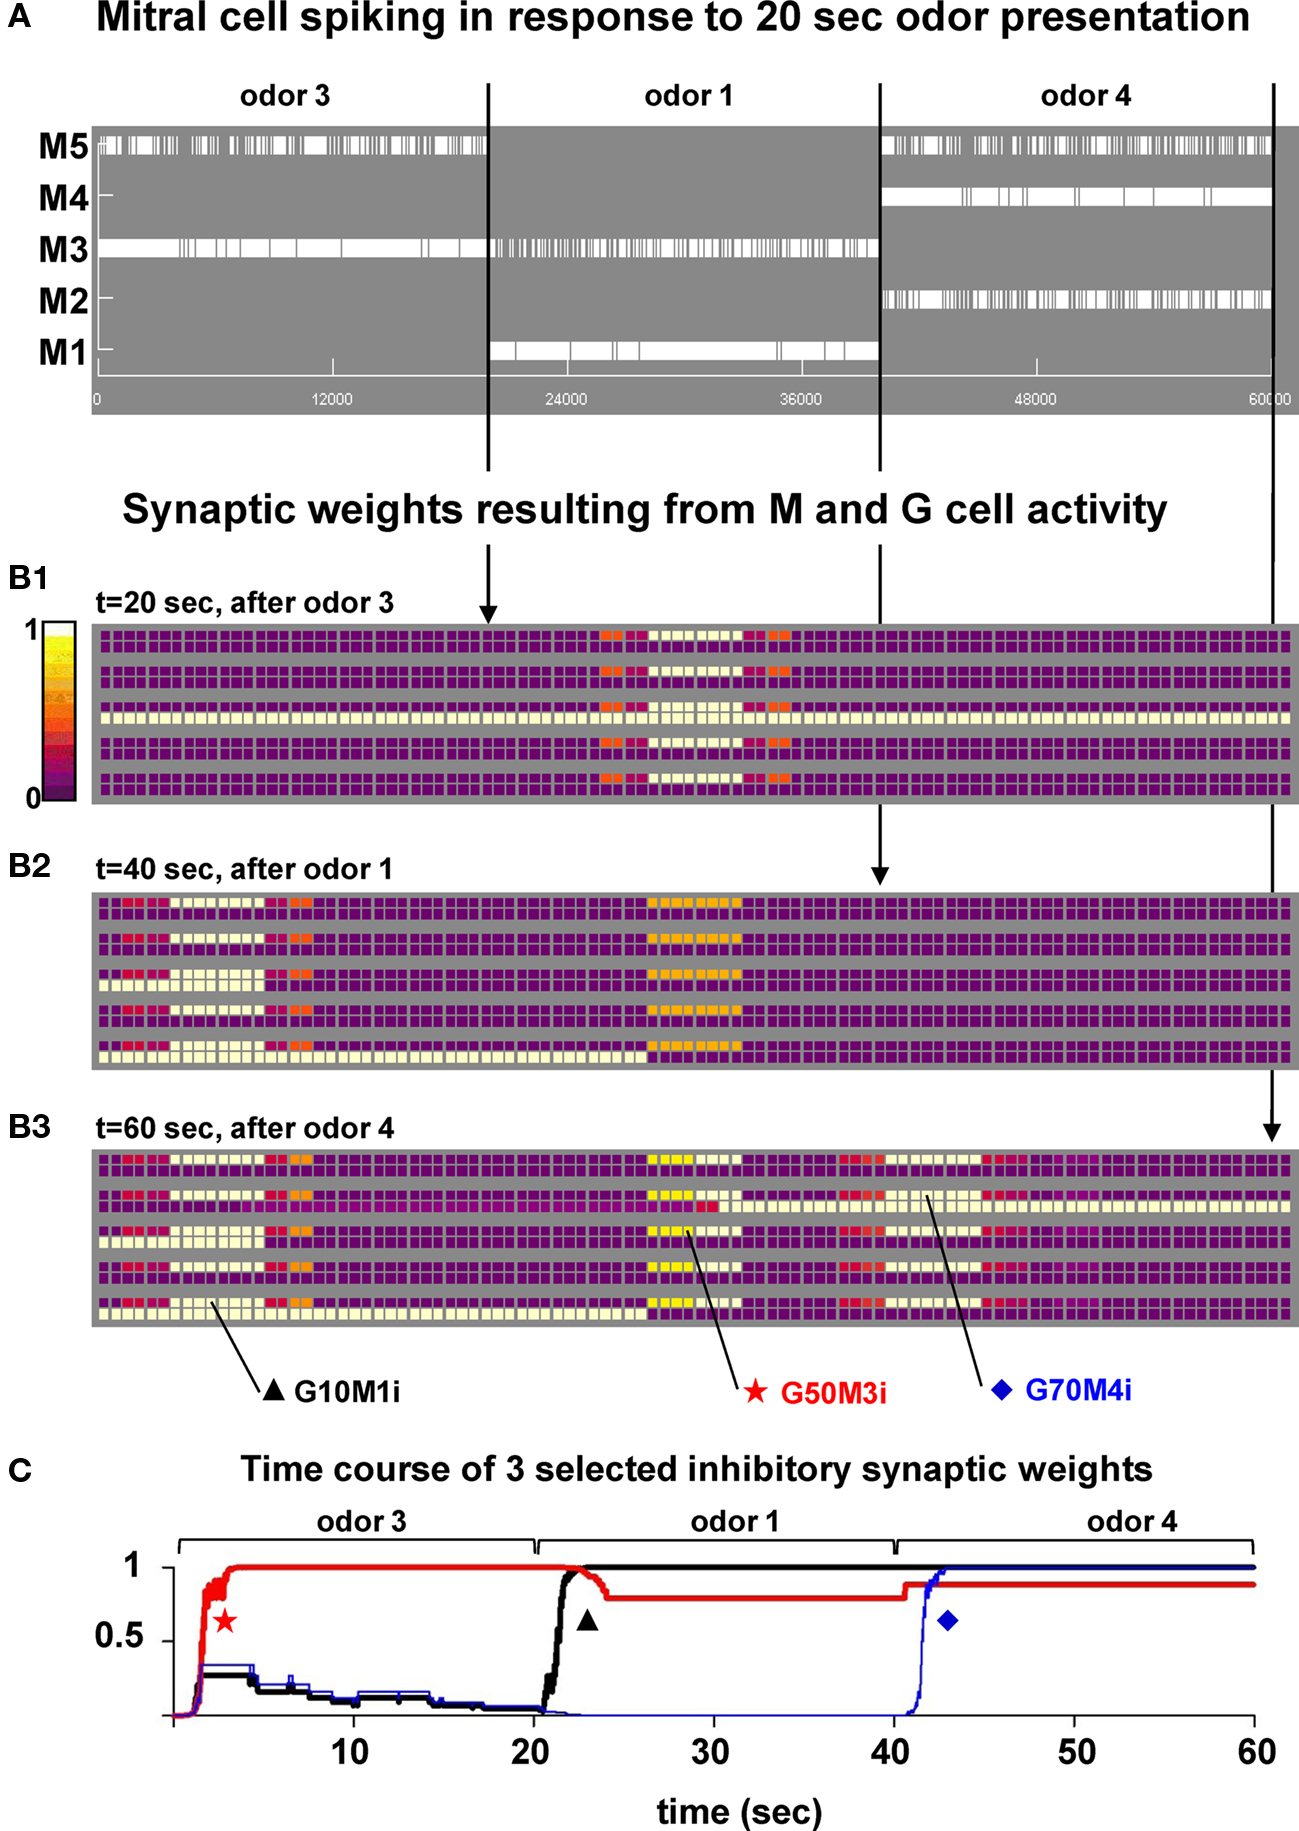
Figure 3. Presentation of a sequence of different odors generates clusters of mitral–granule cells synapses. (A) Mitral cell raster plot during a 60-s simulation in which odors 3, 1, and 4 were presented in sequence (20 s each). (B1–B3) Snapshots of the synaptic weights at different times during the simulation. (C) Time course of the normalized inhibitory weight for three synapses (G10M1i, G50M3i, and G70M4i). The location of the synapses in the network is indicated in (B3). A movie of this simulation is available as Supplementary Movie S1.
To gain more insight into the evolution of the synaptic clusters under different conditions, we carried out a 120-s simulation in which each odor was presented to the network for 2 s in a random order, and at a relatively lower strength (4–8 nS of total peak synaptic input for the preferred mitral cells). A movie of the entire simulation is available as Supplementary Movie S2. The overall mitral cell activity is shown as a raster plot in Figure 4A, and reflects the series of 2 s presentations of one random odor. The snapshots in Figures 4B1–B3, obtained at different simulation times, demonstrate how, in general, the synaptic network reflects the most recent history of mitral cell activation. This contrasts with the case of strong odor stimulation illustrated in Figure 3. Groups of granule cells close to the most recently and strongly activated mitral cells were fully potentiated but, in this case, clusters were formed (mostly around strongly active mitral cells) and destroyed (around weakly active mitral cells) according to the recent input history. A typical synaptic dynamics in which synapses are in general depressed with occasional periods in a potentiated state is illustrated by the time course of two representative inhibitory synapses (Figure 4C, G30M2i and G50M3i). Overall, these results on the network dynamics are consistent, and suggest a possible mechanism to interpret the experimental findings showing that remodeling of the reciprocal mitral–granule cell synapses is associated with long-term pheromonal memory (Matsuoka et al., 2004), and that recent odor experience shapes piriform cortical activity (Wilson, 2010).
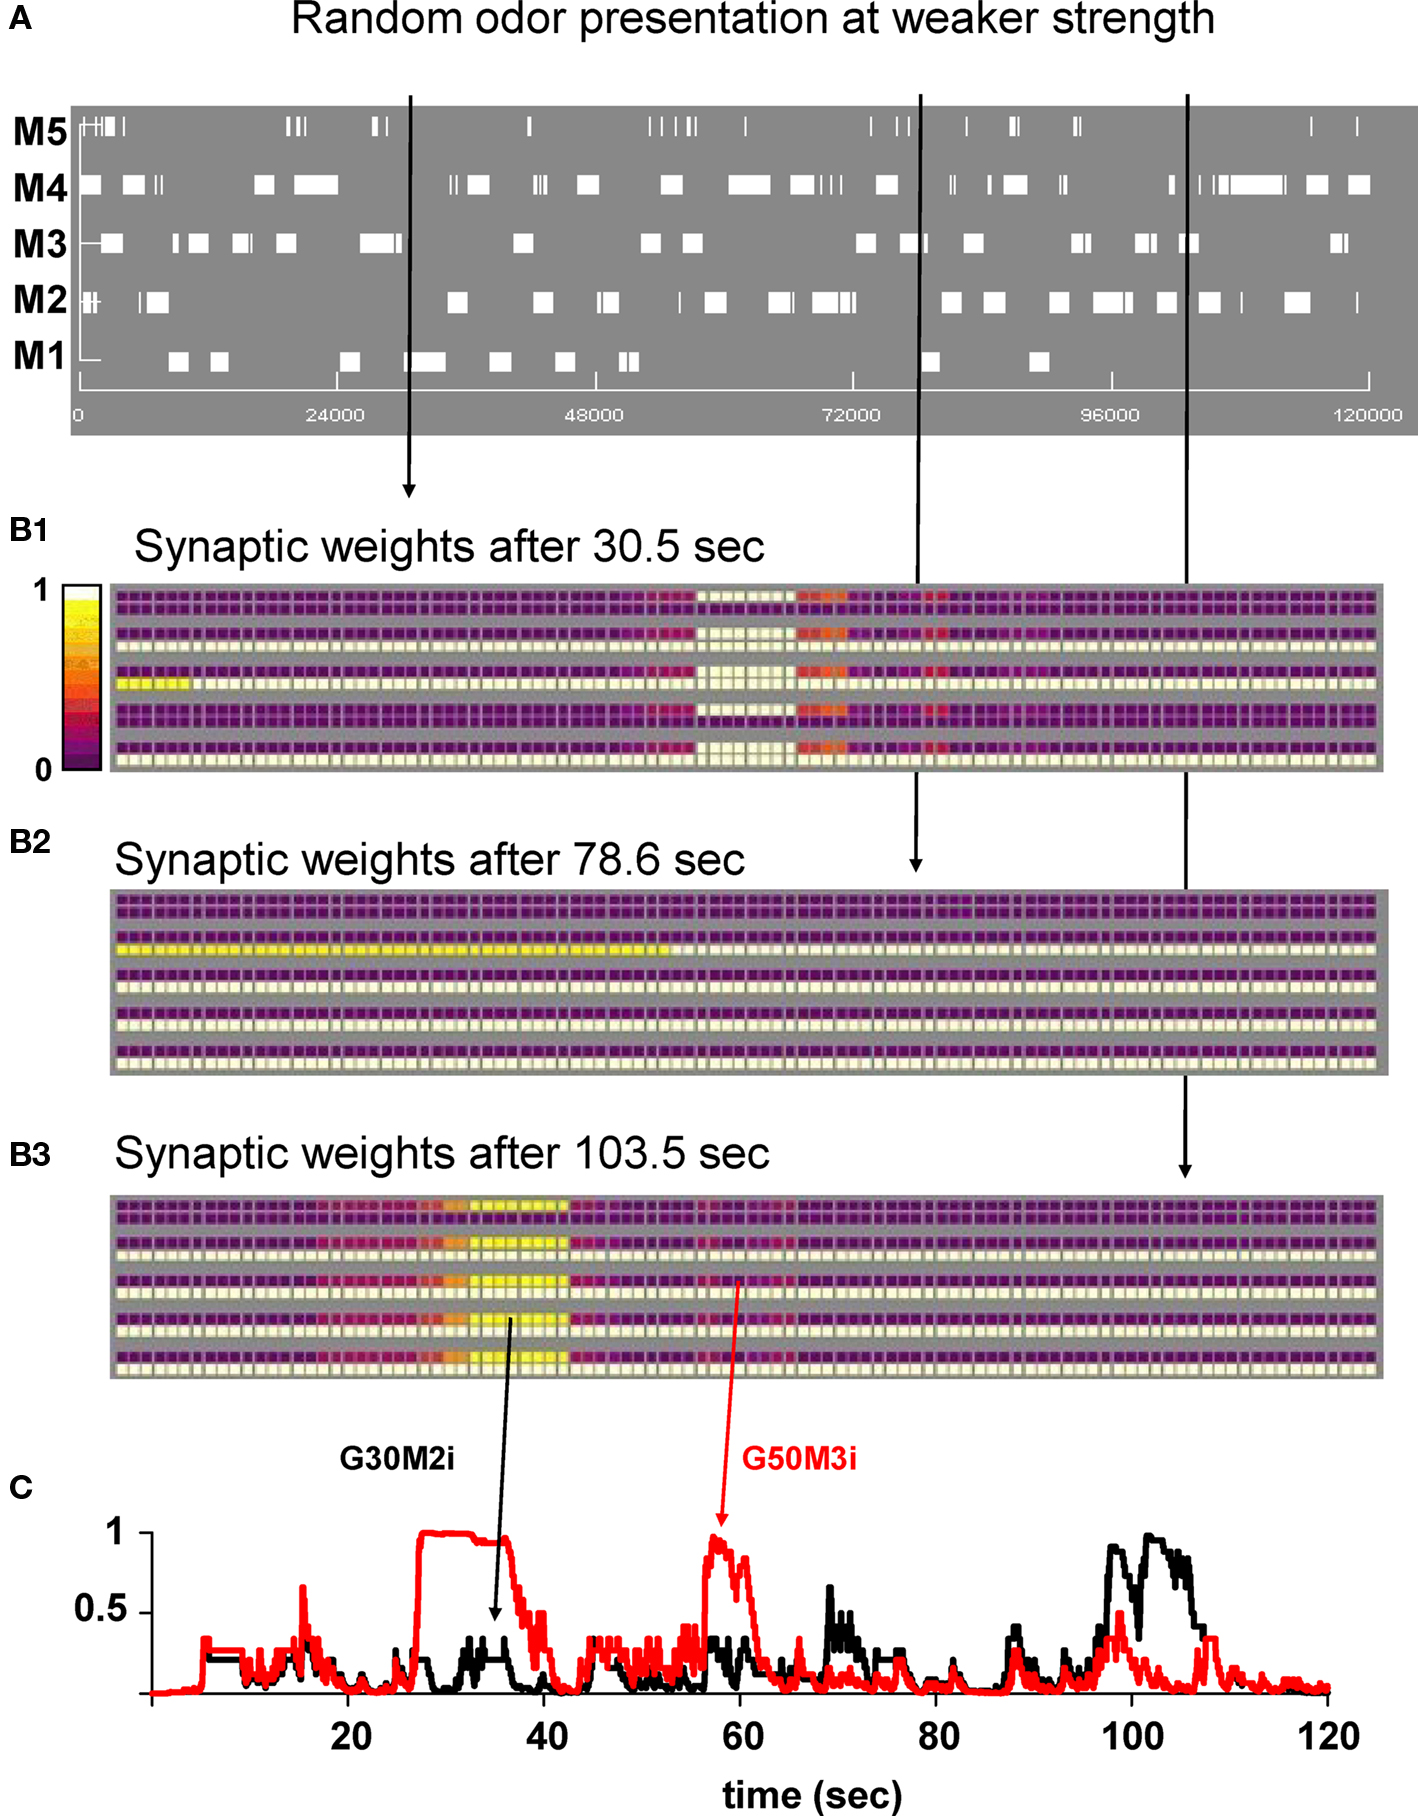
Figure 4. Random presentation of odors at lower strengths reveals dynamic cluster formation. (A) Mitral cell raster plot during a 120-s simulation. Odors were presented in a random sequence of 2 s frames. (B1–B3) Snapshots of the synaptic weights at different times during the simulation. (C) Time course of two inhibitory synapses (G30M2i and G50M3i) during the simulation. Arrows indicate their location on the weight snapshots. A movie of this simulation is available as Supplementary Movie S2.
Because in order to train the network we used odor inputs at random frequency and strength, the specific final weight configuration will, of course, depend on the specific activation patterns. These, in turn, will shape the mitral cell responses to subsequent test inputs, generating, in principle, an extremely large range of possible outputs. We will explore a few cases and their possible functional consequences later in the paper. However, it is important to test first if the emergence of distributed clusters (as observed in the experiments; Willhite et al., 2006) is robust with respect to the input pattern. We thus calculated the number of clusters of inhibitory weights as a function of the simulation time under different conditions, starting with the protocol used for Figure 3. Three different odors were sequentially presented to the network, for 20 s each. The average number of clusters (from five simulations) generated using random odor sequences was quite reliable at high input strength (Figure 5A, black and red lines) or using a Hebbian learning rule (Figure 5A, gray symbols), and corresponded to the activation times of the preferred mitral cells (3, every 20 s, one for each odor). This occurred for different odor strengths, until the input was too low (Figure 5A, blue) or too variable (Figure 5A, green) to generate enough mitral cell activity to drive a stable cluster formation. The same result (i.e., stable and robust formation of clusters around the most active mitral cells) was obtained using shorter time windows for a random sequence of all four odors at high input strengths (Figure 5B, black, red, and blue). Weaker inputs resulted in a lower average number of clusters (Figure 5B, green and orange), with a transient dynamics illustrated for a typical simulation in Figure 5B (right). These results demonstrate that the clustering of potentiated synapses can be a very stable and robust process during presentation of strong odors, dynamically adapting to reflect the past history of mitral cell activity during weaker inputs.
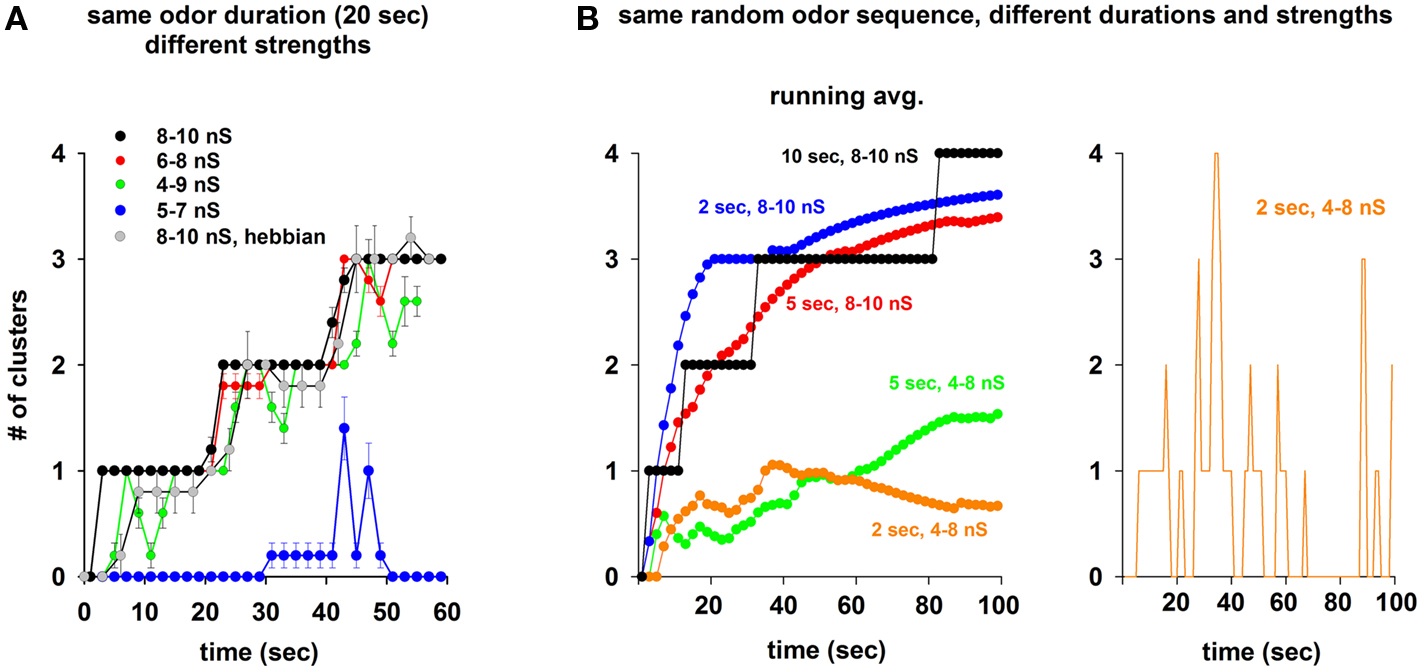
Figure 5. Persistence of the inhibitory synaptic clusters depends on odor strength and duration. (A) Average number of clusters during a random sequence of three odors activated for 20 s, using different odor strength ranges (different color lines), and a Hebbian learning rule (gray); average values for each trace were calculated from five simulations. (B) Left: Number of clusters during the same random sequence of all four odors activated for different time windows, and at different strengths; right: instantaneous number of clusters (1 s intervals) for the simulation using a time window of 2 s and a 4- to 8-nS strength.
Mixtures
We wished to understand the interaction between clusters of potentiated synapses and their possible functional roles. To this purpose, we used a mixture of two odors at different relative strengths (i.e., concentrations) and under different conditions to give insight into how the mitral–granule synaptic network operates in the presence of a mixture of odors that may or may not be already known to the network, i.e., in the presence or absence of the relative cluster(s) around the preferred mitral cell(s). We ran 50 s simulations in which a control odor (odor 1) was regularly activated at 2 Hz and at a random strength (8–10 nS for the preferred mitral cell). Odor 4 (Figure 6, left) or odor 2 (Figure 6, right) were added at different relative strengths, increasing every 10 s and asynchronously (±25 ms, roughly within one gamma cycle) activated at the same frequency (2 Hz). The simulations were carried out under three different conditions: (i) in the absence of the granule cell network (i.e., no clusters); (ii) in the presence of the clusters formed at the end of the simulation in Figure 3; (iii) in the presence of both the synaptic clusters and odor 1.
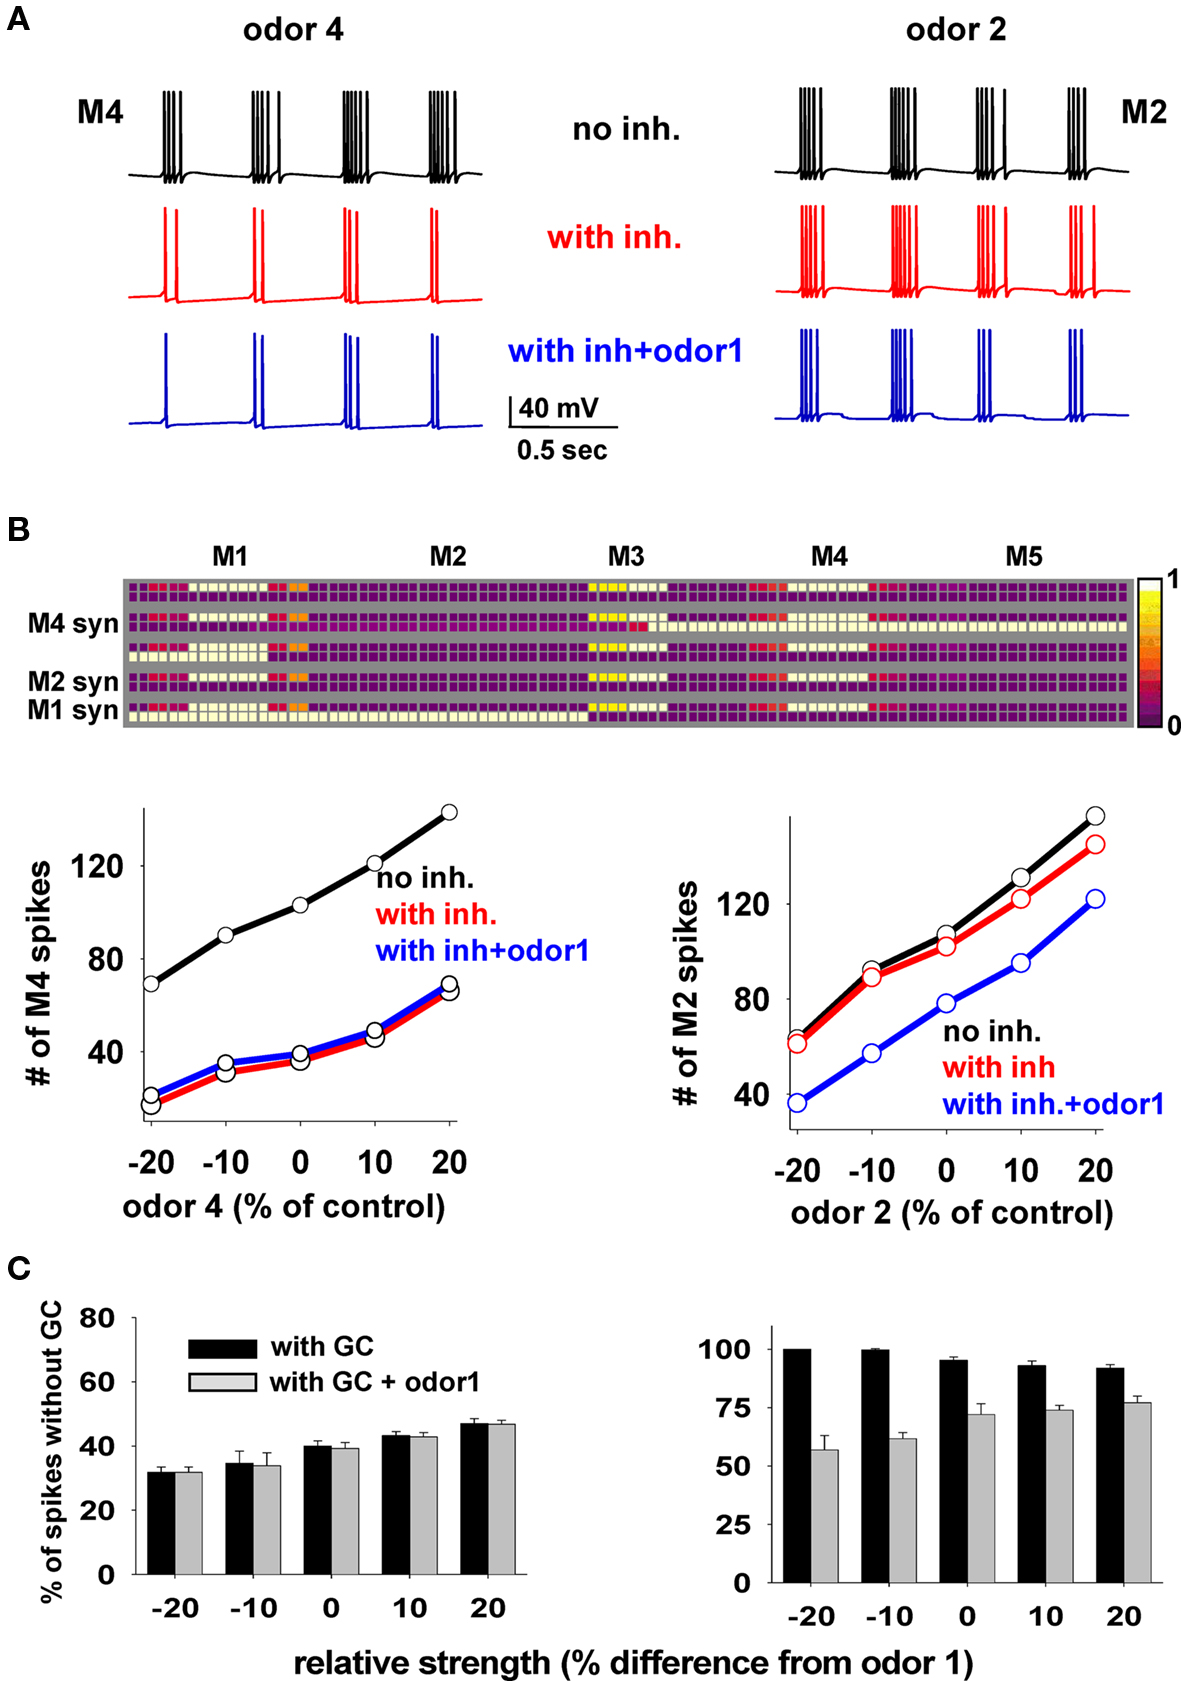
Figure 6. Mitral cell output in response to a mixture depends on whether the components have been learned. (A) Somatic membrane potential of M4 (left) or M2 (right) during a 2-s window in three cases (black, no granule cells; red, with granule cells and no odor 1; blue, with granule cells and odor 1). (B) Top: Synaptic weights after the training protocol used for Figure 3; bottom: number of M4 (left) or M2 (right) somatic spikes during presentation of different odor combinations as a function of odors 4 or 2 strength, respectively; in all cases control strength is the input used in the simulation for Figure 3; red lines are slightly shifted downward for full visibility. (C) Average number of spikes (±SD) from five simulations, for M4 (left) and M2 (right) with respect to control, as a function of relative odor strength under different conditions.
Typical M4 and M2 somatic traces under the different conditions and control strengths are shown in Figure 6A, and the total number of spikes elicited by M4 or M2 during 10 s periods at different strengths in Figure 6B. To explain these results, we first note the key features of the weight configuration after the specific training protocol of Figure 3 (reproduced in Figure 6B): (1) there are clusters of potentiated synapses around M1 and M4 but not around M2, since odors 1 and 4 are known to the network, (2) after training, M1 and M4 excitatory synapses were potentiated enough to activate the local inhibitory synapses during M1 or M4 activity, whereas excitatory synapses from M2 are inactive.
The results during the test simulations (Figure 6B) highlight a prediction of the model: odors on which the network has been previously trained (in our case, odors 1 and 4) do not affect each other (Figure 6B, left, compare blue and red lines). This occurs because the firing activity of both M1 and M4 will be strongly reduced in the same way by their local synaptic clusters, which are very similar. There will thus be little effect from M1 on M4 firing or vice-versa. A strikingly different result was obtained for the unknown odor 2. In this case, the firing activity of M2 (the preferred mitral cell for odor 2) was unaffected by the network (because M2 lacks a local cluster) whereas the presence of odor 1, activating the granule cell synapses on M2 lateral dendrites, significantly altered M2 activity (Figure 6B, right, compare red and blue plots). The results are summarized in Figure 6C, where we plot the average firing activity with respect to control (from five simulations) for M4 and M2, and confirm the clear difference in the mitral cell output.
Taken together, these results suggest that the output of mitral cells (and thus odor perception) during presentation of a mixture depends on which odor component is already known to the network, with the overall response determined by the complex, but predictable, interactions set up by the training process. This is consistent with the experimental findings suggesting that odor experience can change odorant perception by restructuring the inhibitory network (Mandairon et al., 2008).
Odor Perception for Inputs with Overlapping Glomerular Activation
To test further the possible functional consequences of the dynamical interaction caused by distributed synaptic clusters with odor mixtures, we implemented a protocol originally used to explore the perception of odor mixtures (Grossman et al., 2008). In the experiments, mice were trained with different mixtures of pentanal (pent) and hexanal (hex) and then tested to recognize either the mixture or a single component. They found that mice responded equally to the individual components after training with mixtures of high pent and low hex. This is an example of elemental perception as mice respond to either of the components of the mixture. Conversely, when the mixture contained high hex and low pent, mice responded to the mixture and hex alone. In this case, one considers that hex “overshadowed” pent (Grossman et al., 2008).
We tested whether the model could produce these effects. To implement the odor inputs activated by pent and hex (Grossman et al., 2008), we set up the inputs as schematically shown in Figure 7A, with M1 in common between the two odors to model the overlapping glomerular activation observed in the experiments. We then trained the network for 20 s with a mixture of high pent and low hex (with a 1.75:1 ratio). The final configuration of the synaptic weights is shown in Figure 7B. Since a high pent mixture strongly activated M1 and M2, two clusters were formed. Next, we tested mitral activation during a 10-s presentation of the mixture or the single components. Typical somatic traces and the average activation of M1 and M2 are shown in Figure 7C, which shows that under the different testing conditions mitral cells maintain the same relative activity, with M1 > M2 (reflecting the higher activation of the overlapping M1 cell). This is an example of mitral cell output that may give rise to an elemental behavioral response.
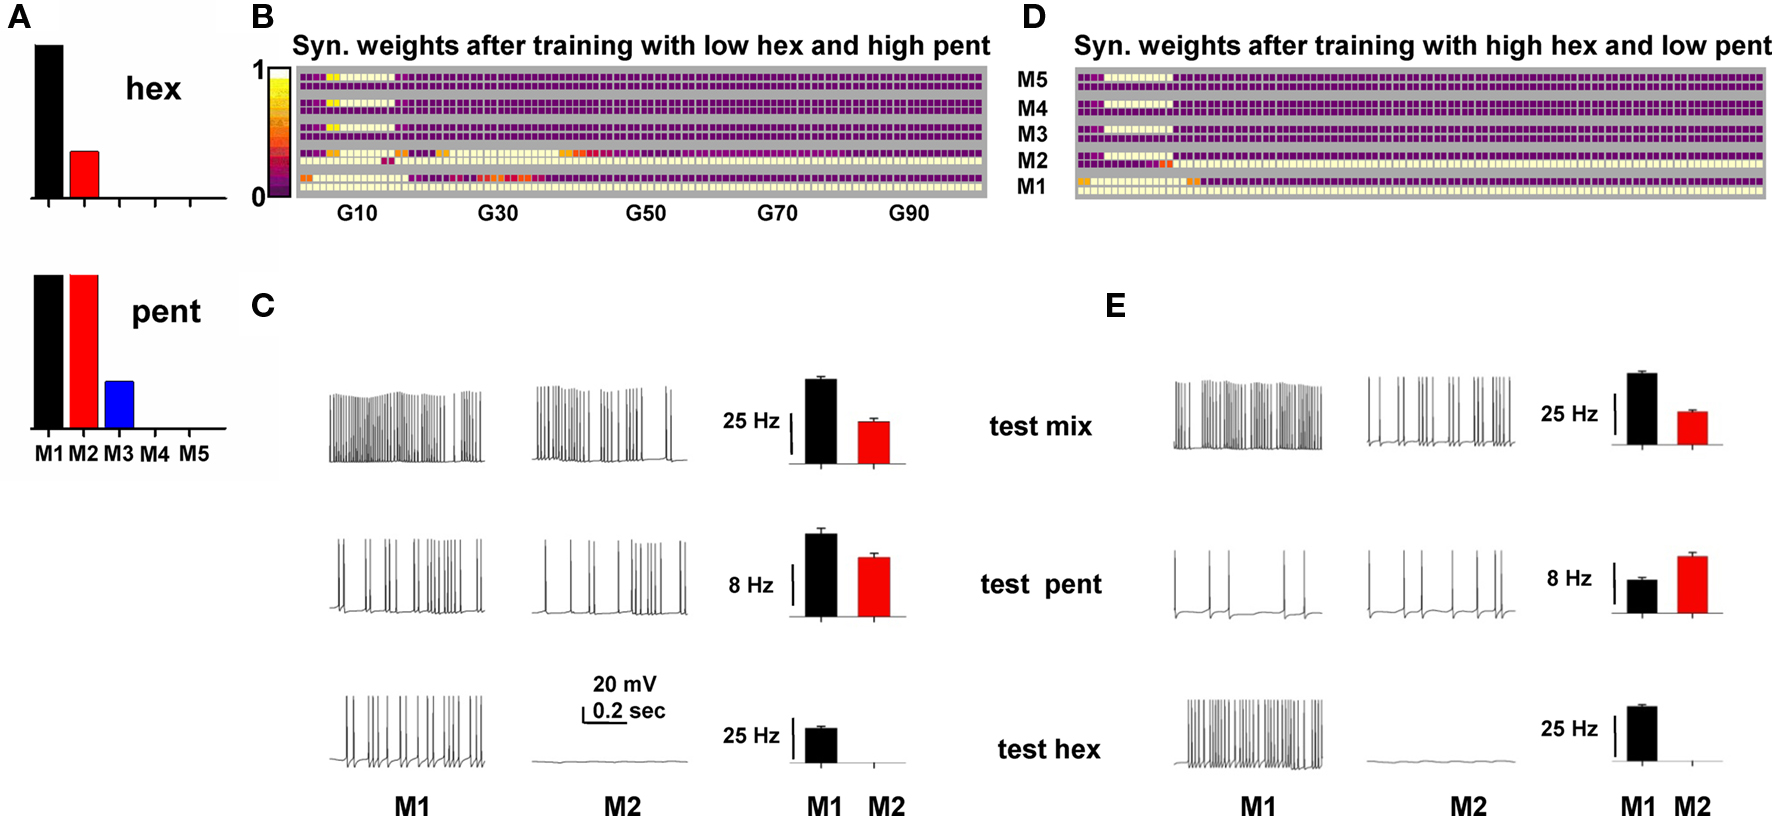
Figure 7. A network trained on an overlapping binary mixture can demonstrate both elemental and overshadowing responses. (A) Relative strength of the synaptic input on the tuft of each mitral cell (M1–M5) to model hexanal (hex) and pentanal (pent) simulation. (B) Synaptic weights after training with a mixture of low hex and high pent. (C) Typical somatic traces (left) and average firing rate for M1 and M2 (right) during simulations testing a mixture with high pent (top), only pent (middle), or only hex (bottom) at training strengths. (D) Top: Synaptic weights after training with a mixture of high hex and low pent. (E) Typical somatic traces (left) and average firing rate for M1 and M2 (right) during simulations testing a mixture with high hex (top), only pent (middle), or only hex (bottom) at training strengths.
Training with a high hex mixture, however, resulted in only one cluster (Figure 7D) because only M1 received a strong input. When the network was tested for only pent, even if both M1 and M2 mitral cells were activated by about the same input (see pent in Figure 7A), their relative firing was not only different, but also qualitatively different from the mixture (Figure 7E, compare histograms for test mix and test pent). This occurred because the single cluster of granule cell synapses results in a differential inhibitory action on M1 and M2 (M1 receives a stronger inhibition from its cluster). The asymmetric inhibition on M1 and M2 thus caused a different relative firing, suggesting a possible source of confusion in the perception for pent (but not for hex), as observed in the experiments. These results suggest that a basic mechanism underlying the experimentally observed “overshadowing” and elemental response for overlapping glomerular inputs (Grossman et al., 2008) can be explained in terms of the specific synaptic clusters formed during the training period.
Perception of Mixtures with Non-Overlapping Glomerular Activation
It is known that the individual components of a mixture cannot always be recognized (synthetic/configural vs analytical/elemental response, Wilson and Stevenson, 2003; Wiltrout et al., 2003) even if they are structurally very different (Kay et al., 2005) and thus presumably activating non-overlapping glomeruli. Based on the previous results, we can predict that this may occur when one of the components, through the pattern of synaptic clusters generated during the training period, can differentially modulate the firing activity of the mitral cells involved with the other component.
In Figure 8 we show the simulation findings for such a case. Training with a mixture composed of two odors activating non-overlapping mitral cells (Figure 8A) generated the map shown in Figure 8B. By inspection one can predict the behavioral experiment by noting two conditions. Firstly, M2 APs, backpropagating along its lateral dendrites and through the active excitatory connections, will activate the granule cells close to the soma of both M1 and M5, generating approximately the same inhibitory activity on both M1 and M5. Secondly, at the end of the training period with the mixture, most of the M5 excitatory synapses ended up in an active state, whereas most of those from M1 (and especially those close to the M5 soma) were depressed (compare M1 and M5 bottom squares around M5 and M1 somatic locations, respectively), creating an asymmetry in the reciprocal M1–M5 lateral inhibition.
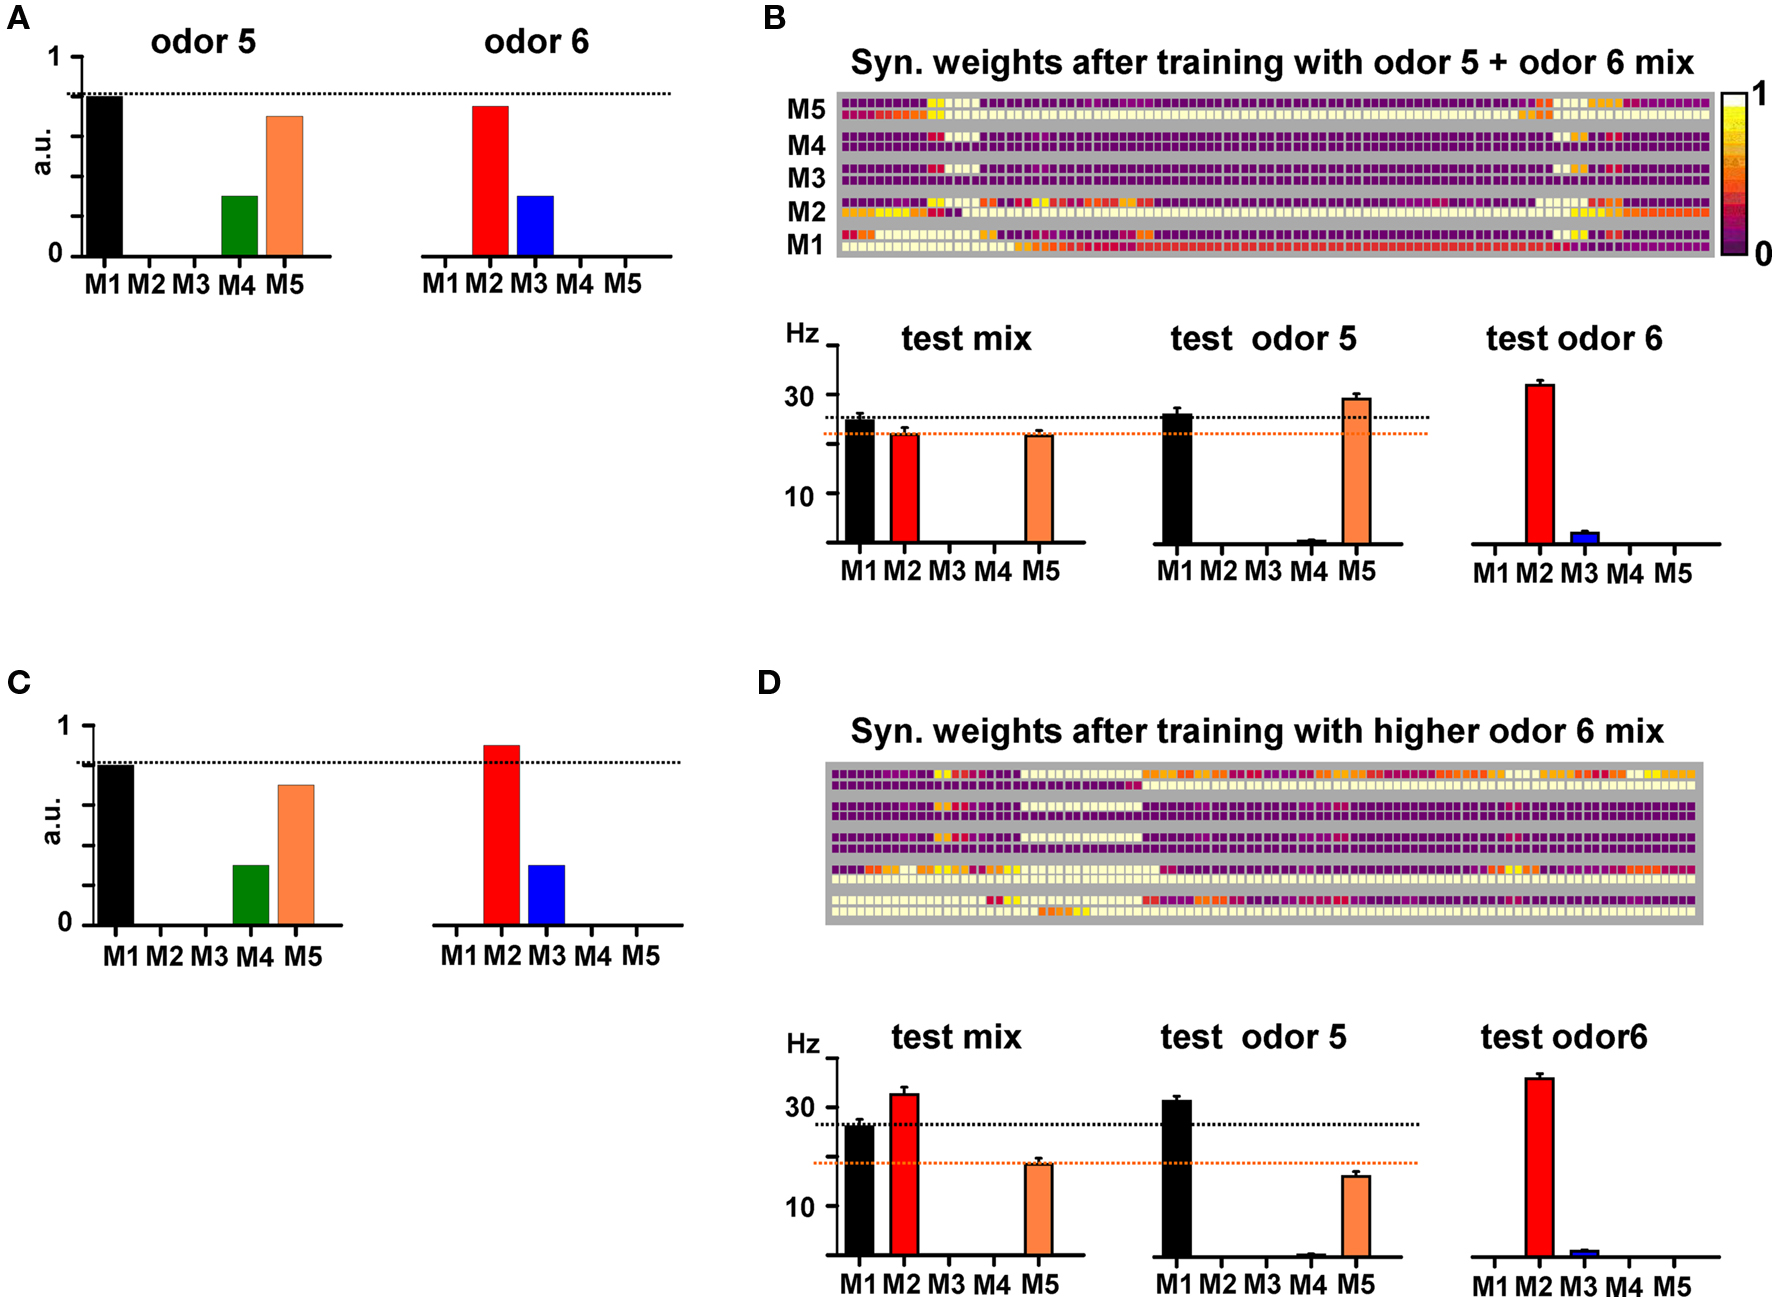
Figure 8. Synthetic or analytical properties of non-overlapping binary mixtures depend on cluster interactions. (A) Relative strengths of the synaptic inputs on the tufts of each mitral cell (M1–M5) to model two odors activating different mitral cells (i.e., non-overlapping glomeruli). (B) Top: Synaptic weights after training with the mixture of the two odors; bottom: average firing rate for M1–M5 during 6, 10 s, simulations testing the mixture (left), only odor 5 (middle), or only odor 6 (bottom) at training strengths. (C) Relative mitral cell (M1–M5) as in (A) but with M2 activity increased by 20%. (D) Top: Synaptic weights after training with the mixture of the two odors; bottom: average firing rate for M1–M5 during 6, 10 s, simulations testing the mixture (left), only odor 5 (middle), or only odor 6 (right) at training strengths.
The resulting effect is illustrated in Figure 8B (bottom), where we show the average firing rates of M1 and M5 under the different testing conditions. During the presentation of the mixture, M2 is active and the relative firing of M1 and M5 is such that M1 > M5 (Figure 8B, “test mix”). Presentation of odor 5 alone (and thus with M2 inactive) resulted in a relative firing that was qualitatively different from that obtained during presentation of the mixture, with M1 < M5 (Figure 8B, “test odor 5”). We suggest that this difference may result in a synthetic/configural response, and can generate a difficulty in the elemental perception of odor 5. Training with a relatively small difference in mitral cell activation for one of the odors (a 20% higher input to M2 in this case, Figure 8C) caused a different final weight configuration (Figure 8D) that does not alter M1 and M5 relative activity during testing the mixture or odor 5 (M1 > M5, in both cases, Figure 8D, bottom), thus maintaining an elemental response. Taken together, these results suggest how basic experimental findings on odor mixture perception, with non-overlapping glomerular activation (Kay et al., 2005), can be explained in terms of the specific pattern of synaptic clusters formed in training the mitral–granule microcircuits. They are consistent with the recent discovery of discrete transitions in activity patterns generated by gradual changes in odor mixture components (Niessing and Friedrich, 2010).
Discussion
Distributed clusters of active synapses between mitral and granule cells have been revealed by viral tracing studies (Willhite et al., 2006), but the dynamics of their formation and the possible functional roles are unknown. This is the first study showing how and why they may be involved in the mechanisms underlying behavioral findings. The model suggests that while cluster formation occurs with higher odor concentrations and longer durations, they may be formed and lost in a dynamic process with weaker stimulation and brief durations. We hypothesize that this is similar to what occurs in normal development (Mouret et al., 2009; Nissant et al., 2009) and daily odor exposure (Buonviso and Chaput, 2000), and consistent with several experimental findings suggesting that the olfactory bulb network undergoes a high level of plasticity in response to odor inputs (e.g., reviewed in Mandairon and Linster, 2009; Mandairon et al., 2008; ). It is important to note that, in our model, cluster formation is an emergent network property rather than an imposed mechanism. As discussed in a previous paper (Migliore et al., 2007), it depends on the dynamical interaction between mitral cell APs, during their backpropagation along the lateral dendrites, with the much larger population of granule cells more or less uniformly distributed in the external plexiform layer. For this reason, the results discussed here could not have been obtained with reduced models using single compartment or point neurons.
Although the model is able to explain and predict a number of behavioral findings, more experimental investigations are needed to confirm our predictions. However, they are already consistent at the network level with several recent experimental studies. The dynamic activity-dependent process of cluster formation and interaction is consistent with the physiological findings of Mandairon et al. (2008), who found that Zif268 expression in granule cells overlapped patterns of activated glomeruli to different odors. Evidence for remodeling of dendrodendritic synapses as a mechanism for the plasticity such as that used here was found by Matsuoka et al. (2004), associated with the persistence of pheromonal memory at the bulbar level. The clusters of activated reciprocal synapses are also consistent with the non-stochastic distribution of mitral–granule connectivity calculated from experiments (Phillips et al., 2009), and similar to those observed in experiments using pseudorabies virus in vivo to trace connectivity (Willhite et al., 2006). While a recent investigation on in vitro cultured neurons (McCarthy et al., 2009) suggested that this technique might alter neuronal connectivity, its relevance for in vivo findings remains unknown.
General Predictions
The consequences of the network self-organization and cluster interactions provided insight into the experimental suggestions that mixtures give highly variable and in some cases unpredictable results in terms of odor maps and their relation to odor perception (Grossman et al., 2008). An in-depth analysis of each effect is outside the scope of this first report, which should be considered a proof of principle study of the computational properties of the mitral–granule synaptic network. From this point of view, the general operating principles and the most intriguing predictions of the model are summarized in Figure 9, for the cases of odors with overlapping (Figure 9A) or non-overlapping fields (Figure 9B). In all the cases discussed below, the key point is to consider how and where clusters are formed, and how they can modulate mitral cell activity.
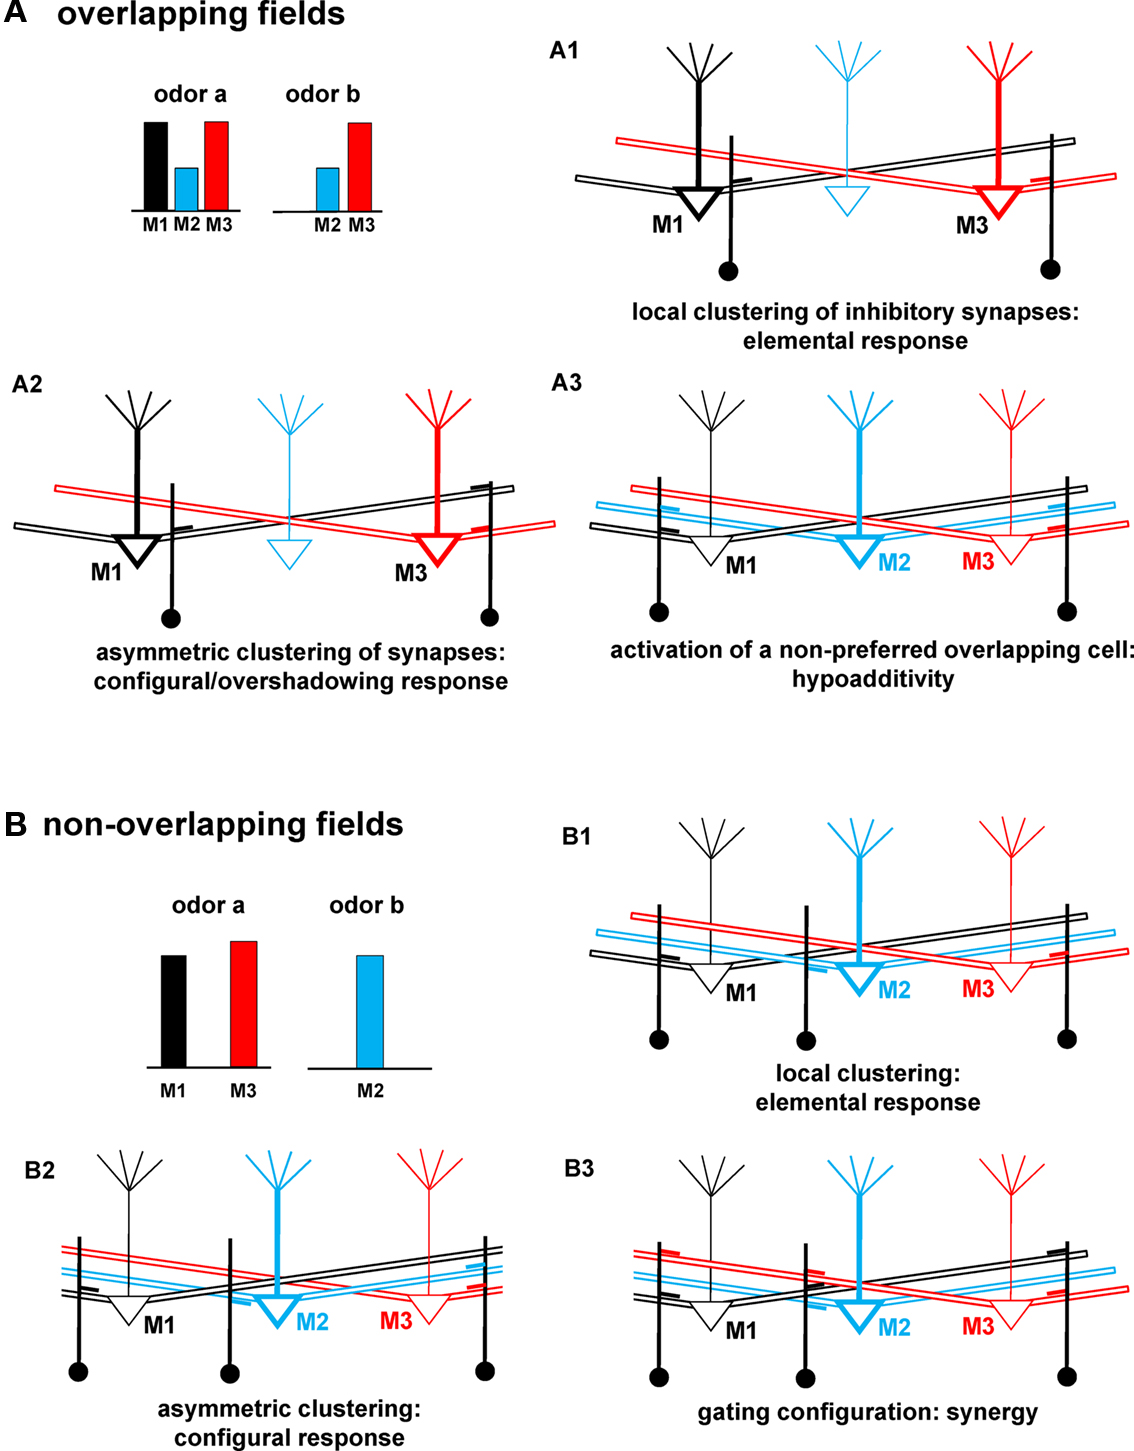
Figure 9. Schematic correlation between network connectivity and odor qualities. (A) Schematic representation of mitral–granule connectivity after a training period with an odor mixture (odor a and odor b) activating overlapping mitral cells (M2 and M3), and resulting in: (A1) no interaction between M1 and M3, (A2) an asymmetric interaction between M1 and M3, note the lack of local synapses close to the soma of M1, (A3) synapses activated by a non-preferred cell (M2, blue). (B) Schematic of mitral–granule connectivity after training with an odor mixture (odor a and odor b) activating non-overlapping mitral cells, and resulting in: (B1) no interaction between mitral cells, (B2) an asymmetric interaction of M2 with M1, note the lack of M2 (blue) synapses close to the soma of M1, (B3) a gating configuration of the cluster close to M2. For clarity, mitral cells not primarily involved in a specific effect for each case are drawn with lighter lines.
In general, when clusters of synapses are formed in such a way that the most active mitral cells receive the same amount of inhibition (as schematically drawn in Figure 9A1), an elemental/analytical response can be predicted. A mixture would be perceived as a simple sum of its unmixed components, even if the odors activate an overlapping subset of mitral cells. In the example of Figure 9A1, mitral cells will activate only local (feedback) inhibition. Their activity will thus be independent of each other, since APs propagating along the lateral dendrites will not activate inhibition on different mitral cells. When clusters are such that a differential inhibition could be generated on different mitral cells, as illustrated in Figure 9A2, a configural/synthetic perception may be observed. This also provides the basis for overshadowing. In this case, M3 would be inhibited by M1 activity but not vice-versa, as discussed for Figure 7. Hypoadditivity, i.e., when a mixture is perceived as less intense than predicted by the simple sum of its components (Schiet and Cain, 1990; Duchamp-Viret et al., 2003), can occur when the clusters around the preferred mitral cells (M1 and M3, in Figure 9A3) include synapses activated by cells, which are significantly recruited only during the presentation of the mixture (such as M2, in Figure 9A3). Note that for this case to occur the non-preferred cell (M2, in the example of Figure 9A3) must form granule cell synapses along its lateral dendrites, rather than locally. This can be relatively easy to obtain, since M2 is a non-preferred cell. Its own activity will thus not be strong enough to generate a stable local cluster, but the APs propagating in the lateral dendrites will sum with activity of the preferred cells, contributing to cluster formation around them. The model thus predicts how both elemental and configural responses can be obtained from odors activating an overlapping set of glomeruli, suggesting how specific arrangements of synaptic clusters may modulate mitral–granule cell interaction leading to the emergence of specific odor qualities.
If two odors activate a non-overlapping set of mitral cells (Figure 9B), an elemental response is predicted when clusters include only feedback synapses, i.e., formed by the preferred mitral cells close to their soma but not along their lateral dendrites, as schematically shown in Figure 9B1. This can be expected to be the most common case. As clusters begin to include synapses that can be activated by other mitral cells, the model predicts effects that can shed some light on more elusive behavioral results. For example, if one of the odor components forms synapses close to some (but not all) of the mitral cells activated by the other component a configural/synthetic perception can be obtained (e.g., as shown in Figure 9B2, note the blue synapse on M3 but not on M1). This kind of asymmetric connectivity (discussed in Figure 8) could be obtained when odors generate strong, but non-uniform, activity in different mitral cells (note the slightly different activation of M1 with respect to M3 for odor a in Figure 9B). In this case, M2 activity may contribute to generating enough local firing to activate the granule cell synapse on its lateral dendrite close to M3 but not close to M1. Finally, the model predicts what kind of cluster configuration can result in synergy, a clear but rarely found type of odor detection (Miyazawa et al., 2008): it can occur when one of the odor components (odor b in our case) is presented in a concentration high enough to form a local cluster including synapses with cells activated by the other component (synapses close to M2 in Figure 9B3). In this case, APs backpropagating along the lateral dendrites of M1 and M3 can be blocked when they reach M2 (Migliore and Shepherd, 2008). This can significantly reduce lateral inhibition between M1 and M3, increasing their overall firing rate.
Conclusions
In summary, experimental and modeling studies have provided evidence for a clustered granule cell organization within the olfactory bulb, and for some of the properties of the mitral–granule cell synapses and interactions. However, experiments have lacked explanations for how these interactions operate at a global scale to preprocess an odor input before it is conveyed to the olfactory cortex for further elaboration. Our model network has provided first insights into the functional roles of a mechanism that involves activity-dependent plasticity and underlies the formation of clusters of granule cells synaptically connected to mitral cells that are in turn connected to specific glomeruli. The present study posits an experimentally testable dynamic process of cluster formation and interaction that is able to elucidate several puzzling, and so far unexplained, experimental findings regarding odor perception.
Conflict of Interest Statement
The authors declare that the research was conducted in the absence of any commercial or financial relationships that could be construed as a potential conflict of interest.
Acknowledgments
We are grateful for support from National Institutes of Health Grant DC-00086, the Human Brain Project (National Institute of Deafness and Other Communication Disorders, National Institute of Mental Health, National Institute of Neurological Disorders and Stroke, and National Institute on Aging) to Gordon M. Shepherd; NINDS Grant NS11613 to Michael L. Hines. We also thank the CINECA consortium (Bologna, Italy) for access to their 5120-processor IBM linux cluster, and the DEISA Consortium (www.deisa.eu), co-funded through the EU FP6 project RI-031513 and the FP7 project RI-222919, for granting access to a 40960-processor IBM BlueGene/P within the DEISA Extreme Computing Initiative. Michele Migliore thanks Salvatore Pappalardo for technical assistance.
References
Bienenstock, E. L., Cooper, L. N., and Munro, P. W. (1982). Theory for the development of neuron selectivity: orientation specificity and binocular interaction in visual cortex. J. Neurosci. 2, 32–48.
Buonviso, N., and Chaput, M. (2000). Olfactory experience decreases responsiveness of the olfactory bulb in the adult rat. Neuroscience 95, 325–332.
Cang, I., and Isaacson, J. S. (2003). In vivo whole-cell recording of odor-evoked synaptic transmission in the rat olfactory bulb J. Neurosci. 23, 4108–4116.
Chen, W. R., Midtgaard, J., and Shepherd, G. M. (1997). Forward and backward propagation of dendritic impulses and their synaptic control in mitral cells. Science 278, 463–467.
Chen, W. R., Shen, G. Y., Shepherd, G. M., Hines, M. L., and Midtgaard, J. (2002). Multiple modes of action potential initiation and propagation in mitral cell primary dendrite. J. Neurophysiol. 88, 2755–2764.
Chen, W. R., Xiong, W., and Shepherd, G. M. (2000). Analysis of relations between NMDA receptors and GABA release at olfactory bulb reciprocal synapses. Neuron 25, 625–633.
Debarbieux, F., Audinat, E., and Charpak, S. (2003). Action potential propagation in dendrites of rat mitral cells in vivo. J. Neurosci. 23, 5553–5560.
Duchamp-Viret, P., Duchamp, A., and Chaput, M. A. (2003). Single olfactory sensory neurons simultaneously integrate the components of an odour mixture. Eur. J. Neurosci. 18, 2690–2696.
Fantana, A. L., Soucy, E. R., and Meister, M. (2008). Rat olfactory bulb mitral cells receive sparse glomerular inputs. Neuron 59, 802–814.
Gao, Y., and Strowbridge, B. W. (2009). Long-term plasticity of excitatory inputs to granule cells in the rat olfactory bulb. Nat. Neurosci. 12, 731–733.
Gervais, R., Buonviso, N., Martin, C., and Ravel, N. (2007). What do electrophysiological studies tell us about processing at the olfactory bulb level? J. Physiol. (Paris) 101, 40–45.
Gire, D. H., and Schoppa, N. E. (2009). Control of on/off glomerular signaling by a local GABAergic microcircuit in the olfactory bulb. J. Neurosci. 29, 13454–13464.
Gottfried, J. A., Winston, J. S., and Dolan, R. J. (2006). Dissociable codes of odor quality and odorant structure in human piriform cortex. Neuron 49, 467–479.
Grossman, K. J., Mallik, A. K., Ross, J., Kay, L. M., and Issa, N. P. (2008). Glomerular activation patterns and the perception of odor mixtures. Eur. J. Neurosci. 27, 2676–2685.
Hines, M., and Carnevale, N. T. (1997). The NEURON simulation environment. Neural Comput. 9, 1179–1209.
Johnson, B. A., and Leon, M. (2007). Chemotopic odorant coding in a mammalian olfactory system, J. Comp. Neurol. 503, 1–34.
Johnson, B. A., Woo, C. C., Hingco, E. E., Pham, K. L., and Leon, M. (1999). Multidimensional chemotopic responses to n-aliphatic acid odorants in the rat olfactory bulb. J. Comp. Neurol. 409, 529–548.
Kadohisa, M., and Wilson, D. A. (2006). Separate encoding of identity and similarity of complex familiar odors in piriform cortex. Proc. Natl. Acad. Sci. U.S.A. 103, 15206–15211.
Kay, L. M., Crk, T., and Thorngate, J. (2005). A redefinition of odor mixture quality. Behav. Neurosci. 119, 726–733.
Kepecs, A., Uchida, N., and Mainen, Z. F. (2007). Rapid and precise control of sniffing during olfactory discrimination in rats. J. Neurophysiol. 98, 205–213.
Linster, C., and Cleland, T. A. (2004). Configurational and elemental odor perception can arise from local inhibition. J. Comput. Neurosci. 16, 39–47.
Linster, C., and Hasselmo, M. E. (1999). Behavioral responses to aliphatic aldehydes can be predicted from known electrophysiological responses of mitral cells in the olfactory bulb. Physiol. Behav. 66, 497–502.
Linster, C., Johnson, B. A., Yue, E., Morse, A., Xu, Z., Hingco, E. E., Choi, Y., Choi, M., Messiha, A., and Leon, M. (2001). Perceptual correlates of neural representations evoked by odorant enantiomers. J. Neurosci. 21, 9837–9843.
Mandairon, N., Didier, A., and Linster, C. (2008). Odor enrichment increases interneurons responsiveness in spatially defined regions of the olfactory bulb correlated with perception. Neurobiol. Learn. Mem. 90, 178–184.
Mandairon, N., and Linster, C. (2009). Odor perception and olfactory bulb plasticity in adult mammals. J. Neurophysiol. 101, 2204–2209.
Matsuoka, M., Kaba, H., Moriya, K., Yoshida-Matsuoka, J., Costanzo, R. M., Norita, M., and Ichikawa, M. (2004). Remodeling of reciprocal synapses associated with persistence of long-term memory. Eur. J. Neurosci. 19, 1668–1672.
McCarthy, K. M., Tank, D. W., and Enquist, L. W. (2009). Pseudorabies virus infection alters neuronal activity and connectivity in vitro. PLoS Pathog. 5, e1000640. doi: 10.1371/journal.ppat.1000640.
Migliore, M., Inzirillo, C., and Shepherd, G. M. (2007). Learning mechanism for column formation in the olfactory bulb. Front. Integr. Neurosci. 1:12. doi: 10.3389/neuro.07/012.2007.
Migliore, M., and Shepherd, G. M. (2008). Dendritic action potentials connect distributed dendrodendritic microcircuits. J. Comput. Neurosci. 24, 207–221.
Miyazawa, T., Gallagher, M., Preti, G., and Wise, P. M. (2008). Synergistic mixture interactions in detection of perithreshold odors by humans. Chem. Senses 33, 363–369.
Moreno, M. M., Linster, C., Escanilla, O., Sacquet, J., Didier, A., and Mandairon, N. (2009). Olfactory perceptual learning requires adult neurogenesis, Proc. Natl. Acad. Sci. U.S.A. 106, 17980–17985.
Mouret, A., Lepousez, G., Gras, J., Gabellec, M. M., and Lledo, P. M. (2009). Turnover of newborn olfactory bulb neurons optimizes olfaction. J. Neurosci. 29, 12302–12314.
Niessing, J., and Friedrich, R. W. (2010). Olfactory pattern classification by discrete neuronal network states. Nature 465, 47–52.
Nissant, A., Bardy, C., Katagiri, H., Murray, K., and Lledo, P. M. (2009). Adult neurogenesis promotes synaptic plasticity in the olfactory bulb. Nat. Neurosci. 12, 728–730.
Olson, M. J. (1994). An interaction model for odor quality and intensity. Percept. Psychophys. 55, 363–372.
Phillips, M. E., Kim, D. H., Chang, A. Y., Patel, H. K., Shepherd, G. M., and Willhite, D. C. (2009). Mitral and tufted cell connections to granule cells of the rat olfactory bulb are sparse and non-stochastic. Soc. Neurosci. Abstr. 555.11.
Rubin, B. D., and Katz, L. C. (1999). Optical imaging of odorant representations in the mammalian olfactory bulb. Neuron 23, 499–511.
Satou, M., Hoshikawa, R., Sato, Y., and Okawa, K. (2006). An in vitro study of long-term potentiation in the carp (Cyprinus carpio L.) olfactory bulb. J. Comp. Physiol. A Neuroethol. Sens. Neural. Behav. Physiol. 192, 135–150.
Schiet, F. T., and Cain, W. S. (1990). Odor intensity of mixed and unmixed stimuli under environmentally realistic conditions. Perception 19, 123–132.
Schoppa, N. E., and Westbrook, G. L. (1999). Regulation of synaptic timing in the olfactory bulb by an A-type potassium current. Nat. Neurosci. 2, 1106–1113.
Schoppa, N. E., and Westbrook, G. L. (2002). AMPA autoreceptors drive correlated spiking in olfactory bulb glomeruli. Nat. Neurosci. 5, 1194–1202.
Soucy, E. R., Albeanu, D. F., Fantana, A. L., Murthy, V. N., and Meister, M. (2009). Precision and diversity in an odor map on the olfactory bulb. Nat. Neurosci. 12, 210–220.
Stanton, P. K. (1996). LTD, LTP, and the sliding threshold for long-term synaptic plasticity. Hippocampus 6, 35–42.
Willhite, D. C., Nguyen, K. T., Masurkar, A. V., Greer, C. A., Shepherd, G. M., and Chen, W. R. (2006). Viral tracing identifies distributed columnar organization in the olfactory bulb. Proc. Natl. Acad. Sci. U.S.A. 103, 12592–12597.
Wilson, D. A. (2010). Single-unit activity in piriform cortex during slow-wave state is shaped by recent odor experience. J. Neurosci. 30, 1760–1765.
Wilson, D. A., and Stevenson, R. J. (2003). Olfactory perceptual learning: the critical role of memory in odor discrimination. Neurosci. Biobehav. Rev. 27, 307–328.
Wiltrout, C., Dogra, S., and Linster, C. (2003). Configural and nonconfigural interactions between odorants in binary mixtures. Behav. Neurosci. 117, 236–245.
Xiong, W., and Chen, W. R. (2002). Dynamic gating of spike propagation in the mitral cell lateral dendrites. Neuron 34, 115–126.
Yokoi, M., Mori, K., and Nakanishi, S. (1995). Refinement of odor molecule tuning by dendrodendritic synaptic inhibition in the olfactory bulb. Proc. Natl. Acad. Sci. U.S.A. 92, 3371–3375.
Keywords: olfactory bulb, realistic model, odor perception, network, mitral cell, granule cell
Citation: Migliore M, Hines ML, McTavish TS and Shepherd GM (2010) Functional roles of distributed synaptic clusters in the mitral–granule cell network of the olfactory bulb. Front. Integr. Neurosci. 4:122. doi: 10.3389/fnint.2010.00122
Received: 28 June 2010;
Paper pending published: 22 July 2010;
Accepted: 01 September 2010;
Published online: 20 September 2010
Edited by:
Rui M. Costa, Instituto Gulbenkian de Ciência, PortugalReviewed by:
Sidney A. Simon, Duke University, USARodrigo F. Oliveira, George Mason University, USA
Copyright: © 2010 Migliore, Hines, McTavish and Shepherd. This is an open-access article subject to an exclusive license agreement between the authors and the Frontiers Research Foundation, which permits unrestricted use, distribution, and reproduction in any medium, provided the original authors and source are credited.
*Correspondence: Michele Migliore, Institute of Biophysics, National Research Council, via Ugo La Malfa 153, 90146 Palermo, Italy. e-mail: michele.migliore@pa.ibf.cnr.it