“Stay tuned”: inter-individual neural synchronization during mutual gaze and joint attention
- 1Division of Cerebral Integration, Department of Cerebral Research, National Institute for Physiological Sciences, Okazaki, Aichi, Japan
- 2Department of Physiological Sciences, School of Life Sciences, The Graduate University for Advanced Studies, Hayama, Kanagawa, Japan
- 3Japan Science and Technology Agency/Research Institute of Science and Technology for Society, Tokyo, Japan
- 4Department of Psychiatry, University of Fukui, Fukui, Japan
- 5Biomedical Imaging Research Center, University of Fukui, Fukui, Japan
Eye contact provides a communicative link between humans, prompting joint attention. As spontaneous brain activity might have an important role in the coordination of neuronal processing within the brain, their inter-subject synchronization might occur during eye contact. To test this, we conducted simultaneous functional MRI in pairs of adults. Eye contact was maintained at baseline while the subjects engaged in real-time gaze exchange in a joint attention task. Averted gaze activated the bilateral occipital pole extending to the right posterior superior temporal sulcus, the dorso-medial prefrontal cortex, and the bilateral inferior frontal gyrus. Following a partner’s gaze toward an object activated the left intraparietal sulcus. After all the task-related effects were modeled out, inter-individual correlation analysis of residual time-courses was performed. Paired subjects showed more prominent correlations than non-paired subjects in the right inferior frontal gyrus, suggesting that this region is involved in sharing intention during eye contact that provides the context for joint attention.
Introduction
Humans possess remarkable social attention capability, which allows us to detect other people’s focus of attention, orient our own attention to the same location, and draw inferences regarding their goals (Nummenmaa and Calder, 2009)). Eye contact and joint attention are prominent examples of social attention. Eye contact provides the main mode of establishing a communicative link between humans (Farroni et al., 2002)). Joint attention refers to the ability to “coordinate attention between interactive social partners with respect to objects or events in order to share an awareness of the objects or events” (Mundy et al., 1986)). Joint attention engages the mechanisms involved in the attribution of intentions and goals to others, generally known as theory-of-mind (Baron-Cohen et al., 1996)). Joint attention emerges as early as 6–12 months of age (Corkum and Moore, 1998)). Lack of joint attention is one of the most reliable early abnormalities in children with autism (Baron-Cohen et al., 1996)). According to the model proposed by Baron-Cohen (1995), joint attention is composed of intention detection (ID), eye-direction detection (EDD), a shared attention mechanism (SAM), and a theory-of-mind mechanism (ToMM). ID is equivalent to the animacy percept (i.e., to identify something as an agent). EDD is important to accomplish the dyadic representation specifying the intentional relation between the agent and object through gaze direction, and SAM can integrate the dyadic representation and the self’s current perceptual state to build a triadic representation. Neural substrates of social attention, particularly through eye gaze, have been studied extensively, often highlighting the importance of the posterior superior temporal sulcus (pSTS). Bilateral removal of the STS region in macaques produces impaired perception of gaze direction without significantly affecting facial identity perception (Heywood and Cowey, 1992)). Recent human functional MRI (fMRI) studies have identified the involvement of the pSTS and the adjacent middle and superior temporal gyri in social perception through eye movement (Allison et al., 2000)). Gaze processing extends well beyond the STS to include the amygdala (Kawashima et al., 1999); George et al., 2001)), the inferior temporal (Wicker et al., 1998)), parietal (Wicker et al., 1998); Hoffman and Haxby, 2000); Hooker et al., 2003); Mosconi et al., 2005); Calder et al., 2007)), medial prefrontal, and anterior cingulate cortices (Calder et al., 2002); Williams et al., 2005)), and other frontal regions (Hooker et al., 2003); Mosconi et al., 2005); Williams et al., 2005); Bristow et al., 2007)). These different regions seem to process different aspects of the visual and social properties of gaze. Other regions of relevance include the temporal areas implicated in face perception (i.e., the fusiform gyrus and STS), the fronto-parietal attention regions (i.e., the superior parietal lobule [SPL] and frontal eye field [FEF]), and areas implicated in emotion and social cognition (i.e., the amygdala and medial prefrontal cortex [mPFC]) (Nummenmaa and Calder, 2009)). Thus, research in gaze processing is now outlining the neural basis of social attention, the cognitive components of which include the directing of social attention, attention shifting, processing of emotional reactions, and attribution of mental states.
However, much of the previous work on social attention has been conducted using static images or schematic stimuli. Experiments on social attention perception using dynamic stimuli are needed to establish the role of these regions in processing stimuli that are more naturalistic (Nummenmaa and Calder, 2009)). Furthermore, there are no reported neuroimaging studies of the simultaneous measurement of the brain activities of two persons engaged in actual eye contact and joint attention with inter-subjective sharing.
At the psychological level, the state of eye contact is regarded as sharing the intention in the action of looking (Searle, 2001)). As the gaze direction explicitly indicates the target of the attention, eye contact is also regarded as sharing the attention directed toward one another. Furthermore, eye contact is related to emotion sharing. Human infants and adults interact with one another dyadically by looking, touching, smiling, and vocalizing toward each other in turn-taking sequences, called protoconversations, that are held together by the exchange of emotions (Trevarthen, 1979); Hobson, 2002)). During protoconversations, infants gaze into the eyes of the partner face-to-face in what is called mutual gazing. This face-to-face visual engagement is a universal feature of adult–infant interactions within the human species (Keller et al., 1988); Trevarthen, 1993)). Thus, eye contact is implicated in the sharing of various psychological states, making inter-subjectivity possible.
The shared space of the common psychological ground obtained by eye contact might provide a communicative context in which joint attention can be initiated (Farroni et al., 2002)). This is implied by the fact that the adult’s initial eye contact prior to looking at an object is the critical cue to indicate joint attention, seen in infants as young as 9 months old (Striano et al., 2006)). Thus, to investigate the neural mechanisms of inter-subjective sharing such as eye contact and joint attention, it is crucial to evaluate the neural activities of the two people facing each other.
Brain function could be conceptualized as an operating-on-its-own system with external factors modulating rather than determining the operation of the system, in contrast to the perspective that it is an input–output system primarily driven by interaction with the external world (Fox et al., 2007)). Support for the intrinsic perspective on brain function comes from studies of intrinsic brain activity, or activity present even in the absence of task performance or stimuli. This intrinsic brain activity is not random noise, but is specifically correlated between related neurons (Tsodyks et al., 1999)) and cortical columns (Kenet et al., 2003)), and within widely distributed neuro-anatomical systems (Biswal et al., 1995); Lowe et al., 1998); Hampson et al., 2002); Greicius et al., 2003); Fox et al., 2005)). Given this spatial organization at multiple levels, intrinsic brain activity might have an important role in coordination of neuronal processing within the brain (Fox et al., 2007)). Expanding this concept, we speculate that their inter-subject synchronization might represent the inter-subject sharing of psychological states during eye contact.
We hypothesized that the eye-contact-specific, psychologically shared state, in which the individuals “stay tuned” (Nishitani et al., 2005)), is neurally represented by the inter-subject correlation of the intrinsic brain activities. In the case of joint attention, eye contact provides the common psychological ground for the sharing intention upon which joint attention could be initiated by the eye movement of the counterpart, which in turn elicits the task-related activation. Thus, the state of sharing through eye contact is expected to be represented by the synchronization of the intrinsic neural activity after the elimination of the task-related-activation component (Fox et al., 2006)). By comparing the pair-specific correlation of the intrinsic brain activity during eye contact with that of non-paired subjects who are not in eye contact, we should be able to depict the neural substrates of the shared intentional state over and above the stimulus-driven effects.
To test this hypothesis, we conducted simultaneous fMRI (hyper-scanning) of two subjects (Montague et al., 2002)) while they were engaged in joint attention tasks with eye contact as the baseline. Joint attention was functionally defined as the reciprocal attending to the same object by two persons, i.e., when one partner follows the direction of the other’s gaze toward that object in space (Materna et al., 2008)). We depicted the neural synchronization by the inter-subject correlation of the “innovations.” The innovations are the residual time-courses of the neural activities obtained by modeling out the task-related effects and other confounding effects. Innovation is the term that is used for the residual of a dynamical model, in which the system depends on its past. The innovation of the blood oxygen level-dependent (BOLD) signals is thought to include task-non-specific neural fluctuations, corresponding to spontaneous brain activity (Fox et al., 2007)). Thus, the innovation is a useful source of intrinsic dynamic information within different brain regions (Riera et al., 2004); Fair et al., 2007)). Previously, variance/covariance structures of innovation processes of multiple regions of the brain were suggested to represent inter-regional neuronal connectivity (Riera et al., 2004)), which is a dynamic generalization of the standard connectivity analysis by means of correlations. We applied this concept to the inter-subject neural synchronization. We made use of the correlations between pairs of innovations at voxels in different brain regions to construct measures that summarized interpersonal influences. In the design of the present study, the baseline was the eye-contact condition. Thus, the interpersonal correlation of the innovations of the paired persons, compared with those of the non-paired persons, represented the eye contact effect.
Materials and Methods
Participants
Sixty-six healthy male volunteers (age = 23.6 ± 3.7 [mean ± SD] years; 1.5T, n = 33 [age = 23.8 ± 4.0]; 3T, n = 33 [age = 23.3 ± 3.7]) participated in this study. The MRI data for 14 pairs were excluded due to technical difficulties with the MRI or eye camera, so that 19 pairs were used for further analysis (1.5T, n = 19 [age = 25.6 ± 4.8]; 3T, n = 19 [age = 23.8 ± 3.5]). Fifteen pairs had never seen the partner before the fMRI experiment whereas four pairs of participants had had some exposure to each other (average of exposure period = 3.4 years). All participants were right-handed according to the Edinburgh handedness inventory (Oldfield, 1971)). None of the participants had a history of neurological or psychiatric illness. The protocol was approved by the ethical committee of Fukui University (Japan), and the experiments were undertaken in compliance with national legislation and the Code of Ethical Principles for Medical Research Involving Human Subjects of the World Medical Association (the Declaration of Helsinki). All participants gave their written informed consent to participate in the study.
Experimental Design and Task Procedure
To measure the neural activation during the on-line exchange of eye signals between the pairs of participants, two MRI scanners were combined with an infrared eye-tracking system (NAC Image Technology Inc., Tokyo, Japan) (Figure 1, top). Infrared cameras captured video images of each participant’s eyes and eyebrows, which were transferred to a personal computer (Dimension 9200, Dell Computer Co., Round Rock, TX, USA). The visual stimuli of the ball targets generated by Presentation software (Neurobehavioral Systems, Albany, CA, USA) and the images of the participant’s faces around their eyes were combined by a screen splitter (MV-40F, FOR-A, Tokyo, Japan). The combined visual stimuli were projected using a liquid crystal display (LCD) projector (TH-AE900, Matsushita Electric Industrial Co. Ltd., Osaka, Japan) onto a half-transparent screen that sat on the scanner bed approximately 304 and 255 cm from the participant’s eyes, and were presented at a visual angle of 7.1° × 10.4° on both the 1.5T and 3T screens.
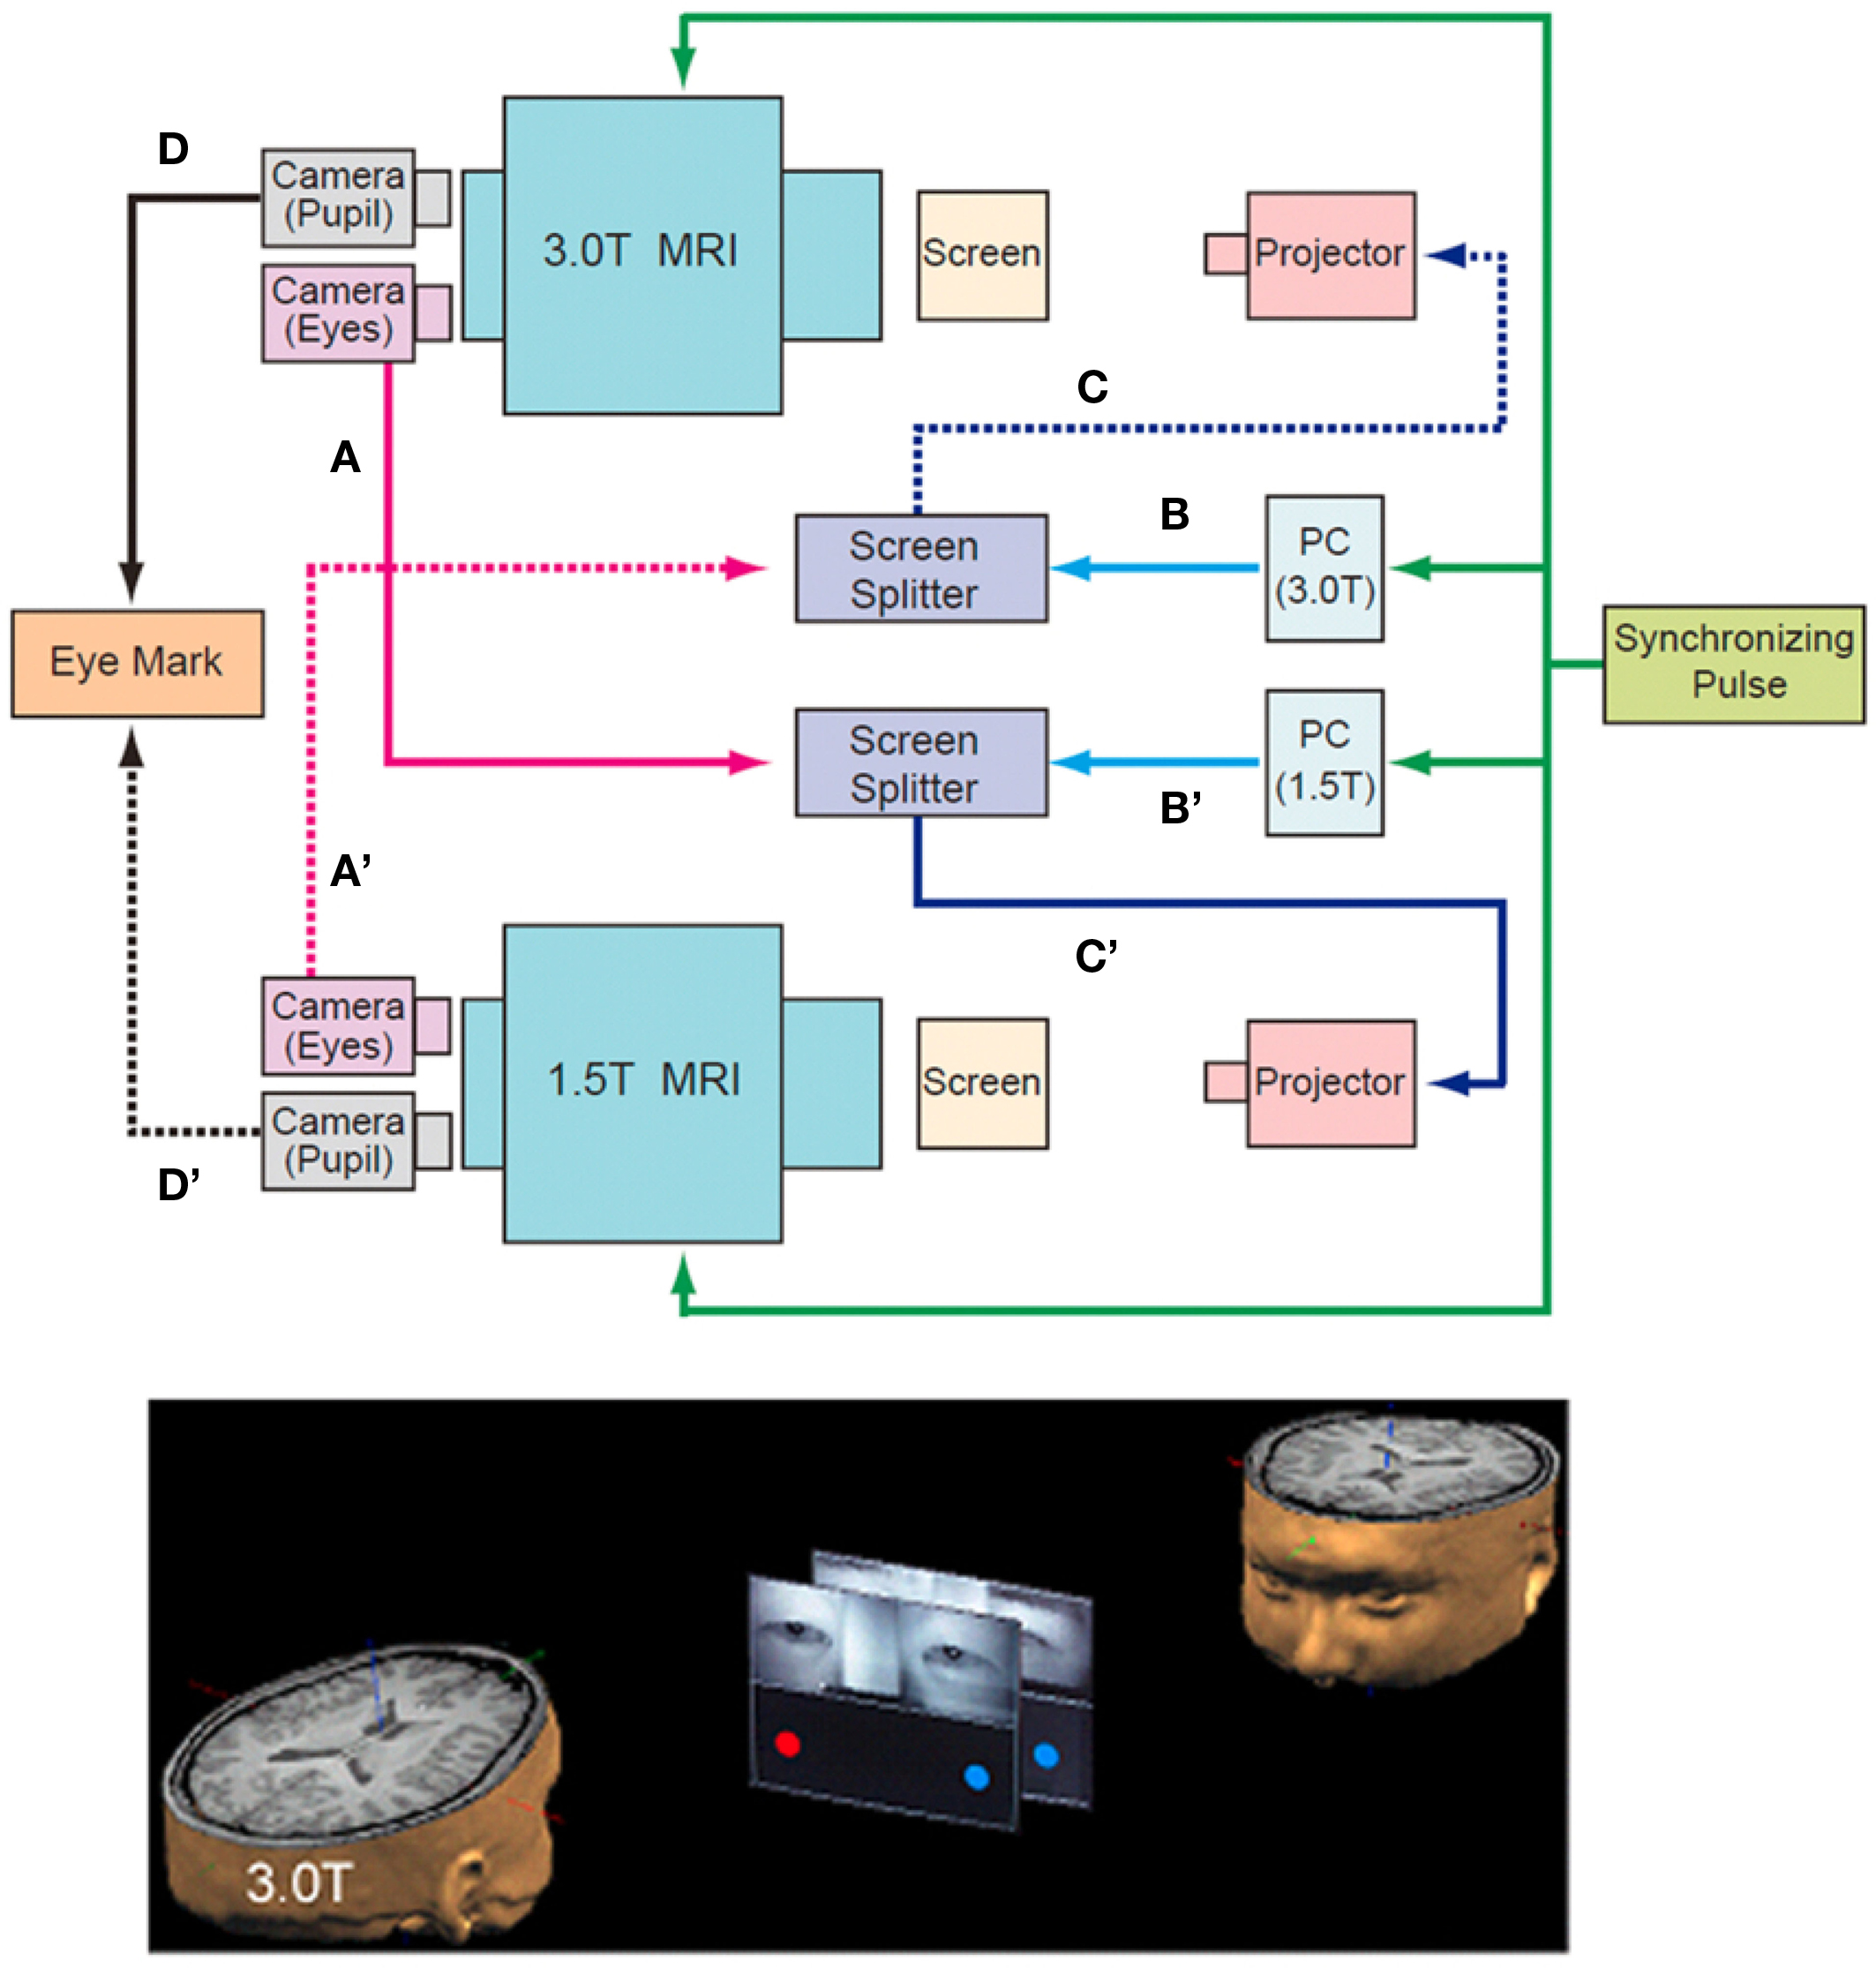
Figure 1. Schematic diagram of the “hyper-scan.” Near-infrared eye-tracking systems implemented onto two MRI scanners (1.5T and 3.0T) captured video images of each participant’s eyes and eyebrows, which were transferred to the screen splitter (A and A′) that bound them to the computer-generated visual stimuli (B and B′). The combined images were projected onto the screen in front of the counterpart through the projector (C and C′). The data for pupils were used to calculate the position of the gaze (D and D’). The other participant’s eyes were presented on the upper half of the screen, and the computer-generated images of balls were displayed at both ends of the screen in the lower half (bottom). The timing of the MRI scanning and the stimulus presentation were synchronized by the pulse signal from the controller of the eye-tracking system to the two MRI scanners and the PC for the presentation of visual stimuli (top, green line).
The subjects performed the joint attention task by exchanging their eye-gaze information in real time. In the MRI scanner, the other participant’s eyes were presented on the upper half of the screen, and two ball targets were displayed at both ends of the screen in the lower half. Thus, the ball targets and the eyes of the partner were presented to the participants on both scanners at the same time (Figure 1, bottom). The task was to look at one of the ball targets cued either by the eye movement of the partner or by the change in color of the ball target.
There were two types of runs depending on the cue-response behavior. During concordant runs, participants were required to shift their gaze to the cued target. During discordant runs, participants were asked to shift their gaze to the opposite side to where the target appeared. Explicit instructions were given to both subjects at the start of each run.
In concordant runs, four tasks were configured by three types of the ball cue presentation (Figure 2). As the first type, the ball cue was provided to one participant. Here, following eye contact for 2,000 ms with two red balls in the lower half of the screen, one of the balls in front of one participant (say, P) changed to blue for 2,500 ms. The participant P was required to shift his gaze to the changed ball as soon as possible. The counterpart (say, Q) was asked to gaze at the ball (which from his or her perspective does not change in color) that P attended to. Then, the balls on both sides disappeared for 500 ms, at which point the participants returned to joint eye contact. As participants P and Q watched the same ball target, P underwent ball-cued shared attention (ball-share [BS]) and Q underwent eye-cued shared attention (eye-share [ES]). As the second type, the ball cue was provided to both participants simultaneously. In this case, following eye contact for 2,000 ms with two red balls in the lower half of the screen, one of the balls in front of both participants changed to blue simultaneously, but on different sides, for 2,500 ms. The participants were required to shift their gaze to the changed ball. Thus, both participants underwent simultaneously ball-cued non-shared attention (simultaneous ball-non-share during concordant run [SBNc]). As the third type, no ball cue was provided on either side. Eye contact (EC) trials started with eye contact without any ball cue; thus, the participants continued to hold eye contact for 4,500 ms, followed by the balls disappearing for 500 ms (not shown in Figure 2).
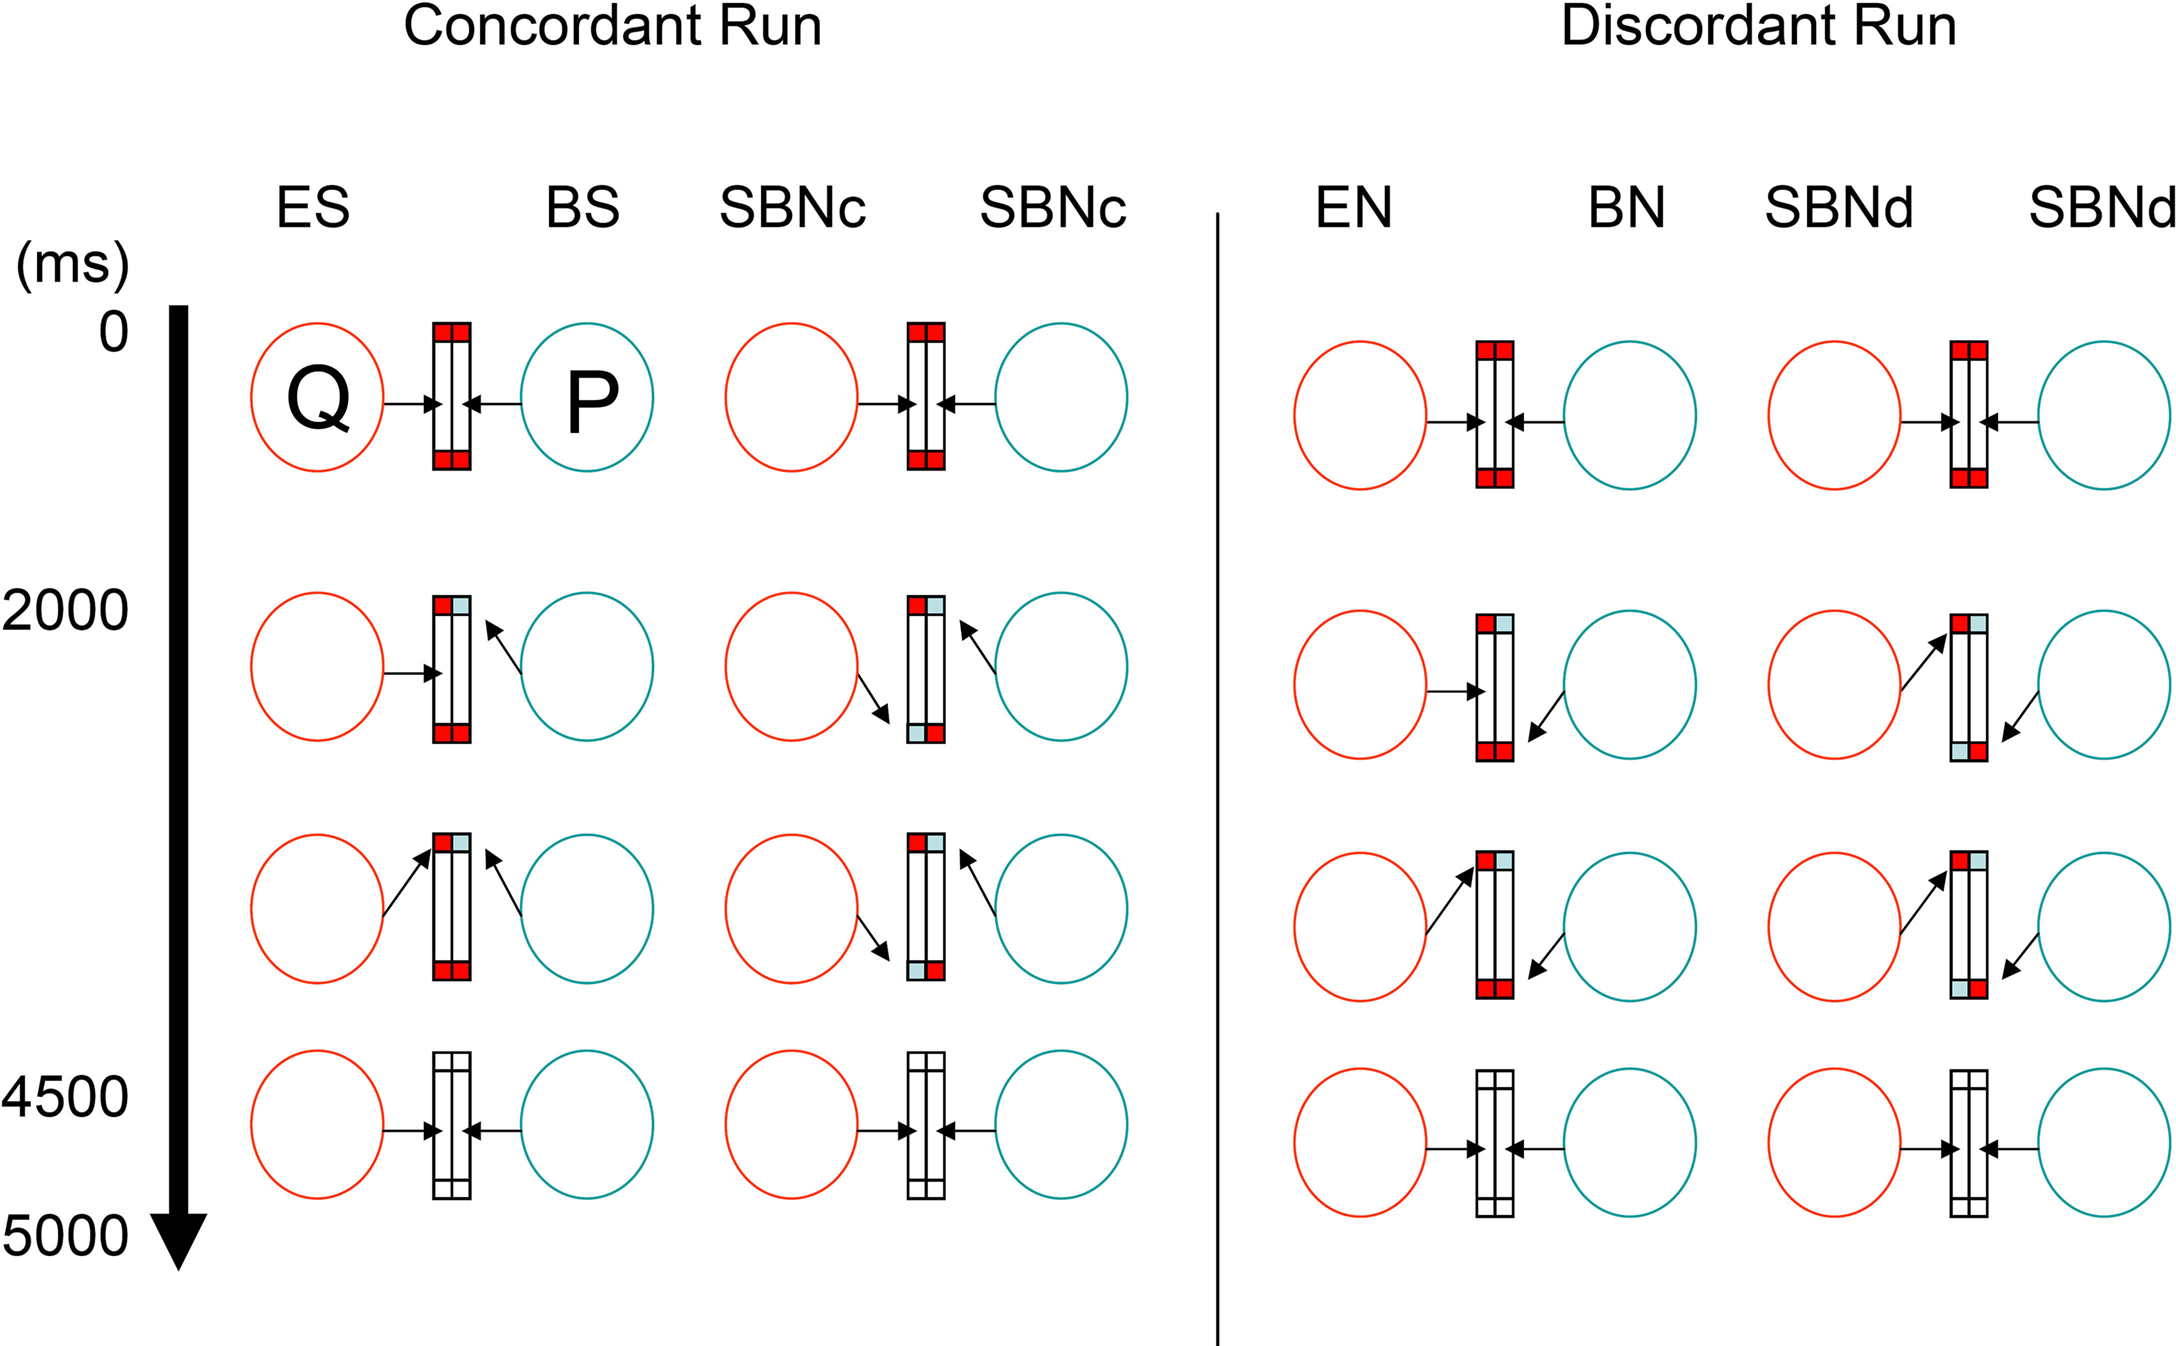
Figure 2. Joint attention task. The virtual relationship between two participants (P and Q) in the scanner. Arrows indicate the gaze direction toward the screen. Blue and red rectangles indicate the ball cue. During concordant runs (left columns), participants were required to shift their gaze to the target cued by either ball (by means of color) or eye gaze. Each task trial lasted 5 s. During discordant runs (right columns), participants are asked to shift their gaze to the opposite side of the target. BN, ball-non-share; BS, ball-share; EN, eye-non-share; ES, eye-share; SBNc, simultaneous ball-non-share during concordant run; SBNd, simultaneous ball-non-share during discordant run.
During discordant runs, the participants were asked to shift their gaze to the opposite side where the target appeared. The set-up was identical to the concordant runs. Thus, when the ball cue was provided to one side, P underwent ball-cued non-shared attention (ball-non-share [BN]), and Q underwent gaze-cued non-shared attention (eye-non-share [EN]). When the ball cue was provided to both sides, both participants simultaneously underwent ball-cued non-sharing attention (simultaneous ball-non-share during discordant run [SBNd]).
The four task conditions, ES and BS during concordant runs, and EN and BN during discordant runs, were contrasted with each control condition (SBNc for concordant runs and SBNd for discordant runs), which constituted a 2 (cue, eye vs. ball) × 2 (attention, sharing vs. non-sharing) design. All condition effects described above were modeled out within the framework of a general linear model to generate the innovation.
MRI Data Acquisition
A time-course series of 85 volumes was acquired using interleaved T2*-weighted, gradient echo, echo planar imaging (EPI) sequences using a 1.5 Tesla MR imager (Signa Excite, General Electric, Milwaukee, WI, USA) and an eight-element phased-array head coil. Each volume consisted of 34 axial slices, each 4.0 mm thick with no gap, to cover the entire cerebral cortex and cerebellum. The time interval between two successive acquisitions of the same image was 3,000 ms with a flip angle of 90° and a 45-ms echo time (TE). The field of view (FOV) was 192 mm and the in-plane matrix size was 64 × 64 pixels. For anatomical reference, 3D spoiled gradient recalled echo (SPGR; TR = 33 ms, TE = 3.0 ms, FA = 30°, FOV = 240 mm, matrix size = 256 × 192 pixels, slice thickness = 1.5 mm, a total of 112 transaxial images) images were obtained for each participant. Identical procedures were performed with a 3 Tesla MR imager (Signa Excite) and an eight-element phased-array head coil, except for the 30 ms TE for EPI imaging.
A longer TE for 1.5 T (45 ms) was chosen to minimize the difference in the task-related signal change by 3 T (TE = 30 ms). The TE that optimizes the contrast when performing gradient echo fMRI is that which maximizes the difference between two exponential decay rates (the value for 1/T2* during rest vs. the value for 1/T2* during activation). This maximization occurs when the TE is similar to the resting T2*. The T2* of the brain tissue become progressively shorter as a function of increasing static magnetic-field strength: at 1.5 T, the T2* is about 50–60 ms and at 3 T, it is about 30–40 ms, depending on the quality of the shim, and sometimes on the spatial resolution (Bandettini, 2001)). In preliminary fMRI experiments with visual photic stimulation, the stimulus-related activation of the visual cortex was saturated at a 30 ms TE for 3 T, whereas it linearly increased up to 60 ms for 1.5 T. The stimulus-related activation of the visual cortex caused by 3 T at 30 ms was 11.5% larger than that caused by 1.5 T at 45 ms, 4.8% at 50 ms, and 2.5% at 55 ms. To keep the signal defects and image distortion caused by susceptibility artifacts within an acceptable level, we chose TE = 45 ms for 1.5 T and 30 ms for 3 T.
Image Preprocessing
The first five volumes of each fMRI run were discarded to allow for stabilization of the magnetization, and the remaining 80 volumes per run (a total of 480 volumes per participant) were used for the analysis. The data were analyzed using statistical parametric mapping with SPM5 (Wellcome Department of Imaging Neuroscience, London, UK) implemented in MATLAB 2006b (MathWorks, Natick, MA, USA) (Friston et al., 1995a),b)). After correcting for differences in slice-timing within each image volume, all of the volumes were realigned for motion correction. The whole-head 3D SPGR volume was co-registered with the EPI volume of the sixth scan. The sixth EPI volume was normalized to the Montréal Neurological Institute (MNI) T2* image template using a non-linear basis function. The same parameters were applied to all of the EPI volumes, which were spatially smoothed in three dimensions using an 8-mm full width at half-maximum Gaussian kernel.
Statistical Analysis
Statistical analysis in the present study was conducted at two levels. First, the individual task-related activation was evaluated. Second, the summary data for each individual were incorporated into a second-level analysis using a random-effects model (Friston et al., 1999)) to make inferences at a population level. At first, the time-course signal for each participant was modeled using a box-car function convolved with a hemodynamic-response function, run effect, and high-pass filtering (128 s). To test hypotheses about regionally specific condition effects, the estimates for each of the model parameters were compared with the linear contrasts. Then, the weighted sum of the parameter estimates in the individual analysis constituted “contrast” images, which were used for the group analysis (Friston et al., 1999)). Contrast images obtained via individual analysis represented the normalized task-related increment of the MR signal relative to the control conditions of each participant. Incorporating the contrast images of ES vs. SBNc, BS vs. SBNc, EN vs. SBNd, and BN vs. SBNd, that were labeled as ES′, BS′, EN′, and BN′, respectively, we conducted a three-way ANOVA with the non-sphericity correction to detect the main effects, i.e., cue (Eye vs. Ball), attention (Sharing vs. Non-sharing), scanner effect (1.5 T vs. 3 T), and their interaction. The resulting set of voxel values for each contrast constituted a statistical parametric map of the t statistic (SPM{t}). The threshold for SPM{t} was set at P < 0.05, with a correction for multiple comparisons at the voxel level for the entire brain (Friston et al., 1996)).
Estimate of the Functional Connectivity between Subjects
To subtract the effect of the task-related activity, all of the conditions described above were modeled into the design matrix, and then the effect sizes of the modeled regressors were estimated. By default, SPM5 estimation did not save the residual image at each volume, and we therefore modified the program “spm_spm.m” to obtain them.
In order to acquire the innovation for each voxel, residuals were concatenated with all runs. First, initial two time points of each run were discarded because of the AR order used in SPM5. Correlation of the innovations between the same coordinate positions (x, y, z) of two subjects was calculated in each and every voxel using an in-house program developed with MATLAB 2006b. Then, the correlation value was transformed to the z-score (standardized value) using Fisher’s r-to-z transform. An image that contained the z-score of every voxel was generated in each pair. All possible combinations of the pair (i.e., 19 × 19 = 361 pairs) were generated and divided into two groups: 19 combinations in which the two subjects participated in the experiment simultaneously (“pair” group), and 342 combinations in which they did not (“non-pair” group). To compare “pair” with “non-pair” correlations, the two-sample t-test was applied using the z-score images within the framework of random-effects analysis in SPM5 (Friston et al., 1999)). The statistical threshold was set at P < 0.05 with a correction for multiple comparisons at the cluster level for the entire brain (Friston et al., 1996)).
Results
Two-way repeated-measures (rm) ANOVA incorporating the cue effect (eye vs. ball) and sharing effect showed that the reaction time (RT) of the ball cue (475 ± 74 ms) was significantly shorter than that of the eye cue (659 ± 132 ms) (cue effect, F(1, 37) = 96.3, P < 0.001; sharing effect, F(1, 37) = 0.109, P = 0.743; interaction, F(1, 37) = 17.1, P <0.001). When eye was the cue, the sharing effect was not significant (t(37) = 2.09, P = 0.088, paired t-test with Bonferroni correction), whereas ball cueing showed a significant sharing effect (t(37) = -4.66, P <0.001, paired t-test with Bonferroni correction) (Figure 3). The RTs of the BS and BN conditions were similar to those of SBNc and SBNd, respectively.
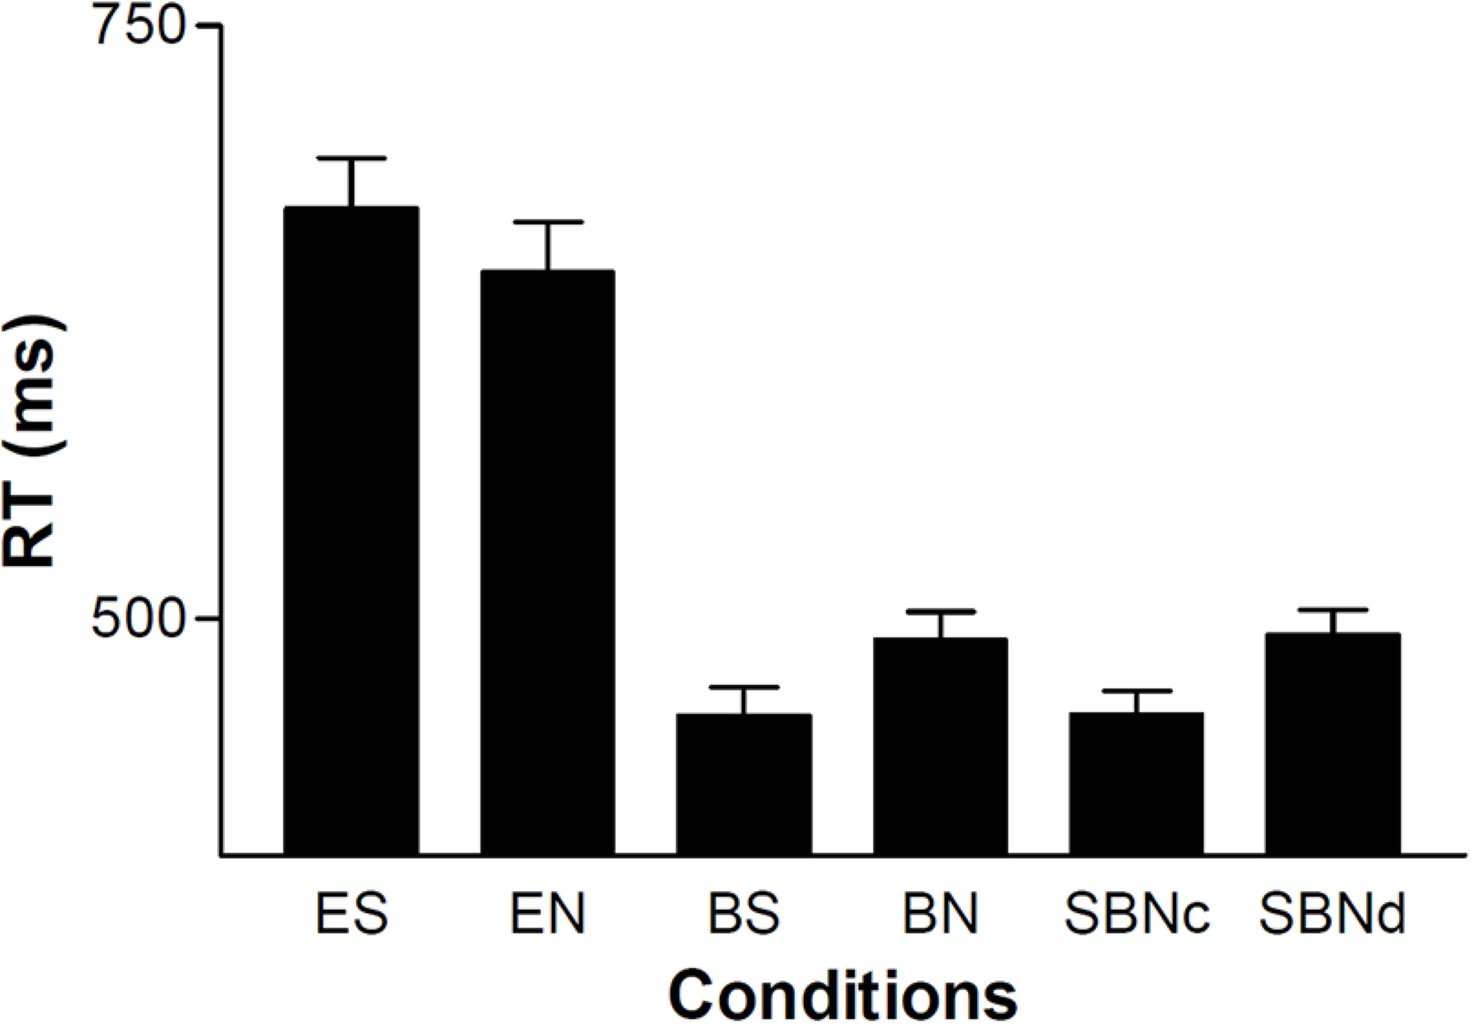
Figure 3. RT of each condition averaged across subjects (n = 38). Error bars indicate the standard error of the mean.
A two-way rmANOVA incorporating cue effect (eye vs. ball) and sharing effect on the accuracy did not show any significant main effect or interaction (cue effect, F(1, 37) = 0.26, P = 0.61; sharing effect, F(1, 37) = 2.48, P = 0.12; interaction, F(1, 37) = 0.71, P = 0.44). The accuracy was 98.3 ± 2.9% for the ball cue and 98.0 ± 2.9% for the eye cue.
Regarding the neural activation, the main effects of eye cueing by means of the contrast of (ES′ + EN′) − (BS′ + BN′) were found in the visual cortices including the bilateral occipital pole, the right MT/V5 extending to the fusiform gyrus, the middle temporal gyrus, and the right pSTS (Figure 4; Table 1). The eye-cueing effect was also observed in the posterior rostral medial frontal cortex (prMFC), and the bilateral inferior frontal gyrus (IFG), more prominently in the right hemisphere. The interaction between eye movement and the sharing of attention toward the object by means of the contrast of (ES′ − EN′) − (BS′ − BN′) was found in the left intraparietal sulcus (IPS) (Figure 5; Table 2).
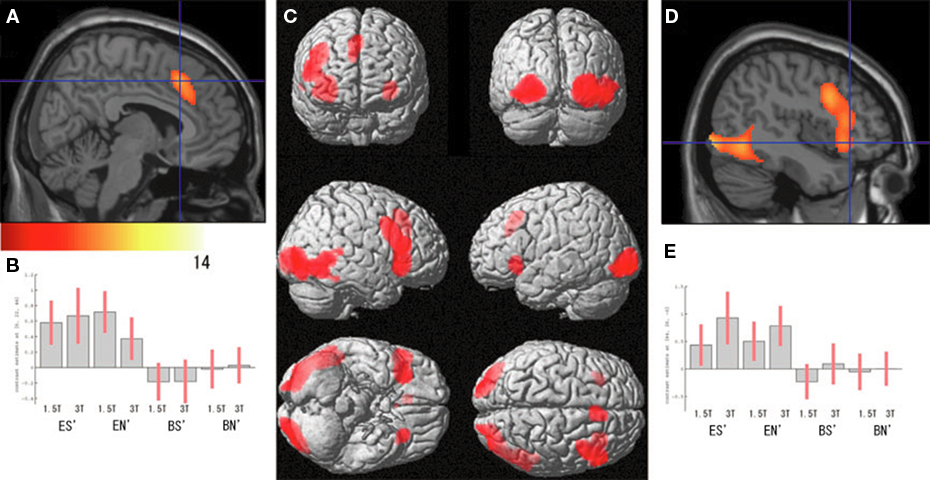
Figure 4. Effect of eye cueing. (A) The effect of eyes (ES′ + EN′) − (BS′ + BN′) is superimposed on the parasagittal images where the blue lines cross at (6, 22, 44) in the prMFC. The color scale indicates the t-values. (B) The task-related activation of each condition compared with their corresponding control condition at (6, 22, 44). ES′, ES − SBNc; EN′, EN − SBNd; BS′, BS − SBNc; BN′, BN − SBNd. Error bars indicate the 90% confidence interval. (C) The effect of eye cueing is superimposed on the 3D surface-rendered high-resolution MR image. (D) The effect of eye cueing in the right IFG (44, 26, −6) and (E) its task-related activation are shown in the same format as (A) and (B), respectively.
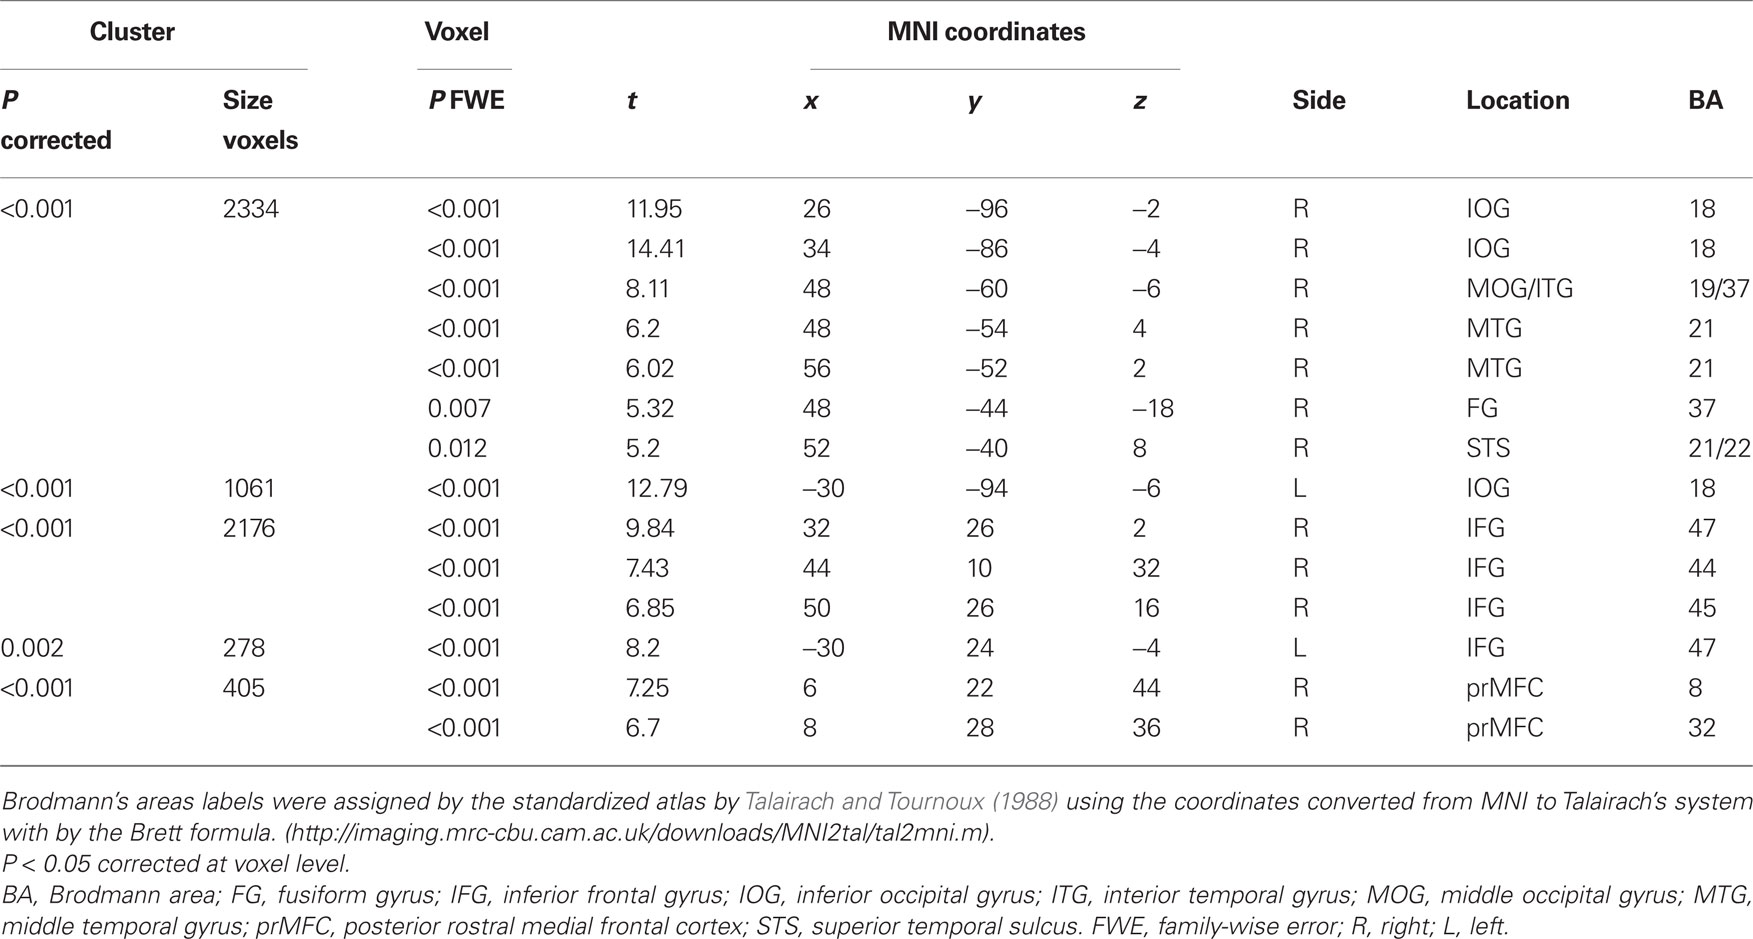
Table 1. Effect of eye cueing.
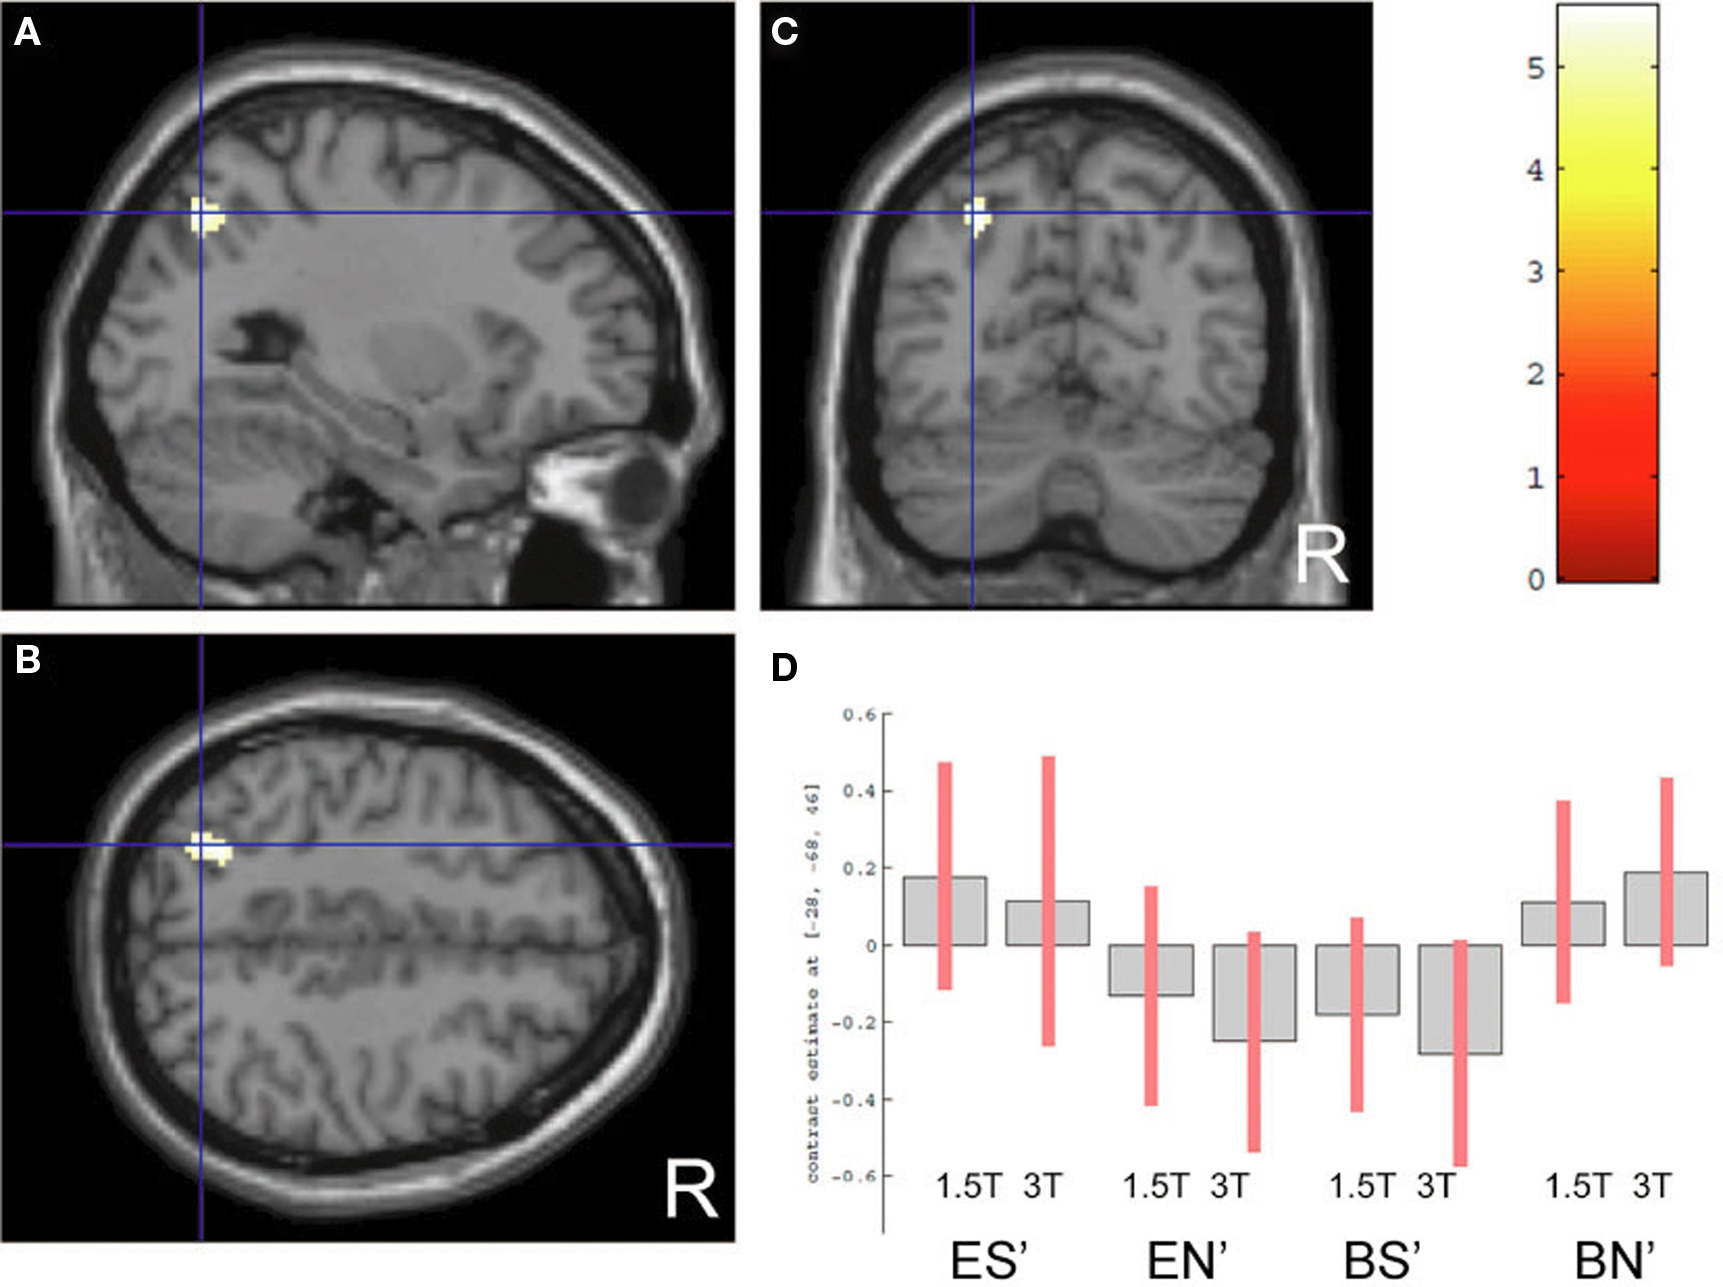
Figure 5. Cueing × sharing interaction. Activation by the contrast of (ES′ − EN′) − (BS′ − BN′) is superimposed on the parasagittal (A), axial (B), and coronal (C) sections of high-resolution MR images intersected at (−28, −68, 46), corresponding to the left IPS. The color scale indicates the t-values. (D) The task-related activation of each condition is compared with the control condition, with the same format as shown in Figure 4.
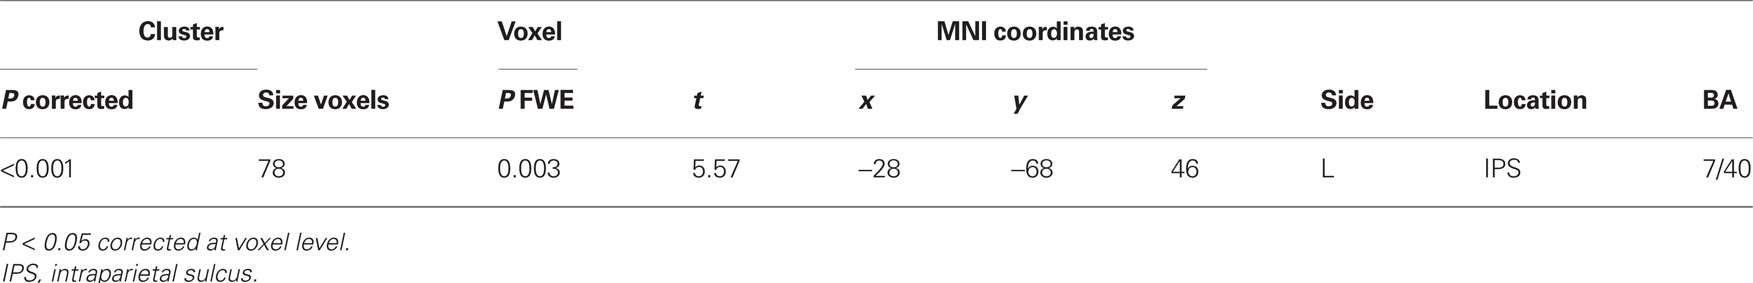
Table 2. Interaction of effects of eye cueing and shared attention.
A comparison of “pair” and “non-pair” correlations showed that the correlation of the right IFG between the two brains was more prominent in the “paired” group than that in the “non-paired” group (Figure 6; Table 3).
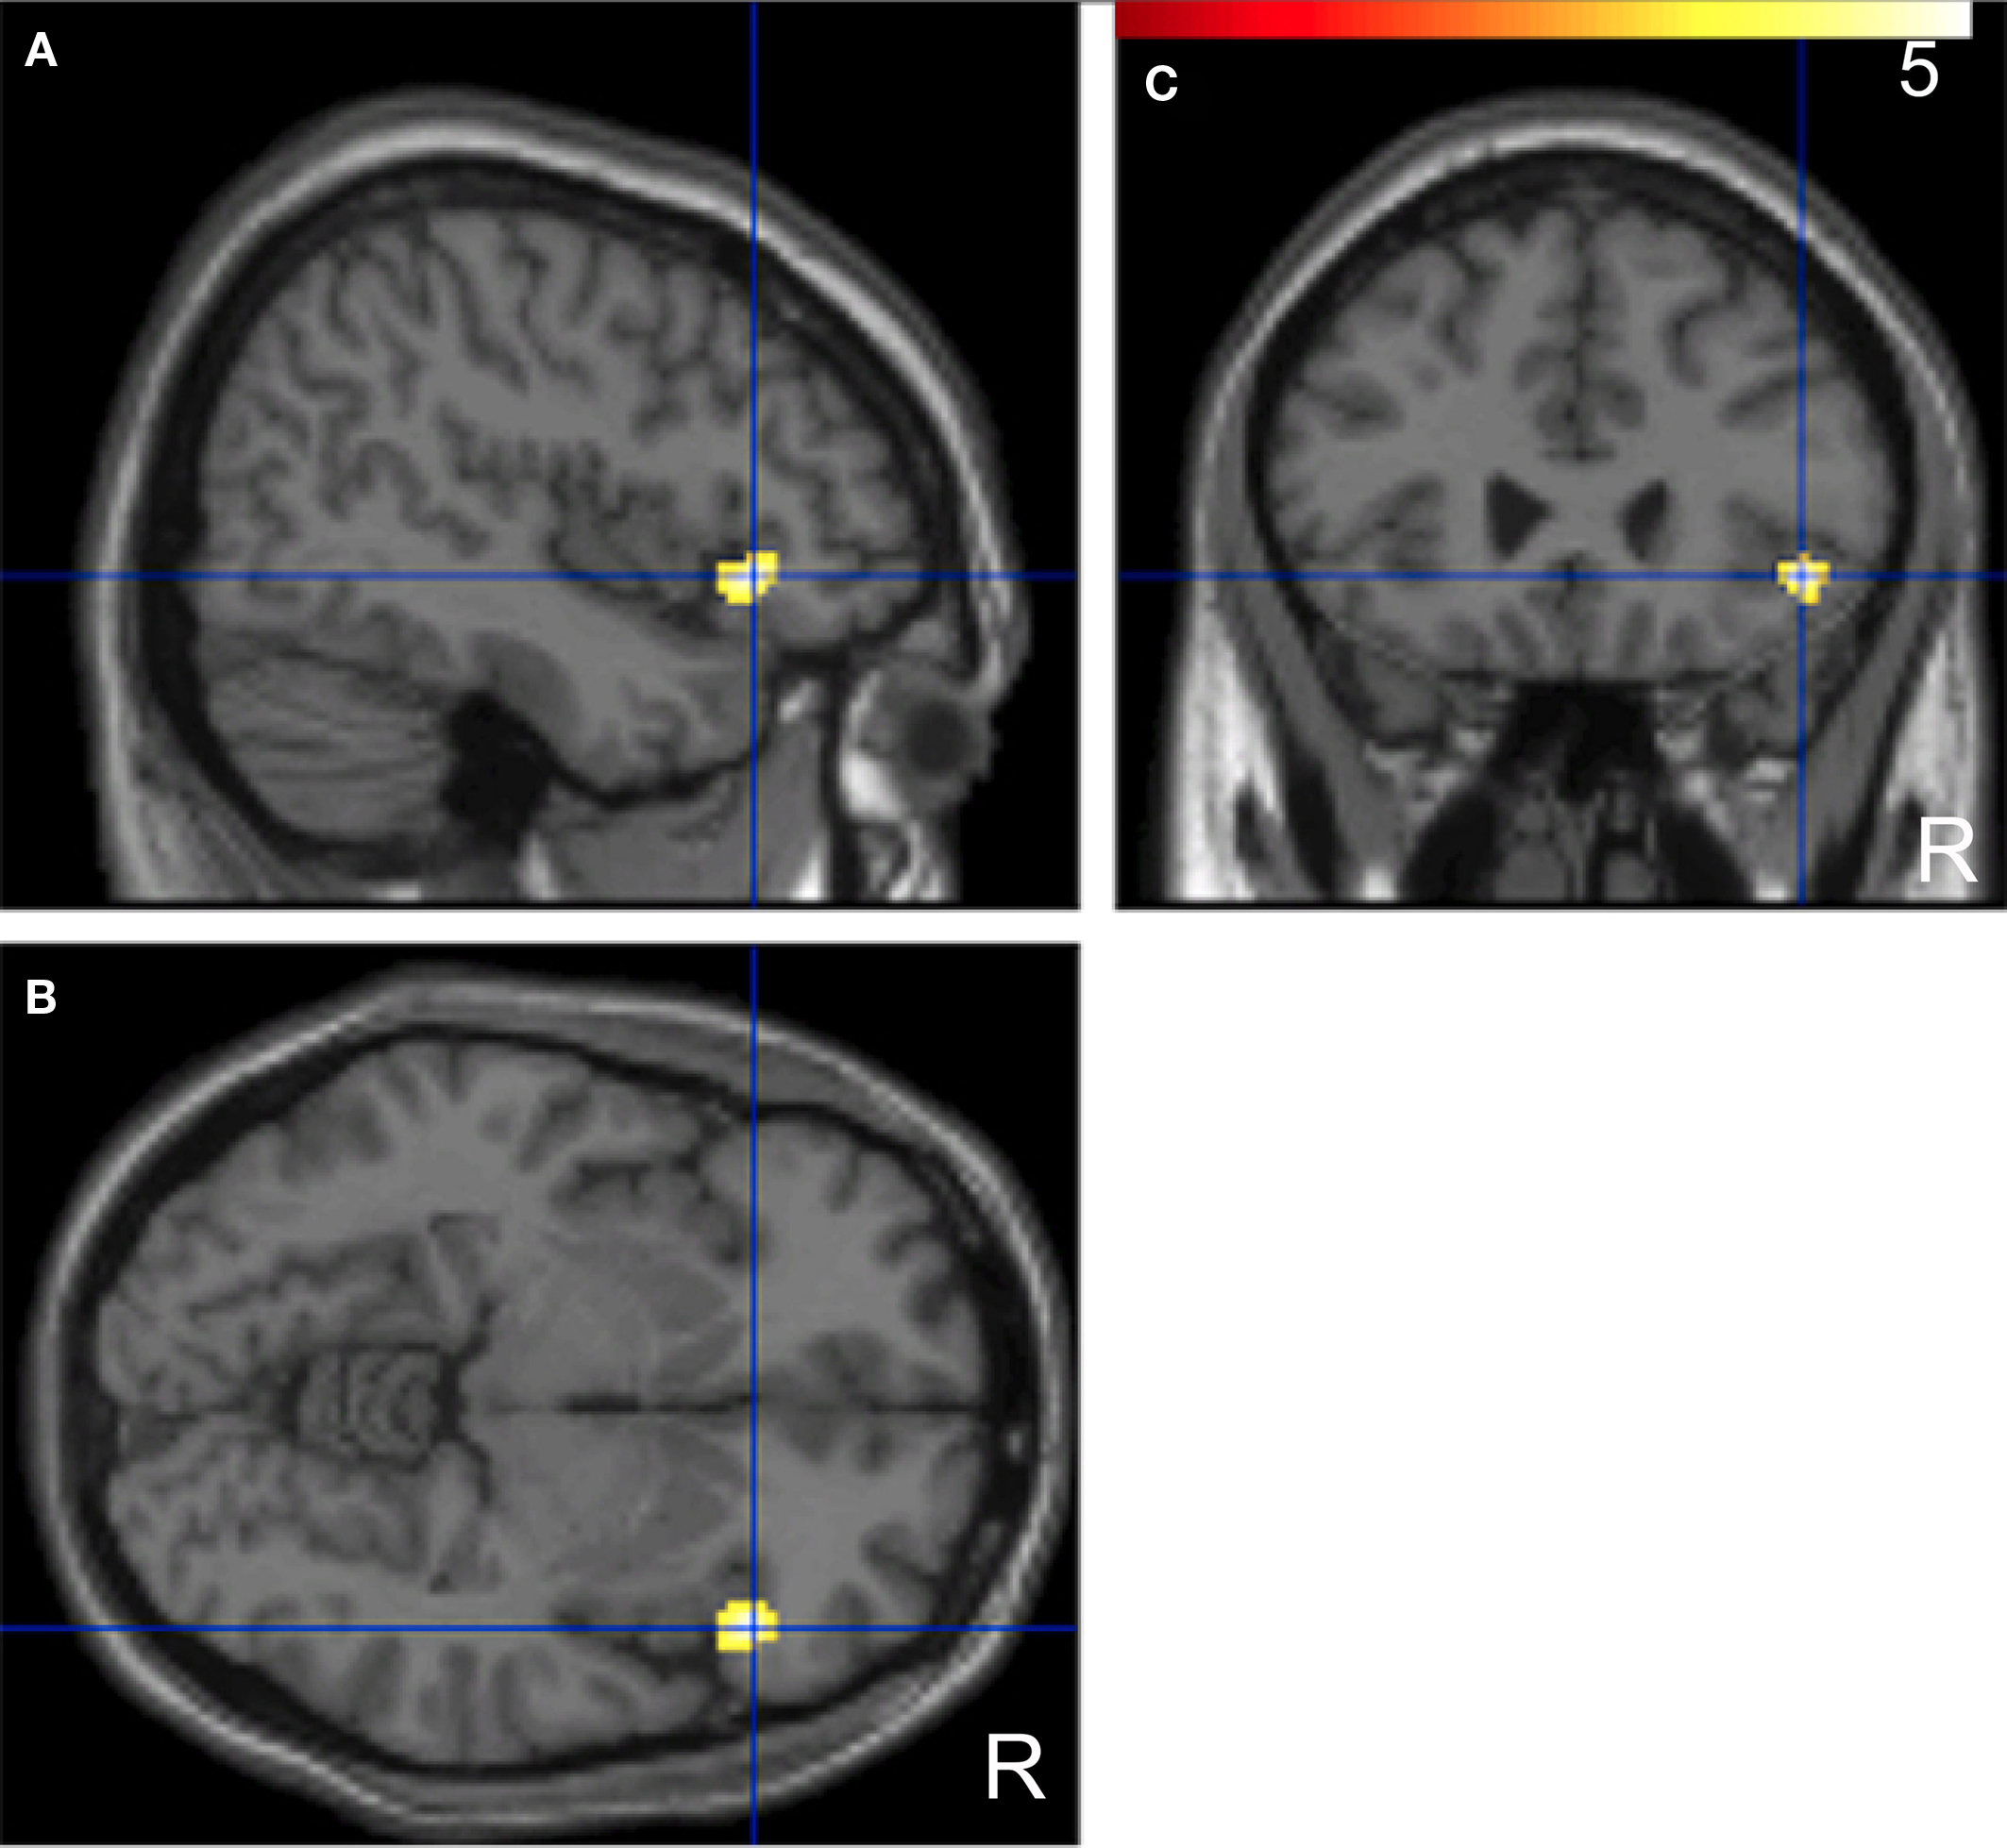
Figure 6. Significant positive correlations of the innovation between the paired subjects who had been “face-to-face” during fMRI compared with the non-paired subjects. Images are superimposed on the parasagittal (A), axial (B), and coronal (C) sections of T1-weighted high-resolution MR images. The blue lines in each section cross in the right IFG (44, 26, −6). The color scale indicates the t-values.
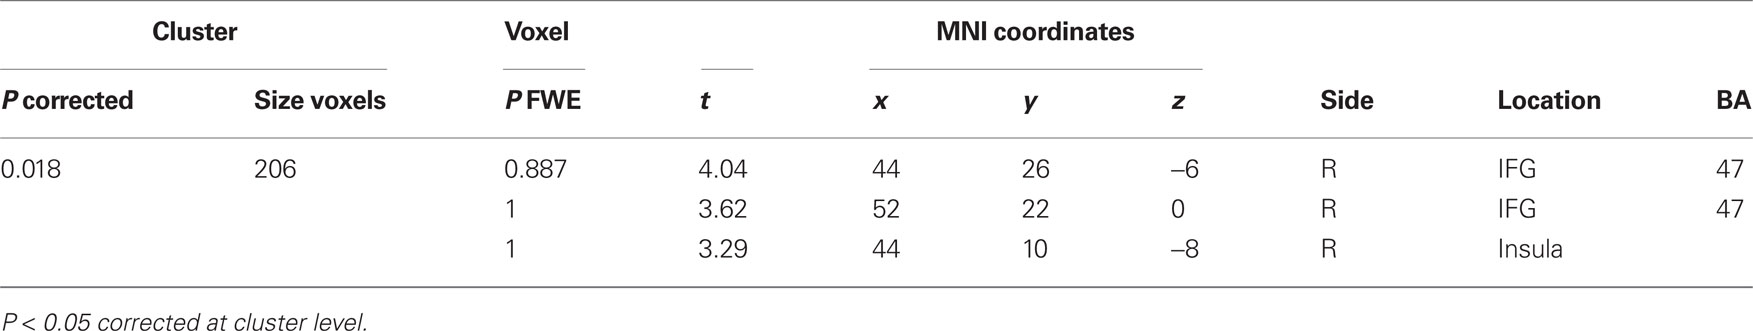
Table 3. Correlations between paired subjects more prominent than non-paired subjects.
In SPM5, the temporal autocorrelation was treated by partitioning the data covariance using restricted maximum likelihood (ReML) (Friston et al., 2007)). ReML allows the simultaneous estimation of model parameters and hyperparameters, and can be employed with any temporal autocorrelation model. SPM5 uses an “AR(1) + white noise” model (Purdon and Weisskoff, 1998)) with an autoregressive (AR) error term. As iterative schemes like ReML have a high computational demand when performed at each voxel, the data were pooled over voxels in order to estimate the hyperparameters in a single iterative procedure (Friston et al., 2007)). If the temporal autocorrelation varies over voxels (Zarahn et al., 1997)), pooling might affect the residuals themselves. Another problem with the SPM approach is the constraints on the hemodynamic-response function, which might sometimes lead to a severe mismatch between the anticipated deterministic response and the actual response (Riera et al., 2004)).
To confirm the correlation results obtained from SPM innovations, we estimated the intrinsic autocorrelation directly in the time-series data of the particular voxel by another method: a modified version of NN-ARx (Riera et al., 2004)) known as the AutoRegressive with eXogenous variable (ARx) model. ARx is a first-order linear approach, which comprises an AR component and a linear filter to the exogenous stimuli, allowing for the transformation of the data into innovations. It estimates the order of the AR component (i.e., how many instants of time in the past are necessary to explain the activity of the voxel at time t), the order of the influence of the past of the exogenous stimulus plus the delay, and the order for the non-linear drift component (i.e., the grade of the polynomial that best explains the drift must be selected).
The time-series data for the right IFG (x = 44, y = 26, z = −6), using the local maximum depicted by SPM analysis of the correlation of the residual times series (Table 3), were obtained from pre-processed (slice-timing correction, realignment, spatial normalization, and spatial smoothing with SPM5) images using MarsBar software1. Because of the smoothness of the data (full width at half maximum [FWHM] = ∼8 mm), the local maximum should reflect the characteristics of the surrounding areas. The run effect and slow drift of each time series was removed using the “detrend” function implemented with MATLAB 2006b. The ranges of AR order, the delayed response to the stimulus (scan), the order of the influence of the past of the exogenous stimulus (scan), and the trend grade were set as 1∼3, 1∼2, 1∼2, and 0∼1, respectively, the ranges of which were the default values determined by Riera et al. (2004). A corrected version of the Akaike Information Criterion (AIC) was used for model selection (Riera et al., 2004)).
After estimation, we obtained the residual time series as innovations. First, three time points of each run were removed because of the maximum of the AR order used in ARx. We calculated the correlations of these innovations for all possible combinations of the pairs (i.e., 19 × 19 = 361 pairs), then transformed them to z-scores using Fisher’s r-to-z transform. The pairs were divided into two groups: 19 pairs in which the two subjects participated in the experiment simultaneously (the paired group), and 342 pairs (the non-paired group) in which they did not. To compare “paired” and “non-paired” correlations, two-sample t-tests were applied using the z-scores with SPSS software (SPSS Inc., Chicago, IL, USA).
The power spectrum of the ARx innovation at (44, 26, −6) did not show any prominent peaks (Figure 7A). The between-subject correlation was significantly more prominent in the paired group than that in non-paired group (P < 0.001, two-sample t-test; Figure 7B). The synchronization between non-pairs was small but also significant (t(341) = 4.228, P < 0.001, one-sample t-test). The same results were obtained at other local maxima within the cluster in the right IFG shown in Table 3.
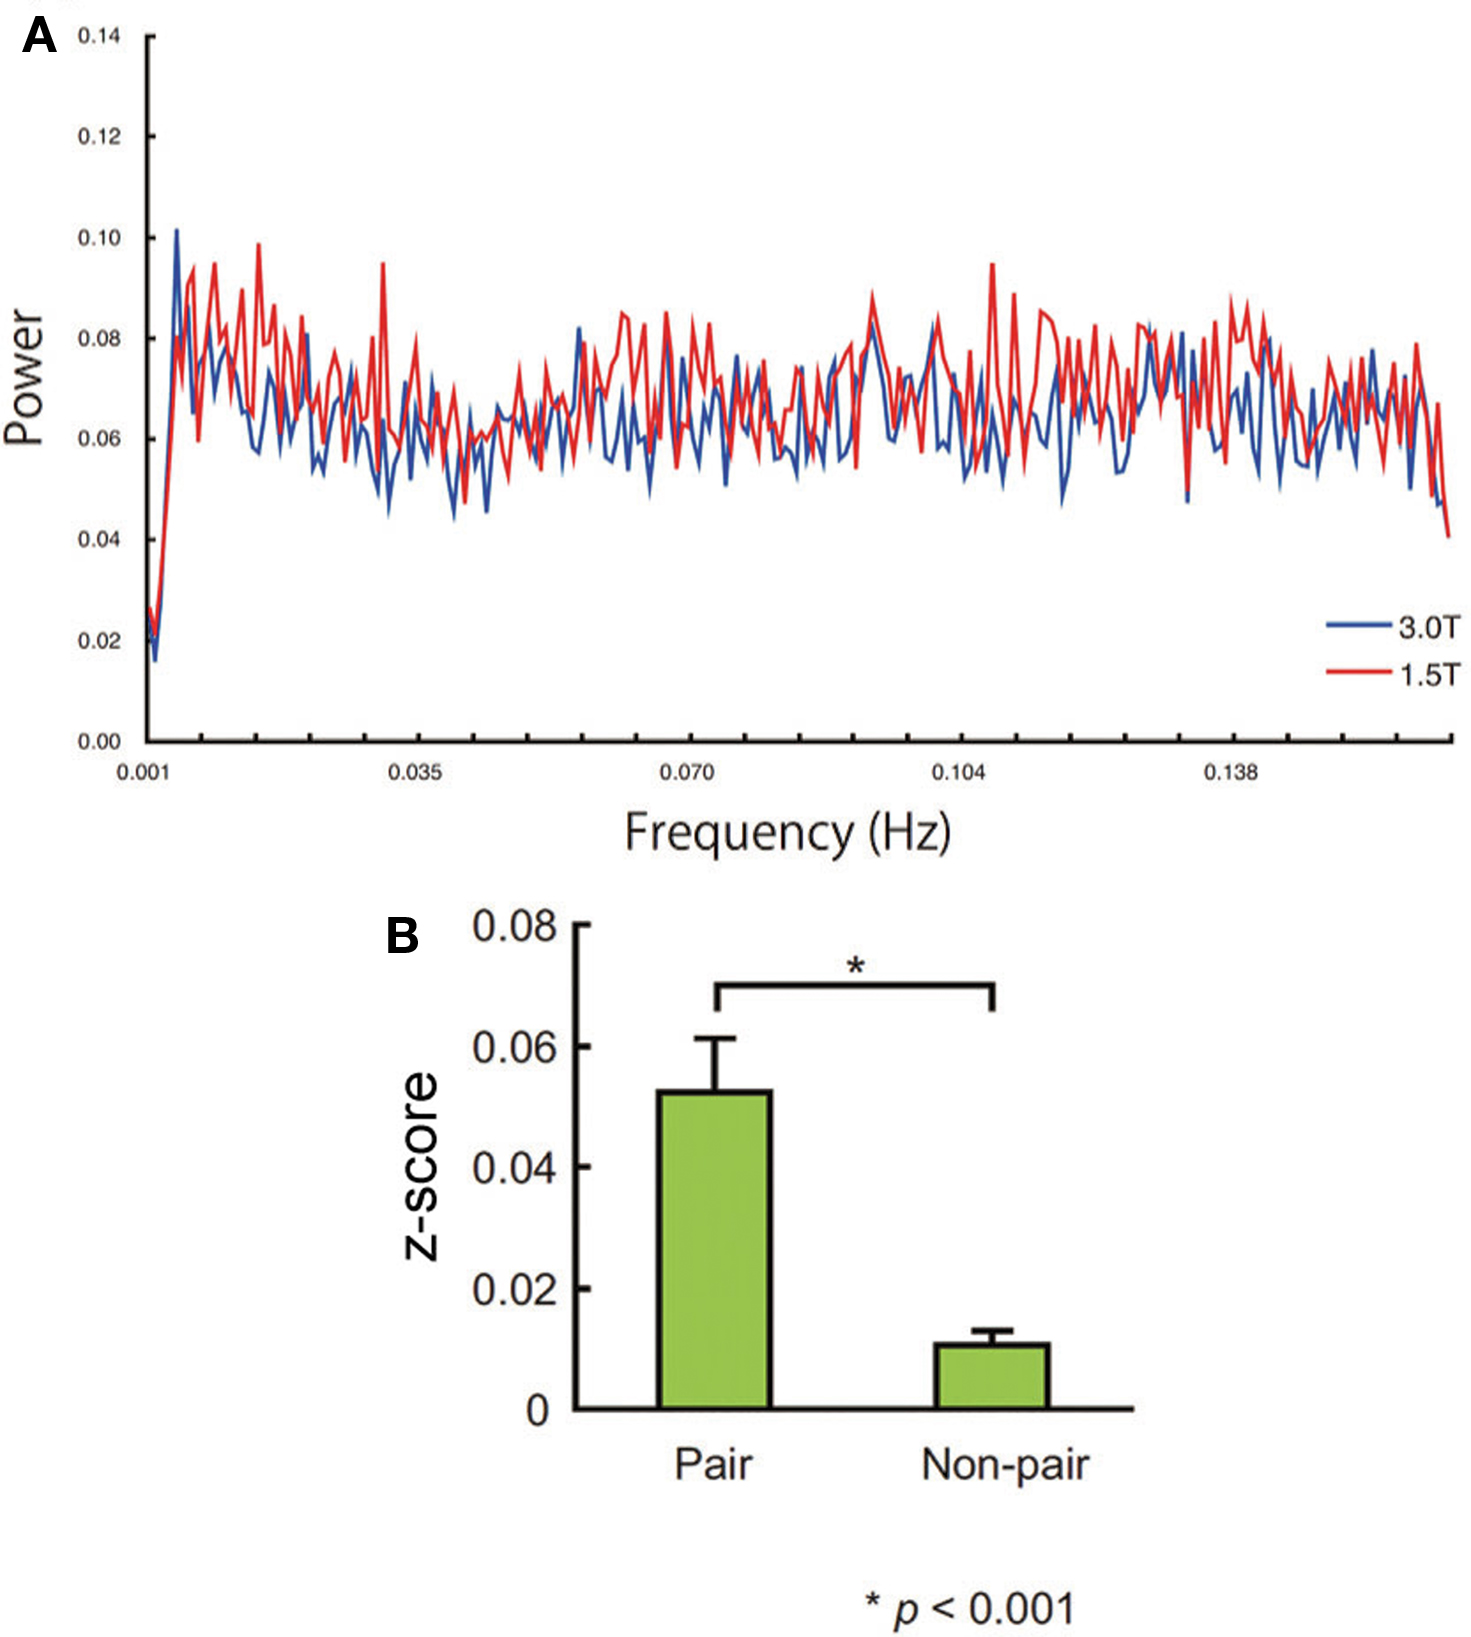
Figure 7. (A) Power spectrum of the averaged innovations obtained by ARx at (44, 26, −6). No sharp peak of the power spectrum was noted. (B) Standardized correlation value (z-score) of the pair and non-pair group. Error bars indicate the standard error of the mean.
Discussion
Performance
The RT to ball cueing was shorter than that to eye cueing. This might suggest that the neural mechanisms underlying the response to these cues are different. During ball cueing, when a peripherally-presented ball changes color from red to blue, attention is shifted in a stimulus-driven (exogenous) way. Eye-gaze cueing was presented centrally, possibly requiring participants to shift attention voluntarily (endogenously) to the cued location, and hence producing a longer RT (Vecera and Rizzo, 2006)). Furthermore, the RT to ball cueing was elongated when the subject was instructed to fixate the target opposite to the cued one. This elongation might represent the additional workload in suppressing a reflexive attentional shift. The RT with eye cueing did not show such an effect, suggesting that the component of reflexive shift (Friesen and Kingstone, 1998); Driver et al., 1999); Hietanen, 1999); Langton and Bruce, 1999); Ricciardelli et al., 2002)) is relatively small, at least in the protocol employed in the present study.
Synchronization in the Right IFG
To depict the between-subject synchronization of the regional neural activity, we utilized innovations. A previous study revealed that the innovation was qualitatively similar to “continuous” resting-state data, but had several distinct quantitative differences, in terms of the inter-regional connectivity (Fair et al., 2007)). Given the linear addition of task-related activity on top of the persistent resting spontaneous activity (Fox et al., 2006)), the adequate removal of the task-induced variance for functional connectivity should have yielded a correlation profile similar to “continuous” resting-state data. Fair et al. (2007) speculated that inter-regional correlations might be altered during task states such that correlated spontaneous neural activity is strengthened in task-induced areas and weakened in non-task-induced areas. In the present study, the baseline condition was characterized by eye contact. In this regard, the innovation of each participant was related to the state of looking at other’s eye that was not the task itself. Small but significant correlation of non-pair group may represent this state that is common across all participants. Thus, significant difference between pair and non-pair group reflects the face-to-face interaction, specifically the eye contact effect.
Eye contact implies the sharing of various psychological states. In the present study, the paired subjects shared the intentional relation from the self to the agent (“I look at you”), and from the agent to the self (“You look at me”). Therefore, the between-subject correlation of the innovation suggests that the role of the right IFG is related to the between-subject sharing of the intentional relation. This sharing might create a context that enhances the detection of the communicative intent emitted with the eye movement (Frith and Frith, 2006)), making possible collaborative activities with shared goals (in the present study, looking at the same objects). The neural synchronization of the right IFG might represent the innate self-other equivalence in intention in action (Meltzoff, 2007)), which in turn provides a “like-me” framework. Within the “like-me” framework, it has been argued that internal representations of actions are shared between the self and others (shared representations of action [SRA]), and this integration of information about one’s own actions, and those of others, might involve the IFG. Recently, de Vignemont and Haggard (2008) argued that SRA are represented within the motor system. Within the hierarchical model of motor control, SRA involve intentional representations of action prior to the dispatch of a motor command. SRA allow the observer to internalize someone else’s actions as if he or she were the agent, and not just an external witness, providing the first-person perspective (de Vignemont and Haggard, 2008)).We suggest that the right IFG is the site of the neural representation of the “shared space of common psychological ground” mediated by eye gaze.
Eye-Cue Effect in the Right IFG
In present study, the right IFG also showed the eye-cue effect (Figures 4D,E), consistent with previous studies. Passive viewing of averted eye movements activates the IFG, and more prominently the right hemisphere (Pelphrey et al., 2005a)). The function of the right IFG is related to the unconscious mimicry of the face (Leslie et al., 2004)). The right IFG is also related to the self-other distinction (Sugiura et al., 2006)), and self evaluation (Morita et al., 2008)), constituting part of a putative self-network, which is thought to be linked to the theory-of-mind network with which it shares neural substrates (Keenan et al., 2000)), specifically in the right prefrontal cortex (Platek et al., 2004)). The IFG is presumed to be the potential human homolog of area F5 in macaques, which is a region containing “mirror neurons,” or neurons that characteristically increase in firing rate both upon execution of internally generated actions and upon observation of external actions (Gallese et al., 1996); Rizzolatti et al., 1996)). Although the details of the relationship between the inter-subject synchronization and the mirror system remain to be investigated in future studies, these lines of evidence and the present findings suggest that the right IFG is pivotal to the shared representation of the gaze that might enhance the detection of the social attentional signal.
Activation of the Attention-Related Areas
In the present study, the attention-related areas showed an eye effect or eye × sharing interaction effect. Peak activation caused by the eye-cueing effect was seen at (6, 22, 44) in MNI coordinates, in the prMFC. The prMFC has been implicated in the continuous internal monitoring of action, and particularly in the processing of ambiguous response feedback (Amodio and Frith, 2006)). Its function might therefore be related to the monitoring of both one’s own eye movements and those of others. The mPFC is known to have a direct connection with the pSTS (Ban et al., 1991)), which is the part of the general post-perceptual system that is involved in processing the actions of external agents (Calder et al., 2002)). Hence, the prMFC might be related to the higher processing of the eye signal. The prMFC is located posterior to the anterior rostral MFC (arMFC) which is related to the theory-of-mind process (see Amodio and Frith, 2006), for a review). Using fMRI, Williams et al. (2005) showed that joint attention was associated with activity in the arMFC at (10, 46, 20) in Talairach’s coordinates and (10.1, 46.3, 24.2) in MNI coordinates, converted by the Brett formula2. Calder et al. (2002) reported that without making an explicit judgment, effects were observed in the arMFC at (2, 42, 36) in Talairach’s coordinates and (2.0, 41.4, 41.4) in MNI coordinates, when comparing an averted eye-gaze condition with a direct-gaze condition. These previous reports suggest that the activation of the arMFC is related to the implicit interpretation of the averted gaze regarding the shift of the person’s attention, which is a process that recruits the ToMM (Baron-Cohen, 1995)). In the present study, the focus of the task was on the on-line detection of the subtle change in the direction of the gaze of the partnered participant in order to shift the gaze toward the target, thus causing a more prominent monitoring workload, leading to more prominent activation in the prMFC rather than the arMFC.
The IPS is part of a network for voluntary (top-down) attentional control, along with the bilateral superior frontal and parietal cortices (Hopfinger et al., 2000)). The posterior IPS is the putative human equivalent of the macaque lateral intraparietal area (LIP), which is a region involved in attention and control of eye movement (Grefkes and Fink, 2005)). Non-human primate studies have shown that the LIP contains a salience map, which is a representation of the relative importance of different parts of the visual field (Gee et al., 2008)). By way of a saccade signal, driven by activity in the FEF or other prefrontal areas, the LIP creates a representation of a saccadic endpoint in its salience map (Bisley and Goldberg, 2003)). Thus, this region is a strong candidate for the neural comparator of dyadic relations (or, the relation between the partner and the object, and the relation between the self and the object) that might constitute a part of the SAM.
Occipito-Temporal Activation
In addition to this attention-related activation, the eye-cueing effect was also observed in the occipito-temporal areas, probably related to the perceptual process of the eye gaze as a biological motion. Activation in the occipital pole is close to the recently reported kinetic occipital area (KO) known to process both shape and motion information (Orban et al., 1995); Dupont et al., 1997)). The activation extends anteriorly, including the lateral occipital area (LO), which is thought to have a role in object representation (Malach et al., 1995); Grill-Spector et al., 1998), 1999)). As perception of animacy via visual motion cues is represented in the presumed KO and LOC (Morito et al., 2009)), biological motion such as eye gaze might also be processed in these early visual areas, probably corresponding to ID. STS activation has been reported (Pelphrey et al., 2005b)) using an averted gaze signal without a directed goal. These activation patterns are consistent with a recent computational model of biological motion perception, which proposes that the posterior STS integrates form information from a “ventral” pathway and motion information from a “dorsal” pathway (Giese and Poggio, 2003)).
In summary, the present study revealed that the exchange of social attention through the eye gaze was partly represented by the inter-subject synchronization of the neural activity in the right IFG, shedding light on the neural mechanisms of inter-subjectivity based on the view of the brain as an operating-on-its-own system.
Conflict of Interest Statement
The authors declare that the research was conducted in the absence of any commercial or financial relationships that could be construed as a potential conflict of interest.
Acknowledgments
Daisuke N. Saito and Hiroki C. Tanabe are equally contributed to this work. The authors thank Drs. T. Ozaki and J. Bosch-Bayard for their advice on the NN-ARx program. This study was partly supported by Grants-in Aid for Scientific Research S#17100003 and S#21220005 to Norihiro Sadato from the Japan Society for the Promotion of Science, and “Development of biomarker candidates for social behavior” carried out under the Strategic Research Program for Brain Sciences by the Ministry of Education, Culture, Sports, Science and Technology of Japan.
Footnotes
References
Allison, T., Puce, A., and McCarthy, G. (2000). Social perception from visual cues: role of the STS region. Trends Cogn. Sci. 4, 267–278.
Amodio, D. M., and Frith, C. D. (2006). Meeting of minds: the medial frontal cortex and social cognition. Nat. Rev. Neurosci. 7, 268–277.
Ban, T., Shiwa, T., and Kawamura, K. (1991). Cortico-cortical projections from the prefrontal cortex to the superior temporal sulcal area (STs) in the monkey studied by means of HRP method. Arch. Ital. Biol. 129, 259–272.
Bandettini, P. A. (2001). “Selection of the optimal pulse sequence for functional MRI,” in Functional MRI: An Introduction to Methods, eds P. Jezzard, P. M. Matthews, and S. M. Smith (Oxford: Oxford University Press), 123–143.
Baron-Cohen, S., Cox, A., Baird, G., Swettenham, J., Nightingale, N., Morgan, K., Drew, A., and Charman, T. (1996). Psychological markers in the detection of autism in infancy in a large population. Br. J. Psychiatry 168, 158–163.
Bisley, J. W., and Goldberg, M. E. (2003). The role of the parietal cortex in the neural processing of saccadic eye movements. Adv. Neurol. 93, 141–157.
Biswal, B., Yetkin, F. Z., Haughton, V. M., and Hyde, J. S. (1995). Functional connectivity in the motor cortex of resting human brain using echo-planar MRI. Magn. Reson. Med. 34, 537–541.
Bristow, D., Rees, G., and Frith, C. D. (2007). Social interaction modifies neural response to gaze shifts. Soc. Cogn. Affect. Neurosci. 2, 52–61.
Calder, A. J., Beaver, J. D., Winston, J. S., Dolan, R. J., Jenkins, R., Eger, E., and Henson, R. N. (2007). Separate coding of different gaze directions in the superior temporal sulcus and inferior parietal lobule. Curr. Biol. 17, 20–25.
Calder, A. J., Lawrence, A. D., Keane, J., Scott, S. K., Owen, A. M., Christoffels, I., and Young, A. W. (2002). Reading the mind from eye gaze. Neuropsychologia 40, 1129–1138.
Corkum, V., and Moore, C. (1998). The origins of joint visual attention in infants. Dev. Psychol. 34, 28–38.
de Vignemont, F., and Haggard, P. (2008). Action observation and execution: what is shared? Soc. Neurosci. 3, 421–433.
Driver, J., Davis, G., Ricciardelli, P., Kidd, P., Maxwell, E., and Baron-Cohen, S. (1999). Gaze perception triggers reflexive visuospatial orienting. Vis. Cogn. 6, 509–540.
Dupont, P., De Bruyn, B., Vandenberghe, R., Rosier, A. M., Michiels, J., Marchal, G., Mortelmans, L., and Orban, G. A. (1997). The kinetic occipital region in human visual cortex. Cereb. Cortex 7, 283–292.
Fair, D. A., Schlaggar, B. L., Cohen, A. L., Miezin, F. M., Dosenbach, N. U., Wenger, K. K., Fox, M. D., Snyder, A. Z., Raichle, M. E., and Petersen, S. E. (2007). A method for using blocked and event-related fMRI data to study “resting state” functional connectivity. Neuroimage 35, 396–405.
Farroni, T., Csibra, G., Simion, F., and Johnson, M. H. (2002). Eye contact detection in humans from birth. Proc. Natl. Acad. Sci. U.S.A. 99, 9602–9605.
Fox, M. D., Snyder, A. Z., Vincent, J. L., Corbetta, M., Van Essen, D. C., and Raichle, M. E. (2005). The human brain is intrinsically organized into dynamic, anticorrelated functional networks. Proc. Natl. Acad. Sci. U.S.A. 102, 9673–9678.
Fox, M. D., Snyder, A. Z., Zacks, J. M., and Raichle, M. E. (2006). Coherent spontaneous activity accounts for trial-to-trial variability in human evoked brain responses. Nat. Neurosci. 9, 23–25.
Fox, M. D., Snyder, A. Z., Vincent, J. L., and Raichle, M. E. (2007). Intrinsic fluctuations within cortical systems account for intertrial variability in human behavior. Neuron 56, 171–184.
Friesen, C. K., and Kingstone, A. (1998). The eyes have it! Reflexive orienting is triggered by nonpredictive gaze. Psychon. Bull. Rev. 5, 490–495.
Friston, K. J., Ashburner, J., Frith, C. D., Heather, J. D., and Frackowiak, R. S. J. (1995a). Spatial registration and normalization of images. Hum. Brain Mapp. 2, 165–189.
Friston, K. J., Holmes, A. P., Worsley, K. J., Poline, J. B., Frith, C. D., and Frackowiak, R. S. J. (1995b). Statistical parametric maps in functional imaging: a general linear approach. Hum. Brain Mapp. 2, 189–210.
Friston, K. J., Holmes, A., Poline, J.-B., Price, C. J., and Frith, C. D. (1996). Detecting activations in PET and fMRI: levels of inference and power. Neuroimage 4, 223–235.
Friston, K. J., Holmes, A. P., and Worsley, K. J. (1999). How many subjects constitute a study? Neuroimage 10, 1–5.
Friston, K. J., Ashburner, J., Kiebel, S. J., Nichols, T. E., and Penny, W. D. (2007). Statistical Parametric Mapping: The Analysis of Functional Brain Images. London: Elsevier.
Gallese, V., Fadiga, L., Fogassi, L., and Rizzolatti, G. (1996). Action recognition in the premotor cortex. Brain 119(Pt 2), 593–609.
Gee, A. L., Ipata, A. E., Gottlieb, J., Bisley, J. W., and Goldberg, M. E. (2008). Neural enhancement and pre-emptive perception: the genesis of attention and the attentional maintenance of the cortical salience map. Perception 38, 389–400.
George, N., Driver, J., and Dolan, R. J. (2001). Seen gaze-direction modulates fusiform activity and its coupling with other brain areas during face processing. Neuroimage 13, 1102–1112.
Giese, M. A., and Poggio, T. (2003). Neural mechanisms for the recognition of biological movements. Nat. Rev. Neurosci. 4, 179–192.
Greicius, M. D., Krasnow, B., Reiss, A. L., and Menon, V. (2003). Functional connectivity in the resting brain: a network analysis of the default mode hypothesis. Proc. Natl. Acad. Sci. U.S.A. 100, 253–258.
Grefkes, C., and Fink, G. R. (2005). The functional organization of the intraparietal sulcus in humans and monkeys. J. Anat. 207, 3–17.
Grill-Spector, K., Kushnir, T., Edelman, S., Itzchak, Y., and Malach, R. (1998). Cue-invariant activation in object-related areas of the human occipital lobe. Neuron 21, 191–202.
Grill-Spector, K., Kushnir, T., Edelman, S., Avidan, G., Itzchak, Y., and Malach, R. (1999). Differential processing of objects under various viewing conditions in the human lateral occipital complex. Neuron 24, 187–203.
Hampson, M., Peterson, B. S., Skudlarski, P., Gatenby, J. C., and Gore, J. C. (2002). Detection of functional connectivity using temporal correlations in MR images. Hum. Brain Mapp. 15, 247–262.
Heywood, C. A., and Cowey, A. (1992). The role of the ‘face-cell’ area in the discrimination and recognition of faces by monkeys. Philos. Trans. R. Soc. Lond. B Biol. Sci. 335, 31–37; discussion 37–38.
Hietanen, J. K. (1999). Does your gaze direction and head orientation shift my visual attention? Neuroreport 10, 3443–3447.
Hoffman, E. A., and Haxby, J. V. (2000). Distinct representations of eye gaze and identity in the distributed human neural system for face perception. Nat. Neurosci. 3, 80–84.
Hooker, C. I., Paller, K. A., Gitelman, D. R., Parrish, T. B., Mesulam, M. M., and Reber, P. J. (2003). Brain networks for analyzing eye gaze. Brain Res. Cogn. Brain Res. 17, 406–418.
Hopfinger, J. B., Buonocore, M. H., and Mangun, G. R. (2000). The neural mechanisms of top-down attentional control. Nat. Neurosci. 3, 284–291.
Kawashima, R., Sugiura, M., Kato, T., Nakamura, A., Hatano, K., Ito, K., Fukuda, H., Kojima, S., and Nakamura, K. (1999). The human amygdala plays an important role in gaze monitoring. A PET study. Brain 122(Pt 4), 779–783.
Keenan, J. P., Wheeler, M. A., Gallup, G. G. Jr., and Pascual-Leone, A. (2000). Self-recognition and the right prefrontal cortex. Trends Cogn. Sci. 4, 338–344.
Keller, H., Scholmerich, A., and Eibl-Eibesfeldt, I. (1988). Communication patterns in adult–infant interactions in western and non-western cultures. J. Cross Cult. Psychol. 19, 427–445.
Kenet, T., Bibitchkov, D., Tsodyks, M., Grinvald, A., and Arieli, A. (2003). Spontaneously emerging cortical representations of visual attributes. Nature 425, 954–956.
Langton, S. R. H., and Bruce, V. (1999). Reflexive visual orienting in response to the social attention of others. Vis. Cogn. 6, 541–568.
Leslie, K. R., Johnson-Frey, S. H., and Grafton, S. T. (2004). Functional imaging of face and hand imitation: towards a motor theory of empathy. Neuroimage 21, 601–607.
Lowe, M. J., Mock, B. J., and Sorenson, J. A. (1998). Functional connectivity in single and multislice echoplanar imaging using resting-state fluctuations. Neuroimage 7, 119–132.
Malach, R., Reppas, J. B., Benson, R. R., Kwong, K. K., Jlang, H., Kennedy, W. A., Ledden, P. J., Brady, T. J., Rosen, B. R., and Tootell, R. B. H. (1995). Object-related activity revealed by functional magnetic resonance imaging in human occipital cortex. Proc. Natl. Acad. Sci. U.S.A. 92, 8135–8139.
Materna, S., Dicke, P. W., and Their, P. (2008). Dissociable roles of the superior temporal sulcus and the intraparietal sulcus in joint attention: a functional magnetic resonance imaging study. J. Cogn. Neurosci. 20, 1–11.
Montague, P. R., Berns, G. S., Cohen, J. D., McClure, S. M., Pagnoni, G., Dhamala, M., Wiest, M. C., Karpov, I., King, R. D., Apple, N., and Fisher, R. E. (2002). Hyperscanning: simultaneous fMRI during linked social interactions. Neuroimage 16, 1159–1164.
Morita, T., Itakura, S., Saito, D. N., Nakashita, S., Harada, T., Kochiyama, T., and Sadato, N. (2008). The role of the right prefrontal cortex in self-evaluation of the face: a functional magnetic resonance imaging study. J. Cogn. Neurosci. 20, 342–355.
Morito, Y., Tanabe, H. C., Kochiyama, T., and Sadato, N. (2009). Neural representation of animacy in the early visual areas: a functional MRI study. Brain Res. Bull. 79, 271–280.
Mosconi, M. W., Mack, P. B., McCarthy, G., and Pelphrey, K. A. (2005). Taking an “intentional stance” on eye-gaze shifts: a functional neuroimaging study of social perception in children. Neuroimage 27, 247–252.
Mundy, P., Sigman, M., Ungerer, J., and Sherman, T. (1986). Defining the social deficits of autism: the contribution of non-verbal communication measures. J. Child Psychol. Psychiatr. 27, 657–669.
Nishitani, N., Schurmann, M., Amunts, K., and Hari, R. (2005). Broca’s region: from action to language. Physiology (Bethesda) 20, 60–69.
Nummenmaa, L., and Calder, A. J. (2009). Neural mechanisms of social attention. Trends Cogn. Sci. 13, 135–143.
Oldfield, R. C. (1971). The assessment and analysis of handedness: the Edinburgh inventory. Neuropsychologia 9, 97–113.
Orban, G. A., Dupont, P., De Bruyn, B., Vogels, R., Vandenberghe R., and Mortelmans, L. (1995). A motion area in human visual cortex. Proc. Natl. Acad. Sci. U.S.A. 92, 993–997.
Pelphrey, K. A., Morris, J. P., Michelich, C. R., Allison, T., and McCarthy, G. (2005a). Functional anatomy of biological motion perception in posterior temporal cortex: an fMRI study of eye, mouth and hand movements. Cereb. Cortex 15, 1866–1876.
Pelphrey, K. A., Morris, J. P., Michelich, C. R., Allison, T., and McCarthy, G. (2005b). Functional anatomy of biological motion perception in posterior temporal cortex: an fMRI study of eye, mouth and hand movements. Cereb. Cortex 15, 1866–1876.
Platek, S. M., Keenan, J. P., Gallup, G. G. Jr., and Mohamed, F. B. (2004). Where am I? The neurological correlates of self and other. Cogn. Brain Res. 19, 114–122.
Purdon, P., and Weisskoff, R. (1998). Effect of temporal autocorrelation due to physiological noise and stimulus paradigm on voxel-level false-positive rates in fMRI. Hum. Brain Mapp. 6, 239–249.
Ricciardelli, P., Bricolo, E., Aglioti, S. M., and Chelazzi, L. (2002). My eyes want to look where your eyes are looking: exploring the tendency to imitate another individual’s gaze. Neuroreport 13, 2259–2264.
Riera, J. J., Bosch, J., Yamashita, O., Kawashima, R., Sadato, N., Okada, T., and Ozaki, T. (2004). fMRI activation maps based on the NN-ARx model. Neuroimage 23, 680–697.
Rizzolatti, G., Fadiga, L., Matelli, M., Bettinardi, V., Paulesu, E., Perani, D., and Fazio, F. (1996). Localization of grasp representations in humans by PET: 1. Observation versus execution. Exp. Brain Res. 111, 246–252.
Striano, T., Reid, V. M., and Hoehl, S. (2006). Neural mechanisms of joint attention in infancy. Eur. J. Neurosci. 23, 2819–2823.
Sugiura, M., Sassa, Y., Jeong, H., Miura, N., Akitsuki, Y., Horie, K., Sato, S., and Kawashima, R. (2006). Multiple brain networks for visual self-recognition with different sensitivity for motion and body part. Neuroimage 32, 1905–1917.
Talairach, J., and Tournoux, P. (1988). Co-planar Stereotaxic Atlas of the Human Brain. New York: Tieme.
Trevarthen, C. (1979). “Instincts for human understanding and for cultural cooperation: their development in infancy,” in Human Ethology: Claims and Limits of a New Discipline, eds M. von Cranach, K. Foppa, W. Lepenies, and D. Ploog (Cambridge: Cambridge University Press), 530–571.
Trevarthen, C. (1993). “The function of emotions in early communication and development” in New Perspectives in Early Communicative Development, eds J. Nadel and L. Camaioni (New York: Routledge), 48-81.
Tsodyks, M., Kenet, T., Grinvald, A., and Arieli, A. (1999). Linking spontaneous activity of single cortical neurons and the underlying functional architecture. Science 286, 1943–1946.
Vecera, S. P., and Rizzo, M. (2006). Eye gaze does not produce reflexive shifts of attention: evidence from frontal-lobe damage. Neuropsychologia 44, 150–159.
Wicker, B., Michel, F., Henaff, M. A., and Decety, J. (1998). Brain regions involved in the perception of gaze: a PET study. Neuroimage 8, 221–227.
Williams, J. H. G., Waiter, G. D., Perra, O., Perrett, D. I., and Whiten, A. (2005). An fMRI study of joint attention experience. Neuroimage 25, 133–140.
Keywords: eye contact, functional MRI, hyper-scan, joint attention
Citation: Saito DN, Tanabe HC, Izuma K, Hayashi MJ, Morito Y, Komeda H, Uchiyama H, Kosaka H, Okazawa H, Fujibayashi Y and Sadato N (2010) “Stay tuned”: inter-individual neural synchronization during mutual gaze and joint attention. Front. Integr. Neurosci. 4:127. doi: 10.3389/fnint.2010.00127
Received: 21 April 2010;
Accepted: 12 October 2010;
Published online: 05 November 2010.
Edited by:
Emiliano Macaluso, Fondazione Santa Lucia, ItalyReviewed by:
Ivan Toni, Radboud University, Netherlands;Darren R. Gitelman, Northwestern University, USA
Copyright: © 2010 Saito, Tanabe, Izuma, Hayashi, Morito, Komeda, Uchiyama, Kosaka, Okazawa, Fujibayashi and Sadato. This is an open-access article subject to an exclusive license agreement between the authors and the Frontiers Research Foundation, which permits unrestricted use, distribution, and reproduction in any medium, provided the original authors and source are credited.
*Correspondence: Norihiro Sadato, Department of Cerebral Research, National Institute for Physiological Sciences, 38 Nishigonaka, Myodaiji, Okazaki, Aichi 444-8585, Japan. e-mail: sadato@nips.ac.jp