Effects of initial eye position on saccades evoked by microstimulation in the primate superior colliculus: implications for models of the SC read-out process
- 1 Center for Cognitive Neuroscience, Duke University, Durham, NC, USA
- 2 Department of Neurobiology, Duke University, Durham, NC, USA
- 3 Department of Psychology and Neuroscience, Duke University, Durham, NC, USA
The motor layers of the superior colliculus (SC) are thought to specify saccade amplitude and direction, independent of initial eye position. However, recent evidence suggests that eye position can modulate the level of activity of SC motor neurons. In this study, we tested whether initial eye position has an effect on microstimulation-evoked saccade amplitude. High (>300 Hz) and low (<300 Hz) frequency microstimulation was applied to 30 sites in the rostral part of the SC of two monkeys while they fixated one of six different locations. We found that the amplitude of the evoked saccades decreased with more contralateral initial eye positions. This effect was more pronounced in low frequency- compared to high frequency-evoked saccades, although it was present for both. Replication of these findings in head-free experiments showed that the effect of initial eye position was not due to physical constraints imposed by the oculomotor range. In addition to the effect of eye position on saccade amplitude, we also observed an increase in saccade latency and a decrease in the probability that microstimulation would evoke a saccade for low frequency stimulation at more contralateral eye positions. These findings suggest that an eye position signal can contribute to the read-out of the SC. Models of the saccadic pulse-step generator may need revision to incorporate an eye position modulation at the input stage.
Introduction
The superior colliculus (SC) plays an important role in controlling orienting movements of the eyes. In primates, the SC is thought to contain a motor map in which a given location specifies a saccadic gaze shift (eye movement in space) with a particular direction and amplitude (Wurtz and Goldberg, 1971; Cynader and Berman, 1972). Early electrical stimulation studies suggested that only the site of activity was important for specifying the amplitude and direction of saccades (Robinson, 1972; Schiller and Stryker, 1972). However, several later studies suggested that the level of activity on this map may also play a role in saccade control (Van Opstal et al., 1990; Paré et al., 1994; Stanford et al., 1996). For example, Stanford et al. (1996) showed that saccade amplitude was governed by the site of stimulation and did not depend on stimulation strength (number of pulses in a stimulation train) provided a certain minimum number of pulses were delivered. When the number of pulses dropped below that point, movements were smaller: saccade amplitude scaled with the number of stimulation pulses.
These studies have important implications for how the SC’s activity is read-out, and in particular, the role of the level of activity in the read-out process. In producing an output signal, each SC neuron can be thought of as “voting” for its preferred saccade vector. There are several potential ways of tallying the votes. If a weighted average saccade vector is calculated, the output is

where ai is the activity of an individual neuron and wi is a weight corresponding to its preferred saccade vector. In this scheme, the votes are tallied as a proportion of the total activity. The site receiving the greatest proportional vote dictates the output, but the absolute level of activity at that site does not matter. Under this algorithm, only the site and not the strength of stimulation would affect the amplitude of the evoked saccade.
In contrast, if a weight sum saccade vector is calculated, the total quantity of votes is important:

With no normalization for the overall level of activity, saccade amplitude should scale not only with stimulation location but also with stimulation strength. Recruiting more neurons or driving them more vigorously would increase the number of votes and thus the length of the desired saccade vector. The dependence of saccade endpoint on stimulation parameters up to a certain number of stimulation pulses, as observed by Stanford et al. (1996) can be accounted for by a mechanism that calculates a weighted sum until a certain amount of activity has occurred, after which additional activity is ignored (Groh, 2001; see also Goossens and Van Opstal, 2006 for a detailed model).
Variations in the level of activity in the SC associated with a given movement do not just occur through variations in the strength of electrical stimulation, but occur naturally with changes in the position of the eyes in the orbits (Van Opstal et al., 1995; Paré and Munoz, 2001; Campos et al., 2006). Peak firing rate of saccade-related bursts was found to vary with the initial position of the eyes (Van Opstal et al., 1995). Thus, although the site of activity is identical for saccades of identical vectors originating from different initial positions (Jay and Sparks, 1987), the level of the activity changes. A related study extended this finding to body position (Nagy and Corneil, 2009). These observations suggest that postural factors influence the vigor of neural activity patterns in the SC and affect motor preparation (Corneil et al., 2007; Rezvani and Corneil, 2008).
Does eye position, by influencing the level of activity in the SC, affect the saccade command provided by the SC? Previous microstimulation studies in the monkey SC have suggested that eye position is not part of the saccade goal signal. Microstimulation of a given site at a sufficiently high frequency produces approximately fixed-vector eye movements, mostly independent of initial eye position (Robinson, 1972; Schiller and Stryker, 1972; Van Opstal et al., 1991; Hepp et al., 1993). The modest eye position dependence observed in these studies appeared to be due to the limits imposed by the oculomotor range. In head-unrestrained animals, fixed-vector gaze shifts (combined eye–head movements are evoked when the combination of fixation position and site-specific saccade vector would entail a saccade terminating outside the actual (±40°) or commonly used (±20°) oculomotor range (Freedman et al., 1996; Freedman and Sparks, 1997a; Klier et al., 2001; but see Segraves and Goldberg, 1992). A similar pattern has been observed in cats (Paré et al., 1994).
We reasoned that the failure of these stimulation studies to find evidence for an effect of eye position on evoked saccade amplitude except when limited by the oculomotor range might have been due to the use of strong electrical stimulation. The normalization process invoked by such stimulation strengths might have served to remove the small modulation by eye position present naturally. Our results confirmed this hypothesis: saccades evoked by low frequency electrical stimulation showed eye position dependence, more so than was the case for saccades evoked by high frequency electrical stimulation. These findings provide constraints for models of how activity in the SC is converted into motor commands.
Materials and Methods
Animal Preparation
Two adult rhesus monkeys (Macaca mulatta, one female) served as subjects for these experiments. All animal procedures were conducted in accordance with the principles of laboratory animal care of the National Institutes of Health (publication 86-23, revised 1985) and were approved by the Institutional Animal Care and Use Committee at Duke University. Surgical procedures were conducted using suitable anesthesia and analgesics. Subjects underwent sterile surgery for the implantation of a head post holder, eye coil, and recording chamber. Prior to the experiments, subjects were trained to fixate and generate saccades to LEDs for liquid reward. During experimental sessions, electrical microstimulation was applied to the right SC of each subject. The present dataset consists of a total of 30 stimulation sites (20 in monkey C; 10 in monkey S).
Experimental Design and Behavioral Task
During experimental sessions, each subject was seated in a primate chair (Crist Instruments, Hagerstown, MD, USA) with its head restrained in a dimly lit room in front of an array of LEDs. Subjects performed a standard visually guided saccade task while a tungsten microelectrode (impedance between 0.9 and 1.5 MΩ at 1 kHz; FHC, Bowdoin, ME, USA) was advanced through to the SC using an oil hydraulic pulse motor microdrive (Narishige, East Meadow, NY, USA). Multi-unit activity was monitored using standard electrophysiological techniques, and microstimulation was applied at sites where saccade-related activity was observed. If saccades could be reliably evoked at short latency by low frequency (<300 Hz) microstimulation at 50 μA, the microstimulation experiment (see below) was conducted.
A schematic of the task used for the microstimulation experiment is shown in Figure 1B. On each trial, subjects were required to fixate one of five or six LEDs, spaced ∼5–6° apart between ∼15° to the left and ∼15° to the right of the midline along the horizontal meridian (fixation LED, see Figure 1A; location values given are after a tangent screen correction was applied). These fixation positions were chosen to sample a reasonable amount of the oculomotor range without introducing orbital limitations to the amplitude of evoked saccades.
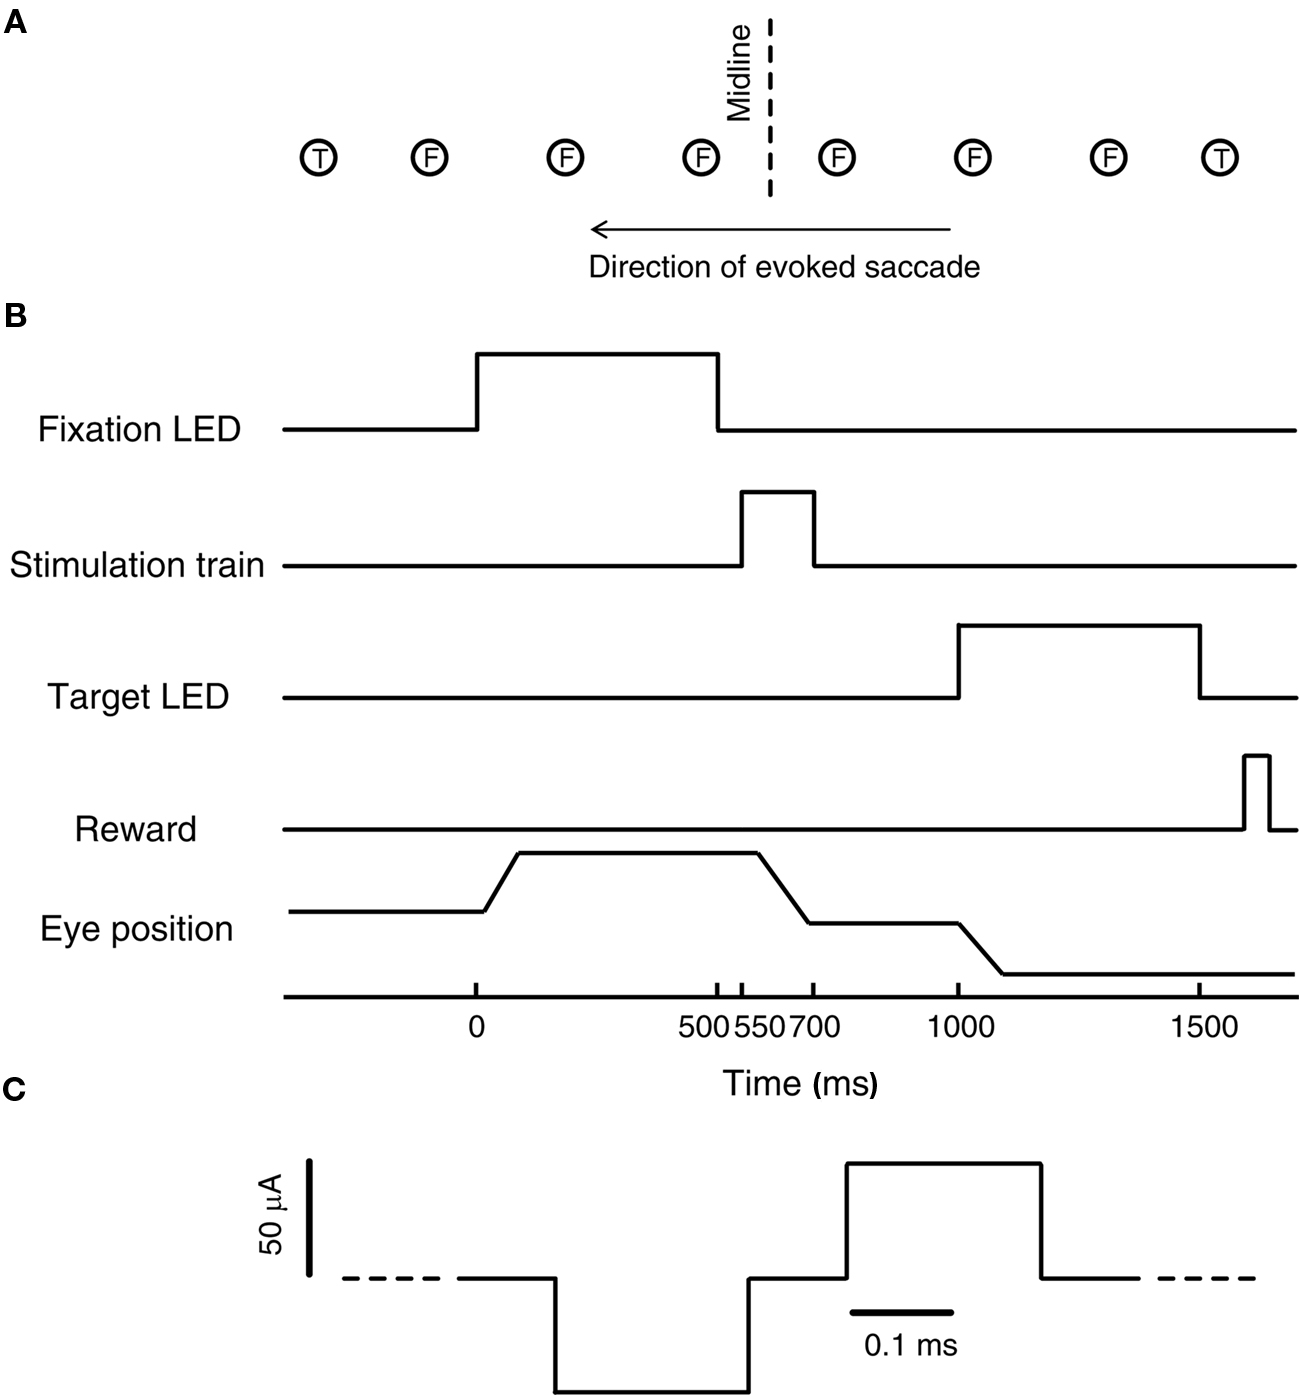
Figure 1. Experimental design. (A) Schematic of the stimulus array. Six evenly spaced fixation LEDs (F, between −15° and 15°), were aligned approximately along the axis of the evoked saccades. Two target LEDs (T) were located to the left and right of the array of fixation LEDs, along the same axis, at about 18° to the left and right of the midline. (B) Schematic of the temporal sequence of events in each trial. (C) Schematic of the microstimulation protocol. Pulses were biphasic pulse pairs (cathodal-leading).
After fixating for 500 ms, the fixation LED was turned off and a stimulation train was applied for 150 ms following a short gap (50 ms). To allow subjects to receive a reward on each trial, but to dissociate the reward from any stimulation-induced behavior, a visual target was presented 300 ms after offset of the stimulation train (target LED, see Figure 1A). The total time interval between fixation offset and target onset was 500 ms. Saccading to and maintaining fixation for 500 ms on the target LED resulted in a liquid reward. These targets were located 18.4° to the left and right of the midline, presented randomly. To prevent monkeys from anticipating the stimulation train, 20% (subject S) or 50% (subject C) of the trials consisted of catch trials, which were identical to the trials described above, except that no stimulation train was delivered during the 500-ms interval between fixation offset and target onset.
A typical experiment consisted of one session consisting of two blocks of 25–83 stimulation trials per site (see Table 1). Fixation location was chosen randomly on each trial. Constant current stimulation trains were generated using a Grass S88 stimulator in combination with Grass PSIU6 isolation units (Grass Technologies, West Warwick, RI, USA). Stimulation trains were fixed at 150 ms in duration and consisted of biphasic (alternating cathodal-leading) pulses (0.2 ms pulse duration, 0.1 ms inter-pulse interval) with an amplitude of 50 μA (Figure 1C). Frequency of microstimulation was constant within each block. In the first block, frequency was set to a frequency below 300 Hz that evoked saccades. This frequency was selected to be just above the threshold for eliciting a movement (based on a qualitative assessment). In the second block, frequency was set between 300 and 500 Hz, and usually at least 200 Hz higher than the low frequency block. Reversing this order in some sessions did not change the pattern of results.
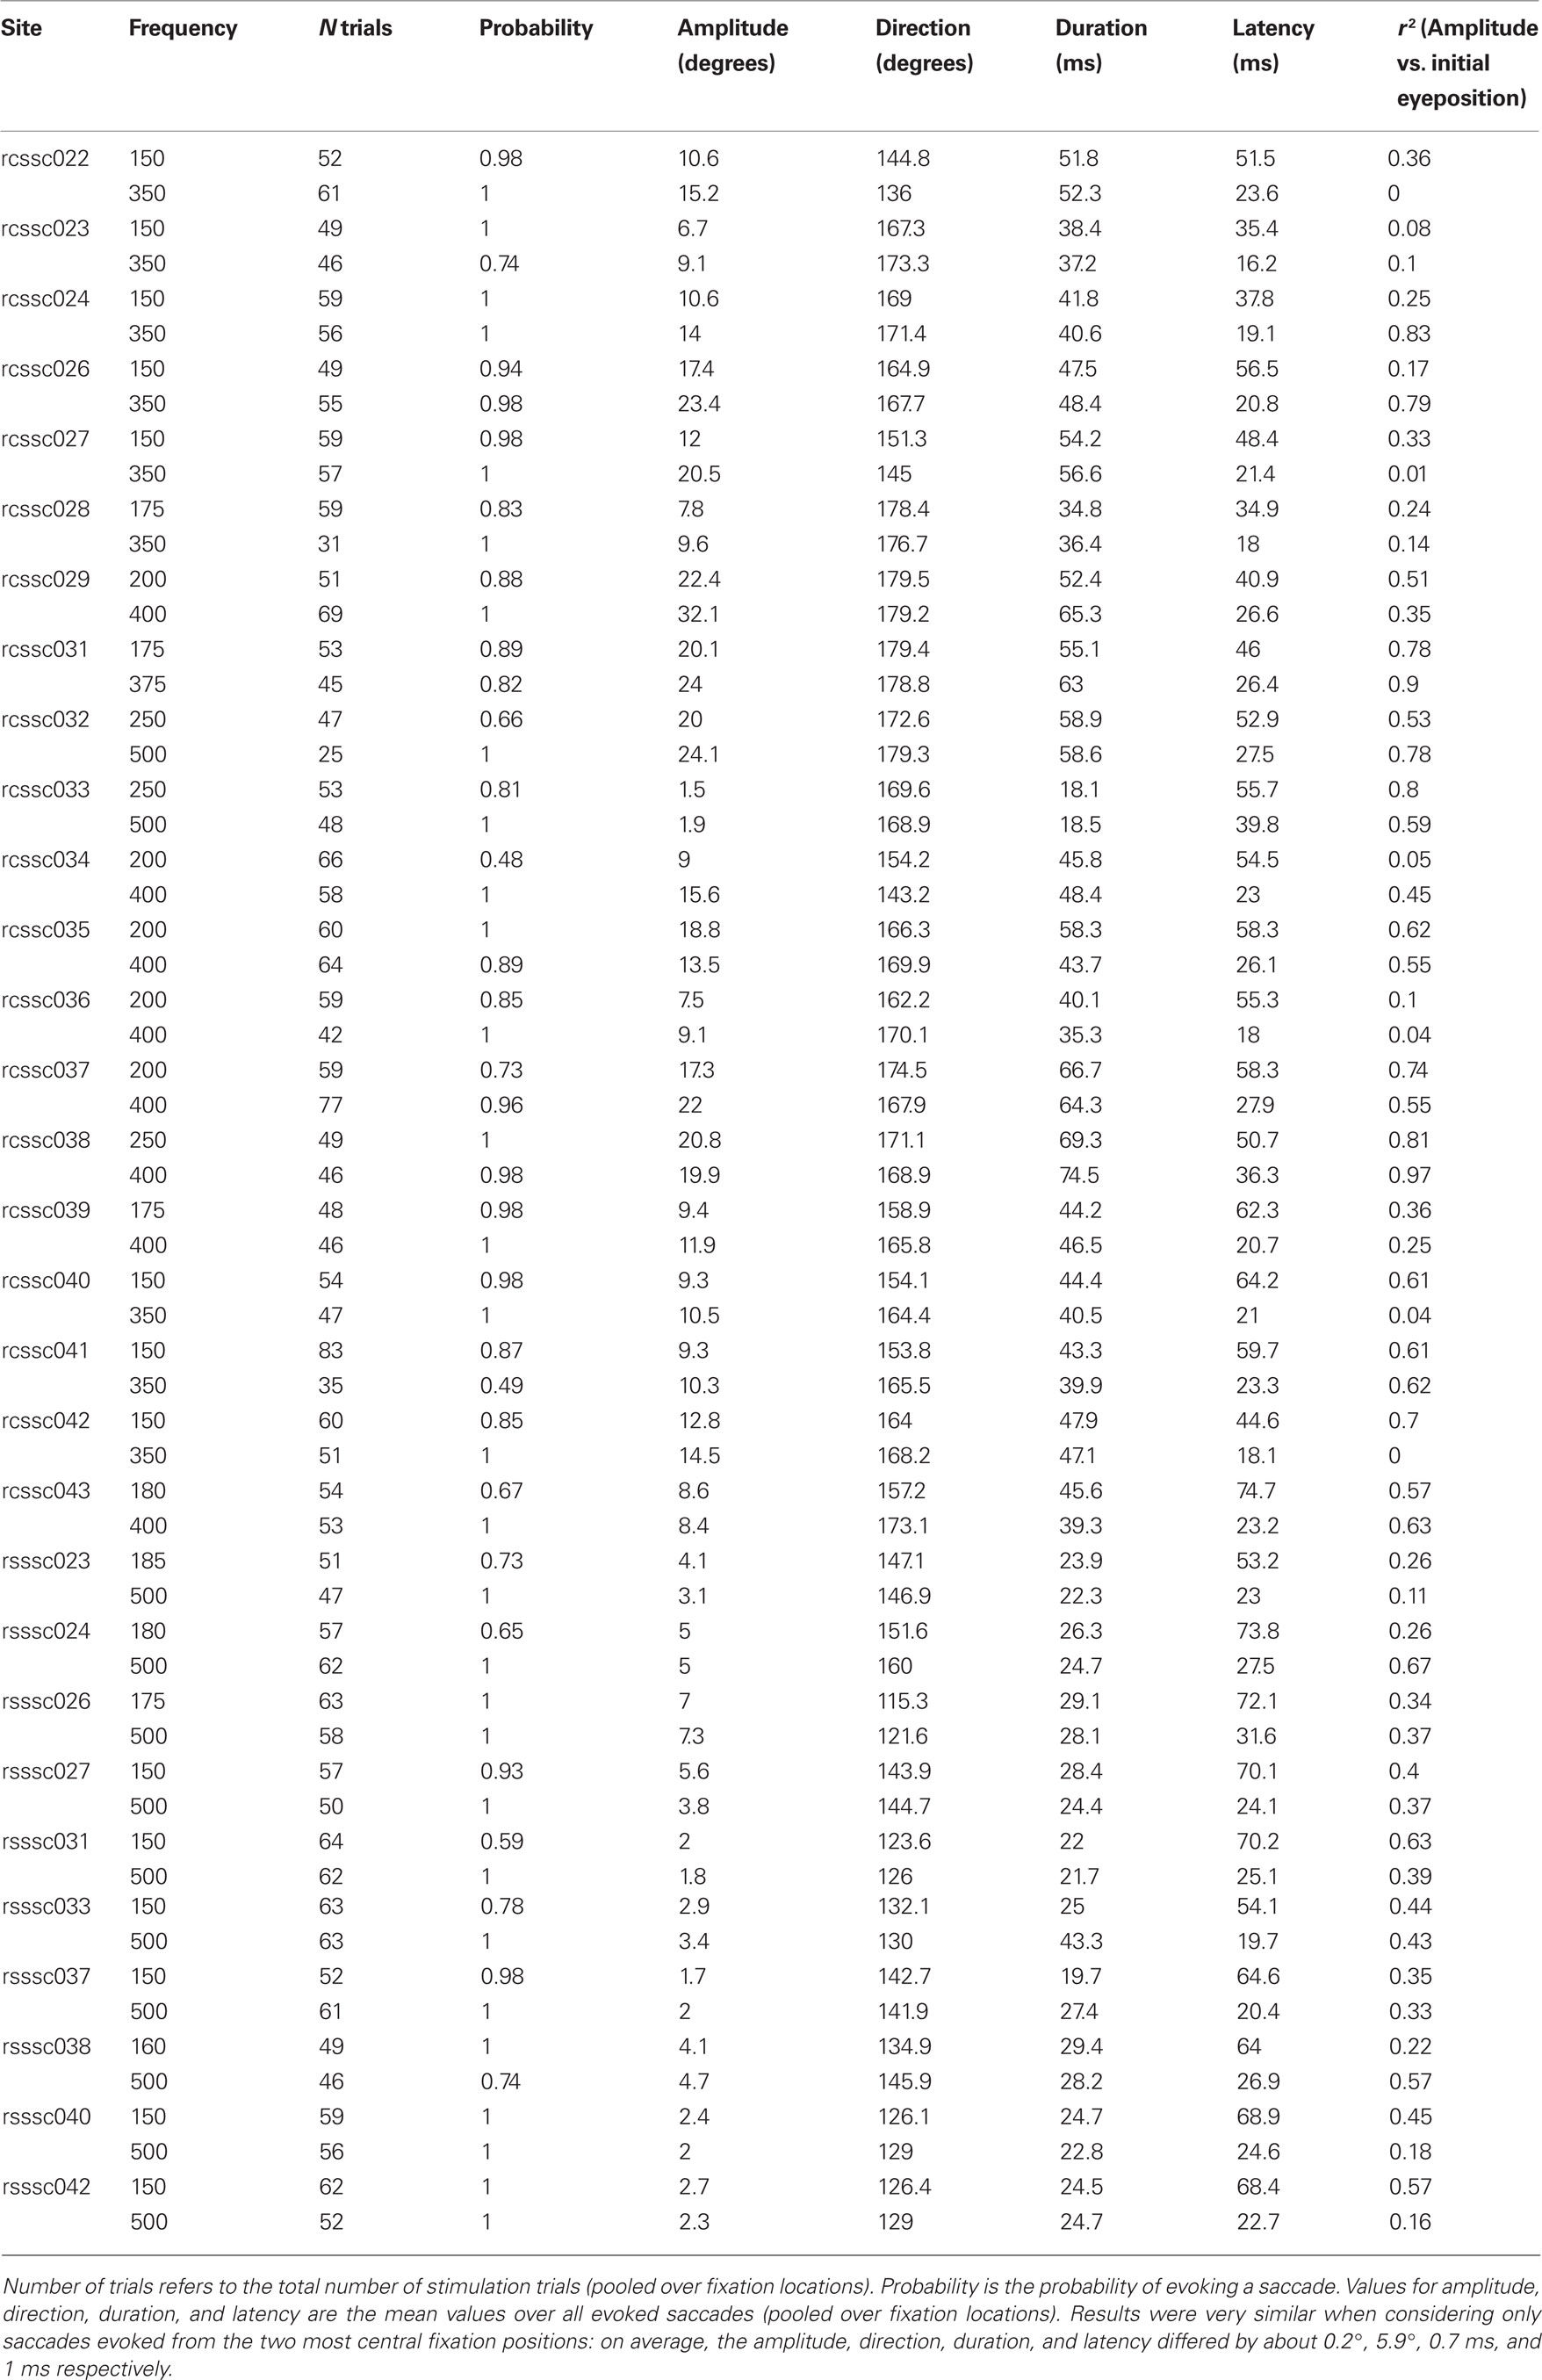
Table 1. Metrics of saccades evoked by low and high frequency microstimulation for each site.
Head-Free Setup
In a subset of experiments (n < 12, 7 in monkey C and 5 in monkey S), following the session described above, we ran an identical session while subjects were free to move their heads. In these sessions, the electrode was first lowered into the SC to a stimulation site while the head was restrained. Then the electrode was glued to the guide tube to hold it in place, the microdrive was removed, and the head was released from restraint. Head movements were monitored using a coil that was rigidly attached to the head via a small plastic device mounted to the head post holder. The head coil was calibrated by manually rotating the head to point out known locations with a laser pointer attached to the same head-mounted device. Both eye-in-space and head-in-space movements could thus be monitored (Freedman et al., 1996; Klier et al., 2001; Walton et al., 2007; Choi and Guitton, 2009).
Data Analysis
Data were stored and analyzed offline. Eye and head movement data were digitized at 500 Hz. Velocity criteria were used to detect saccade on- (27°/s) and offsets (25°/s). Only saccades that ended before offset of the stimulation train were included in the analyses. Very few saccades were excluded by this criterion: 98.5% of all saccades in the low frequency condition and 97.5% in the high frequency condition were included. All subsequent data analysis was performed in Matlab (The MathWorks, Natick, MA, USA). The mean values of the distributions over the population of stimulation sites were compared using a repeated measures t-test. All reported results were pooled over both subjects, but the same trends were present in the individual subjects.
Results
In the present study, we looked at saccades evoked by electrical microstimulation in the deep layers of the monkey SC. Initial eye position was varied by making subjects fixate different locations in space before the onset of the stimulation train (see Figure 1). Additionally, frequency of microstimulation could be either low (<300 Hz) or high (>300 Hz), while keeping all other stimulation parameters constant. A summary of characteristics of saccades evoked from each site is provided in Table 1.
Effects of Initial Eye Position and Frequency of Microstimulation on Saccade Amplitude
Figure 2A shows the mean saccade vectors evoked from multiple initial eye positions by microstimulation in one example site in the SC. Stimulation in the right SC reliably evoked contralateral saccades in both the high (blue traces) and low (red traces) frequency conditions.
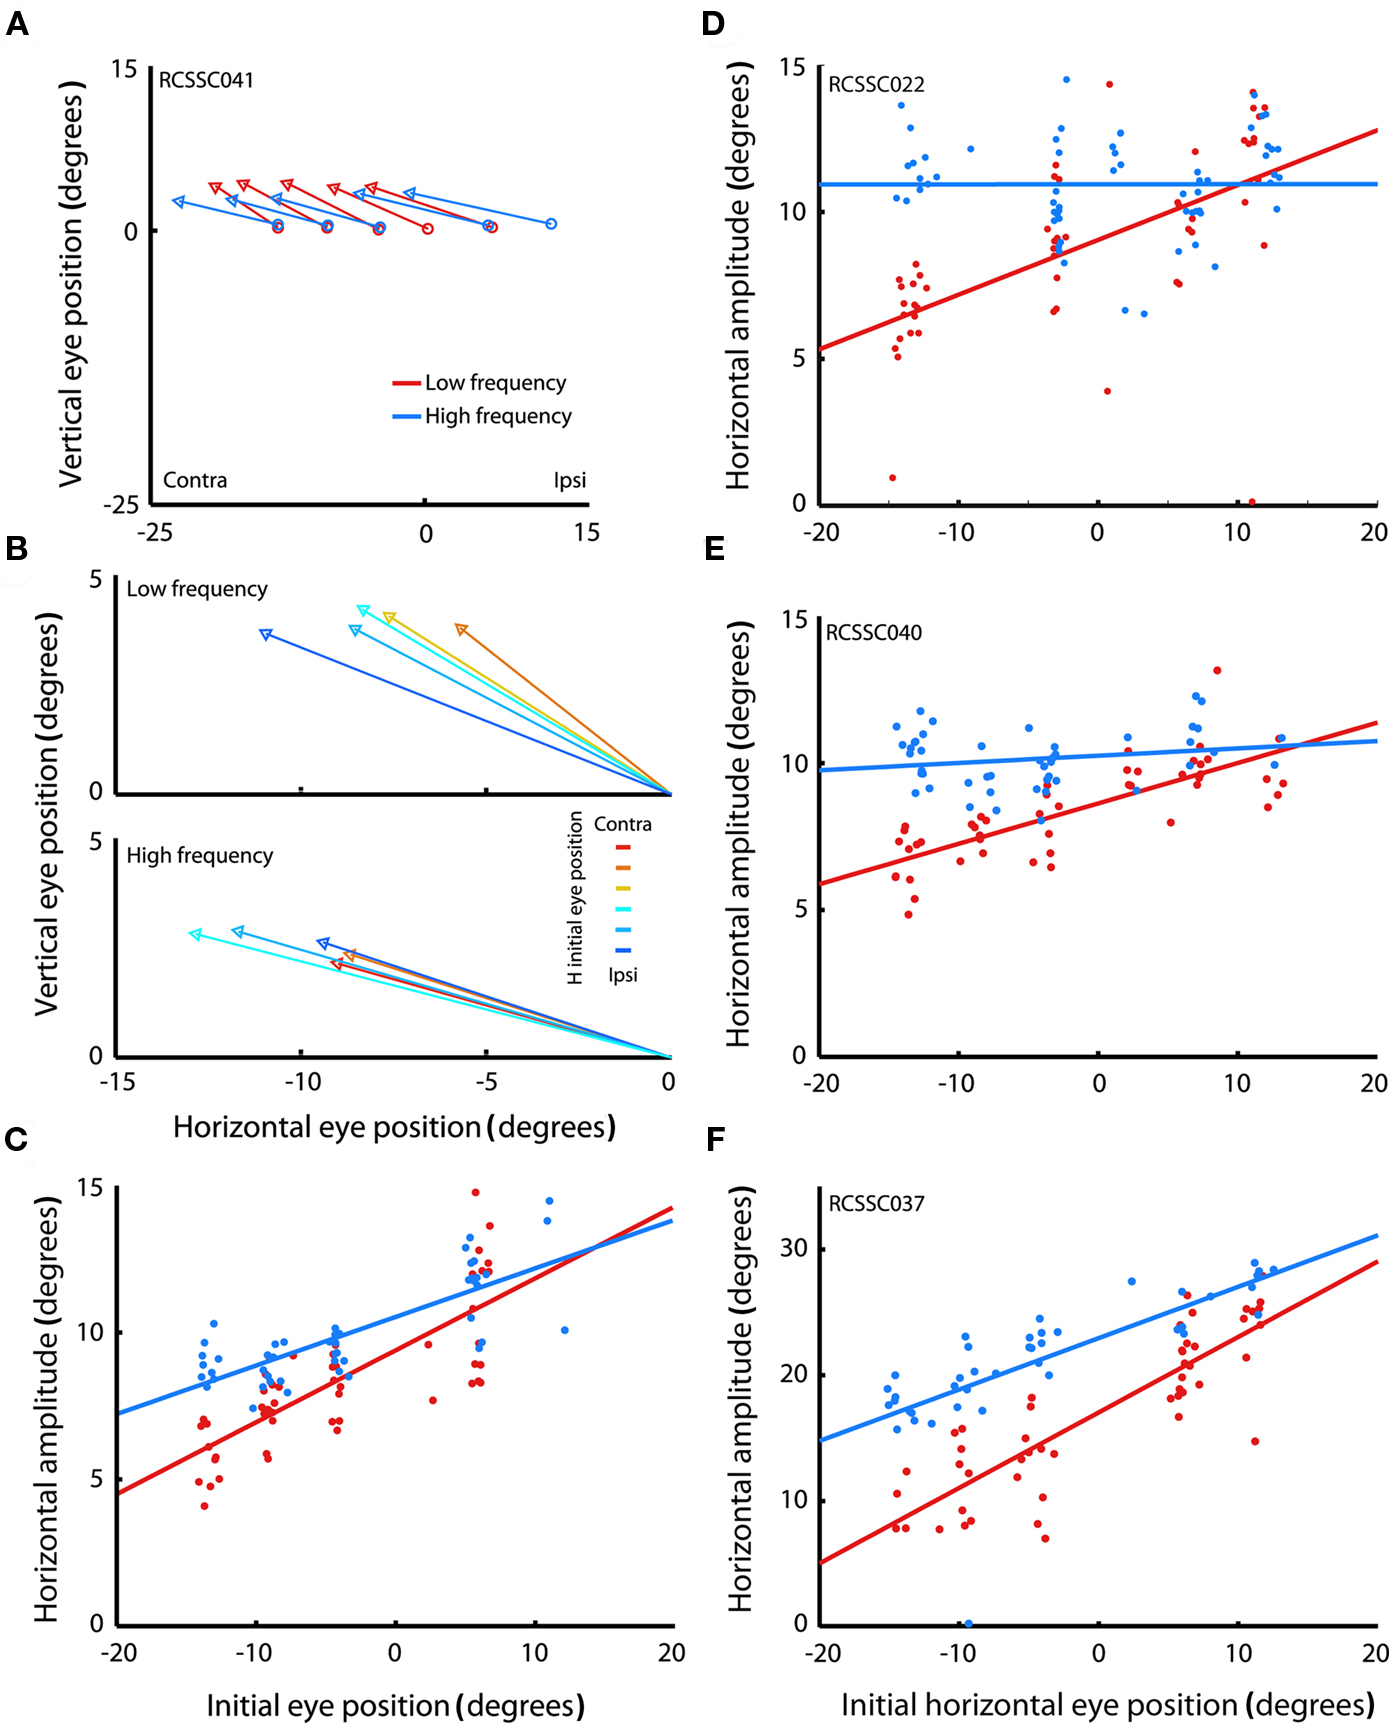
Figure 2. Saccades evoked by microstimulation in example sites in the superior colliculus. (A) Average saccade vectors evoked by low (red) and high (blue) frequency microstimulation in an example site in the SC. Vectors are the average of all the evoked saccades for each of the fixation LED locations. Circles indicate average startpoints; arrowheads average endpoints. (Missing data at some fixation positions is due to a combination of the random-with-replacement selection of fixation positions and the somewhat probabilistic evocation of saccades, especially at low frequencies; trials in which no saccade was produced were excluded from this analysis.) (B) Average saccade vectors for each fixation LED location (color-coded) evoked by low (upper panel) and high (lower panel) frequency microstimulation in the same site as shown in (A). Saccade vectors are aligned on a common origin to highlight the differences in vector as a function of initial eye position (indicated by color). Saccades evoked by both high- and low frequency stimulation showed an effect of initial eye position, but the effect was larger for low frequency stimulation. (C) Amplitude of individual saccades evoked by low and high frequency microstimulation in the same site as shown in (A,B), as a function of initial eye position. Lines show linear regression through the data. Each data point represents a single saccade (D–F). Same as (C), for three additional sites. The low frequency regression fits are significant for all sites illustrated (p < 0.0001); the high frequency regression fits are significant in (C,F) (p < 0.0001).
To highlight the effect of initial eye position, Figure 2B shows the mean vectors evoked from the different fixation positions, aligned on the origin. For this site, both low and high frequency stimulation-evoked saccades with an eye position dependence, as can be seen by the dispersion of the evoked saccade vectors in both the upper and lower panels: the evoked saccades are shorter for more contralateral fixation positions. However, the effect was more pronounced for low frequency stimulation. For low frequency stimulation, the endpoints of the saccade vectors vary by about 6° across the span of tested fixation positions (upper panel), so that evoked saccade amplitude ranges from about 6° to 12°. For high frequency stimulation the range is about 4° (saccade amplitudes of about 9–13°, lower panel).
Figure 2C shows the horizontal saccade amplitude for all saccades evoked from this site as a function of horizontal initial eye position for the low (red) and high (blue) frequency conditions. Linear regression revealed that the amplitude of the evoked saccades indeed decreased with more contralateral initial eye position (p < 0.0001). This decrease was more pronounced in saccades evoked by low, as compared to high frequency stimulation. Figures 2D–F show the amplitude of evoked saccades as a function of initial eye position for three additional sites, all of which showed the same pattern of a stronger eye position dependence for the lower stimulation frequency. (Note that there are also effects on the probability of evoking a saccade and its latency; these effects are considered in more detail in Figures 7 and 8).
The effect of eye position on saccade amplitude was observed in the majority of stimulation sites, with 28 out of 30 sites (93.3%) showing a significant regression fits for low frequency stimulation and 24 out of 30 sites (80%) showing the effect for high frequency stimulation. Figure 3A shows a histogram of slopes of the regressions relating amplitude to initial eye position, for both high and low frequency stimulation, for all 30 sites. The slopes were significantly larger than 0 for both stimulation frequencies (low frequency, t < 5.72, p < 0.0001; high frequency, t < 2.53, p < 0.05). Figure 3B demonstrates that the slopes were steeper for low frequency stimulation than for high frequency stimulation for nearly every site: the histogram plots the difference in slope between low and high frequency stimulation and skews toward positive values. This difference was statistically significant, both according to a sign test (27 out of 30 or 90% of sites exhibited a steeper slope for low vs. high frequency stimulation, p < 0.0001) and using a paired t-test (t < 4.26, p < 0.001). In short, these data indicate that amplitude of the evoked saccades decreased with more contralateral initial eye position, and that this effect is significantly stronger for low compared to high frequency stimulation.
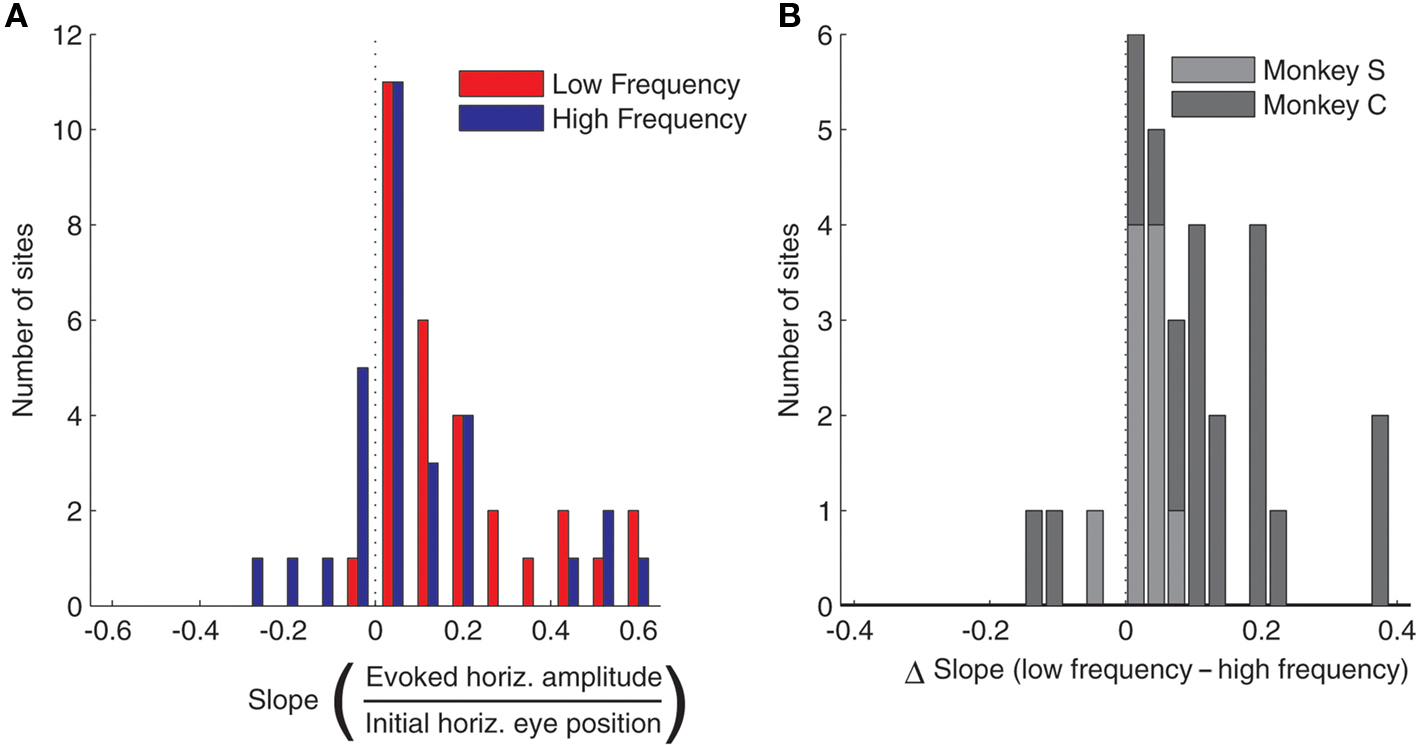
Figure 3. Population analysis of the effect of initial eye position on saccade amplitude. (A) Magnitude of slopes obtained from linear regression of evoked saccade amplitude on initial eye position for each stimulation site. Data are shown for low (red) and high (blue) frequency stimulation conditions. The component of amplitude parallel to the axis of the array of fixation LEDs was used for this analysis. (B) Differences in slope between low and high frequency conditions. Results were similar in the two monkeys, as indicated by different shades of gray.
Evoked saccades usually had a vertical component as well (see Figure 5A), but this component did not depend consistently on the horizontal variation in initial eye position. Figure 4A shows the slopes of the vertical amplitude of evoked saccades as a function of initial eye position. The slopes clustered tightly around 0, and there was no consistent trend toward either upward or downward movement components with horizontal changes in fixation position. There was also no difference between low and high frequency stimulation (Figure 4B).
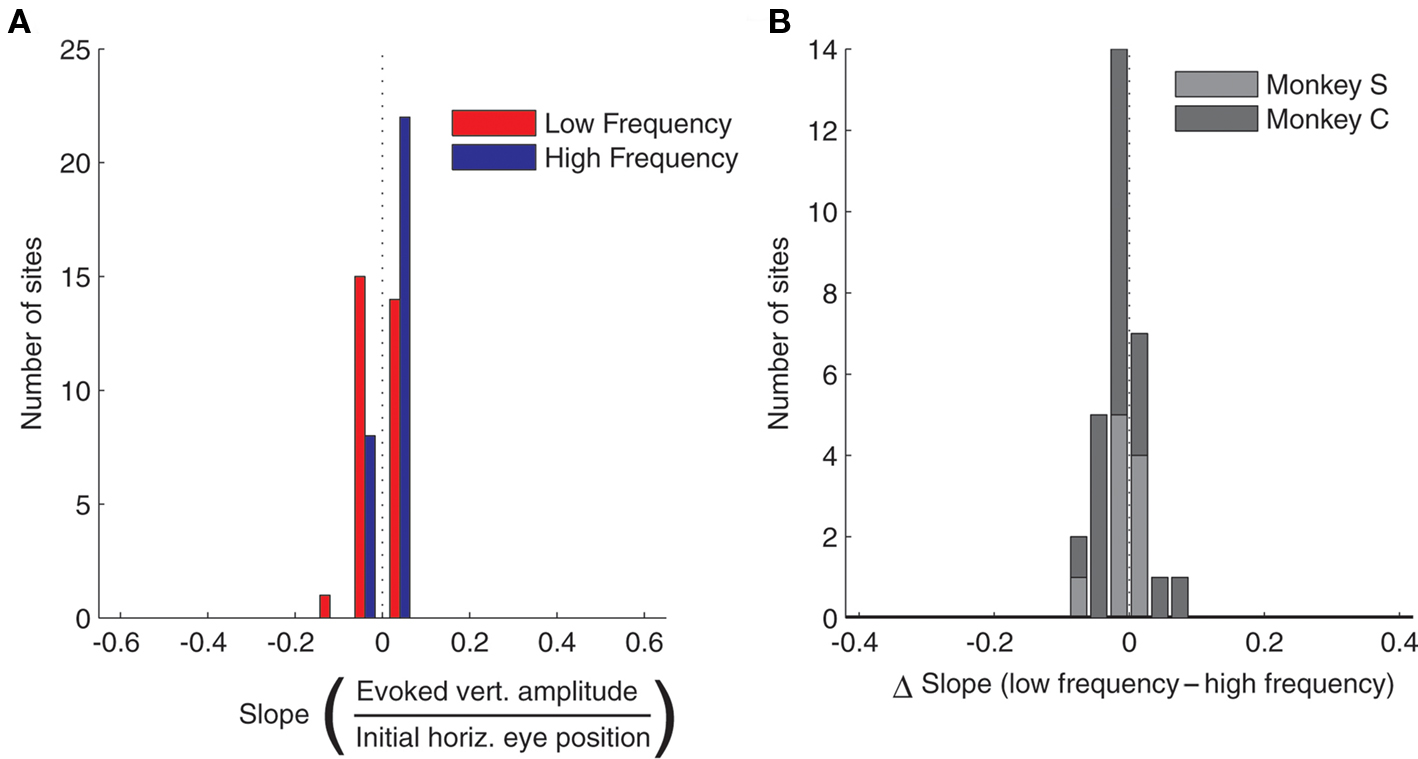
Figure 4. Population analysis of the effect of horizontal initial eye position on vertical saccade amplitude. (A) Magnitude of slopes obtained from linear regression of vertical saccade amplitude vs. horizontal initial eye position for each stimulation site. Data are shown for low (red) and high (blue) frequency stimulation conditions. The horizontal axis has been scaled to match Figure 3A for comparison purposes. (B) Differences in slope between low and high frequency conditions. Horizontal axis has been scaled to match Figure 3B.
Head Movements cannot Account for the Effects of Initial Eye Position on Saccade Amplitude
It is important to consider whether the immobility of the head played a role in the observed effect of initial eye position on evoked saccade amplitude. It has previously been shown that saccades evoked by microstimulation in intermediate and caudal sites in the primate SC can be dependent on eye position (Stryker and Schiller, 1975; Freedman et al., 1996; Klier et al., 2001), specifically under head-fixed conditions if the amplitude of the evoked gaze shift is beyond the oculomotor range, such that it would be accomplished by a combination of both eye and head movements under head-free conditions (Freedman et al., 1996; Klier et al., 2001).
In a pattern ostensibly reminiscent of these studies, we observed that the dependence of evoked saccade amplitude on eye position under head-fixed conditions was greater for sites at which larger amplitude saccades were evoked on average. This was true for both low and high frequency stimulation. Figure 5B plots the slope of the regression against the mean amplitude (pooled over all initial eye positions). Regression revealed a significant relation between the two measures (low frequency, r2 < 0.60, p < 0.0001; high frequency, r2 < 0.18, p < 0.05).
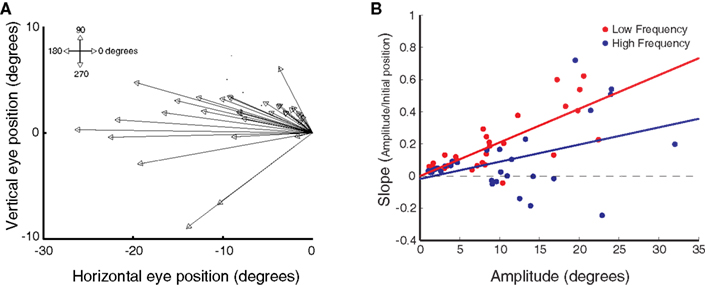
Figure 5. Relation between eye position dependence and saccade amplitude. (A) Average saccade vector for each stimulation site, averaged across all stimulation frequencies and initial fixation positions. (B) Magnitude of the slope obtained from linear regression of saccade amplitude on initial eye position as a function of mean horizontal saccade amplitude, for each stimulation site and frequency level. Data are shown for low (red) and high (blue) frequency stimulation conditions. Each data point represents a single stimulation site and frequency level. Lines show linear regression through the data.
However, several findings argue against the idea that the effect of eye position observed under head-fixed conditions in the present study is solely the result of a simple limit imposed by the restraint of the head. First, in the current study we stimulated sites located fairly rostrally in the SC as evidenced by the relatively small amplitude of the evoked saccades (mean evoked amplitude was <20° in 83% of the sites; Figure 5A; see also Table 1). Saccades smaller than 20° are usually not accompanied by head movements when the eyes start from central orbital positions (Freedman et al., 1996). Second, and more importantly, the effect of initial eye position is greater for low frequency stimulation than for high frequency stimulation: the slopes relating evoked amplitude to initial eye position are steeper for low than for high frequency stimulation (Figure 3B), even though the amplitudes of low frequency-evoked saccades are slightly smaller. This trend is shown across the population in Figure 5B. If the eye position effect was the result solely of head restraint, one would expect the opposite pattern, i.e., that it would be more pronounced in high frequency-evoked saccades because these are larger in amplitude.
To verify that the results did not depend solely on head restraint, we repeated the experiment while the head was unrestrained in a subset of sites (n < 12). This allowed us to investigate whether the observed eye position dependence was present under head-free conditions. Figure 6A shows the amplitude of stimulation-evoked gaze saccades as a function of initial eye-in-head position in the low and high frequency in an example head-free session. The pattern of results is similar to that obtained under head-fixed conditions: amplitude decreases with more contralateral horizontal initial eye position, and the effect is stronger in the low, compared to the high frequency condition. Figure 6B shows the histogram of slopes across all sites. Slopes were significantly larger than 0 for both stimulation frequencies (low frequency: t < 3.24, p < 0.008; high frequency: t < 2.61, p < 0.024). The difference in slope between low and high frequency stimulation skews toward positive values, indicating that slopes were steeper for low frequency stimulation than for high frequency stimulation (t < 2.31, p < 0.041; Figure 6C). These findings are in line with our findings in the head-fixed sessions, indicating that the effect of initial eye position on saccade amplitude is not simply the result of fixing the head.
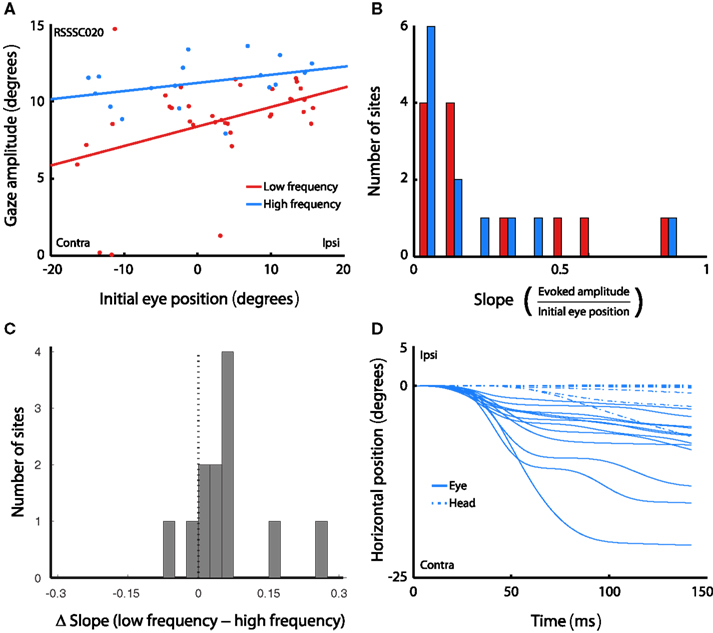
Figure 6. Effects of initial eye position in the head-free setup. (A) Amplitude of gaze saccades evoked by low (red) and high (blue) frequency microstimulation as a function of initial eye-in-head position. Lines show linear regression through the data. Each data point represents a single gaze saccade. (B) Magnitude of slopes obtained from linear regression of gaze amplitude on initial eye-in-head position for each stimulation site. Data are shown for low and high frequency stimulation conditions. (C) Differences in slope between low and high frequency conditions. (D) Horizontal eye-in-head and head position over time during the entire stimulation train, averaged over all trials in the high frequency condition, for each site in the head-free experiment.
More tellingly, no consistent head movements were evoked by the stimulation train. Figure 6D shows both head and eye position over the duration of the stimulation train, averaged over all trials that evoked a saccade, for each site. Positive values indicate ipsilateral movements, negative values contralateral ones. For display purposes, only data from the high frequency condition are shown, and onset of the traces is aligned to 0°. In contrast to eye movements, head movements typically evoked slow drifting movements without consistent direction. Eye movements were evoked at every site, but consistent head movements were only evoked at 2 out of 12 sites (17%). This demonstrates that the effects of initial eye position are unlikely to be due to an inability to physically execute the saccade commanded at each site.
Effects of Initial Eye Position and Frequency of Microstimulation on Saccade Latency and Probability
In addition to the effects of initial eye position and frequency on evoked saccade amplitude, which were directly related to the goals of this study, we also noticed some additional patterns in the data relating to latency. Specifically, we found that the effects of initial eye position on saccade amplitude were closely paralleled by effects on saccade latency: latency increased linearly with more contralateral initial eye position (i.e., the latency to evoke saccades was longer for more contralateral fixation positions). Again, this effect was stronger in the low compared to the high frequency condition. Slopes were significantly below 0 in both conditions (low frequency, t < −9.31, p < 0.0001; high frequency, t < −5.17, p < 0.0001; Figure 7A). Figure 7B shows the distribution of differences in slope between the low and high frequency conditions for each stimulation site. The population of slopes is significantly biased toward negative values (t < −8.55, p < 0.0001), confirming a stronger effect on latency in the low frequency vs. the high frequency condition. Note that smaller amplitudes for more contralateral saccades cannot simply be explained by longer latencies combined with truncation of the saccade upon termination of the stimulation train. Rarely were saccades not completed before the offset of the stimulation train (on average, 1.5% of all saccades in the low frequency condition and 2.5% in the high frequency condition) and these were distributed evenly over initial eye positions, and excluded from the analyses.
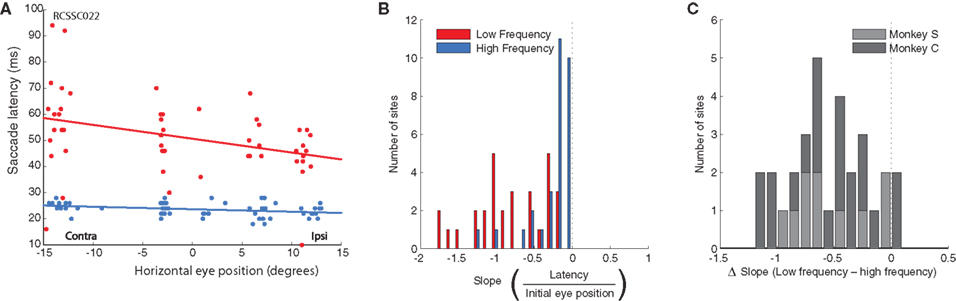
Figure 7. Population analysis of the effect of initial eye position on saccade latency. (A) An example site (same as Figure 2D) showing the increased latency for contralateral initial fixation positions, primarily for low frequency stimulation (red). (B) Magnitude of slopes obtained from linear regression of saccade latency on initial eye position for each stimulation site. Data are shown for low (red) and high (blue) frequency stimulation conditions. Negative slope indicates longer latency for more contralateral fixation positions. (C) Differences in slope between low and high frequency conditions.
These data suggest a higher threshold for eliciting saccades at more contralateral initial eye positions. Indeed, we found that eye position also affected the probability of evoking a saccade. To quantify this, we performed a regression of the proportion of trials that evoked a saccade as a function of fixation LED location. Figure 8A shows the histogram of slopes obtained from this analysis, indicating that the probability of evoking a saccade decreased as a function of more contralateral fixation LED location in the low frequency condition (t < 5.59, p < 0.0001), but not in the high frequency condition (t < 0.1, p > 0.05). The difference in slope between low and high frequency condition is shown in Figure 8B.
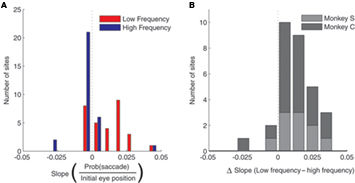
Figure 8. Population analysis of the effect of initial eye position on saccade probability. (A) Magnitude of slopes obtained from linear regression of saccade probability on initial eye position for each stimulation site. Data are shown for low (red) and high (blue) frequency stimulation conditions. Positive slope indicates a lower probability of evoking a saccade at more contralateral fixation positions. (B). Differences in slope between low and high frequency conditions.
Effects of Frequency of Microstimulation on Saccade Dynamics
Changes in saccade amplitude are normally associated with changes in duration and peak velocity. Specifically, duration increases linearly as a function of saccade amplitude, and velocity increases non-linearly, saturating for high amplitude saccades. These relations are known as the main sequence (Bahill et al., 1975). Figure 9 plots the average duration and peak velocity of high and low frequency-evoked saccades, as well as visually evoked saccades to the target LED, as a function of amplitude (binned in 5° bins). The figure shows that stimulation-evoked saccades have similar dynamics to visually evoked saccades: both duration (Figure 9A) and peak velocity (Figure 9B) scale with amplitude as predicted by the main sequence. Consistent with the findings of Stanford et al. (1996), low frequency-evoked saccades had slightly lower peak velocity and longer duration than saccades evoked by high frequency stimulation.
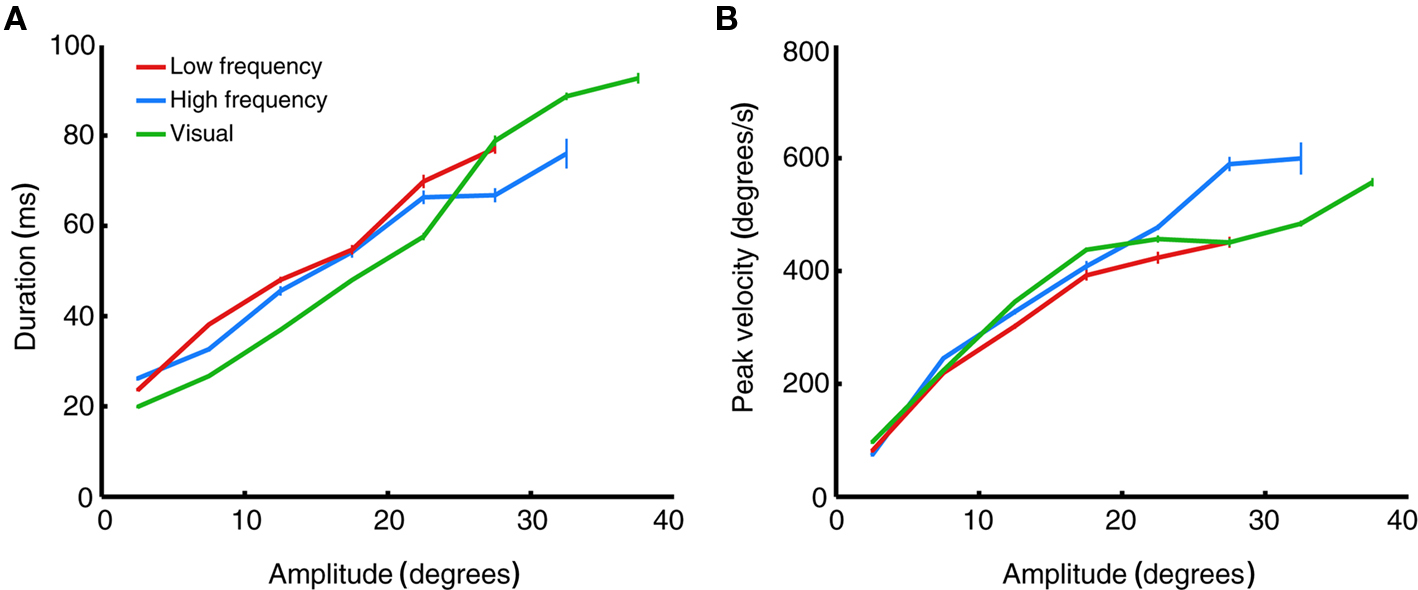
Figure 9. Main sequence relations of evoked saccades. (A) Saccade duration as a function of saccade amplitude, binned in 5° bins. Data are averaged over all stimulation- (red and blue) or target- (green) evoked saccades in all stimulation sites, regardless of fixation position. Error bars indicate ±1 SEM. (B) Saccade peak velocity as a function of saccade amplitude. Same saccades and conventions as in (A).
Discussion
We show that initial eye position affects the amplitude of saccades evoked by electrical microstimulation of the monkey SC: saccades starting at more contralateral eye positions are smaller in amplitude, are less reliably evoked, and have a longer latency. The magnitude of these effects are influenced by the frequency of microstimulation, with lower frequency stimulation evoking saccades whose amplitude depends more strongly on initial eye position (although both high and low stimulation frequencies did show the effect).
Although it might seem somewhat unexpected that saccades evoked by high frequency stimulation also showed an effect of initial eye position, this is not necessarily a discrepancy with previous studies (Robinson, 1972; Schiller and Stryker, 1972; Van Opstal et al., 1991; Hepp et al., 1993) for several reasons. First, our study differed in that we employed a novel quantitative analysis, and the effects in previous studies might actually be quite comparable. Second, it is also quite possible that our high frequency stimulation condition was not always as effective as the high frequency stimulation used in other studies. In particular, we may not have optimized the depth of the electrode in the SC to minimize the stimulation threshold as successfully as other studies have, so our high frequency stimulation may have been closer to threshold than is typical in other studies.
Importantly, the observed effect is not the result of physical constraints imposed by the oculomotor range, or of saccades ending prematurely because the stimulation train was too short. Moreover, unlike previous demonstrations of eye position effects (Paré et al., 1994; Freedman et al., 1996; Freedman and Sparks, 1997a; Klier et al., 2001), the effects observed in the present study were not compensated for by head movements.
Where does the SC’S Eye Position Sensitivity Come from?
Effects of eye position on SC activity are logical given the prevalence of eye position signals in areas that provide input to the SC. The SC receives feedback from the tegmental structures in the oculomotor pathway (e.g., Corvisier and Hardy, 1991; Chen and May, 2000; for review see, Sparks and Hartwich-Young, 1989), where eye position sensitivity is present in the tonic and perhaps burst patterns of the burst, tonic, or burst–tonic neurons (e.g., Keller, 1974; Sylvestre and Cullen, 1999; Ling et al., 2007). The SC also receives input from oculomotor regions of the cerebellum ( Roldan and Reinoso-Suarez, 1981; for review see Sparks and Hartwich-Young, 1989). The cerebellum has been theorized to play a role in adjusting the saccade command to different conditions, such as those related to compensation for orbital position or the adjustments to saccade amplitude characteristic of saccade adaptation.
In addition, many of the structures that provide sensory or descending input to the SC (Fries, 1984) also show eye position sensitivity. Perhaps most significantly, lateral intraparietal area LIP was recently shown to employ a composite of different reference frames: receptive fields of most neurons did not maintain a fixed relationship to the direction of the eyes (Mullette-Gillman et al., 2005, 2009). Thus, the input arriving at the SC from LIP is strongly affected by eye position, as originally noted by Andersen and Mountcastle (1983). Visual cortex, another area that projects to the SC, is also influenced by eye position (Trotter and Celebrini, 1999). Inputs also arrive to the SC from areas in the auditory pathway where eye position affects activity (Groh et al., 2001; Werner-Reiss et al., 2003; Porter et al., 2006; Maier and Groh, 2010). Somatosensory responses in the SC are sensitive to eye position (Groh and Sparks, 1996a,b,c), which may be related to eye position-related signals in somatosensory cortex (Zhang et al., 2008), some regions of which project to the SC (Fries, 1984).
Implications for the SC Read-Out
Our findings, together with the earlier findings concerning eye position modulation of SC activity (Van Opstal et al., 1995; Campos et al., 2006) as well as those concerning the effects of stimulation in the SC (Van Opstal et al., 1990; Stanford et al., 1996), provide constraints for models of how the SC is read-out and how it interacts with the saccadic pulse-step generator.
Many models concerning the transformation of signals from the SC into motor commands have been proposed, and the following issues are paramount: First, do variations in the level of activity in the SC affect its output, or does only the location of activity in the SC matter? In an elegant study varying the number of pulses of electrical stimulation, Stanford et al. (1996) showed that when the number of pulses was comparatively low, the amplitude of evoked saccades scaled with pulse count, but for higher pulse counts the evoked amplitude reached a plateau. The level of that plateau was site-specific. This pattern of results has been interpreted as indicating that a normalization mechanism to eliminate variations in activity level operates by converting each cell’s contribution to a “percent of total” when activity levels are high overall, but not when they are low (Groh, 2001).
A second important issue is what kind of goal signal does the SC produce? In Robinson’s original model (Robinson, 1975), the oculomotor pulse-step generator receives an input specifying desired eye position. Later models use inputs postulated to come from the SC specifying change in eye position (known as eye displacement models; e.g., Jürgens et al., 1981; Tweed and Vilis, 1985; Scudder, 1988; for review see Scudder et al., 2002). Such eye displacement models have been extended to incorporate findings suggesting that the SC’s output specifies change in eye position with respect to the body (or possibly the world) rather than change in eye position with respect the head (Freedman and Sparks, 1997a,b). However, to our knowledge, no existing models involve a mixed reference frame goal signal, although an SC read-out involving a combination of eye-in-head and eye displacement was suggested by Van Opstal et al. (1995). Because the amount of force required to move the eyes a given distance depends on initial eye position, the eye displacement models all do incorporate an eye position signal, but at a later stage where the motor neuron discharge pattern is formed.
Figure 10 suggests a possible explanation for our findings, assuming the output of the SC provides a pure eye displacement command signal. When saccades are elicited naturally by visual targets at a particular retinal location from two different initial eye positions (Figures 10A,B), the site of activity in the SC is the same for both target/eye position combinations (colored spots on schematic SC map; Figure 10Aii). Because of the eye position modulation, the level of activity is different for the two initial eye positions (indicated by different shades of red on Figures 10Aii,Bii). This eye position signal must be removed by the read-out mechanism, which does so by extracting only the site of activity, independent of its overall level. A weighted average mechanism operating on SC activity accomplishes the necessary normalization for the level of activity, and produces a signal that is related only to the target displacement and not to initial eye position (schematically indicated by the same number of spikes at the SC output stage in Figures 10Aiii,Biii). Later, an eye position signal (different numbers of spikes for each eye position; Figures 10Aiv,Biv) is added back in so that the motor command correctly compensates for eye position when generating the pattern of force needed to drive the eyes from different starting positions (different number of spikes for each eye position; Figures 10Av,Bv). (It should be noted that removing an eye position signal just to add it back later would seem inefficient, but this step is necessary under the assumption that the pulse-step generator operates on a pure eye displacement command signal. As such, its lack of plausibility casts doubt on the plausibility of this class of models).
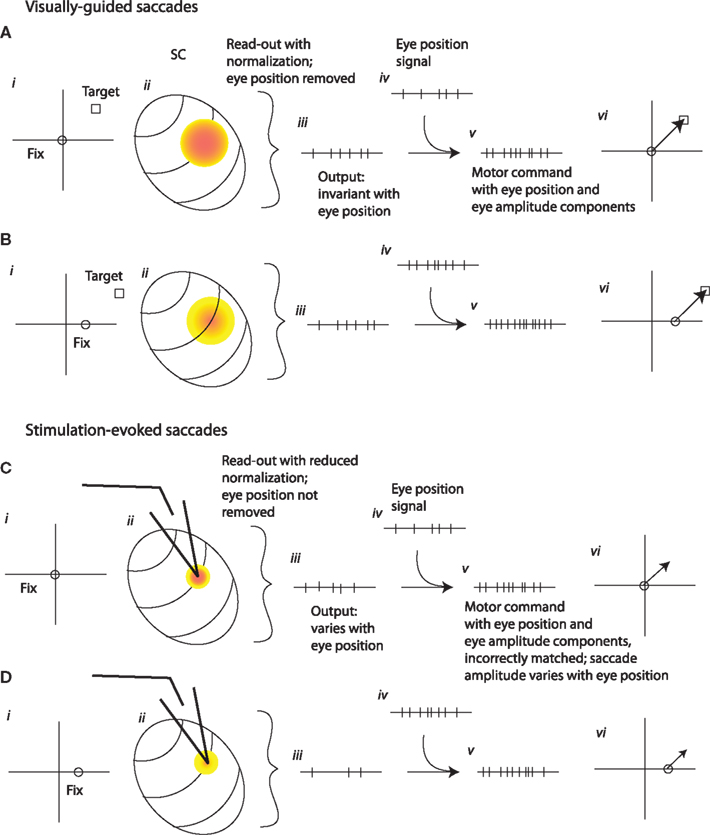
Figure 10. A schematic illustration of the transformation of signals from SC to motor command for visually guided or microstimulation-evoked saccades. (A,B) Visually guided saccades to retinally identical targets from two different eye positions (i). The site of activity in the SC is the same (ii, colored spots) but the level of activity is lower for the more contralateral initial fixation position [cooler colors in (B) than in (A)]. A site-weighted average of SC activity is calculated, thus removing the eye position signal and producing an output that is the same for different eye positions [iii, same number of spikes in both (A) and (B)] and specifies desired eye displacement. As in common eye displacement models of the oculomotor pulse-step generator, an eye position signal (iv) is combined with this signal, producing a motor command that depends on both eye position and saccade amplitude (v) and generating an accurate saccade to the target (vi). (C,D). How this circuit would have to operate in order to account for the eye position dependence of stimulation-evoked saccades.Stimulation evokes activity at the same site in the SC regardless of initial fixation, but the stimulation combines with endogenous eye position signals to produce a hill of activity that varies in level. The stimulation-evoked activity is too weak to trigger normalization, so the output is lower and is not invariant across eye positions [different numbers of spikes in (Ciii) and (Diii); and fewer spikes than the corresponding (Aiii) and (Biii)]. The motor command that is generated does not have the correct number of spikes to bring the eyes all the way to the (non-existent) target (Cv and Dv), and the saccades fall short by amounts that depend on eye position (Cvi and Dvi).
Figures 10C,D suggest how this circuit might operate in response to microstimulation, and illustrates the additional assumptions necessary to account for our findings in the context of an eye displacement model. The first assumption is that the SC neurons activated by the stimulation electrode continue to show an eye position modulation as well as being directly driven by the stimulation train. This produces a hill of activity that varies in level for different initial eye positions, as it does for visually guided saccades (Figure 10Cii). This, by itself, would not produce the observed pattern of evoked saccades, because the normalization process that eliminates any contribution of activity level would remove this eye position influence. But the studies of Paré et al. (1994), Stanford et al. (1996), and Van Opstal et al. (1995) suggested that such normalization only occurs for stronger levels of stimulation. These studies showed that the saccades evoked by SC stimulation were invariant to changes in stimulation parameters, and thus to changes in the overall amount of activity either in terms of number of neurons or firing rate of those neurons, but only when the stimulation parameters were quite strong. This pattern implied a normalization mechanism that is invoked only when the level of activity is comparatively high (Groh, 2001). Thus, we make the second assumption that the stimulation applied in our experiments is too weak to fully invoke the normalization for activity level. The output of the SC would then vary with eye position (as indicated by the schematic of spike trains at the SC output stage; Figures 10Ciii,Diii) and the resulting saccade vectors would vary with eye position as well (Figures 10Cvi,Dvi). The saccades would also be shorter than the site-specific amplitude of the site – a prediction that we did not test for in our current study.
Is this normalization scheme plausible? Although early models calculated a weighted sum of SC activity (Van Gisbergen et al., 1987; Scudder, 1988; Van Opstal and Van Gisbergen, 1989) a variety of stimulation and inactivation studies quickly suggested that at least under some conditions the output resembles a weighted average (Robinson, 1972; Schiller and Sandell, 1983; Hikosaka and Wurtz, 1986; Lee et al., 1988). The stimulation study of Stanford et al. (1996) showed that stimulation-induced activity in the SC is not always fully normalized, especially when lower levels of activity are present. Groh (2001) proposed a model for how this might be implemented in the read-out (the summation-with-saturation model). Thus, different degrees of normalization of SC activity can occur under different circumstances. When activity is low as it is in low frequency stimulation, variations in activity level due to eye position affect the output to a greater degree than when the activity is high due to high frequency stimulation.
A variation on this model would ascribe the absence/presence of an eye position signal in the output of the SC to a stronger presence of eye position signals during periods of fixation than during the endogenously generated saccade-related burst. Paré and Munoz (2001) and Campos et al. (2006) reported a more consistent eye position effect during periods of fixation than during the burst of activity associated with saccades. Since stimulation occurs during periods of fixation, the eye position signal may be effectively stronger during stimulation-evoked bursts than during visually evoked bursts in SC neurons. If this is the case, then perhaps there is little or no normalization for both visually guided and stimulation-evoked saccades, but the eye position signal is stronger for the latter.
An assumption of the model is that eye position gain fields are anti-correlated with the saccade vector tuning of cells in the SC. In other words, neurons show increased activity for ipsilateral fixation positions but contralateral saccade targets. This is in agreement with the findings of Paré and Munoz (2001), who reported a negative correlation between eye position modulation and the direction of the movement fields. However, there is disagreement in the literature on this point. Both Van Opstal et al. (1995) and Campos et al. (2006) reported a positive correlation between the direction of the movement field and the eye position gain field. In the interests of exploring whether a different formulation of the model could reconcile our results with those of Van Opstal et al. (1995) and Campos et al. (2006) we considered an alternative possibility. Figures 11A,B show cases in which the gain field is correlated with the direction of the saccade vector, and this eye position influence is not removed by normalization during the SC read-out process. Instead, the SC normally produces an output that varies with eye position, and this serves as input to a premotor circuit that uses a mixed reference frame goal signal. Thus, although the SC produces a different output for retinally identical targets from different fixation positions, accurate saccades are generated. It is possible that no additional eye position signal is needed, so this component (Figures 10A–Div) is omitted.
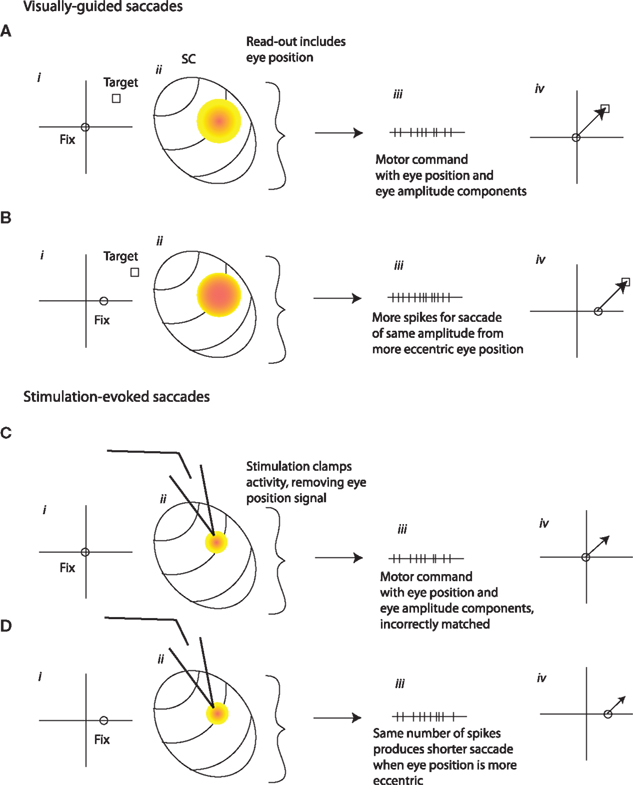
Figure 11. An alternative possible SC to motor command transformation. (A,B) As in Figure 10, the level of activity in the SC normally varies with eye position (ii), but here this variation is reflected in the computation of the SC’s output signal (iii). Another difference is that the eye position signal in the SC is positively, rather than negatively, correlated with the movement field/site of activation, so that the number of spikes in the output is higher for more contralateral fixation positions. The combined eye amplitude-eye position signal derived from SC activity might be sufficient to guide the motor command (iv). (C,D) Microstimulation in the SC might serve to remove this eye position signal, by clamping the firing rate in a pattern dictated by the microstimulation train (ii). The output of the SC would then be the same across different eye positions (iii). The lack of an eye position component in the output signal would cause eye movements to vary with eye position (iv).
If stimulation (Figures 11C,D) simply adds to eye position-dependent signals as postulated in the first scheme, this mechanism would not produce an eye position dependence in stimulation-evoked saccades. But if stimulation serves to clamp SC activity at a firing rate dictated solely by the stimulation train, then the eye position signal would be removed during stimulation. This would produce saccades whose vector varies with eye position, because the eye position signal, now missing, is a necessary component of the output.
Neither of these models fully match existing data or theories, partly because of discrepant findings in the literature. The first model agrees with the reported negative correlation between the direction of the eye position modulation and movement fields from one study (Paré and Munoz, 2001) but is therefore in disagreement with the two others that found a positive correlation (Van Opstal et al., 1995; Campos et al., 2006). This model can account for the larger effect of eye position in saccades evoked by low frequency as compared to high frequency stimulation. The second model assumes the positive correlation between eye position and movement fields reported by Van Opstal et al. (1995) and Campos et al. (2006). However, an additional assumption is needed to account for the frequency dependence in our stimulation results, specifically that the “clamping” of firing rate is more effective at low than high frequencies of stimulation, and thus the removal of the natural eye position signal during low frequency stimulation is more complete than it is at high frequency stimulation. This may be implausible. In addition, this model involves a saccadic pulse step generator that employs a mixed reference frame goal signal. Neither model specifically accounts for changes to the main sequence (low frequency stimulation produced movements of a slightly slower velocity for a given amplitude) or the effects on saccade latency or probability at different eye positions. Future models will need to reconcile all these experimental findings.
An Alternative Account
An alternative view of the eye position sensitivity evident in SC neurons is that this sensitivity might represent a bias in favor of re-centering the eyes in the orbits (Paré and Munoz, 2001). Under this view, subjects exhibit a bias in favor of generating a saccade back toward the center of the orbits, even when the target is not necessarily in that direction. Paré and Munoz (2001) proposed that the eye position modulation they observed was related to this re-centering bias: when the movement field of the neuron includes the straight ahead position because the eyes are currently deviated to the ipsilateral side, neural activity is higher than when the eyes are on the contralateral side. When a potential saccade target lies within the movement field of an SC neuron, it can exhibit a low-level of firing, even if that target is not eventually chosen (Glimcher and Sparks, 1992). In other words, suppose a neuron has a movement field encoding 10° leftward movements. When the eyes are fixated 10° to the right, the movement field lies at the straight ahead (in space) position. If subjects have a bias to return to the straight ahead position, this neuron would tend to fire in at least a low-level way. This low-level activity during periods of fixation would appear to be correlated with eye position although it would really be correlated with the combination of fixation position, movement field position, and the subject’s individual biases for saccading to particular positions.
The results of Campos et al. (2006) and Van Opstal et al. (1995) could be reconciled with this theory as well if one assumes that the determining factor is not necessarily a re-centering bias but instead the odds of a saccade in a given direction from a given eye position more generally. This could account for the differences in the relationship between the direction of “preferred” eye positions and movement fields across studies. In some paradigms or perhaps individual monkeys, a re-centering bias could predominate, producing an inverse correlation between eye position and movement field locations (Paré and Munoz, 2001). This might be especially true in a rewarded task where the monkey might weigh the odds of different target locations. Even if target locations are nominally evenly distributed, as they were in our study and that of Paré and Munoz (2001), the monkey might occasionally prefer returning to a more central fixation position to be ready for the next trial.
In other circumstances, a tendency to make corrective saccades might predominate. A corrective saccade in the same direction as the previous saccade would produce the opposite relationship between eye position and the next saccade, and thus a positive correlation between eye position and movement field locations (Van Opstal et al., 1995; Campos et al., 2006). This might be especially likely in a natural scanning paradigm such as that used by Van Opstal, and Campos et al. In short, if eye position sensitivity patterns reflect intentions regarding the next movement, these might well differ across individuals or paradigms. Several studies have shown that SC neurons are sensitive to target probability and number, factors that influence intention (Basso and Wurtz, 1997, 1998). Teasing these issues apart would involve a study in which these parameters are manipulated and the effect on eye position modulations in the SC observed.
In any event, whether the eye position modulation in the SC reflects a signal necessary for preparing a correct motor command or a more ancillary signal reflecting a predisposition to generate a saccade in a particular direction in the coming moments, this eye position modulation has an effect on the eye movement that is produced by microstimulation and thus has the potential to contribute to the SC’s read-out under normal circumstances.
Conflict of Interest Statement
The author declares that the research was conducted in the absence of any commercial or financial relationships that could be construed as a potential conflict of interest.
Acknowledgments
I thank Joost Maier for data collection, for assistance with data analysis, and for preparing drafts of earlier versions of this manuscript. In addition, Tom Heil provided technical assistance with the head-free setup, Jessi Cruger provided assistance with animal care, and Nick del Grosso assisted with animal training. I thank Valeria Caruso, Kurtis Gruters, and Daniel Pages for helpful comments on the manuscript. This work was supported by R01 NS50942 and NSF 0415634 to Jennifer M. Groh.
References
Andersen, R. A., and Mountcastle, V. B. (1983). The influence of the angle of gaze upon the excitability of the light-sensitive neurons of the posterior parietal cortex. J. Neurosci. 3, 532–548.
Bahill, A., Clark, M., and Stark, L. (1975). The main sequence, a tool for studying human eye movements. Math. Biosci. 24, 191–204.
Basso, M. A., and Wurtz, R. H. (1997). Modulation of neuronal activity by target uncertainty. Nature 389, 66–69.
Basso, M. A., and Wurtz, R. H. (1998). Modulation of neuronal activity in superior colliculus by changes in target probability. J. Neurosci. 18, 7519–7534.
Campos, M., Cherian, A., and Segraves, M. A. (2006). Effects of eye position upon activity of neurons in macaque superior colliculus. J. Neurophysiol. 95, 505–526.
Chen, B., and May, P. J. (2000). The feedback circuit connecting the superior colliculus and central mesencephalic reticular formation: a direct morphological demonstration. Exp. Brain Res. 131, 10–21.
Choi, W. Y., and Guitton, D. (2009). Firing patterns in superior colliculus of head-unrestrained monkey during normal and perturbed gaze saccades reveal short-latency feedback and a sluggish rostral shift in activity. J. Neurosci. 29, 7166–7180.
Corneil, B. D., Munoz, D. P., and Olivier, E. (2007). Priming of head premotor circuits during oculomotor preparation. J. Neurophysiol. 97, 701–714.
Corvisier, J., and Hardy, O. (1991). Possible excitatory and inhibitory feedback to the superior colliculus: a combined retrograde and immunocytochemical study in the prepositus hypoglossi nucleus of the guinea pig. Neurosci. Res. 12, 486–502.
Cynader, M., and Berman, N. (1972). Receptive-field organization of monkey superior colliculus. J. Neurophysiol. 35, 187–201.
Freedman, E. G., and Sparks, D. L. (1997a). Activity of cells in the deeper layers of the superior colliculus of the rhesus monkey: evidence for a gaze displacement command. J. Neurophysiol. 78, 1669–1690.
Freedman, E. G., and Sparks, D. L. (1997b). Eye–head coordination during head-unrestrained gaze shifts in rhesus monkeys. J. Neurophysiol. 77, 2328–2348.
Freedman, E. G., Stanford, T. R., and Sparks, D. L. (1996). Combined eye–head gaze shifts produced by electrical stimulation of the superior colliculus in rhesus monkeys. J. Neurophysiol. 76, 927–952.
Fries, W. (1984). Cortical projections to the superior colliculus in the macaque monkey: a retrograde study using horseradish peroxidase. J. Comp. Neurol. 230, 55–76.
Glimcher, P. W., and Sparks, D. L. (1992). Movement selection in advance of action in the superior colliculus. Nature 355, 542–545.
Goossens, H. H., and Van Opstal, A. J. (2006). Dynamic ensemble coding of saccades in the monkey superior colliculus. J. Neurophysiol. 95, 2326–2341.
Groh, J. (2001). Converting neural signals from place codes to rate codes. Biol. Cybern. 85, 159–165.
Groh, J. M., and Sparks, D. L. (1996a). Saccades to somatosensory targets. III. Eye-position-dependent somatosensory activity in primate superior colliculus. J. Neurophysiol. 75, 439–453.
Groh, J. M., and Sparks, D. L. (1996b). Saccades to somatosensory targets. II. Motor convergence in primate superior colliculus. J. Neurophysiol. 75, 428–438.
Groh, J. M., and Sparks, D. L. (1996c). Saccades to somatosensory targets. I. Behavioral characteristics. J. Neurophysiol. 75, 412–427.
Groh, J. M., Trause, A. S., Underhill, A. M., Clark, K. R., and Inati, S. (2001). Eye position influences auditory responses in primate inferior colliculus. Neuron 29, 509–518.
Hepp, K., Van Opstal, A., Straumann, D., Hess, B., and Henn, V. (1993). Monkey superior colliculus represents rapid eye movements in a two-dimensional motor map. J. Neurophysiol. 69, 965–979.
Hikosaka, O., and Wurtz, R. (1986). Saccadic eye movements following injection of lidocaine into the superior colliculus. Exp. Brain Res. 61, 531–539.
Jay, M. F., and Sparks, D. L. (1987). Sensorimotor integration in the primate superior colliculus. II. Coordinates of auditory signals. J. Neurophysiol. 57, 35–55.
Jürgens, R., Becker, W., and Kornhuber, H. (1981). Natural and drug-induced variations of velocity and duration of human saccadic eye movements: evidence for a control of the neural pulse generator by local feedback. Biol. Cybern. 39, 87–96.
Keller, E. L. (1974). Participation of medial pontine reticular formation in eye movement generation in monkey. J. Neurophysiol. 37, 316–332.
Klier, E. M., Wang, H., and Crawford, J. D. (2001). The superior colliculus encodes gaze commands in retinal coordinates. Nat. Neurosci. 4, 627–632.
Lee, C., Rohrer, W., and Sparks, D. (1988). Population coding of saccadic eye movements by neurons in the superior colliculus. Nature 332, 357–360.
Ling, L., Fuchs, A., Siebold, C., and Dean, P. (2007). Effects of initial eye position on saccade-related behavior of abducens nucleus neurons in the primate. J. Neurophysiol. 98, 3581–3599.
Maier, J. X., and Groh, J. M. (2010). Comparison of gain-like properties of eye position signals in inferior colliculus versus auditory cortex of primates. Front. Integr. Neurosci. 4:121. doi: 10.3389/fnint.2010.00121
Mullette-Gillman, O. A., Cohen, Y. E., and Groh, J. M. (2005). Eye-centered, head-centered, and complex coding of visual and auditory targets in the intraparietal sulcus. J. Neurophysiol. 94, 2331–2352.
Mullette-Gillman, O. A., Cohen, Y. E., and Groh, J. M. (2009). Motor-related signals in the intraparietal cortex encode locations in a hybrid, rather than eye-centered reference frame. Cereb. Cortex 19, 1761–1775.
Nagy, B., and Corneil, B. D. (2009). Representation of horizontal head-on-body position in the primate superior colliculus. J. Neurophysiol. 103, 858–874.
Paré, M., Crommelinck, M., and Guitton, D. (1994). Gaze shifts evoked by stimulation of the superior colliculus in the head-free cat conform to the motor map but also depend on stimulus strength and fixation activity. Exp. Brain Res. 101, 123–139.
Paré, M., and Munoz, D. P. (2001). Expression of a re-centering bias in saccade regulation by superior colliculus neurons. Exp. Brain Res. 137, 354–368.
Porter, K. K., Metzger, R. R., and Groh, J. M. (2006). Representation of eye position in primate inferior colliculus. J. Neurophysiol. 95, 1826–1842.
Rezvani, S., and Corneil, B. D. (2008). Recruitment of a head-turning synergy by low-frequency activity in the primate superior colliculus. J. Neurophysiol. 100, 397–411.
Robinson, D. A. (1972). Eye movements evoked by collicular stimulation in the alert monkey. Vision Res. 12, 1795.
Robinson, D. A. (1975). “Oculomotor control signals,” in Basic Mechanisms of Ocular Motility and Their Clinical Implications, eds G. Iennerstrand and P. Bach-y-Rita (Oxford: Pergamon Press), 337–374.
Roldan, M., and Reinoso-Suarez, F. (1981). Cerebellar projections to the superior colliculus in the cat. J. Neurosci. 1, 827–834.
Schiller, P., and Sandell, J. (1983). Interactions between visually and electrically elicited saccades before and after superior colliculus and frontal eye field ablations in the rhesus monkey. Exp. Brain Res. 49, 381–392.
Schiller, P. H., and Stryker, M. (1972). Single-unit recording and stimulation in superior colliculus of the alert rhesus monkey. J. Neurophysiol. 35, 915–924.
Scudder, C. (1988). A new local feedback model of the saccadic burst generator. J. Neurophysiol. 59, 1455–1475.
Scudder, C., Kaneko, C., and Fuchs, A. (2002). The brainstem burst generator for saccadic eye movements. Exp. Brain Res. 142, 439–462.
Segraves, M. A., and Goldberg, M. E. (1992). “Properties of eye and head movements evoked by electrical stimulation of the monkey superior colliculus,” in The Head–Neck Sensory-Motor System, eds A. Berthoz, W. Graf, and P. P. Vidal (New York: Oxford University Press), 292–295.
Sparks, D. L., and Hartwich-Young, R. (1989). The deep layers of the superior colliculus. Rev. Oculomot. Res. 3, 213–255.
Stanford, T. R., Freedman, E. G., and Sparks, D. L. (1996). Site and parameters of microstimulation: evidence for independent effects on the properties of saccades evoked from the primate superior colliculus. J. Neurophysiol. 76, 3360–3381.
Stryker, M. P., and Schiller, P. H. (1975). Eye and head movements evoked by electrical stimulation of monkey superior colliculus. Exp. Brain Res. 23, 103–112.
Sylvestre, P. A., and Cullen, K. E. (1999). Quantitative analysis of abducens neuron discharge dynamics during saccadic and slow eye movements. J. Neurophysiol. 82, 2612–2632.
Trotter, Y., and Celebrini, S. (1999). Gaze direction controls response gain in primary visual-cortex neurons. Nature 398, 239–242.
Tweed, D., and Vilis, T. (1985). A two dimensional model for saccade generation. Biol. Cybern. 52, 219–227.
Van Gisbergen, J., Van Opstal, A., and Tax, A. (1987). Collicular ensemble coding of saccades based on vector summation. Neuroscience 21, 541–555.
Van Opstal, A., Hepp, K., Hess, B., Straumann, D., and Henn, V. (1991). Two- rather than three-dimensional representation of saccades in monkey superior colliculus. Science 252, 1313–1315.
Van Opstal, A., and Van Gisbergen, J. (1989). A model for collicular efferent mechanisms underlying the generation of saccades. Brain Behav.Evol. 33, 90–94.
Van Opstal, A. J., Gisbergen, J. A. M., and Smit, A. C. (1990). Comparison of saccades evoked by visual stimulation and collicular electrical stimulation in the alert monkey. Exp. Brain Res. 79, 299–312.
Van Opstal, A. J., Hepp, K., Suzuki, Y., and Henn, V. (1995). Influence of eye position on activity in monkey superior colliculus. J. Neurophysiol. 74, 1593–1610.
Walton, M. M. G., Bechara, B., and Gandhi, N. J. (2007). Role of the primate superior colliculus in the control of head movements. J. Neurophysiol. 98, 2022–2037.
Werner-Reiss, U., Kelly, K. A., Trause, A. S., Underhill, A. M., and Groh, J. M. (2003). Eye position affects activity in primary auditory cortex of primates. Curr. Biol. 13, 554–562.
Wurtz, R. H., and Goldberg, M. E. (1971). Superior colliculus cell responses related to eye movements in awake monkeys. Science 171, 82–84.
Keywords: monkey, oculomotor, superior colliculus, pulse-step generator, reference frame, eye position
Citation: Groh JM (2011) Effects of initial eye position on saccades evoked by microstimulation in the primate superior colliculus: implications for models of the SC read-out process. Front. Integr. Neurosci. 4:130. doi: 10.3389/fnint.2010.00130
Received: 22 September 2010;
Paper pending published: 20 October 2010;
Accepted: 28 December 2010;
Published online: 19 January 2011.
Edited by:
Elizabeth B. Torres, Rutgers University, USAReviewed by:
Raj Gandhi, University of Pittsburgh, USAMark A. Segraves, Northwestern University, USA
Michael Campos, Massachusetts General Hospital/Harvard Medical School, USA
Copyright: © 2011 Groh. This is an open-access article subject to an exclusive license agreement between the authors and Frontiers Media SA, which permits unrestricted use, distribution, and reproduction in any medium, provided the original authors and source are credited.
*Correspondence: Jennifer M. Groh, Center for Cognitive Neuroscience, Duke University, B203 Levine Sciences Research Building, Durham, NC 27708, USA. e-mail: jmgroh@duke.edu