Amygdala stimulation evokes time-varying synaptic responses in the gustatory cortex of anesthetized rats
- Department of Neurobiology and Behavior, Stony Brook University, Stony Brook, NY, USA
Gustatory stimuli are characterized by a specific hedonic value; they are either palatable or aversive. Hedonic value, along with other psychological dimensions of tastes, is coded in the time-course of gustatory cortex (GC) neural responses and appears to emerge via top-down modulation by the basolateral amygdala (BLA). While the importance of BLA in modulating gustatory cortical function has been well established, the nature of its input onto GC neurons is largely unknown. Somewhat conflicting results from extracellular recordings point to either excitatory or inhibitory effects. Here, we directly test the hypothesis that BLA can evoke time-varying – excitatory and inhibitory – synaptic responses in GC using in vivo intracellular recording techniques in urethane anesthetized rats. Electrical stimulation of BLA evoked a post-synaptic potential (PSP) in GC neurons that resulted from a combination of short and long latency components: an initial monosynaptic, glutamatergic potential followed by a multisynaptic, GABAergic hyperpolarization. As predicted by the dynamic nature of amygdala evoked potentials, trains of five BLA stimuli at rates that mimic physiological firing rates (5–40 Hz) evoke a combination of excitation and inhibition in GC cells. The magnitude of the different components varies depending on the frequency of stimulation, with summation of excitatory and inhibitory inputs reaching its maximum at higher frequencies. These experiments provide the first description of BLA synaptic inputs to GC and reveal that amygdalar afferents can modulate gustatory cortical network activity and its processing of sensory information via time-varying synaptic dynamics.
Introduction
Taste is unique among the senses in that even the most basic gustatory stimuli are imbued with psychological value. Sucrose is not merely a disaccharide that happens to taste sweet; rather, it is sweet, salient, and at the same time has a hedonic value, i.e., it is likeable and rewarding. Psychological dimensions can be coded along with chemical identity by neurons in the gustatory cortex (GC; Yamamoto et al., 1981; Katz et al., 2001; Clark and Bernstein, 2009). GC neurons process the various attributes of tastes by multiplexing information along temporal codes. Electrophysiological recordings in passively tasting rats, for instance, reveal hedonic-related firing modulations beginning 1 s into a taste-evoked response, the time at which observable behavioral indications of palatability appear (Travers and Norgren, 1986; Breslin et al., 1992; Katz et al., 2001; Fontanini and Katz, 2006; Grossman et al., 2008; Fontanini et al., 2009).
The mechanism for imbuing cortical taste codes with hedonics and saliency is not entirely known. Mounting evidence, however, points to the basolateral nucleus of the amygdala (BLA), an area anatomically connected with GC, as a key source of hedonic information. Lesion and electrophysiological studies have shown that BLA can be involved in processing the palatability of tastes and learning new hedonic or reward-related responses to stimuli (Bermudez-Rattoni et al., 1986; Gallo et al., 1992; Schafe et al., 1998; Schoenbaum et al., 2003; Holland and Gallagher, 2004; Paton et al., 2006; Wang et al., 2006; Grossman et al., 2008; Fontanini et al., 2009). Learning a conditioned taste aversion (CTA), in which a palatable taste becomes aversive after training, enhances the functional connectivity between simultaneously recorded ensembles of BLA and GC neurons (Grossman et al., 2008) and induces plastic changes at the amygdalo-cortical connection (Escobar and Bermudez-Rattoni, 2000; Escobar et al., 2002). Investigation into the temporal structure of taste responses in BLA provides further evidence consistent with a flow of hedonic information from BLA to GC (Fontanini et al., 2009).
While tracing studies report direct inputs to GC from BLA (Saper, 1982; Allen et al., 1991), the nature of the amygdalo-cortical synapse is not well understood. So far, a few studies have examined the effects of electrical stimulation of BLA on GC single neuron extracellular responses in anesthetized rats, each yielding somewhat contrasting results (Yamamoto et al., 1984a; Hanamori, 2009). While Hanamori’s results emphasize a lasting inhibitory effect on GC when BLA is stimulated, Yamamoto et al. found a combination of excitatory and inhibitory effects. Several other studies indicate that the synaptic connection has a glutamatergic component (Jones et al., 1999; Escobar and Bermudez-Rattoni, 2000; Escobar et al., 2002; Ferreira et al., 2005).
Here, we combine electrical stimulation of BLA with in vivo intracellular recordings in GC, an approach that is optimized to resolve subthreshold synaptic events, to directly investigate the rich temporal dynamics of the BLA-GC synapse. We show that BLA stimulation evokes time-varying PSP in GC cells, with a monosynaptic glutamatergic component followed by a multisynaptic GABAergic hyperpolarization. Both excitation and inhibition summate during 20–40 Hz trains of stimulation. We propose that these synaptic dynamics are one of the mechanisms by which amygdalar afferents can influence cortical taste codes and we discuss the ways in which our results support the framework of amygdalo-cortical interaction emerging from studies in alert animals.
Materials and Methods
Subjects
All methods were approved by the Stony Brook University Institutional Animal Care and Use Committee and followed procedures approved by the National Institute of Health. Nineteen female Long Evans rats (275–300 g) were housed individually in a vivarium with ad libitum access to chow and water and were maintained on a 12 h/12 h light/dark cycle.
Surgical Procedures
Anesthesia was induced with an intraperitoneal injection of 0.6 g/kg urethane and, only for induction, 40 mg/kg pentobarbital (Yokota et al., 2007). Recordings were performed more than 4 h after induction, long after the action of the initial dose of pentobarbital had worn off. The depth of anesthesia was monitored via the hindlimb withdrawal reflex and supplemental doses of urethane alone were administered if necessary. Additionally, marcaine was applied to all incisions and pressure points to minimize pain. A tracheotomy was performed to facilitate breathing and body temperature was kept at 37°C with a heating pad (FHC Inc, Bowdoin, ME, USA). The animal was mounted on a stereotaxic apparatus (Narishige, East Meadow, NY, USA), the scalp was incised, and bregma and lambda were leveled. Burr holes were drilled and the dura overlying the gustatory portion of the insular cortex (GC) and BLA was removed according to the following stereotaxic coordinates: GC, +1.5 anterior and −5.0 lateral from bregma; BLA, −3.0 posterior and −5.0 lateral from bregma. To prevent drying, the exposed brain surface was covered in mineral oil. A concentric bipolar stimulating electrode (MicroProbes for Life Science, Gaithersburg, MD, USA) was lowered into BLA to a depth of 7.2 mm from the dura.
Intracellular Recording
Intracellular recordings were made in bridge-balance mode using an Axon Multiclamp 700b amplifier (Axon Instruments, Union City, CA, USA) according to standard protocols (Fontanini et al., 2003). Sharp electrodes were prepared with a Flaming–Brown puller (P97; Sutter Instruments, Novato, CA, USA) from borosilicate capillaries (OD 1.0 mm) and filled with an internal solution containing 3 M potassium acetate and 2% biocytin (Anaspec, Freemont, CA, USA). Impedances ranging 35–85 MΩ were measured in situ. Electrodes were slowly lowered dorsally into the portion of insular cortex known to be taste responsive (1.5 mm anterior, 5 mm lateral from bregma; Yamamoto, 1984b; Fontanini and Katz, 2005), with a hydraulic micromanipulator (Narishige, East Meadow, NY, USA) and steps of hyperpolarizing current (−500 pA, 500 ms, 0.5 Hz) were passed through the electrode throughout the descent. The depth of the electrode from the cortical surface was monitored, and recorded GC cells ranged in depth from 4 to 5.6 mm, a range consistent with the dorso-ventral extent of the gustatory portion of insular cortex (Yamamoto et al., 1984b). Only GC neurons with resting membrane potentials more hyperpolarized than −60 mV and with action potentials of at least 50 mV were included in the analysis. Stable recordings could last >60 min.
Data Collection and Analysis
Intracellular data were acquired at 20 kHz with a Digidata 1440A board (Axon Instruments) connected to a computer running Clampex 10 acquisition software (Axon Instruments). Following impalement, cells were allowed to stabilize for several minutes before data collection began. When necessary, hyperpolarizing current (0.5–2 nA) was injected to stabilize the membrane potential of the cell and this current was discontinued once the membrane reached a stable state. One minute of baseline activity was recorded and the number of spontaneous action potentials during this minute was used to calculate the cell’s firing frequency. The cell’s resting potential was determined from the downstate of this trace, with spontaneous PSPs and action potentials excluded from the average. After recording the baseline, DC current was injected in steps (range −1000 to 1500 pA, 1.5 s, 0.2 Hz). The linear portion of the membrane potential deflection produced by the hyperpolarizing current steps was used to calculate the input resistance of the neuron. GC cells were tested for responsiveness to BLA stimulation. BLA stimulation was achieved via 0.1 ms, biphasic pulses delivered through a concentric electrode. Data presented here were obtained from a total of 27 neurons that responded to BLA stimulation; different experimental protocols were tested in different subpopulations of cells. In all cells, BLA stimulation intensity was adjusted to evoke the largest subthreshold response. The intensity used to evoke the maximal PSP ranged from 0.1 to 6 mA, averaging 1.61 ± 0.28 mA (n = 27). Intensities in excess of 2 mA were necessary in 8/27 cells. While we cannot rule out the possibility of current spread beyond BLA, responses in these cells where high stimulation current was used were not qualitatively different from the other experiments. The average minimal stimulation intensity capable of reliably evoking a PSP was 0.21 ± 0.04 mA (n = 15 cells tested), a value at which current spread should be limited. Cells that showed a short latency (<2 ms) all-or-none spiking response following BLA stimulation were found rarely and these recordings were terminated and excluded from this study to avoid confounds due to antidromic activation. The latency to response onset was measured as the time from the onset of stimulation to the onset of the evoked PSP. The peak amplitude of the stimulus-evoked PSP was measured as the greatest membrane potential difference from pre-stimulus baseline. The time to peak was measured as the time from the onset of stimulation to the peak of the PSP. To examine the effect of membrane potential on the components of the stimulus-evoked PSP, current was injected into the cells and peak response amplitudes were measured 3- to 5-, 10-, and 35-ms post-stimulus. These time points, based on Moore and Nelson (1998), reflect the activation of early and late synaptic components following the onset of the PSP. The inhibitory peak amplitude was measured as the most negative membrane potential deflection from baseline. For each cell, the time to peak of the inhibitory PSP component was determined in the most depolarized condition. The same time to peak was used to measure inhibitory peaks at every holding potential tested. The amplitude of excitatory and inhibitory peaks was normalized and plotted against the membrane potential. Linear regression analysis was used to determine the reversal potential for all the synaptic components. To analyze synaptic dynamics, PSPs from GC neurons were evoked by trains of BLA stimuli at different frequencies (5, 10, 20, 40, and 100 Hz) and while holding the neurons at resting, hyperpolarized, and depolarized potentials. PSP amplitudes to each of the five stimuli in the train were measured as the largest transition in membrane potential from the onset of the stimulus. The summation of PSPs for each frequency of stimulation was defined as the largest transition in membrane voltage from baseline. Summation of depolarization was compared across frequency in two ways: (1) excitatory charge was measured as the area under the curve, with stimulus artifacts excluded, and normalized by interstimulus interval, and (2) the peak amplitude of the plateau depolarization underlying the PSPs was measured. The post-train inhibitory response was measured as the most negative membrane potential deflection from the pre-stimulus baseline. All recorded membrane potentials were corrected for the liquid junction potential off line.
Histology
At the end of each experiment, rats were deeply anesthetized with pentobarbital. To identify the stimulation site post hoc, a pulse of current (0.2 mA, 20 s) was delivered to the BLA stimulating electrode in order to lesion the tissue around the tip. Rats were then perfused transcardially with 0.9% saline followed by cold 4% paraformaldehyde in PBS. Brains were removed and stored in 4% paraformaldehyde until sectioning. The positioning of the intracellular electrode was identified histologically by visualizing the track of the recording electrode, which was made more visible thanks to the residual extracellular biocytin ejected by search pulses (and revealed by standard DAB staining procedures). The placement of the BLA stimulating electrode was confirmed after staining 60 μm sections with cresyl violet.
Results
Here, we report results obtained from 27 gustatory cortical putative pyramidal neurons that responded to electrical stimulation of BLA in 19 animals. The average depth of recorded cells was 4.9 ± 0.09 mm from the dura, with a range from 4 to 5.6 mm (n = 27); the area of penetration was centered around 5 ± 0.5 mm from bregma in the medio-lateral axis and +1.5 ± 0.5 mm from bregma in the antero-posterior axis. Histological visualization of the electrode track confirmed the location of the recordings in insular cortex (Figure 1A). The resting membrane potentials averaged −73 ± 1.9 mV (n = 27) in the downstate and the average firing rate at rest was 1.2 ± 0.4 Hz (n = 27; Figure 1B). Injection of hyperpolarizing currents revealed an average input resistance of 36 ± 2 MΩ (n = 18), consistent with reported values for pyramidal cells in somatosensory cortex (Hasenstaub et al., 2007). Firing patterns elicited by depolarizing current steps were typical of regular spiking neurons (Figure 1C). Currents up to 1500 pA were injected and resulted in firing rates as high as 62 Hz, with an average maximum firing rate of 38.3 ± 4.1 Hz (n = 12; Figure 1D).
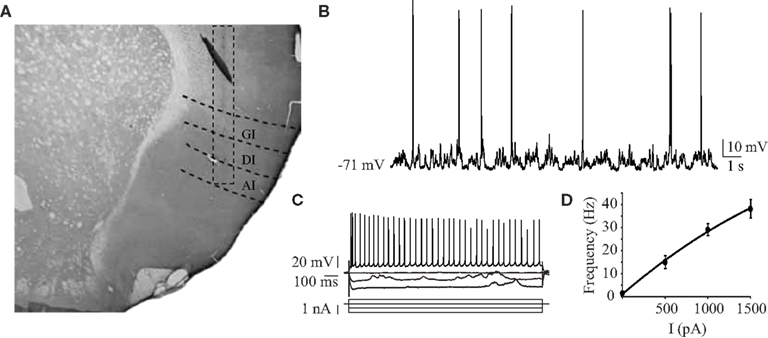
Figure 1. Intracellular recordings of GC regular spiking neurons. (A) Representative histological reconstruction of an electrode tract descending through the three sub-regions of the insular cortex. A dashed rectangle is centered around the tract for clarity. GI, granular insular cortex; DI, dysgranular insular cortex; AI, agranular insular cortex. (B) Sample intracellular recording of spontaneous activity in a GC neuron from urethane anesthetized rats. (C) Responses to hyperpolarizing and depolarizing current pulses of a representative neuron. The firing behavior observed was that of a regular spiking neuron. (D) The average f/I curve for 12 neurons. Data are presented as mean ± SEM. x-axis: current injected, y-axis: frequency of spiking response.
Cortical Responses to BLA Stimulation Increase with Stimulus Intensity
Once regular spiking neurons were impaled, their responsiveness to BLA stimulation was tested. The location of the stimulating electrode was verified histologically (Figure 2A). BLA stimuli evoked a robust PSP in GC cells. Figure 2B shows overlapping PSPs evoked by BLA stimuli with increasing intensities. Increasing stimulation intensities were used to exclude antidromic activation and spread of current to adjacent nuclei. When BLA is stimulated, GC neurons respond with a depolarizing PSP (arrow, Figure 2B). As the intensity of BLA stimulation is increased, the size of the PSP increases until spike threshold is reached (Figure 2B, inset). Sixty percent (n = 9 of 15) of GC cells spiked to BLA stimulation. The average latency of the onset of the synaptic response is 6.97 ± 0.79 ms (n = 15), with the peak PSP at resting membrane potential occurring at 17.81 ± 1.1 ms (n = 15). The average amplitude of the peak PSP was 15.9 ± 1.9 mV (n = 15) at rest.
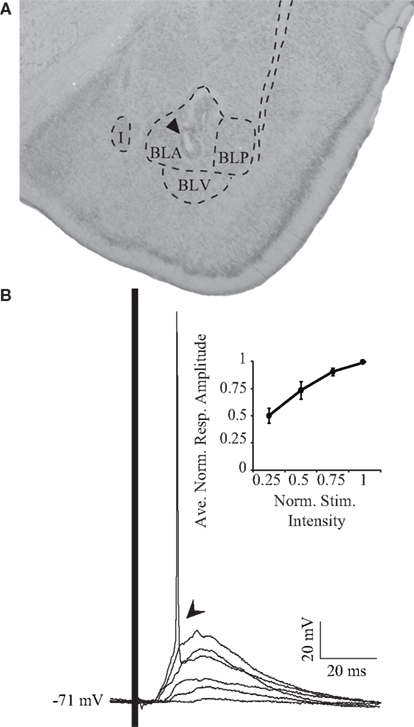
Figure 2. Electrical stimulation of BLA. (A) Representative histological verification of stimulating electrode positioning in BLA. The arrowhead points to the site of the electrolytic lesion. I: intercalated nucleus of the amygdala; BLA, basolateral amygdala, anterior; BLP, basolateral amygdala, posterior; BLV, basolateral amygdala, ventral. (B) Synaptic responses to increasing intensities of stimulation. Note that the highest stimulation intensity results in the firing of an action potential. The inset shows the cumulative normalized response/intensity curve for the population of neurons recorded. Data are presented as mean ± SEM. x-axis: normalized stimulus intensity; y-axis: averaged normalized amplitude of the response.
Voltage-Dependency of Evoked Response
To further investigate excitatory and inhibitory components of the synaptic response, the membrane potential of the cell was held in a window between −65 and −95 mV and PSPs were evoked with BLA stimuli at a fixed intensity (Figure 3A). The intensity was determined by the response properties of each individual cell, and was either 80% of the intensity that elicited a spike or the intensity that elicited the maximum PSP in cells that were not driven to spike. As shown by the representative traces in Figure 3A, the synaptic components of the response are voltage dependent. At hyperpolarized potentials, where the driving force of glutamatergic synapses is larger, the amplitude of the initial portion of the PSP is larger than at rest by an average of 187 ± 25% (n = 12). In contrast, at depolarized potentials where the driving force for inhibition is maximal and that for excitation is reduced, the inhibitory peak is larger by 300 ± 185% (n = 12) while the initial PSP is decreased to 62 ± 12% (n = 12) of its size at rest.
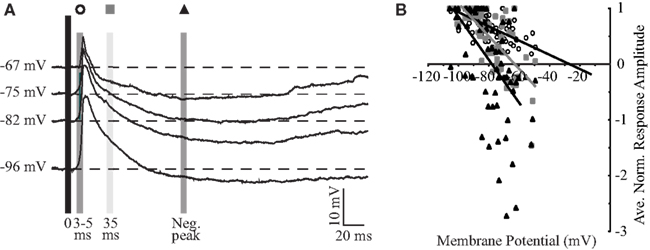
Figure 3. Basolateral amygdala stimulation evokes excitatory and inhibitory responses. (A) Averaged PSP of a representative neuron in response to BLA stimulation at different holding potentials. The three shaded boxes indicate the latencies post-PSP-onset at which the reversal potential was computed: empty circle, 3–5 ms; gray square, 35 ms; black triangle, negative peak. (B) Population plot of reversal potentials. Single points are synaptic responses at different membrane potentials for 15 neurons. Lines represent the linear regression of the values for each of the three latencies. x-axis: voltage; y-axis: normalized amplitude of the response.
Reversal potentials of the excitatory and inhibitory components of the response were determined by measuring the response amplitudes at defined time points, plotting the normalized amplitudes versus membrane potential, and performing a linear regression analysis on responses from 15 neurons to determine the x-intercept (Figure 3B). The early component (3- to 5-ms post-response onset) of the excitatory PSP reverses at −26.7 mV. Taking into account limitations in the technique, this reversal is considered to be close to the reversal of excitatory glutamatergic synapses (Moore and Nelson, 1998). When this analysis is limited to cells that produce action potentials in response to stimulation, which are likely to have a more robust excitatory drive, the extrapolated reversal potential of −14.5 mV (n = 6) more closely approaches the reversal potential of synapses containing AMPA receptors (flowing a combination of Na+ and K+ ions through their pore). At 10- and 35-ms post-response onset, the evoked PSP shows a mix of excitation and inhibition and reverses at −35.9 and −63.0 mV, respectively. The peak of the inhibitory PSP, which occurs on average at 90.7 ± 11.9 ms (n = 14) post-stimulus, reverses at −78.2 mV, near the reversal of GABAA receptors mediated synaptic responses (Maffei et al., 2006). Thus, when BLA is stimulated, GC cells respond first with a likely monosynaptic excitatory PSP, that is followed by a slower inhibitory component.
Short-Term Plasticity at the BLA-GC Synapse
To study short-term dynamics and temporal summation of PSPs, we looked at synaptic responses evoked by trains of five stimuli delivered at 5, 10, 20, and 40 Hz. As shown by the representative traces in Figure 4A and population plots (Figures 4B,C), at frequencies lower than 20 Hz, synaptic responses remain largely unaffected. However, when the stimulation frequency is elevated to 20 or 40 Hz, responses to individual shocks are reduced in amplitude but summate into a depolarizing wave. As Figure 4B emphasizes, when amplitudes are measured from stimulus onset, responses to the second through fifth stimuli at 40 Hz are significantly smaller than the response to the first stimulus (50–70% reduction; n = 9; all pair-wise comparisons p < 0.01, two-tailed t-test). At 5, 10, and 20 Hz, no response to the train differs significantly from the response to the first stimulus. A repeated measures ANOVA reveals significant effects of stimulus number, F(4,32) = 4.42, p < 0.01, and frequency, F(3,24) = 25.79, p < 0.01, and a significant interaction between stimulus number and frequency, F(3.6,28.8) = 10.29, p < 0.01. Bonferroni pair-wise comparisons show that responses to the second through fifth stimuli are significantly smaller at 40 Hz than at lower frequencies (n = 9; all p < 0.01). When amplitudes are measured from the pre-train baseline, however, it is clear that higher frequency stimulation evokes a larger membrane depolarization (Figure 4C). At 40 Hz, this summation of excitation peaks after the second stimulus, where the depolarization is both significantly larger than that evoked by the first stimulus (136 ± 8% increase, n = 9; p < 0.01, two-tailed t-test) and the response evoked by the second stimulus at lower frequencies (n = 9; all p < 0.05, paired two-tailed t-tests). In a repeated measures ANOVA, the main effect of stimulus number is significant, F(1.36,10.87) = 6.13, p < 0.05, while the main effect of frequency and the interaction are both not significant. When the amplitude of the maximal depolarization is compared across the response to the train, it increases with frequency (Figure 4D, left panel) but not to a level that achieves statistical significance. To quantify the summation of the excitatory charge, we calculated the area under the post-synaptic response to the train (e.g., shaded region of traces in Figure 4A). The absolute area was then normalized by interstimulus interval to facilitate a comparison across frequencies. This index value of excitatory charge increases significantly as stimulation frequency increases, with the highest value at 40 Hz (Figure 4D, middle panel; n = 9; repeated measures ANOVA, F(2,16) = 84.11, p < 0.01; all Bonferroni pair-wise comparisons p < 0.01). The summation of depolarization was also quantified by measuring the peak value of the plateau underlying the PSPs (e.g., dotted line through the traces in Figure 4A). The plateau depolarization increases significantly with frequency as well (Figure 4D, right panel; n = 9; repeated measures ANOVA, F(2,16) = 72.40, p < 0.01; all Bonferroni pair-wise comparisons p < 0.01).
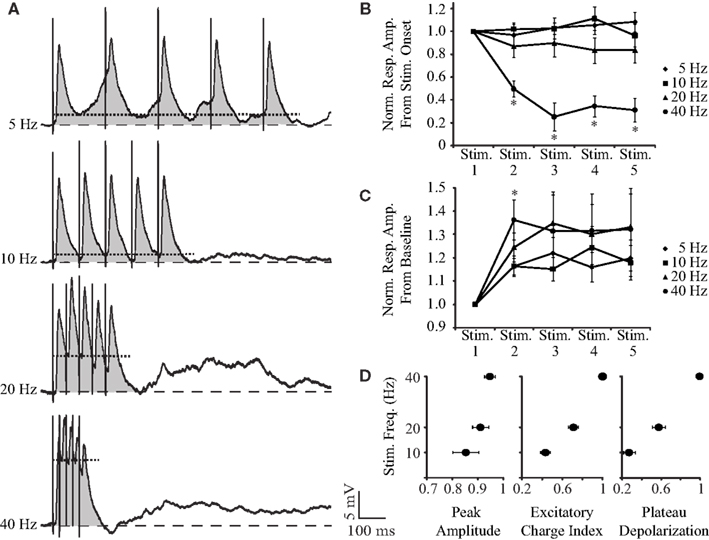
Figure 4. Short-term dynamics of synaptic responses to BLA stimulation. (A) Averaged responses for a representative neuron to trains of five BLA shocks at 5, 10, 20, 40 Hz at resting potential (−80 mV). The gray, shaded region corresponds to the area under the PSPs. The dotted line running through each trace denotes the peak amplitude of the plateau depolarization. (B) Population plot of the short-term plasticity of PSPs at different frequencies. Note that at 40 Hz, responses significantly depress. x-axis: stimulus number, y-axis: normalized response amplitude from each stimulus onset. (C) Cumulative plot of PSP amplitude measured from pre-train membrane potential. PSPs reach more depolarized potentials after the second stimulus, with the highest values being reached at 40 Hz. x-axis: stimulus number, y-axis: normalized response amplitude from pre-train baseline levels. For (B) and (C), asterisks indicate significant differences. (D) Average normalized peak depolarization amplitude, normalized index of excitatory charge, and normalized plateau depolarization amplitude at different frequencies. Note how the highest levels of excitation are reached at 40-Hz stimulation. x-axis: normalized peak amplitude (left panel), normalized index of excitatory charge (middle panel), normalized plateau depolarization (right panel); y-axis: BLA stimulation frequency. For (B), (C), and (D), data are presented as mean ± SEM.
In addition to this excitatory summation, inhibition is steadily recruited and dominates the later part of the response to the train at higher frequencies. As the inhibitory component is larger in response to depolarizing current, the frequency dependence of the inhibitory synaptic component was quantified by holding the neuron at approximately −70 mV (Figure 5A). Figure 5A shows that, when the neuron is depolarized, responses to individual stimuli in the train are shunted and the peak amplitude of the response to the train is reduced (compare Figures 4A and 5A), suggesting that inhibition becomes dominant in the decaying phase of the PSP. The peak of the inhibitory response (gray bars, Figure 5A; histogram, Figure 5B) was measured from pre-train baseline and is significantly larger at 40 Hz, −5.91 ± 2.7 mV (n = 4), than at lower frequencies (all p < 0.01, paired two-tailed t-tests).
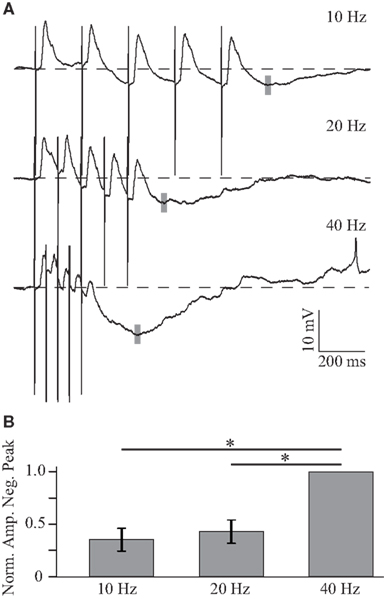
Figure 5. Frequency dependent summation of inhibition. (A) Average responses to trains of five BLA stimuli at 10, 20, and 40 Hz in a GC neuron depolarized to −65 mV. The negative peak of the post-train inhibitory response is larger for higher frequencies of stimulation. The gray shaded line indicates the position of the negative peak in this neuron. (B) Histogram showing the normalized amplitude of the negative peak following trains of stimulation. x-axis: stimulation frequency, y-axis: normalized amplitude of the negative peak. Data are presented as mean ± SEM and asterisks indicate significant differences.
As shown in Figures 4 and 5, trains of BLA stimulation evoke a combination of excitation and inhibition that sum maximally at 40 Hz. The balance between the two components can be tilted to favor one or the other depending on the membrane potential of the neuron. Figure 6 analyzes the dependence of the temporal summation of excitatory and inhibitory components on the membrane potential at 40 Hz. At hyperpolarized membrane potentials, the representative neural trace (Figure 6A) and population plot from four neurons (Figure 6B, top curves) both show that 40-Hz BLA stimulation results in a more sustained depolarizing wave. Indeed at negative potentials (−95 and −83 mV) the amplitude of the second PSP in the train is significantly larger than the first PSP (n = 4; both p < 0.05, two-tailed t-tests). The steady state PSP is not significantly different from the amplitude of the second PSP. More depolarized membrane potentials, on the other hand, are dominated by the summation of inhibition. The steady state amplitude of the excitatory portion of the PSP at −70 mV, achieved after the third stimulus, becomes significantly reduced when compared to the more hyperpolarized potentials (Figure 6B, bottom curve; all p < 0.05, two-tailed t-tests). When the post-train inhibitory peak from baseline (Figure 6C) is compared with a repeated measures ANOVA, the effect of membrane potential is significant, F(2,6) = 32.22, p < 0.01.
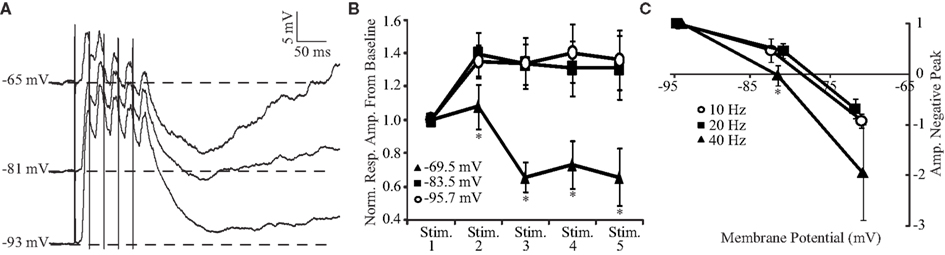
Figure 6. Voltage dependence of summation of excitation and inhibition. (A) Representative PSP elicited in the same GC neuron by trains of five BLA shocks at 40 Hz at different holding potentials. (B) Population plot of response amplitudes to 40 Hz stimulation at different membrane potentials. Reponses at −69.5 mV are dominated by the summation of inhibition while stimulation at more hyperpolarized potentials results in a sustained depolarization. x-axis: stimulus number, y-axis: normalized response amplitude from pre-train baseline levels. (C) Cumulative plot of the normalized post-train inhibitory peak amplitude versus holding potential. For all frequencies, the peak was more negative at depolarized membrane potentials. However, inhibition was more pronounced at 40 Hz. x-axis: voltage, y-axis: normalized amplitude of the negative peak. For (C): empty circle, 10 Hz; black square, 20 Hz; black triangle, 40 Hz. x-axis: holding membrane potential; y-axis: amplitude of the negative peak. For (B) and (C), data are presented as mean ± SEM and asterisks indicate significant differences.
Previous work has focused on the effects of high-frequency BLA stimulation on GC. A 400-ms burst of 100-Hz BLA stimulation is sufficient to desynchronize the cortical EEG (Chavez et al., 2009) and is commonly used in studies of synaptic plasticity to induce long-term potentiation (Jones et al., 1999; Escobar and Bermudez-Rattoni, 2000). As shown in Figure 7, we found a qualitative difference between the response evoked by 100-Hz stimulation compared to lower frequency stimulation: in general, the membrane potential reaches high depolarizing values during the stimulation burst (13.8 ± 2.8 mV, average 114 ± 12% of the peak reached at 40 Hz, n = 7) and then, following the offset of stimulation, shows a slowly repolarizing potential that lasts up to several seconds (Figure 7A). This repolarization is voltage dependent; the reversal potential of the peak depolarization during the train is −37.5 mV and that of the post-train inhibitory peak is −54.2 mV (n = 7; Figure 7B), values that likely derive from a combination of slow excitation and slow inhibition, with the first being more predominant earlier and the second later. In many cases, the long decay was followed by an additional rebound upstate (e.g., Figure 7A).
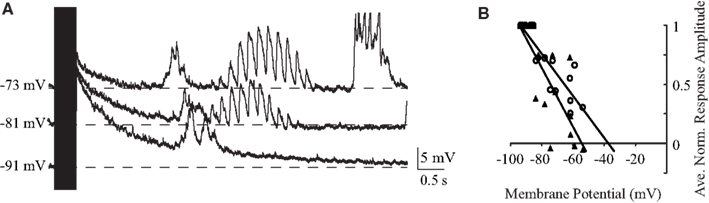
Figure 7. Reponses to tetanic stimulation. (A) Individual traces of a representative neuron’s response to 100 Hz stimulation of BLA at different holding potentials. The duration of the train (400 ms) is indicated by the black rectangle. Note the slow decay following stimulation offset and the rebound depolarization. (B) Population plot of reversal potentials showing that the peak depolarization during the train reverses at −37.5 mV (empty circle) and the post-train inhibitory peak reverses at -54.2 mV (black triangle). Single points are synaptic responses at different membrane potentials for five neurons. Lines represent the linear regression of the values. x-axis: voltage; y-axis: normalized amplitude of the response.
Discussion
There is a general consensus on the importance of BLA in modulating gustatory processing, yet its role in shaping GC activity is not clear. While early results have emphasized mixed excitatory and inhibitory effects of amygdala activation (Yamamoto et al., 1984a), more recent reports have focused on either excitation or inhibition. Some authors have shown that BLA stimulation can robustly evoke excitatory field potentials (Jones et al., 1999; Escobar et al., 2002; Ferreira et al., 2005) while others have described inhibitory effects on GC (Hanamori, 2009). Here we characterized for the first time the synaptic connection between BLA and GC and provided a unifying view of its effects. We found that BLA stimulation resulted in large, time-varying PSP in GC neurons. An initial excitatory PSP, in many cases capable of reaching spike threshold, was invariably followed by a slower and prolonged inhibitory potential. Reversal potentials of these two components were consistent with glutamatergic and GABAergic synapses. Further, we looked at the effects of trains of varying frequencies on the temporal summation of PSPs and found a large summation of both excitatory and inhibitory components at 20 and 40 Hz. These two frequencies are consistent with the firing rates observed in amygdala neurons of behaving rats (Grossman et al., 2008; Fontanini et al., 2009). Qualitatively different effects were observed using a higher frequency and more prolonged stimulation protocol previously used in the literature (Chavez et al., 2009). Stimulating BLA at 100 Hz for 400 ms lead to a depolarization lasting the time of the stimulation followed by a multi-second repolarizing potential likely resulting from a combination of NMDA, slower GABA receptors, and neuromodulators.
Synaptic Organization
The latency of the initial response is consistent with a direct glutamatergic input from amygdalar principal neurons (Saper, 1982; Allen et al., 1991), which could be as strong as to lead GC neurons to fire action potentials. Cells that responded with action potentials with a latency faster than 2 ms were excluded from this study to avoid possible confounds with antidromic activation. Graded responses to increasing stimulation intensity further support the orthodromic nature of the PSP recorded. While our results point to direct connections from BLA to GC, they do not exclude additional polysynaptic recurrent excitation within GC, which is suggested by recent imaging results showing excitatory waves across insular cortex (Fujita et al., 2010). The slower inhibitory response we observed is multisynaptic and likely generated by local inhibitory interneurons. Indeed, there are no reports consistent with direct inhibitory projections from BLA. That inhibition intrinsic to GC (Yamamoto et al., 2010) can play an active role in sculpting gustatory responses has been shown in recordings before and after local pharmacological block of GABAergic transmission (Ogawa et al., 1998). Whether inhibition results from direct activation of feedforward inhibitory circuits in GC, as in the case of dopaminergic inputs (Ohara et al., 2003) or from recurrent activation of feedback interneurons by pyramidal cells is not known. The presence of mixed reversal potentials as early as 10 ms following BLA shocks and the clear inhibitory peak at a later latency suggest the possible contribution of both types of circuits. A similar synaptic organization has been described in both paleo- (Haberly and Bower, 1984) and neo-cortex (Beierlein et al., 2003; Cruikshank et al., 2007, 2010), of which the insular cortex is a transitional area. A different circuit is likely responsible for mediating the slow mixed potential observed for high-frequency stimulation of BLA. This phenomenon could result from a summation of neuromodulatory afferents recruited by BLA (Chavez et al., 2009) with longer duration NMDA (Inaba et al., 2006) and GABAB (Ohara et al., 2003) mediated potentials. While the issue of the epileptogenesis in amygdala is beyond the scope of this report, the rebound depolarization observed after high-frequency stimulation might be related to interictal discharges. The absence of intense spiking during the stimulation and rebound depolarization however excludes its epileptic nature (Avoli et al., 2002; Aroniadou-Anderjaska et al., 2008).
BLA and Temporal Coding of Psychological Dimensions in GC
The contribution of the amygdala to gustatory codes has been the subject of intense investigation. Most of the work, however, has involved the characterization of the role of the central nucleus in modulating gustatory responses in the brainstem (Li et al., 2002, 2005; Kang and Lundy, 2010). As for BLA, its role seems to be more focused on interactions with cortical areas (Saper, 1982; Roesch et al., 2010). BLA is involved in coding different aspects of gustatory experience (Katz et al., 2002; Reilly and Bornovalova, 2005; Balleine and Killcross, 2006; Jones et al., 2006) and two populations of neurons have been described on the basis of firing dynamics in response to tastes (Fontanini et al., 2009). Neurons responding with phasic and short-lasting bursts to tastes appear to be involved in coding salience or reward value of stimuli. On the other hand, cells responding with tonic, longer lasting (up to 2 s) elevations of firing activity code for palatability. These populations are also differentially involved in coding for anticipatory stimuli (Fontanini et al., 2009). Our data suggest that these different time-courses might have distinct impacts on the balance of excitation and inhibition in GC and on its information processing. While phasic neurons would likely produce brief excitation followed by inhibition, tonic neurons would promote a state in which the two components are mixed for longer periods, giving way to inhibition as their firing rates stop. How these dynamics give rise to saliency, palatability, and coding of anticipatory cues is currently a matter of speculation. It is reasonable to hypothesize that the initial burst of activity in response to tastes or cues anticipating tastes might be responsible for a general activatory saliency or attentive signal in GC (Roesch et al., 2010). Sustained activity ending at the time at which palatability begins to be processed in GC, on the other hand, suggests a potential role for inhibition in mediating a state transition for insular networks (Jones et al., 2007; Fontanini and Katz, 2008; Miller and Katz, 2010). More work is needed to determine the pattern of connectivity of these two groups of neurons and their influence on excitatory and inhibitory networks in GC. Similarly, a fundamental aspect of the interaction between these two areas, which will likely contribute to the construction of a working model of this system, is the returning connection from GC to BLA (Saper, 1982; Yamamoto et al., 1984a). A combination of anatomical, intracellular recordings in vitro and in vivo, and electrophysiology in awake animals will contribute to describing how the synaptic structure of the BLA–GC system allows the processing of emotional and psychological dimensions of tastes.
Amygdalo-Cortical Synapses and Learning
The amygdala plays a crucial role in chemosensory learning (Schafe et al., 1998; Reilly and Bornovalova, 2005; Wang et al., 2006; Grossman et al., 2008). CTA, a learning paradigm in which a palatable taste becomes aversive when paired with gastric malaise, involves BLA and its connections with GC. NMDA-dependent long-term potentiation of amygdalo-cortical synapses has been described to mediate this learning (Escobar and Bermudez-Rattoni, 2000; Escobar et al., 2002; Ferreira et al., 2005). Data showing changes of GC and BLA taste coding and of their coupling following CTA in awake rats further support the involvement of this projection (Grossman et al., 2008). However, the ways in which plasticity and changes in functional connectivity are implemented are currently not known. Our results suggest the possibility that high-frequency bursts in BLA neurons might depolarize GC neurons enough to allow NMDA receptors to promote plasticity.
BLA and Insula: Beyond Taste
While our recordings were targeted to a region of insular cortex known to be involved in gustatory coding (Yamamoto, 1984b; Fontanini and Katz, 2005), we did not characterize the taste responsiveness of the neurons recorded. This raises the possibility that the effects of BLA stimulation described here might not be specific to taste processing neurons and extend to populations of insular neurons involved in other tasks. In general, insular cortex is devoted to processing multiple stimuli rich in emotional and psychological value. It is reasonable to expect that inputs from the amygdala might contribute to the coding of noxious, visceral, addictive stimuli, and conspecific vocalizations observed in the most anterior and posterior regions of the insula (Breiter et al., 1997; Small et al., 2001; Bornhovd et al., 2002; Dunckley et al., 2005; Ortigue et al., 2007; Remedios et al., 2009). Beyond insula, the amygdala has an even more general role in enriching sensory codes with emotional and psychological dimensions. Whether perceived naively or after learning, olfactory, somatosensory, visual, and auditory stimuli can be rewarding or have an emotional value (Morris et al., 1996; Quirk et al., 1997; Blood and Zatorre, 2001; Pantoja et al., 2007; Doucette and Restrepo, 2008) and be the subject of expectations (Shuler and Bear, 2006). In fact all these modalities are capable of activating amygdala (Aggleton et al., 1980; Nishijo et al., 1988, 1998) and to some extent have been shown to be modulated by amygdala as well (Bordi and LeDoux, 1994). A systematic analysis of amygdalo-cortical connections will determine whether and how this area plays a general role in modulating sensory processing in awake subjects.
Conflict of Interest Statement
The authors declare that the research was conducted in the absence of any commercial or financial relationships that could be construed as a potential conflict of interest.
Acknowledgments
This work was supported by NIDCD R01-DC010389 and the Klingenstein Foundation (Alfredo Fontanini).
References
Aggleton, J. P., Burton, M. J., and Passingham, R. E. (1980). Cortical and subcortical afferents to the amygdala of the rhesus monkey (Macaca mulatta). Brain Res. 190, 347–368.
Allen, G. V., Saper, C. B., Hurley, K. M., and Cechetto, D. F. (1991). Organization of visceral and limbic connections in the insular cortex of the rat. J. Comp. Neurol. 311, 1–16.
Aroniadou-Anderjaska, V., Fritsch, B., Qashu, F., and Braga, M. F. (2008). Pathology and pathophysiology of the amygdala in epileptogenesis and epilepsy. Epilepsy Res. 78, 102–116.
Avoli, M., D’Antuono, M., Louvel, J., Kohling, R., Biagini, G., Pumain, R., D’Arcangelo, G., and Tancredi, V. (2002). Network and pharmacological mechanisms leading to epileptiform synchronization in the limbic system in vitro. Prog. Neurobiol. 68, 167–207.
Balleine, B. W., and Killcross, S. (2006). Parallel incentive processing: an integrated view of amygdala function. Trends Neurosci. 29, 272–279.
Beierlein, M., Gibson, J. R., and Connors, B. W. (2003). Two dynamically distinct inhibitory networks in layer 4 of the neocortex. J. Neurophysiol. 90, 2987–3000.
Bermudez-Rattoni, F., Grijalva, C. V., Kiefer, S. W., and Garcia, J. (1986). Flavor-illness aversions: the role of the amygdala in the acquisition of taste-potentiated odor aversions. Physiol. Behav. 38, 503–508.
Blood, A. J., and Zatorre, R. J. (2001). Intensely pleasurable responses to music correlate with activity in brain regions implicated in reward and emotion. Proc. Natl. Acad. Sci. U.S.A. 98, 11818–11823.
Bordi, F., and LeDoux, J. E. (1994). Response properties of single units in areas of rat auditory thalamus that project to the amygdala. II. Cells receiving convergent auditory and somatosensory inputs and cells antidromically activated by amygdala stimulation. Exp. Brain Res. 98, 275–286.
Bornhovd, K., Quante, M., Glauche, V., Bromm, B., Weiller, C., and Buchel, C. (2002). Painful stimuli evoke different stimulus-response functions in the amygdala, prefrontal, insula and somatosensory cortex: a single-trial fMRI study. Brain 125(Pt 6), 1326–1336.
Breiter, H. C., Gollub, R. L., Weisskoff, R. M., Kennedy, D. N., Makris, N., Berke, J. D., Goodman, J. M., Kantor, H. L., Gastfriend, D. R., Riorden, J. P., Mathew, R. T., Rosen, B. R., and Hyman, S. E. (1997). Acute effects of cocaine on human brain activity and emotion. Neuron 19, 591–611.
Breslin, P. A., Spector, A. C., and Grill, H. J. (1992). A quantitative comparison of taste reactivity behaviors to sucrose before and after lithium chloride pairings: a unidimensional account of palatability. Behav. Neurosci. 106, 820–836.
Chavez, C. M., McGaugh, J. L., and Weinberger, N. M. (2009). The basolateral amygdala modulates specific sensory memory representations in the cerebral cortex. Neurobiol. Learn. Mem. 91, 382–392.
Clark, E. W., and Bernstein, I. L. (2009). Boosting cholinergic activity in gustatory cortex enhances the salience of a familiar conditioned stimulus in taste aversion learning. Behav. Neurosci. 123, 764–771.
Cruikshank, S. J., Lewis, T. J., and Connors, B. W. (2007). Synaptic basis for intense thalamocortical activation of feedforward inhibitory cells in neocortex. Nat. Neurosci. 10, 462–468.
Cruikshank, S. J., Urabe, H., Nurmikko, A. V., and Connors, B. W. (2010). Pathway-specific feedforward circuits between thalamus and neocortex revealed by selective optical stimulation of axons. Neuron 65, 230–245.
Doucette, W., and Restrepo, D. (2008). Profound context-dependent plasticity of mitral cell responses in olfactory bulb. PLoS Biol. 6, e258. doi: 10.1371/journal.pbio.0060258
Dunckley, P., Wise, R. G., Aziz, Q., Painter, D., Brooks, J., Tracey, I., and Chang, L. (2005). Cortical processing of visceral and somatic stimulation: differentiating pain intensity from unpleasantness. Neuroscience 133, 533–542.
Escobar, M. L., Alcocer, I., and Bermudez-Rattoni, F. (2002). In vivo effects of intracortical administration of NMDA and metabotropic glutamate receptors antagonists on neocortical long-term potentiation and conditioned taste aversion. Behav. Brain Res. 129, 101–106.
Escobar, M. L., and Bermudez-Rattoni, F. (2000). Long-term potentiation in the insular cortex enhances conditioned taste aversion retention. Brain Res. 852, 208–212.
Ferreira, G., Miranda, M. I., De la Cruz, V., Rodríguez-Ortiz, C. J., and Bermúdez-Rattoni, F. (2005). Basolateral amygdala glutamatergic activation enhances taste aversion through NMDA receptor activation in the insular cortex. Eur. J. Neurosci. 22, 2596–2604.
Fontanini, A., Grossman, S. E., Figueroa, J. A., and Katz, D. B. (2009). Distinct subtypes of basolateral amygdala taste neurons reflect palatability and reward. J. Neurosci. 29, 2486–2495.
Fontanini, A., and Katz, D. B. (2005). 7 to 12 Hz activity in rat gustatory cortex reflects disengagement from a fluid self-administration task. J. Neurophysiol. 93, 2832–2840.
Fontanini, A., and Katz, D. B. (2006). State-dependent modulation of time-varying gustatory responses. J. Neurophysiol. 96, 3183–3193.
Fontanini, A., and Katz, D. B. (2008). Behavioral states, network states, and sensory response variability. J. Neurophysiol. 100, 1160–1168.
Fontanini, A., Spano, P., and Bower, J. M. (2003). Ketamine-xylazine-induced slow (<1.5 Hz) oscillations in the rat piriform (olfactory) cortex are functionally correlated with respiration. J. Neurosci. 23, 7993–8001.
Fujita, S., Adachi, K., Koshikawa, N., and Kobayashi, M. (2010). Spatiotemporal dynamics of excitation in rat insular cortex: intrinsic corticocortical circuit regulates caudal-rostro excitatory propagation from the insular to frontal cortex. Neuroscience 165, 278–292.
Gallo, M., Roldan, G., and Bures, J. (1992). Differential involvement of gustatory insular cortex and amygdala in the acquisition and retrieval of conditioned taste aversion in rats. Behav. Brain Res. 52, 91–97.
Grossman, S. E., Fontanini, A., Wieskopf, J. S., and Katz, D. B. (2008). Learning-related plasticity of temporal coding in simultaneously recorded amygdala-cortical ensembles. J. Neurosci. 28, 2864–2873.
Haberly, L. B., and Bower, J. M. (1984). Analysis of association fiber system in piriform cortex with intracellular recording and staining techniques. J. Neurophysiol. 51, 90–112.
Hanamori, T. (2009). Effects of electrical and chemical stimulation of the amygdala on the spontaneous discharge in the insular cortex in rats. Brain Res. 1276, 91–102.
Hasenstaub, A., Sachdev, R. N., and McCormick, D. A. (2007). State changes rapidly modulate cortical neuronal responsiveness. J. Neurosci. 27, 9607–9622.
Holland, P. C., and Gallagher, M. (2004). Amygdala-frontal interactions and reward expectancy. Curr. Opin. Neurobiol. 14, 148–155.
Inaba, Y., De Guzman, P., and Avoli, M. (2006). NMDA receptor-mediated transmission contributes to network ‘hyperexcitability’ in the rat insular cortex. Eur. J. Neurosci. 23, 1071–1076.
Jones, L. M., Fontanini, A., and Katz, D. B. (2006). Gustatory processing: a dynamic systems approach. Curr. Opin. Neurobiol. 16, 420–428.
Jones, L. M., Fontanini, A., Sadacca, B. F., Miller, P., and Katz, D. B. (2007). Natural stimuli evoke dynamic sequences of states in sensory cortical ensembles. Proc. Natl. Acad. Sci. U.S.A. 104, 18772–18777.
Jones, M. W., French, P. J., Bliss, T. V. P., and Rosenblum, K. (1999). Molecular mechanisms of long-term potentiation in the insular cortex in vivo. J. Neurosci. 19, 36RC1–36RC8.
Kang, Y., and Lundy, R. F. (2010). Amygdalofugal influence on processing of taste information in the nucleus of the solitary tract of the rat. J. Neurophysiol. 104, 726–741.
Katz, D. B., Nicolelis, M. A., and Simon, S. A. (2002). Gustatory processing is dynamic and distributed. Curr. Opin. Neurobiol. 12, 448–454.
Katz, D. B., Simon, S. A., and Nicolelis, M. A. (2001). Dynamic and multimodal responses of gustatory cortical neurons in awake rats. J. Neurosci. 21, 4478–4489.
Li, C. S., Cho, Y. K., and Smith, D. V. (2002). Taste responses of neurons in the hamster solitary nucleus are modulated by the central nucleus of the amygdala. J. Neurophysiol. 88, 2979–2992.
Li, C. S., Cho, Y. K., and Smith, D. V. (2005). Modulation of parabrachial taste neurons by electrical and chemical stimulation of the lateral hypothalamus and amygdala. J. Neurophysiol. 93, 1183–1196.
Maffei, A., Nataraj, K., Nelson, S. B., and Turrigiano, G. G. (2006). Potentiation of cortical inhibition by visual deprivation. Nature 443, 81–84.
Miller, P., and Katz, D. B. (2010). Stochastic transitions between neural states in taste processing and decision-making. J. Neurosci. 30, 2559–2570.
Moore, C. I., and Nelson, S. B. (1998). Spatio-temporal subthreshold receptive fields in the vibrissa representation of rat primary somatosensory cortex. J. Neurophysiol. 80, 2882–2892.
Morris, J. S., Frith, C. D., Perrett, D. I., Rowland, D., Young, A. W., Calder, A. J., and Dolan, R. J. (1996). A differential neural response in the human amygdala to fearful and happy facial expressions. Nature 383, 812–815.
Nishijo, H., Ono, T., and Nishino, H. (1988). Single neuron responses in amygdala of alert monkey during complex sensory stimulation with affective significance. J. Neurosci. 8, 3570–3583.
Nishijo, H., Uwano, T., Tamura, R., and Ono, T. (1998). Gustatory and multimodal neuronal responses in the amygdala during licking and discrimination of sensory stimuli in awake rats. J. Neurophysiol. 79, 21–36.
Ogawa, H., Hasegawa, K., Otawa, S., and Ikeda, I. (1998). GABAergic inhibition and modifications of taste responses in the cortical taste area in rats. Neurosci. Res. 32, 85–95.
Ohara, P. T., Granato, A., Moallem, T. M., Wang, B. R., Tillet, Y., and Jasmin, L. (2003). Dopaminergic input to GABAergic neurons in the rostral agranular insular cortex of the rat. J. Neurocytol. 32, 131–141.
Ortigue, S., Grafton, S. T., and Bianchi-Demicheli, F. (2007). Correlation between insula activation and self-reported quality of orgasm in women. Neuroimage 37, 551–560.
Pantoja, J., Ribeiro, S., Wiest, M., Soares, E., Gervasoni, D., Lemos, N. A., and Nicolelis, M. A. (2007). Neuronal activity in the primary somatosensory thalamocortical loop is modulated by reward contingency during tactile discrimination. J. Neurosci. 27, 10608–10620.
Paton, J. J., Belova, M. A., Morrison, S. E., and Salzman, C. D. (2006). The primate amygdala represents the positive and negative value of visual stimuli during learning. Nature 439, 865–870.
Quirk, G. J., Armony, J. L., and LeDoux, J. E. (1997). Fear conditioning enhances different temporal components of tone-evoked spike trains in auditory cortex and lateral amygdala. Neuron 19, 613–624.
Reilly, S., and Bornovalova, M. A. (2005). Conditioned taste aversion and amygdala lesions in the rat: a critical review. Neurosci. Biobehav. Rev. 29, 1067–1088.
Remedios, R., Logothetis, N. K., and Kayser, C. (2009). An auditory region in the primate insular cortex responding preferentially to vocal communication sounds. J. Neurosci. 29, 1034–1045.
Roesch, M. R., Calu, D. J., Esber, G. R., and Schoenbaum, G. (2010). All that glitters… dissociating attention and outcome expectancy from prediction errors signals. J. Neurophysiol. 104, 587–595.
Saper, C. B. (1982). Convergence of autonomic and limbic connections in the insular cortex of the rat. J. Comp. Neurol. 210, 163–173.
Schafe, G. E., Thiele, T. E., and Bernstein, I. L. (1998). Conditioning method dramatically alters the role of amygdala in taste aversion learning. Learn. Mem. 5, 481–492.
Schoenbaum, G., Setlow, B., Nugent, S. L., Saddoris, M. P., and Gallagher, M. (2003). Lesions of orbitofrontal cortex and basolateral amygdala complex disrupt acquisition of odor-guided discriminations and reversals. Learn. Mem. 10, 129–140.
Shuler, M. G., and Bear, M. F. (2006). Reward timing in the primary visual cortex. Science 311, 1606–1609.
Small, D. M., Zatorre, R. J., Dagher, A., Evans, A. C., and Jones-Gotman, M. (2001). Changes in brain activity related to eating chocolate: from pleasure to aversion. Brain 124(Pt 9), 1720–1733.
Travers, J. B., and Norgren, R. (1986). Electromyographic analysis of the ingestion and rejection of sapid stimuli in the rat. Behav. Neurosci. 100, 544–555.
Wang, Y., Fontanini, A., and Katz, D. B. (2006). Temporary basolateral amygdala lesions disrupt acquisition of socially transmitted food preferences in rats. Learn. Mem. 13, 794–800.
Yamamoto, K., Koyanagi, Y., Koshikawa, N., and Kobayashi, M. (2010). Postsynaptic cell type-dependent cholinergic regulation of GABAergic synaptic transmission in rat insular cortex. J. Neurophysiol. 104, 1933–1945.
Yamamoto, T., Azuma, S., and Kawamura, Y. (1984a). Functional relations between the cortical gustatory area and the amygdala: electrophysiological and behavioral studies in rats. Exp. Brain Res. 56, 23–31.
Yamamoto, T., Yuyama, N., Kato, T., and Kawamura, Y. (1984b). Gustatory responses of cortical neurons in rats. I. Response characteristics. J. Neurophysiol. 51, 616–635.
Yamamoto, T., Yuyama, N., and Kawamura, Y. (1981). Cortical neurons responding to tactile, thermal and taste stimulations of the rat’s tongue. Brain Res. 221, 202–206.
Keywords: amygdala, hedonics, in vivo intracellular, taste, top-down
Citation: Stone ME, Maffei A and Fontanini A (2011) Amygdala stimulation evokes time-varying synaptic responses in the gustatory cortex of anesthetized rats. Front. Integr. Neurosci. 5:3. doi: 10.3389/fnint.2011.00003
Received: 17 January 2011;
Paper pending published: 30 January 2011;
Accepted: 17 March 2011;
Published online: 31 March 2011
Edited by:
John J. Foxe, Albert Einstein College of Medicine, USAReviewed by:
Donald A. Wilson, New York University School of Medicine, USARobert Lundy, University of Louisville, USA
Copyright: © 2011 Stone, Maffei and Fontanini. This is an open-access article subject to a non-exclusive license between the authors and Frontiers Media SA, which permits use,
*Correspondence: Alfredo Fontanini, Department of Neurobiology and Behavior, Stony Brook University, Stony Brook, NY 11794-5230, USA. e-mail: alfredo.fontanini@stonybrook.edu