Spike rate and spike timing contributions to coding taste quality information in rat periphery
- 1 Department of Statistics, Florida State University, Tallahassee, FL, USA
- 2 Department of Psychology and Program in Neuroscience, Florida State University, Tallahassee, FL, USA
There is emerging evidence that individual sensory neurons in the rodent brain rely on temporal features of the discharge pattern to code differences in taste quality information. In contrast, investigations of individual sensory neurons in the periphery have focused on analysis of spike rate and mostly disregarded spike timing as a taste quality coding mechanism. The purpose of this work was to determine the contribution of spike timing to taste quality coding by rat geniculate ganglion neurons using computational methods that have been applied successfully in other systems. We recorded the discharge patterns of narrowly tuned and broadly tuned neurons in the rat geniculate ganglion to representatives of the five basic taste qualities. We used mutual information to determine significant responses and the van Rossum metric to characterize their temporal features. While our findings show that spike timing contributes a significant part of the message, spike rate contributes the largest portion of the message relayed by afferent neurons from rat fungiform taste buds to the brain. Thus, spike rate and spike timing together are more effective than spike rate alone in coding stimulus quality information to a single basic taste in the periphery for both narrowly tuned specialist and broadly tuned generalist neurons.
Introduction
There are several recent studies demonstrating that individual chemosensory neurons use temporal information for encoding taste quality information. Most of these studies have focused on gustatory processing centers in the brain. For example in studies of the brainstem’s nucleus of solitary tract (NST), the first synaptic station of the central gustatory system, Di Lorenzo and Victor(2003, 2007) have reported that spike timing may convey more information about taste quality than the conventional measure of spike count. They (Roussin et al., 2008) have shown further that spike timing differences across NST neurons were especially effective in discriminating two prototypic stimuli of one taste quality (i.e., discriminating between two sugars or two salts). Most recently, they have provided evidence indicating that broadly tuned neurons could discriminate the basic taste stimuli and binary mixtures of them based on the temporal features of the neural responses, which were represented in a three-dimensional taste space with each basic stimulus occupying a unique location within the space apart from each other (Di Lorenzo et al., 2009).
In contrast to the brain, electrophysiological single-cell studies of taste quality coding in the peripheral nervous system have mostly disregarded spike timing as a coding strategy. Except for a few prescient studies conducted many years ago (e.g., Fishman, 1957; Mistretta, 1972; Ogawa et al., 1973, 1974; Nagai and Ueda, 1981), the emphasis has been on spike count as the indispensable mode of signaling. In fact, it has been suggested that the periphery may transmit information by a spike count code and then be converted to a temporal code in the brain (Di Lorenzo et al., 2009). We have, however, recently shown the importance of temporal information in the geniculate ganglion (Breza et al., 2010) that receives input from taste buds now known to be complex processing stations with dynamic interaction between three distinct structural (Yee et al., 2001; Witt et al., 2003; Finger et al., 2005) and functional (Finger et al., 2005; Tomchik et al., 2007; Kataoka et al., 2008; Vandenbeuch et al., 2008; Roper, 2009) cell types. We have shown that geniculate ganglion neurons receiving input from fungiform taste buds on the anterior tongue can be distinguished by their unique response latency profiles to NaCl, sucrose, citric acid, and quinine hydrochloride (QHCl). Our present goal is to extend this analysis to determine whether spike timing is critical to coding not just at response onset but during stimulation, as well.
The present study focused on single-cell responses by geniculate ganglion neurons to lingual stimulation with the basic taste stimuli delivered at controlled temperature and flow rate in 35°C artificial saliva (AS). We adapted the tongue to 35°C AS to mimic as much as possible the natural environment bathing lingual receptors and to enhance spontaneous activity and neural responsiveness (Breza et al., 2010). The geniculate ganglion consists of two physiological populations of neurons: about 50% are narrowly tuned specialists that respond with high spike rate to prototypic stimuli of one taste quality and very little if at all to stimuli of other taste qualities; the other half are broadly tuned generalists that respond to multiple taste qualities (Frank et al., 2008; Breza et al., 2010). For example, narrowly tuned NaCl-specialist neurons respond with high spike rate and short latency to NaCl, but are relatively unresponsive to sweet sucrose, sour citric acid, or bitter quinine. They are also relatively unresponsive to non-sodium salts like KCl and NH4Cl (Lundy and Contreras, 1999; Contreras and Lundy, 2000), but respond to the sodium component of monosodium glutamate (MSG), a prototypic stimulus for umami (Breza et al., 2007). Similarly, sucrose-specialist neurons respond with relatively high spike rate to sucrose and weakly at best to NaCl, but are unresponsive to citric acid or quinine. However, sucrose-specialist neurons respond to the glutamate component of MSG (Breza et al., 2007). In contrast to specialist neurons, broadly tuned acid-generalist neurons respond best to citric acid with high spike rate and relatively long response latency and secondarily to salty and bitter stimuli but with short response latencies (Breza et al., 2010). Electrolyte-generalist neurons are broadly responsive to ionic stimuli (KCl, NaCl, quinine HCl, MSG) and relatively unresponsive to citric acid and sucrose. The contribution of spike timing may differ for these two populations of neurons. Our main purpose was to determine the contribution of spike timing to quality coding by specialist and generalist neurons of the geniculate ganglion using computational methods that have been applied successfully in other systems.
Materials and Methods
Animals and Surgery
Adult male Sprague-Dawley rats (Charles River Laboratories; n = 15) weighing 309–640 g were housed individually in plastic cages in a temperature-controlled colony room on a 12- to 12-h light–dark cycle with lights on at 0700 h. All animals had free access to Purina Rat Chow (No. 5001) and deionized water (dH20). Rats were anesthetized with urethane (1.5 g/kg body wt) and, following a tracheostomy, were secured in a Stereotaxic Instrument for rats (SR-6R, Narishige International USA, Inc.) with blunt ear bars. The tongue was gently extended and held in place by a suture attached to the ventral surface. The geniculate ganglion was exposed using a dorsal approach following procedures described previously (Lundy and Contreras 1999). Briefly, a midline incision was made on the occipital portion of the skull, and the skin and muscles were excised. A portion of the right cranium between bregma and lambda was removed and the underlying neural tissue was aspirated to allow access to the temporal bone. The petrous portion of the temporal bone then was gradually planed away to expose the geniculate ganglion.
Stimulus Delivery and Stimulation Protocols
Solutions were presented to the anterior portion of the tongue using OctaFlow™ delivery system (ALA’s scientific instrument) at a constant flow rate of 50 μl/s, approximating the volume of fluid consumed by a rat licking from a drinking spout at a rate of 6–7 lick/s (Smith et al., 1992). The fluid delivery system’s mixing port (quartz Micromanifold™) allows switching between taste stimuli and rinse solution without compromising the flow rate. A Heated Perfusion Cube HPC-2A (ALA Scientific Instrument Inc.), placed near the end of the stimulus outflow tube, allowed the temperature of the solutions to be held constant at 35 ± 0.1°C (Temperature controller PTC-10, ALA Scientific Instrument Inc.).
The taste stimuli used in our experiments consisted of 0.5 M sucrose (Sucr), 0.1 M NaCl, 0.01 M citric acid (CA), 0.02 M quinine hydrochloride (QHCl), 0.1 M monosodium glutamate (MSG), and KCl. AS (Hirata et al., 2005; 15 mM NaCl, 22 mM KCl, 3 mM CaCl2, and 6 mM MgCl2; pH 5.8) served as the rinse solution and solvent for the basic taste stimuli. All chemicals were reagent grade. The tongue was adapted to 35°C AS and the responses to 8–10 random presentations of each of the seven stimuli including AS were evaluated. Thus, there were a total of 56–70 stimulus trials for each neuron. Each stimulus trial consisted of a 2-s pre-stimulus period of AS, a 2.5-s chemical stimulation period, and a 2-s post-stimulus period with AS. AS was a control stimulus as well as the rinse solution for all the trials. A 60-s AS rinse preceded and followed each stimulus presentation to ensure that neural activity returned to stable baseline values.
At the onset of our experiments, we chose to run 10 trials per stimulus, although in a few instances we had to settle for eight stimulus trials for technical reasons (e.g., lost cell or its responsiveness). Ten was our best guess estimate for obtaining reliable statistically supported results. Based on our previous experience with the geniculate ganglion preparation, we recorded consistent response frequency profiles to the standard basic stimuli at the beginning and end of a long stimulus protocol (Breza et al., 2010). That is, the response patterns of the neurons remained the same at the beginning and end of stimulation for a protocol that may have lasted 60 min with many stimulus trials. This was abetted by our stimulus delivery system that presented solutions at controlled flow rate and temperature with little variation over repeated trials. Given this history, 10 trials seemed more than sufficient to conduct our metric analyses. In fact when we performed mutual information analysis on the responses, 10 trials yielded reasonably narrow confidence intervals over time to determine when there was significant spike activity during the recording period. Also, this number of 8–10 stimulus trials compared reasonably well with the number of repetitions used in other studies. For example, in a paper by Di Lorenzo et al. (2009), the stimuli were presented at least five times with a range of 5–23 presentations.
Recording Techniques
Electrogustogram
The Electrogustogram (EGG) was recorded with Micropipette Holder and Ag/AgCl Pellet (World Precision Instruments) via saline-agar-filled capillary pipettes (tip Ø 100 μM, 0.15 M NaCl, 0.5% agar). We located the receptive field of the geniculate ganglion neuron by dotting a minute amount of chemical solution on the tongue from the bristle tips of a delicate artisan paintbrush. The EGG electrode and stimulus tube were placed near this region and remained unchanged until the stimulus protocol was completed. The signal was amplified DC amplifier M-511 (A-M Systems, Inc.), digitized, and stored on a PC. The signal served as a rapid response onset to the tested stimulus.
Geniculate Ganglion Unit Recording
Unit/few unit activity (generally 100–250 μV peak-to-peak amplitude) was recorded extracellularly. A low-impedance (1.0–1.5 Mom, 1000 Hz) glass-insulated tungsten microelectrode (tip Ø 1 μM) was mounted on a Hydraulic Micromanipulator MO-10 (Narishige International USA, Inc.) and advanced downward from the dorsal surface of the ganglion. Neural activity was amplified with an AC Amplifier Model 1700 (A-M Systems, Inc., bandpass 100–5000 Hz). Neuronal and EGG responses were monitored on-line and digitized using hardware and software Spike 2 (CED, UK). Digitized responses were stored on computer for later analysis. Spike templates were formed on the basis of amplitude and waveform (Figure 1). Neurons were accepted only if they exceeded a signal-to-noise ratio of 3:1 (Di Lorenzo et al., 2009) and met strict waveform matching criteria (Breza et al., 2010).
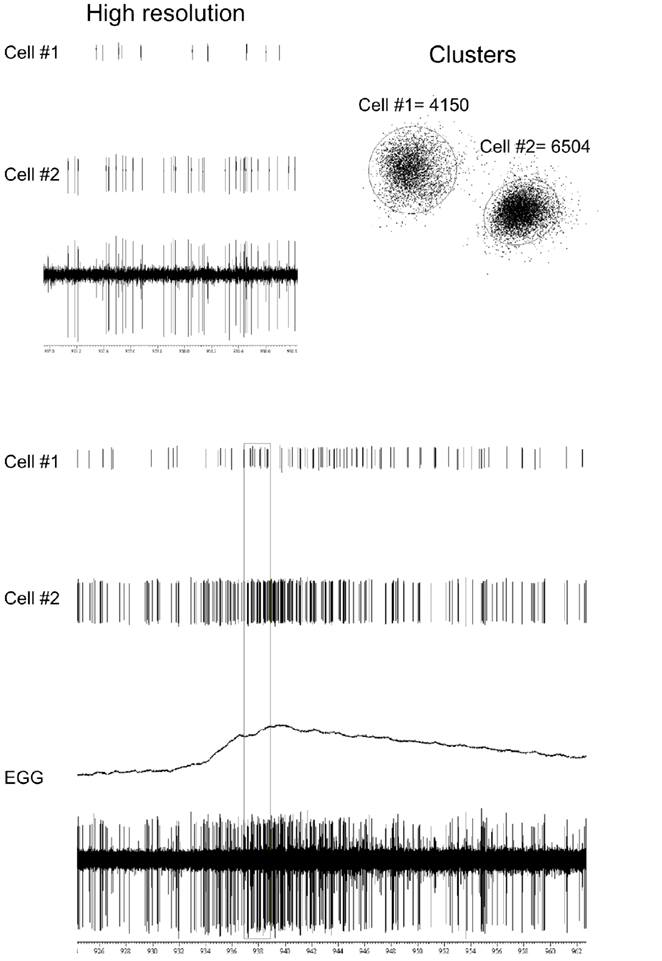
Figure 1. The bottom two traces show the raw single unit recording from the GG and EGG response before, during, after chemical stimulation (0. 1 M NaCl) of the tongue. The middle two traces show that the raw record can be separated into two single-cell-digitized responses. The top two traces are a high-resolution capture of 2-s of unit responses highlighted by the rectangle in the lower traces. The diagram on the right shows the accuracy by which our waveform analysis software separates spikes into two distinct clusters.
Statistical Methods
All data analyses were carried out using self-written routines in MATLAB (The Mathworks). Spike2 software (CED) was used in data collection. Stimulus trials were divided into three regions: a 2-s pre-stimulus period, a 2.5-s stimulus application period, and a 2-s post-stimulus period. This allowed us to examine the changes in spike rate and spike timing both during and after stimulus application.
Estimation of Response Latency of Excitation
Let (X1,X2,…,Xn)t represent the binned spike counts at time t for n measurements. For example, n could be the total number of applications of all the stimuli. Let S be a set of stimuli that is to be considered, with P(S) the probability of presenting S. The Shannon entropy (Shannon, 1948) is then defined as
This value reflects the amount of information (in bits) that each stimulus presentation provides.
The mutual information (Cover and Thomas, 1991) is then just a function of the stimulus entropy H(S), the firing rate entropy H(R), and the joint entropy H(S,R), using the formula above:
I(S,R) = H(S) + H(R) − H(S,R)
The formula can then be rewritten as:
where the subscript t indicates that we are calculating the mutual information at time t using binned spike count data. Just like the Shannon entropy, the mutual information is measured in bits (when in log base 2) and is a measure of the reduction in the uncertainty of the stimulus when the response is given. Each bit corresponds to a decrease in the uncertainty by a factor of two (Quiroga and Panzeri, 2009).
To determine the excitatory response latency, we calculated the difference in mutual information between each chemical stimulus and control stimulation with AS using a 100-ms time bin with a 25-ms sliding window. This enabled us to examine the change in the mutual information across time. We used a bootstrapping procedure to construct confidence intervals for the mutual information and define latency as the first instance when mutual information exceeded the confidence interval after stimulation.
We determined the time periods when the information conveyed by spiking neurons was significant during repeated trials of seven stimuli. We used a bias correction procedure using the information breakdown toolbox (see Magri et al., 2009 for further details). Based on this procedure, we estimated the excitatory response latency by determining when the mutual information first became significant after stimulus onset.
Analysis of Temporal Pattern and Spike Rate
To understand the relative contribution of spike rate and temporal pattern to coding, we used van Rossum’s (2001) spike distance metric to evaluate each neuron’s spike discharge pattern. The metric quantifies the distance between every possible pair of spike trains in the data set for each neuron.
To measure distance, the metric uses an exponential kernel function to transform each spike train consisting of a series of discrete time points into a continuous function. This transformation essentially adds a tail to each spike with a time course thought to mimic a postsynaptic potential (van Rossum, 2001; Paiva et al., 2010). If two spike trains are similar, then the metric distance or area will be small indicating a high degree of similarity. If two spike trains differ, then the metric distance or area will be large indicating a low degree of similarity.
A key temporal parameter, τ, of the van Rossum metric determines the decay time or width of the tail. As others have done (e.g., Narayan et al., 2006; Wohlgemuth and Ronacher, 2007), we varied τ to determine the degree to which temporal resolution contributes to spike train distance or similarity. For small τ values (e.g., <100 ms), the spike tail decays quickly. For two spike trains to be coincident and similar, then spike timing must be critical for low metric distance. For larger τ values, the rate of decay is much slower (the “tails” are much longer) increasing the likelihood of coincident spikes. It is therefore the difference in spike rate, not spike timing that contributes to metric distance. To compute the metric distance, spike trains, defined as a list of discrete time points, are first convolved, or transformed, using an exponential kernel function:
Where I(t ≥ 0) indicates that the variable t must be non-negative. Now, given two spike trains t1 and t2 (with their transformed spike trains f1 and f2, respectively), the van Rossum metric calculates a (Euclidean) distance between them using an L2-metric:
An example of the van Rossum metric is shown in Figure 2. Here, we see that both spike trains have a common spike, occurring at the 1-s mark. Evaluating the squared difference of the transformed spike trains cancels out the effect of this common spike. Similarly, both spike trains have unique spikes (for example, at 1.8 and 1.5 s for spike trains 1 and 2, respectively), which do not overlap. Therefore, the squared difference between these two spikes increases the overall distance between the two spike trains. The integral of the squared difference provides a measure of similarity between spike trains.
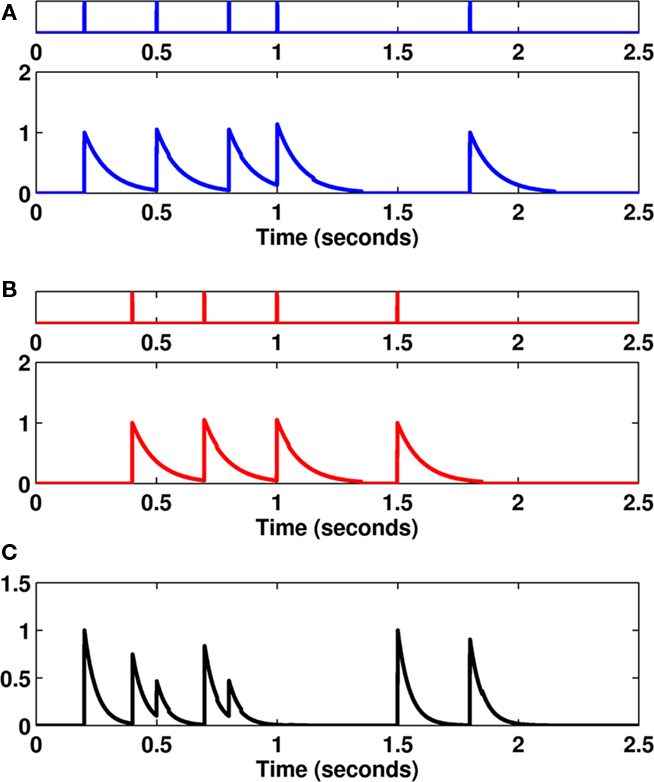
Figure 2. (A–B) An example of two spike trains (colored blue and red) along with the transformed spike trains f1 and f2 using an exponential kernel function with parameter τ = 100 ms. (C) An example of the squared difference in the transformed spike trains. Evaluating the area under this curve gives us the van Rossum distance between the two spike trains.
Recently, Paiva et al. (2010) showed that the van Rossum distance can be calculated as
where Ni and Nj are the total number of spikes for spike trains Si and Sj, respectively,  is the mth spike for spike train Si, and
  is the Laplacian kernel. This estimator has advantages over previous methods of calculating the van Rossum metric in that it can be implemented easily and efficiently, making it a valuable tool for spike train analysis. By varying the time constant τ in the analysis, one can determine whether the neuron acts more in spike timing (small τ values) or spike rate modes (large τ values) of information processing. Values of τ between these two extremes suggest a combination of modes, where the neuron uses both spike timing and spike rate for coding taste quality information. A recent study by Narayan et al. (2006) reported that neurons in the zebra finch brain functioned optimally with a τ value of 12 ms, indicating that the zebra finch brain relies mostly on spike timing for coding differences in bird song.
Once distances were computed, a cluster algorithm was performed to examine the classification performance (also the discrimination performance) of the stimuli based on the neural data (Victor and Purpura, 1996). Ideally, metric distance should be small between pairs of spike trains to the same stimulus and larger between pairs of spike trains to different stimuli. To assess clustering the algorithm randomly selected a spike train from the response collection and compared it to all other spike trains using the van Rossum metric. The selected spike train was then classified as a member of the stimulus category that had the smallest average distance. This reiterative procedure for all spike trains resulted in a classification matrix, also called the confusion matrix (Victor and Purpura, 1996). The diagonal elements of this matrix reflect correctly classified spike trains, while elements off the diagonal reflect misclassified responses. Based on this classification matrix, we calculated the transmitted information h (Victor and Purpura, 1996). If the clustering was perfect, then the maximum value of the transmitted information is ln(C), where C is the total number of clusters (stimuli). The minimum of the transmitted information is 0, which happens when the clustering is random.
We define the optimal parameter value τ as the value that maximizes the transmitted information. To find this, we performed a grid search, evaluating h at each value of τ along a large partitioned interval. We then found the τ value that maximized h. A bootstrapping procedure was used to determine significance in the parameter τ. We constructed surrogate datasets where we randomly assigned the cluster (stimulus) labels for each spike train, and recalculated the information h. This “shuffling” procedure is repeated several times (in this case, 199), and a bootstrap confidence interval is obtained. Information values outside of a 95% bootstrap confidence interval constituted a significant amount of transmitted information. Therefore, the optimal parameter τ, called τopt, quantifies the temporal precision used for temporal coding.
We performed an analysis called “exchanged-resampling” (Di Lorenzo et al., 2009) as additional means to assess the contribution of spike timing. For this, we constructed surrogate datasets where spikes are randomly shuffled within trials to the same stimulus. This shuffling destroys any temporal firing pattern that may have existed while keeping both the spike count and the post-stimulus time histogram the same as the original data. If the observed transmitted information hmax is outside the confidence interval of hexchanged (calculated using a bootstrap procedure with 199 replications), then we conclude that there is information contained in the temporal pattern of the response that cannot be captured by the overall spike rate.
Geometry of the response space
Given the optimal parameter τopt, we used multidimensional scaling (MDS) to visualize the geometry of the response space. MDS maps the elements in a given similarity (or dissimilarity) matrix into a vector space, such that the distances between elements in the similarity (dissimilarity) matrix and the (Euclidean) distances between the elements in the vector space are approximately equal. The average response across repeated trials determined the centroid location for each chemical stimulus and AS in the vector space. Tests of the goodness of fit (from the similarity/dissimilarity matrix into an Euclidean space) were performed in MATLAB using Kruskal’s SStress criterion. Kruskal’s SStress criterion takes values between 0 and 1, where values closer to 0 indicate a better projection into the Euclidean space. The axes of the MDS-generated map do not necessarily correspond directly to physiological interpretation; however, Di Lorenzo et al. (2009) noted that the first axis was generally correlated with firing rate. In our data, the first two dimensions from the MDS analysis reduced the stress to less than 0.1.
Results
Analysis of Temporal Patterns in Individual Cells
We recorded responses from 28 geniculate ganglion neurons and separated them into five physiological groups based on their response frequency profiles established in our prior studies (Lundy and Contreras, 1999; Breza et al., 2010). Nine NaCl-specialist neurons were distinguished by their high spike rate responses to NaCl and lack of responses to KCl, citric acid, quinine HCl, and sucrose. MSG is an effective stimulus for NaCl-specialist neurons and vice versa, NaCl is an effective stimulus for MSG-specialist neurons. Based upon our unpublished observations, NaCl-specialist neurons have a lower concentration threshold for NaCl than MSG, while MSG-specialist neurons have a lower concentration threshold for MSG than NaCl. Since we used only one concentration of each stimulus, a neuron was classified a NaCl-specialist if it had a slightly higher spike rate and shorter latency response to NaCl than to MSG, and vice versa for a MSG-specialist. Two sucrose-specialist neurons were distinguished by their relatively high spike rate and short latency responses to sucrose and MSG, and lack of responses to KCl, citric acid and quinine, and weak responses to NaCl. Sucrose-specialist neurons had a higher spike rate and shorter latency response to sucrose than to MSG. Nine acid-generalist neurons were distinguished by their best response to citric acid with long latency and secondary responses to KCl, NaCl, quinine HCl, MSG with typically shorter latency (Breza et al., 2010). Six electrolye-generalist neurons responded similarly to the same set of stimuli as acid-generalists, except E-generalists were relatively unresponsive to citric acid.
One goal of this research was to study how neurons discriminate between taste stimuli based on their spiking discharge patterns. Neural spike trains have inherent variability that must be accounted for in the analysis. Ideally, comparisons of spike trains within the same stimulus should be more similar than comparisons between spike trains across stimuli. To perform this comparison, we used the van Rossum metric (see Materials and methods) to characterize the spiking patterns of the different neuron groups, and to determine whether neurons code information best using spike timing, spike rate, or a combination of the two.
Our analysis consisted of 13 specialist neurons (nine NaCl, two sucrose, two MSG), six electrolyte-generalist neurons and nine acid-generalist neurons. We estimated the timescale parameter τopt for each neuron using our bootstrap-reshuffling procedure, and calculated the information based on the confusion matrix of Victor and Purpura (1996). Trials consisted of a 2-s pre-stimulus AS rinse, a 2.5-s stimulus presentation and a 2-s post-stimulus period. The stimulus presented was chosen at random from the set of seven stimuli (Sucr, NaCl, CA, QHCl, MSG, KCl, AS). The number of replications for each stimulus was between 8 and 10. We determined that 10 trials were sufficient for capturing the neural variability using a leave-one-out cross validation approach on data where one trial from each stimulus was randomly removed from the dataset. We constructed confidence intervals for hmax with the reduced data using a bootstrap procedure. The difference of hmax using the full data and the median of 99 bootstrap datasets with one trial randomly removed from each stimulus was not much different from each other (∼5%). Also, hmax with the full data was within a 95% confidence interval of the reduced data for nearly all cells in the study. This trend was also observed when two trials were randomly removed (where there are only eight trials per stimulus).
Analysis of Neural Responses during Stimulus Duration
We analyzed spike train recording during the stimulus duration period (2–4.5 s), computed response latencies and compared the transmitted information and τ values across neuron groups. An example of our latency analysis using the mutual information for one MSG-specialist cell is shown in Figure 3.
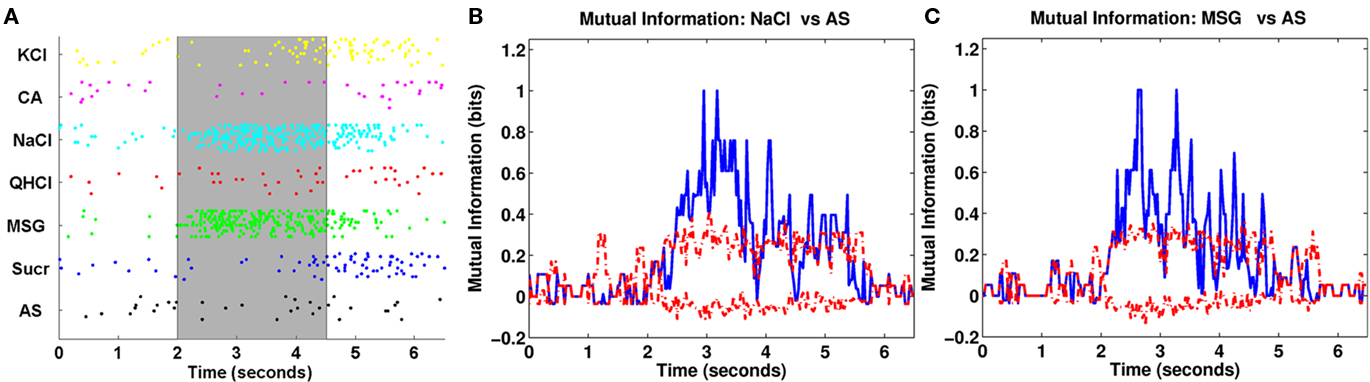
Figure 3. (A) Raster plot of one narrowly tuned neuron. Black vertical lines at the 2- and 4.5-s marks bracket the stimulus duration period. The shaded gray area denotes the analysis period for the van Rossum metric. The cell responded strongly to NaCl and MSG and little or nothing at all to the other stimuli. (B) Change in mutual information over time for NaCl relative to control stimulation with AS. The solid blue line represents the mutual information, while the dashed red lines indicate 95% confidence intervals constructed using the bootstrap procedure. In response to NaCl, mutual information became statistically significant 500 ms after stimulus onset and remained significant during the stimulus duration period. (C) Same as (B) except using MSG compared to AS. We see that the mutual information was significant 225 ms after stimulus onset.
This neuron responded strongly to NaCl and MSG immediately after stimulus onset and maintained its high level activity throughout stimulation. Visually, the response latency appeared to be between 200 and 300 ms for MSG and about 400–500 ms for NaCl. The results from the mutual information analysis show that the latencies are estimated to be 500 ms for NaCl and 225 ms for MSG, respectively, and are consistent with estimates obtained visually. The mutual information remained significant for a large portion of the stimulus duration period, then decreased during the post-stimulation period.
Some of our metric analysis results for the same cell are shown in Figure 4. The left plot shows the results of the van Rossum metric analysis. The metric analysis showed that the transmitted information h was significant across many τ values, suggesting that reliable information could be conveyed almost equally well under spike timing and spike rate modes of coding. However, the optimal τ value occurred at 650 ms accounting for 1.2256 bits (out of a maximum of log2(7) = 2.8074 bits) of information, which indicates that this neuron used a combination of spike timing and spike rate for coding. When using mainly spike rate information (τ = 2.5 s, the length of the analysis window), the neuron can account for 1.0167 bits of information, which is only about 19% lower than when using a mixture of spike timing and spike rate. We also observed that the transmitted information (solid blue line) lies outside of the confidence interval for exchanged-resampled datasets (dashed red lines) at the optimal value of τ (650 ms), suggesting that the fine temporal structure of the neural response contributes to coding of taste quality. The middle plot shows the clustering matrix for this neuron. We see that many NaCl trials were classified as either NaCl or MSG, while MSG trials have a high probability of being correctly classified as MSG. In fact, there were no MSG trials classified as NaCl. One possible explanation for this is that MSG responses for this cell have a unique temporal pattern which distinguishes itself from NaCl (as shown in our exchanged-resampling analysis being significant, see Figure 4). Overall, approximately 53% of the trials were classified correctly, which indicates reliable clustering when compared to a chance classification (1/7 = 14.2%).
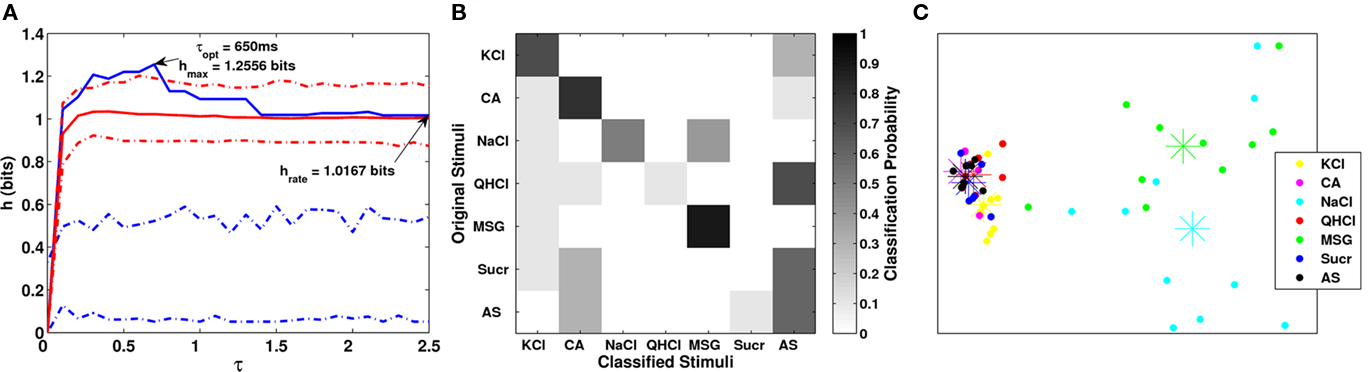
Figure 4. (A) A plot of the transmitted information across a majority of τ values for the analysis period shown in Figure 3A. The solid blue line is the transmitted information, while the dashed blue lines represent a 95% confidence interval. The solid red line denotes the median of 199 replications of our exchanged-resampling analysis, constructed by randomly exchanging spikes within trials of the same stimulus, so that the spike count and the PSTHs remain the same as the original data. The dashed red lines represent a 95% confidence interval for the exchanged-resampling data. We see that the maximum transmitted information (blue solid line) lies outside of the confidence interval of our exchanged-resampled data (red dashed line) at τ = 650 ms. (B) Clustering matrix of neural responses for the same cell. The (I, J) entries in this matrix correspond to a probability of classifying stimulus I (the rows of the matrix) to stimulus J (the columns of the matrix). (C) MDS results, with dots representing stimulus trials and star symbols representing the centroid response for each stimulus. NaCl and MSG were distinguished from each other as well as from the other four stimuli and AS, which were grouped together.
We performed MDS analyses to determine whether the temporal features of neural responses can be used to distinguish between taste stimuli (see Materials and Methods for more details). For our analysis, we chose a two-dimensional space for representing spike trains. This is because the differences in the stress across cell types was significant at the first dimension (Kruskal–Wallis test, p-value < 0.01), but was not significant at the second dimension (Kruskal–Wallis test, p-value > 0.1).
Multidimensional scaling analyses with τ at 650 ms showed NaCl and MSG responses to be broadly distributed in two-dimensional space (Kruskal SStress = 0.0087). Collectively they were also clearly separated from the responses to the other stimuli and AS, which were tightly grouped. The fact that NaCl and MSG responses were broadly distributed in two-dimensional space and also had a correspondingly high spike rate is consistent with a prior observation that spike rate is related to at least one dimension of this multidimensional space (Di Lorenzo et al., 2009).
An example of our latency analysis for one Acid-generalist cell is shown Figure 5. The neuron responded best to citric acid, next best to NaCl and MSG, and weakly to KCl and QHCl. The spike pattern to sucrose was not different from that to AS.
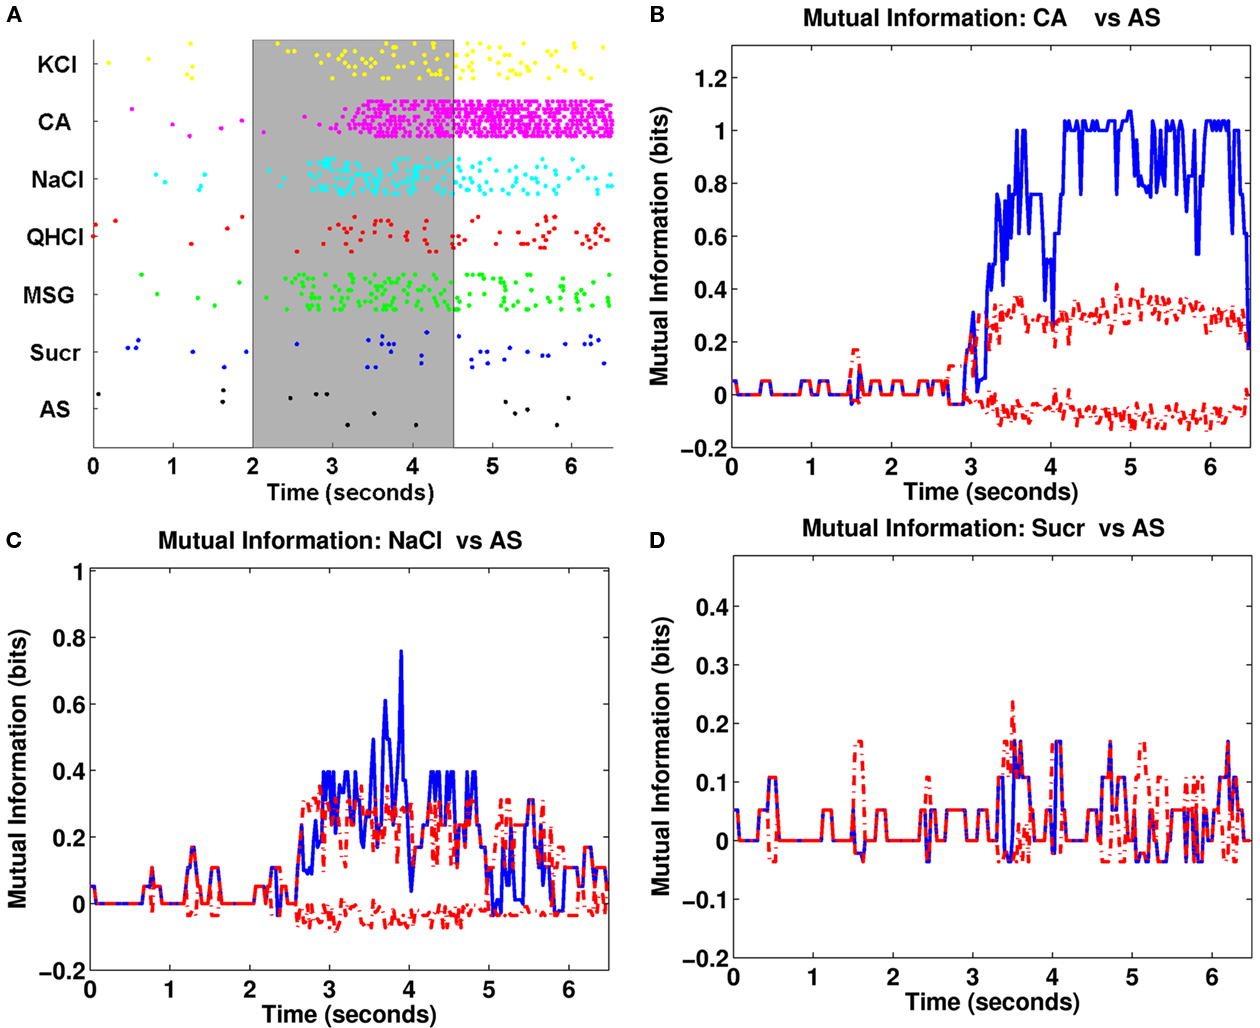
Figure 5. (A) Raster plot for one broadly tuned neuron. The shaded gray area denotes the analysis period for the van Rossum metric. There is a robust response to citric acid occurring about 1 s after stimulus onset. There were also responses to KCl, NaCl, and MSG occurring within 600–1000 ms after stimulus onset. (B–D) Analyses done as in Figure 3 for CA (B), NaCl (C), and sucrose (D). Based on mutual information, the neuron responded significantly to CA and NaCl, but not to sucrose. The response to CA was robust and sustained even through the post-stimulus period, while the responses to NaCl and MSG were weaker and more variable mostly confined to the stimulation period.
The estimated response latency for citric acid was 1050 ms and the mutual information was highly significant for the remainder of stimulation and throughout the post-stimulus period. The NaCl and MSG response latencies were 950 and 525 ms, respectively (mutual information analysis of MSG responses were similar to NaCl responses, and are not shown to save space). In contrast, this neuron was unresponsive to sucrose throughout the trial as confirmed by the mutual information plot below.
Using van Rossum metric analysis, we found that the maximum information occurred at τ = 1700 ms, with the calculated transmitted information h = 1.7037 bits (out of a maximum of h = 2.8074 bits, Figure 6). In fact, the information calculated using a predominantly spike rate metric was nearly identical (τ = 2.5 s, h = 1.6946 bits), suggesting that temporal pattern played little or no role in the discrimination of taste stimuli. We observed that the transmitted information was not outside of a 95% confidence interval for the exchanged-resampled data (red dashed lines). This suggests that the temporal pattern of spikes does not contribute to the classification of taste stimuli, and that the overall firing rate is the principle mode of coding. Overall, the metric clustered responses fairly well, achieving about 62% correct classification. As depicted in the clustering matrix sucrose was confused with AS due to their similar responses. Responses to similar taste qualities (MSG and NaCl) were often misclassified with each other, but not classified to responses of dissimilar taste qualities. Using MDS analyses, we see that responses to CA, NaCl, and MSG can be clearly separated from the remaining stimuli. Similar to results shown earlier, clusters that have large variability tend to also have higher firing rates (Di Lorenzo et al., 2009). The two-dimensional plot was a good fit for the MDS analysis (Kruskal SSstress = 0.0067).
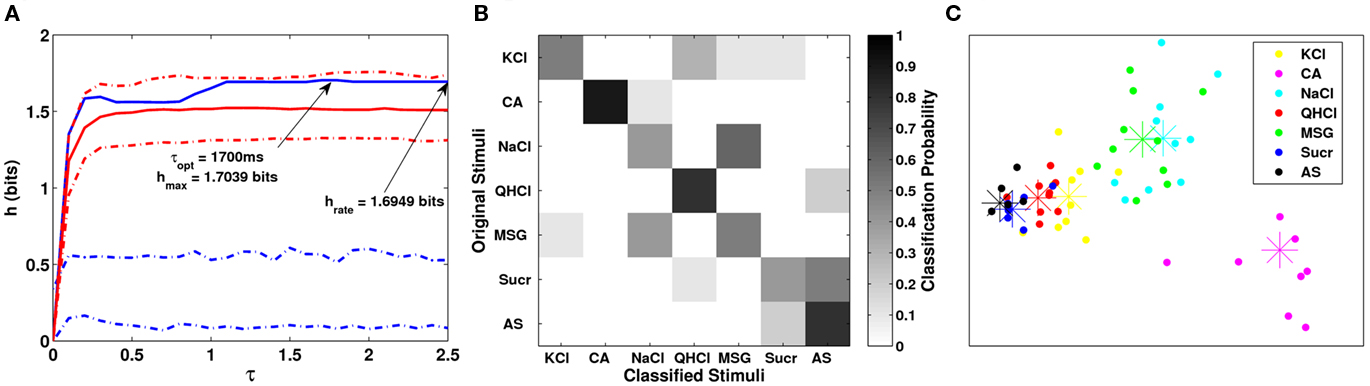
Figure 6. (A) Plot of the transmitted information for several values of τ for the analysis period shown in Figure 5A. (B) Clustering matrix of neural responses for this cell. (C) Plot of MDS results for the same cell. Here we see that the neural responses to CA were clearly distinguished from the other stimuli. Responses to MSG and NaCl were distinguished from the other stimuli, but not from each other.
In many cases, we observed that the maximum value of h calculated at the optimal value of τ was not much different than the information obtained purely from a spike rate metric. To determine whether spike timing played a critical role in taste discrimination, we compared the difference in the maximum value of h (called hmax) and the information obtained from spike rate (called hrate) by plotting the difference hmax − hrate vs. hrate. The results can be found in Figure 7. Points located on the horizontal axis tell us that the neuron was purely a spike rate neuron. Points above the horizontal axis give us the increase in the information when including temporal information. We see that nearly all the neurons in the study were more spike rate neurons than spike timing neurons. We also divided the 2.5-s stimulus period into two equal 1.25-s periods to determine whether there were differences in neural coding between the first half and the second half of stimulation. We observed similar results for both half periods (results not shown).
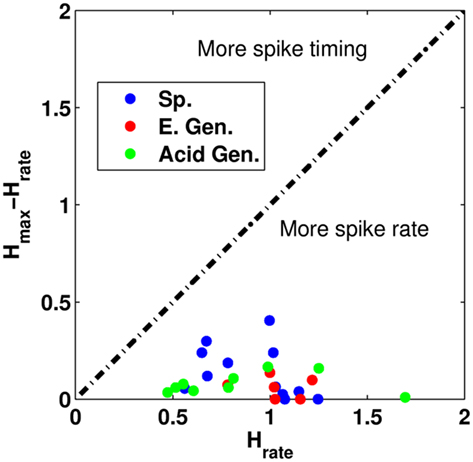
Figure 7. A comparison of the difference in the information hrate to the difference of hmax, and hrate. The dashed black line indicates that the temporal pattern conveys equal information when compared to the information from spike rate. Sp. Denotes specialist neurons, E. Gen. denotes electrolyte-generalists, and Acid Gen. denotes Acid-generalist cells. Here, we see that all the neurons in the study are more rate-based coders than timing-based coders.
Based on our exchanged-resampling analysis, only 2 of 28 cells showed that spike timing contributed significant information during the stimulation period (one NaCl-specialist cell shown in Figure 4, and one MSG-specialist cell not shown), for an overall percentage of less than 10%. These results differ from those reported by Di Lorenzo et al. (2009). In that study, using a similar number of cells (28 cells in our study vs. 35 cells in their study), they reported that about one-third of their neurons from the NST had significant timing pattern contributions to taste coding. While the two cells that were significant in our study were specialist neurons, Di Lorenzo et al. (2009) noted that their cells that were significant contained both specialist and generalist neuron types.
Table 1 summarizes the latency estimates using the mutual information. These results are mostly consistent with our previous study (Breza et al., 2010). For example, the latency results for NaCl-specialist neurons are 412 and 315 ms for the current study and the previous study, respectively. This indicates that response latencies can be reliably estimated using mutual information techniques, thus avoiding the need to estimate latencies visually. An advantage of the mutual information approach is that we can adjust the confidence interval width (from say 95 to 90%) for the purpose of exploratory analysis. It is possible that a neural response may be significant at 90% confidence, but not at 95% confidence. However, reducing the confidence level may introduce false positives.
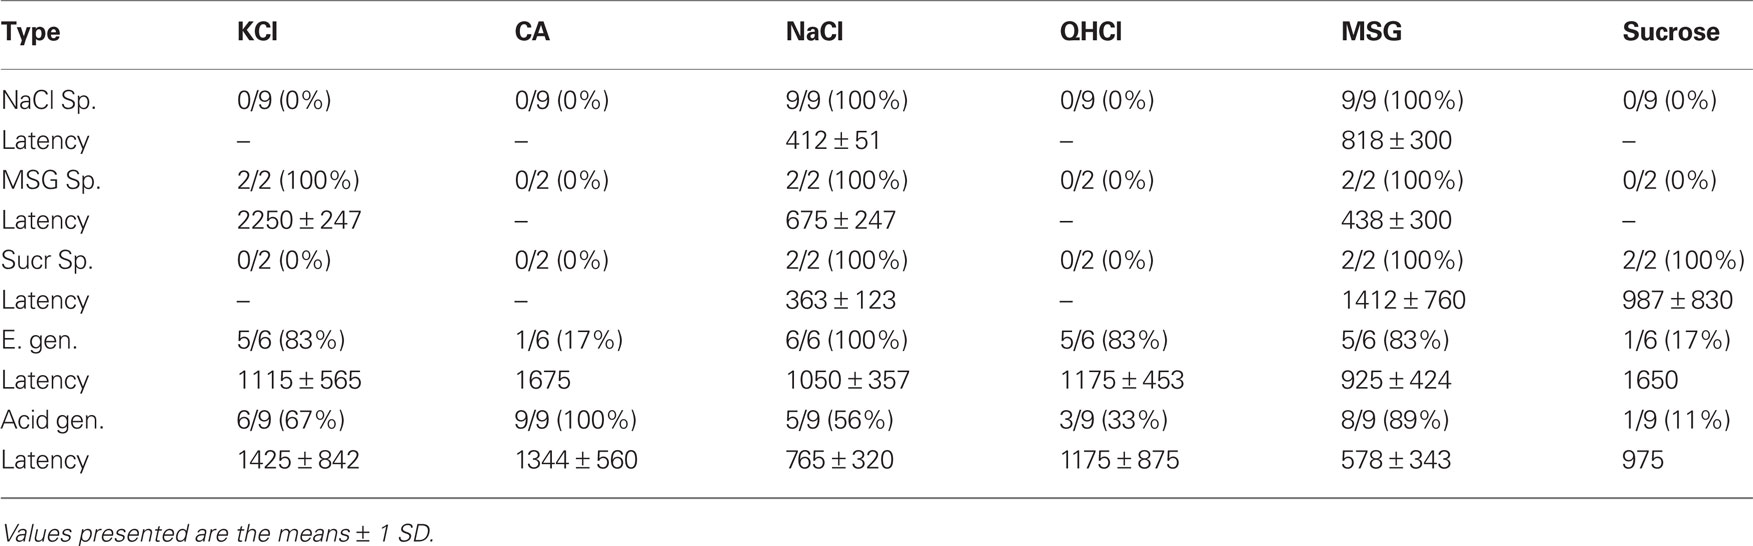
Table 1. Estimated response latencies (in milliseconds) to multiple stimuli for all cells in the study.
A non-parametric ANOVA (Kruskal–Wallis) comparing the information values across neurons groups was not statistically significant (p-value = 0.39), indicating that they were similarly effective in coding information on taste quality. The median transmitted information levels for the three groups of neurons (specialists, electrolyte-generalists and acid-generalists) were about 1.1, 1.2, and.83 bits, respectively. Comparisons of τ values across neuron groups was also not significant (Kruskal–Wallis test, p-value > 0.3), suggesting that they use a similar temporal strategy for coding information on taste quality. The median τ values for the three groups of neurons were about 1, 1, and 0.75, respectively. We found that almost all neurons conveyed statistically significant amounts of transmitted information during the stimulus duration period (13/13 for specialists, 6/6 for electrolyte-generalists, and 8/9 acid-generalists).
Post-Stimulus Analysis
We determined whether significant information was conveyed during the post-stimulus period. An example of the MDS and metric-space analyses for one NaCl-specialist cell are shown in Figure 8.
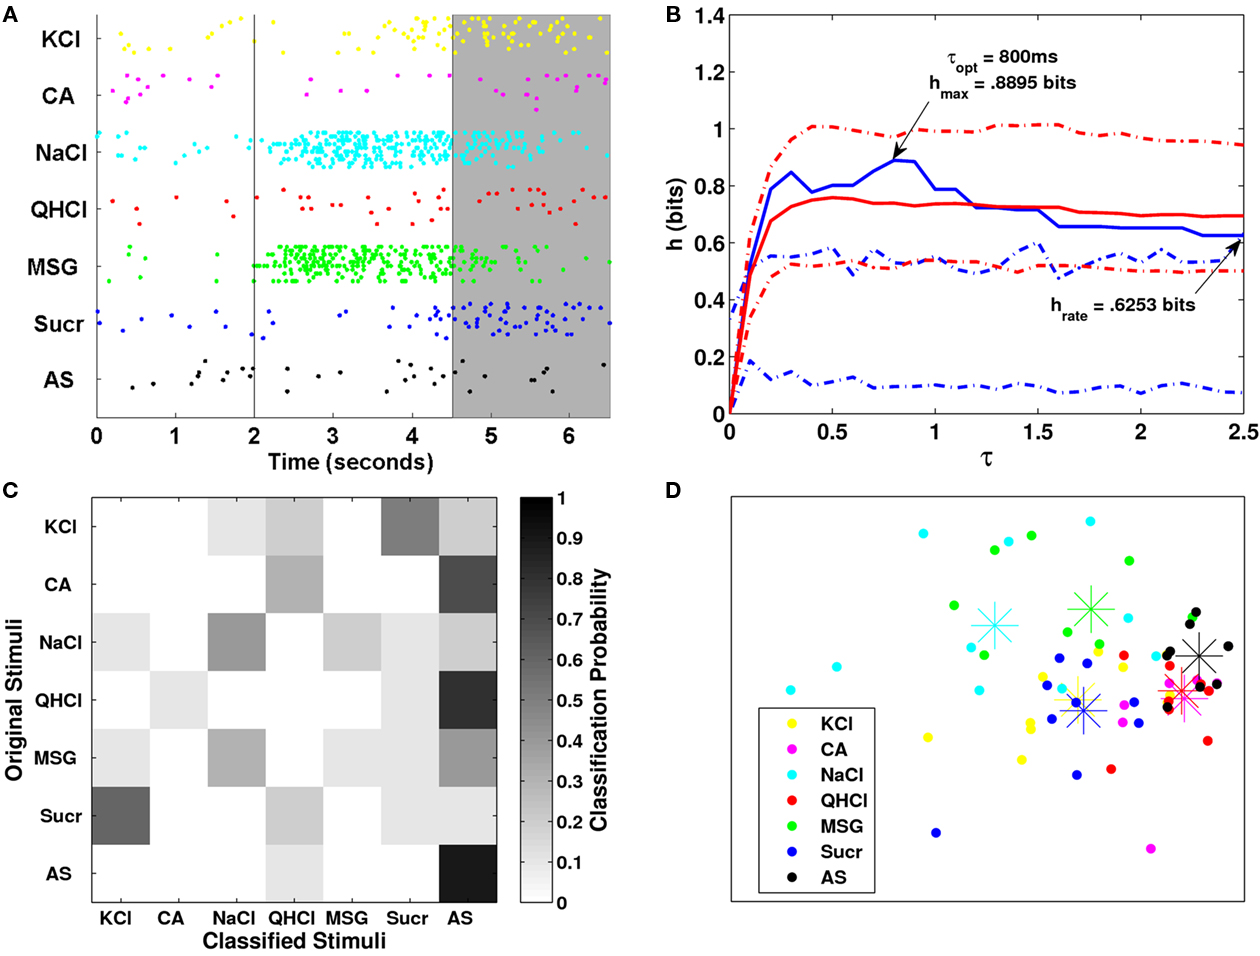
Figure 8. (A) Raster plot for one NaCl-specialist cell. The shaded gray area denotes the analysis period. (B) Plot of the transmitted information over several values of τ for the shaded period shown in (A). (C) Clustering matrix of neural responses for this cell. (D) MDS analysis plot.
The raster plot shows that the neuron increased its firing rate to NaCl and MSG during stimulation and this increase continued for the initial 1-2 s of the post-stimulus period. The firing pattern was similar for KCl but to a much more moderate extent compared to NaCl and MSG. The majority of neural responses from AS were correctly classified as AS. The neuron was unresponsive to citric acid, quinine, and sucrose during stimulation; in contrast, the neuron had a higher firing rate in the post-stimulus period for sucrose stimulus trials. Consistent with these response patterns to NaCl, MSG, KCl, and sucrose during the post-stimulus period, the metric analyses showed that the transmitted information during the post-stimulus period was significant across all τ values except those below about 100 ms. However, less information (h = 0.8895 bits) was conveyed and at slower time scale (τ = 800 ms) during the post-stimulus period compared to that during stimulation (h = 1.2556; τ = 650 ms). In essence, the neuron conveyed information during and after stimulation, and that the neuron interprets taste stimuli in a combination of spike timing and spike rate modes. The space map from MDS analyses provides added support for these findings (Figure 8), which shows that the NaCl and MSG trials were somewhat less distinct from control trials with AS, while the sucrose and KCl trials were somewhat more distinct from control trials. We also observed that the transmitted information was not outside of a 95% confidence interval for the exchanged-resampled data, suggesting that spike timing did not contribute to taste coding.
Results of the MDS and metric analyses for one acid-generalist cell are shown in Figure 9. The raster plot shows that the neuron continued its vigorous firing rate to citric acid throughout the post-stimulus period. Similarly, the neuron also continued to respond to KCl, NaCl, and MSG during the post-stimulus period, but at slower rates. These significant responses relative to control AS underlie the metric analysis showing that the information during the post-stimulus period was significant for all τ values (h = 1.3992 bits, τ = 500 ms). This cell also seems to be a pure rate-based cell, as the transmitted information was not outside of the confidence intervals of the exchanged-resampled data. The space map from MDS analysis shows that this neuron continues to see citric acid as a distinct stimulus completely separated from the other stimuli and AS.
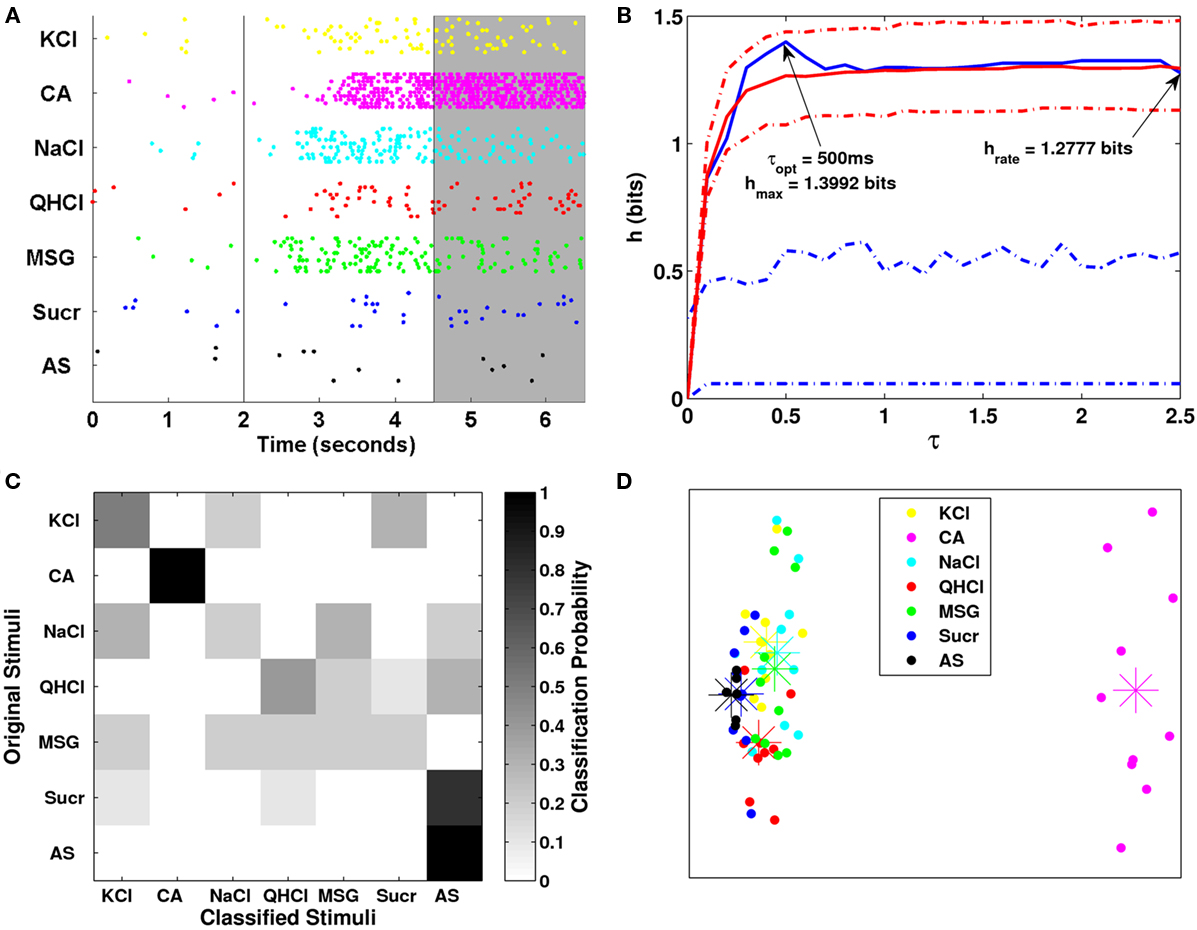
Figure 9. (A) Raster plot for one Acid-generalist cell. The shaded gray area denotes the analysis period. (B) Plot of the transmitted information over several values of τ for the shaded period shown in (A). (C) Clustering matrix of neural responses for this cell. (D) MDS analysis plot.
We observed that the difference in information between hmax and hrate vs. hrate was not too different from each other during the post-stimulus period (Figure 10). This is similar to the stimulus period, where we found that the majority of neurons act more in a rate-coding mode rather than a temporal-coding mode. This indicates that neurons continue to act in a rate-coding mode even after the stimulus period ends.
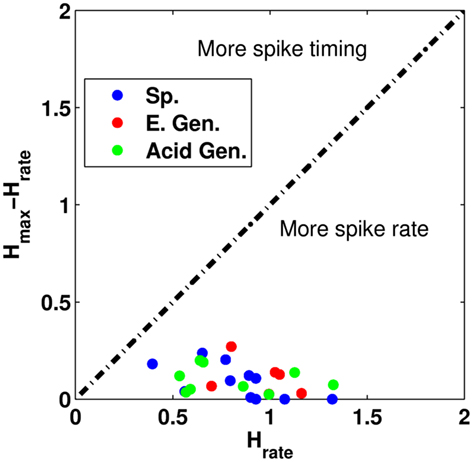
Figure 10. A comparison of the difference in the information hrate to the difference of hmax′ and hrate for neural responses in the last 2 s of the trial. The dashed black line indicates that the temporal pattern conveys equal information when compared to the information from spike rate. Sp. Denotes specialist neurons, E. Gen. denotes electrolyte-generalists, and Acid Gen. denotes Acid-generalist cells. Here, we see all the neurons in the study are more rate-based coders than timing-based coders.
The majority of cells had significant levels of information at the optimal τ value during the post-stimulus period (10/13 specialist neurons, 6/6 electrolyte-generalists, and 9/9 acid-generalists) for an overall percentage of about 90% (25/28). Of these cells, a majority had significant transmitted information values when using spike rate alone [10/10 specialist neurons, 6/6 electrolyte-generalists, and 7/9 acid-generalists, 92% (23/25)]. We observed a similar rate of cells which had significant spike pattern contributions in the post-stimulus period (2/28 for the stimulus period vs. 1/28 for the post-stimulus period). The one cell in the post-stimulus period was not one of the two cells that were significant in the stimulus period. This tells us that the principle mode of coding does not change during the trial period. A non-parametric ANOVA comparing the information values between neural groups (specialist, electrolyte-generalist, and acid-generalist) was not significant (Kruskal–Wallis, p-value = >0.3) indicating that they were similarly effective in coding information about taste quality during the post-stimulus period. The median information values for these neuron groups were about 0.95, 1.1, and 0.85 bits, respectively. The average τ values were not statistically significant (p-value = 0.75) indicating that the three neuron groups process information with a similar timescale. The median τ values for the three groups were about 750 ms.
Comparison with Other Spike Train Metrics
We used the van Rossum metric to characterize temporal patterns because of its simplicity and ease of use. Paiva et al. (2010) derived a computationally efficient estimator of the van Rossum metric, making it a simple tool for spike train analysis. The Victor and Purpura (1996) metric is another popular metric used in taste research (Di Lorenzo et al., 2009). The Victor–Purpura metric transforms a single spike train to another given a sequence of “steps,” where at each step, one of three operations can be used. Spikes can either be removed or added, incurring a cost of 1, while an existing spike can be shifted in time with a cost of q|t1 – t2|, where t1 – t2 is the length of the shift. The parameter q controls how costly it is to shift existing spikes. The distance between two spike trains is the sum of all the steps. Note that if q = 0, then it costs nothing to shift existing spikes; therefore, the metric evaluates the difference in the total number of spikes. If q is large, then it is cheaper to add and delete a spike then it is to shift an existing spike. Therefore, the metric evaluates the number of non-coincident spikes. We asked whether the choice of metric would influence the overall results of our analysis.
Some of our results are shown in Figure 11. For the NaCl-specialist cell, we see that the maximum transmitted information hmax for the van Rossum metric is 1.2556 bits, with the transmitted information from spike rate hrate is 1.0167 bits. The results obtained from the Victor–Purpura metric was not too much different (hmax = 1.2547 bits, with hcount = 0.9215 bits). For the acid-generalist cell, hmax = 1.1544 bits and hrate = 0.9855 bits for the van Rossum metric, while hmax = 1.1177 bits and hcount = 0.9215 bits from the Victor–Purpura metric.
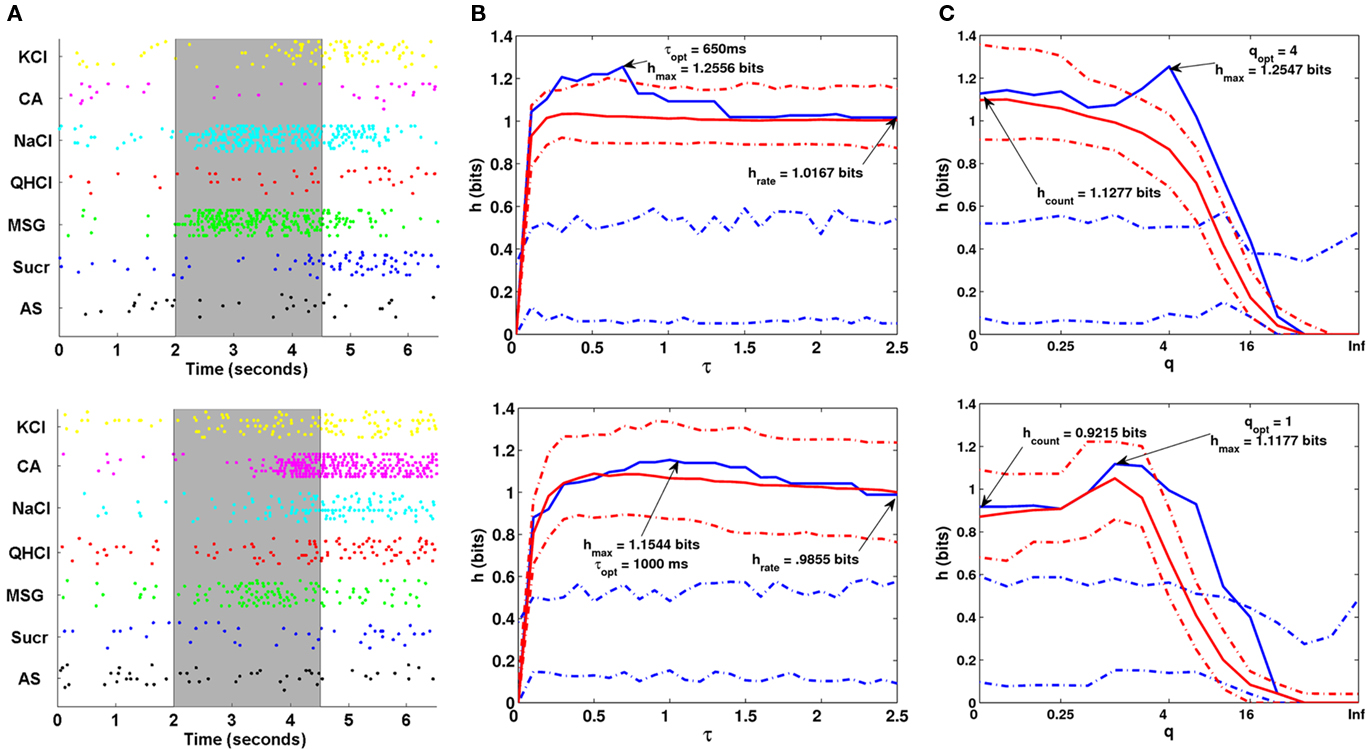
Figure 11. (A) A rasterplot of one NaCl-specialist cell (top) and one Acid-generalist cell (bottom) in the study. (B–C) Metric Analysis results using the van Rossum metric (B) and the Victor–Purpura metric (C) for the corresponding cell in (A).
To compare the performance of the two metrics, we performed a paired t-test using all 28 neurons in the dataset comparing the values of hmax for the van Rossum metric and the Victor–Purpura metric. This test was not significant (p-value = 0.18), indicating that they have similar performance. Comparisons of hrate and hcount were also not significant using this procedure (p-value = 0.58). Using a non-parametric sign test revealed the same conclusion in both cases. Thus, the choice of metric does not have a significant impact on the overall results obtained.
Discussion
The present findings showed that while spike timing contributed a significant part of the message relayed by afferent neurons from rat fungiform taste buds to the brain, spike rate contributed the largest portion especially after response onset during stimulation. The EGG was a reliable reference event of stimulus onset from which we determined spike rate and spike timing responses to chemical stimulation. As shown in our prior study (Breza et al., 2010) and confirmed in this investigation, the importance of temporal information was most evident for first spikes as reflected by unique response latency profiles to the standard taste stimuli for different neural groups; spike timing seemed to be less important for coding during stimulation. Thus taken in entirety, spike rate and spike timing together are more effective than spike rate alone in coding stimulus quality information to a single basic taste in the periphery. This was equally apparent for narrowly tuned specialists that responded mostly to a single taste stimulus (NaCl, MSG, or sucrose) as it was for broadly tuned electrolyte- and acid-generalist neurons that responded to multiple chemical stimuli.
In our prior (Breza et al., 2010) and present investigations, we delivered chemical stimuli using a constant flow rate of 50 μl/s similar to the rate consumed by freely licking rats. It is important to note that our findings are consistent with the fact that response latency must depend upon the type and number of stimulus molecules and receptor proteins available at the receptive surface, not the volume of fluid passing over the tongue. In our previous paper (Breza et al., 2010), we showed that response latency was inversely related to stimulus concentration while flow rate remained constant. For example, the average response latency to 0.03–0.5 M NaCl by NaCl-specialist neurons varied systematically from a high of about 550 ms to a low of 150 ms while the flow rate (50 μl/s) remained constant. The response latency pattern for acid-generalist neurons was the same to 0.03–0.5 M NaCl, but the range differed from a high of about 900 ms to a low of 500 ms again while flow rate remained constant at 50 μl/s. Furthermore, benzamil, a pharmacological antagonist of the epithelial sodium channel, reduced the NaCl spike rates and increased the NaCl response latencies of NaCl-specialist neurons, but did not change the NaCl responses of acid-generalist neurons. NaCl-specialist neurons detect NaCl through an ENaC mechanism, whereas acid-generalist neurons utilize a different receptor mechanism for NaCl detection. Thus, response latency differences across neuron types arose because of differences in stimulus concentration and stimulus quality and not the volume of fluid passing over the tongue. The volume of fluid passing over the tongue does, however, have a small influence on the response latency. Based upon our unsystematic observations, doubling the flow rate from 50 to 100 μl/s shortened by a few milliseconds the response latency to all stimuli, but the overall response latency profile remained the same.
The present findings are consistent with earlier work from three perspectives. Firstly, there are a few early studies (e.g., Fishman, 1957; Mistretta, 1972; Ogawa et al., 1973, 1974; Nagai and Ueda, 1981) providing evidence that rat chorda tympani fibers distinguish chemical stimuli based on their temporal firing patterns to stimulation of the tongue. Unfortunately, these studies did not evaluate neural responses separately for different neural groups nor did they use computational methods to quantify the relative contribution of spike rate and spike timing to coding as was done here. Secondly, there is ample evidence from studies of the central gustatory system that spike count provides an ambiguous code for taste quality among broadly tuned neural generalists that respond nearly equally well to more than one taste quality; instead, they rely on spike timing to code differences in taste quality (Di Lorenzo et al., 2009). Unlike the brain, spike count is not an obvious ambiguous signal in the periphery. While broadly tuned neurons increase their discharge rate to chemical stimuli representing distinctly different taste qualities, they do so with different spike rates, responding at a significantly higher rate to their “best” stimulus of a single taste quality and consistently less to secondary stimuli (Frank et al., 2008). Thirdly, we recently discovered that single neurons from the geniculate ganglion distinguished chemical stimuli by differences in response latency (Breza et al., 2010). This led to the present work anticipating that evidence on one temporal measure of sensory discrimination at response onset was a harbinger of subsequent pronounced temporal coding during stimulation.
There are limitations of the present work focused on single-cell responses to highly controlled delivery of a single primary chemical stimulus for short duration. The most obvious limitation is that the animals were anesthetized during recording and consequently devoid of tongue movements associated with rhythmic licking that may affect neural responses. It is unlikely that anesthesia has a direct affect on neural responses from the geniculate ganglion, because Li et al. (2011) have recently shown that odor responses by olfactory bulb neurons were unaffected by anesthesia level. Rhythmic licking has been shown to synchronize spike activity across neurons in the brain especially after learning (Gutierrez et al., 2010). However, learning was not a factor in the present study. During normal feeding the taste receptors are more commonly stimulated not by a single-component constant stimulus but rather by a complex chemical mixture combined with coincident tactile and thermal cues all of which varies in intensity over time. The peripheral gustatory system has the capacity to process complex stimuli as afferent neurons innervating taste buds respond to many taste qualities across a broad range of concentrations, and also respond to tactile and thermal stimulation, as well (Kosar and Schwartz, 1990; Finger et al., 2005). Furthermore, we have shown that temperature modulates neural responses to chemical stimulation (Breza et al., 2006). We delivered solutions to the tongue adapted to 35°C AS (Hirata et al., 2005), at low flow rate equivalent to a rat’s normal rate of consumption and without confounding tactile and thermal artifacts. Under these limited conditions, the peripheral gustatory system seems to rely more on spike rate during stimulation than on spike timing for coding. For more complex stimulation involving, for example, mixtures of two or more basic taste stimuli (Di Lorenzo et al., 2009) or analyses of parallel processing across several neurons simultaneously (Katz et al., 2002), spike timing may play a more critical role in coding taste quality information in the peripheral gustatory system. These intriguing topics concerning complex stimulation and parallel processing in the periphery will be addressed in future studies.
Computational methods to analyze temporal response patterns
There are considerable advantages of using mutual information to characterize neural discharge patterns to chemical stimulation. Its obvious strength is that it is a probability statistic based on many response trials to repeated stimulus presentations reducing the likelihood of reporting dubious results based on single or few trials. Another significant advantage is that mutual information is not bound by the magnitude of the change in discharge rate, but by the consistency of the spike pattern to a given stimulus. With mutual information, both large and small deviations in spike rate and/or spiking timing provide significant information if they consistently co-occur with a given stimulus. Furthermore, we obtained confidence intervals using the bootstrap procedure for determination of significant information conveyed over time at the beginning (response latency) as well as during and after stimulation. We tethered our temporal measures to EGG onset that accurately marked the time when the stimulus solution first contacted the lingual epithelium allowing us to separate neural activity into pre-stimulus, stimulus, and post-stimulus periods.
In our prior study (Breza et al., 2010), we identified four separate groups of geniculate ganglion neurons based on their unique response latency profiles to the basic taste stimuli. We determined response latency by visual inspection as the first observable increase in response frequency after EGG onset. The results of the present study using mutual information are largely consistent with our prior findings, although the absolute values differ slightly. This is apparent for the two most common neural groups (NaCl-specialists and acid-generalists). For both studies, NaCl-specialists responded to NaCl with average 412 ms latency in the present study (see Table 1) and 315 ms latency in our earlier study and responded little if at all to other stimuli with much longer latency. In the present study, NaCl-specialists responded consistently to MSG at twice the response latency as to NaCl; MSG was not used in the previous study. For both studies, acid-generalists were the most broadly tuned of the neuron groups. Like our prior study (Breza et al., 2010), acid-generalists responded with the highest frequency to citric acid but typically with a longer latency than to the other stimuli. Acid-generalists responded to citric acid with average 1344 ms latency in the present study and 1828 ms latency in our prior study. In our prior study, citric acid elicited an initial weak inhibitory response followed by robust excitation in some acid-generalist neurons. In the present study, we were unable to detect this weak inhibitory response with mutual information most likely because of the low spontaneous rate to the rinse of AS. Mutual information revealed, however, continued responses after stimulation and off-responses for example to sucrose in Figure 8.
Rats can decide to accept a nutritious solution or reject a poisonous one very quickly, perhaps within 250–600 ms of licking a solution (Halpern and Tapper, 1971). The underlying sensory process for this quick decision must occur within this same time frame, not over an extended time domain. First spikes (response latency) may be the mechanism that underlies this process. In fact, there is precedent for evoking first spikes as a coding strategy in other sensory systems (VanRullen et al., 2005). Experimentally, we used EGG onset as a means to define stimulus onset. In practice, stimulus onset may be encoded by the animal’s intention to sample a solution, by an internal oscillatory signal from rhythmic licking (Gutierrez et al., 2010) or by stimulus contact with tactile receptors on the tongue. Regardless of the way it begins, timing is a critical biologically adaptive feature of the nervous system, including the neural underpinnings for taste-mediated behavior.
Due to its simplicity and ease of use, we choose the van Rossum metric to characterize the temporal features of neural responses. Paiva et al. (2010) derived a computationally efficient method for calculating the van Rossum metric and making it a valuable tool for spike train analysis used in other sensory systems (Narayan et al., 2006; Wohlgemuth and Ronacher, 2007; Neuhofer et al., 2008). The results obtained with this metric indicate that peripheral gustatory neurons rely mostly on spike rate to code taste quality information during and after stimulation. A complete re-analysis of our data with the Victor and Purpura (1996) metric used previously in taste research (e.g., Di Lorenzo et al., 2009) yielded similar results to that obtained with the van Rossum metric. Consequently, this makes it highly unlikely that the choice of metric influenced the overall pattern of results during and after stimulation. Spike timing is more critical for first spikes as reflected by response latency differences to stimulus concentration (Breza et al., 2010) as well as to the standard stimuli among different neural groups.
Conflict of Interest Statement
The authors declare that the research was conducted in the absence of any commercial or financial relationships that could be construed as a potential conflict of interest.
Acknowledgments
We thank Paul Hendrick for excellent technical work. Portions of this research were presented at the Association for Chemoreception Sciences meeting in St. Petersburg, FL, USA in 2010, and the Society for Neuroscience meeting in San Diego, CA, USA in 2010. The National Institute on Deafness and Communication Disorders, grants DC-004785 and DC-010110, supported this research.
References
Breza, J. M., Curtis, K. S., and Contreras, R. J. (2006). Temperature modulates taste responsiveness and stimulates gustatory neurons in the rat geniculate ganglion. J. Neurophysiol. 95, 674–685.
Breza, J. M., Curtis, K. S., and Contreras, R. J. (2007). Monosodium glutamate but not linoleic acid differentially activates gustatory neurons in the rat geniculate ganglion. Chem. Senses 32, 833–846.
Breza, J. M., Nikonov, A. A., and Contreras, R. J. (2010). Response latency to lingual taste stimulation distinguishes neuron types within the geniculate ganglion. J. Neurophysiol. 103, 1771–1784.
Contreras, R. J., and Lundy, R. F. Jr. (2000). Gustatory neuron types in the periphery: a functional perspective. Physiol. Behav. 69, 41–52.
Di Lorenzo, P. M., Chen, J., and Victor, J. D. (2009). Quality time: representation of a multidimensional sensory domain through temporal decoding. J. Neurosci. 29, 9227–9238.
Di Lorenzo, P. M., and Victor, J. D. (2003). Taste response variability and temporal coding in the nucleus of the solitary tract of the rat. J. Neurophysiol. 10, 1418–1431.
Di Lorenzo, P. M., and Victor, J. D. (2007). Neural coding mechanisms for flow rate in taste-responsive cells in the nucleus of the solitary tract of the rat. J. Neurophysiol. 97, 1857–1861.
Finger, T. E., Danilova, V., Barrows, J., Bartel, D. L., Vigers, A. J., Stone, L., Hellekant, G., and Kinnamon, S. C. (2005). ATP signaling is crucial for communication from taste buds to gustatory nerves. Science 310, 1495–1499.
Fishman, I. Y. (1957). Single fiber gustatory impulses in rat and hamster. J. Cell. Comp. Physiol. 49, 319–344.
Frank, M. E., Lundy, R. F. Jr., and Contreras, R. C. (2008). Cracking taste codes by tapping into sensory neuron impulse traffic. Prog. Neurobiol. 86, 245–263.
Gutierrez, R., Simon, S. A., and Nicolelis, A. L. (2010). Licking-induced synchrony in the taste-reward circuit improves cue discrimination during learning. J. Neurosci. 30, 287–303.
Halpern, B. P., and Tapper, D. N. (1971). Taste stimuli: quality coding time. Science 171, 1256–1258.
Hirata, S., Nakamura, T., Ifuku, H., and Ogawa, H. (2005). Gustatory coding in the precentral extension of area 3 in Japanese macaque monkeys; comparison with area G. Exp. Brain Res. 165, 435–446.
Kataoka, S., Yang, R., Ishimaru, Y., Matsunami, H., Sevigny, J., Kinnamon, J. C., and Finger, T. E. (2008). The candidate sour taste receptor, PKD2L1, is expressed by type III taste cells in the mouse. Chem. Senses 33, 243–254.
Katz, D. B., Simon, S. A., and Nicolelis, M. A. L. (2002). Taste-specific neuronal ensembles in the gustatory cortex of awake rats. J. Neurosci. 22, 1850–1857.
Kosar, E., and Schwartz, G. J. (1990). Effects of menthol on peripheral nerve and cortical unit responses to thermal stimulation of the oral cavity in the rat. Brain Res. 513, 202–211.
Li, A., Gong, L., and Xu, F. (2011). Brain-state-independent neural representation of peripheral stimulation in rat olfactory bulb. Proc. Natl. Acad. Sci. U.S.A. 108, 5087–5092.
Lundy, R. F. Jr., and Contreras, R. J. (1999). Gustatory neuron types in rat geniculate ganglion. J. Neurophysiol. 82, 2970–298.
Magri, C., Whittingstall, K., Singh, V., Logothetis, N. K., and Panzeri, S. (2009). A toolbox for the fast information analysis of multiple-site LFP, EEG and spike train recordings. BMC Neurosci. 10, 81. doi: 10.1186/1471-2202-10-81
Mistretta, C. M. (1972). “A quantitative analysis of rat chorda tympani fiber discharge patterns,” in Olfaction and Taste IV, ed. D. Schneider (Stuttgart: Wissenschaftliche Verlagsgesellschaft), 294–300.
Nagai, T., and Ueda, K. (1981). Stochastic properties of gustatory impulse discharges in rat chorda tympani fibers. J. Neurophysiol. 45, 574–592.
Narayan, R., Grana, G., and Sen, K. (2006). Distinct time scales in cortical discrimination of natural sounds in songbirds. J. Neurophysiol. 96, 252–258.
Neuhofer, D., Wohlgemuth, S., Stumpner, A., and Ronacher, B. (2008). Evolutionarily conserved coding properties of auditory neurons across grasshopper species. Proc. R Soc. Lond. B Biol. Sci. 275, 1965–1974.
Ogawa, H., Sato, M., and Yamashita, S. (1973). Variability in impulse discharges in rat chorda tympani fibers in response to repeated gustatory stimulations. Physiol. Behav. 11, 469–479.
Ogawa, H., Yamashita, S., and Sato, M. (1974). Variation in gustatory nerve fiber discharge pattern with change in stimulus concentration and quality. J. Neurophysiol. 37, 443–457.
Paiva, A., Park, I., and Principe, J. C. (2010). A comparison of binless spike train measures. Neural Comput. Appl. 19, 405–419.
Quiroga, R. Q., and Panzeri, S. (2009). Extracting information from neural populations: information theory and decoding practices. Nat. Rev. 10, 173–185.
Roussin, A. T., Victor, J. D., Chen, J., and Di Lorenzo, P. M. (2008). Variability in responses and temporal coding of tastants of similar quality in the nucleus of the solitary tract of the rat. J. Neurophysiol. 99, 644–655.
Shannon, C. E. (1948). A mathematical theory of communication. Bell Syst. Tech. J. 27, 379–423, 623–656.
Smith, J. C., Davis, J. D., and O’Keefe, G. B. (1992). Lack of an order effect in brief contact taste tests with closely spaced test trials. Physiol. Behav. 52, 1107–1111.
Tomchik, S. M., Berg, S., Kim, J. W., Chaudhari, N., and Roper, S. D. (2007). Breadth of tuning and taste coding in mammalian taste buds. J. Neurosci. 27, 10840–10848.
Vandenbeuch, A., Clapp, T. R., and Kinnamon, S. C. (2008). Amiloride-sensitive channels in type I fungiform taste cells in mouse. BMC Neurosci. 9, 1. doi: 10.1186/1471-2202-9-1
VanRullen, R., Guyonneau, R., and Thorpe, S. J. (2005). Spike times make sense. Trends Neurosci. 28, 1–4.
Victor, J. D., and Purpura, K. P. (1996). Nature and precision of temporal coding in visual cortex: a metric-space analysis. J. Neurophysiol. 76, 1310–1326.
Witt, M., Reutter, K., and Miller, I. J. (2003). “Morphology of the peripheral taste system,” in Handbook of Olfaction and Gustation, ed. R. L. Doty (New York: Marcel Dekker), 651–677.
Wohlgemuth, S., and Ronacher, B. (2007). Auditory discrimination of amplitude modulations based on metric distances of spike trains. J. Neurophysiol. 97, 3082–3092.
Keywords: temporal coding, geniculate ganglion, spike train metrics
Citation: Lawhern V, Nikonov AA, Wu W and Contreras RJ (2011) Spike rate and spike timing contributions to coding taste quality information in rat periphery. Front. Integr. Neurosci. 5:18. doi: 10.3389/fnint.2011.00018
Received: 10 February 2011;
Accepted: 02 May 2011;
Published online: 11 May 2011.
Edited by:
Alan Carleton, University of Geneva, SwitzerlandCopyright: © 2011 Lawhern, Nikonov, Wu and Contreras. This is an open-access article subject to a non-exclusive license between the authors and Frontiers Media SA, which permits use, distribution and reproduction in other forums, provided the original authors and source are credited and other Frontiers conditions are complied with.
*Correspondence: Robert J. Contreras, The James C. Smith Professor of Psychology and Neuroscience, Florida State University, Tallahassee, FL 32306-4301, USA. e-mail: rcontreras@fsu.edu