Parsing a perceptual decision into a sequence of moments of thought
- 1 Laboratorio de Neurociencia Integrativa, Departamento de Física, Facultad de Ciencias Exactas y Naturales – Universidad de Buenos Aires and Instituto de Física de Buenos Aires, Consejo Nacional de Investigaciones Científicas y Técnicas, Buenos Aires, Argentina
- 2 The Rockefeller University, New York, NY, USA
Theoretical, computational, and experimental studies have converged to a model of decision-making in which sensory evidence is stochastically integrated to a threshold, implementing a shift from an analog to a discrete form of computation. Understanding how this process can be chained and sequenced – as virtually all real-life tasks involve a sequence of decisions – remains an open question in neuroscience. We reasoned that incorporating a virtual continuum of possible behavioral outcomes in a simple decision task – a fundamental ingredient of real-life decision-making – should result in a progressive sequential approximation to the correct response. We used real-time tracking of motor action in a decision task, as a measure of cognitive states reflecting an internal decision process. We found that response trajectories were spontaneously segmented into a discrete sequence of explorations separated by brief stops (about 200 ms) – which remained unconscious to the participants. The characteristics of these stops were indicative of a decision process – a “moment of thought”: their duration correlated with the difficulty of the decision and with the efficiency of the subsequent exploration. Our findings suggest that simple navigation in an abstract space involves a discrete sequence of explorations and stops and, moreover, that these stops reveal a fingerprint of moments of thought.
Introduction
Even the simplest behavior involves a precisely coordinated sequence of computations (Lashley, 1951). In certain controlled experimental setups this sequence defines a flow in which sensory evidence is integrated to a criterion (a threshold) after which a response is initiated (Vickers, 1970; Ratcliff, 1988; Shadlen and Newsome, 2001; Usher and McClelland, 2001; Smith and Ratcliff, 2004; Ratcliff and McKoon, 2008). However, in most real tasks, perception and action are closely intertwined. Untangling the internal processes of a task in non-transient, more “ethological,” experimental setups is an important current challenge in neuroscience (Gilbert and Sigman, 2007).
Different efforts have been made to parse complex action into discrete computations. In well defined sequential actions in which the borders of internal computations are under experimental control, markers of start- and end-process-encoders have been identified (Fujii and Graybiel, 2003) mainly in prefrontal cortex neurons. Experimental (Shallice, 1982; Ullman, 1984; Dehaene and Changeux, 1997; Anderson and Lebiere, 1998) and theoretical (Shallice, 1982; Dehaene and Changeux, 1997; Anderson and Lebiere, 1998) efforts have also suggested sub-tasking in complex problem solving as for instance in mental calculation and arithmetic. It has been proposed that a sequential instance in which stochastically accumulated evidence is thresholded may instrument a shift from an analog to a discrete form of computation, crucial to avoid error amplification (Von Neumann, 1958; Good, 1979).
However, finding precise markers of the initiation and ending of sub-processes is very difficult in ethological experimental setups. This poses a challenge for physiological experiments which have to rely on blind methods (Michel et al., 1999; Hutchinson et al., 2009) to identify sub-task structure. Under certain circumstances, however, complex motor actions can spontaneously be parsed into discrete instances, thus providing an ideal tool to understand the architecture of task sub-processes. For instance drawing and handwriting have been shown to involve a serial sequence of strokes, reflecting the existence of programs which can concatenate modular motor schemes (Viviani and Terzuolo, 1982; Viviani and Cenzato, 1985; Viviani, 1986; Viviani and Flash, 1995; Meulenbroek et al., 1996; Manoel Ede et al., 2002). The parsing points of this motor program can be predicted by geometric properties, such as discontinuities or curvature maxima (Viviani and Cenzato, 1985; Viviani and Flash, 1995).
Our aim was to design a decision-making experiment which would spontaneously result in a cascade of operations with well defined behavioral markers. We reasoned that incorporating a virtual continuum of possible behavioral outcomes – a fundamental ingredient of real-life decisions – instead of simply grouping responses in a few categories should result in a progressive approximation to the correct response. We hypothesized that under these conditions, the response trajectories may spontaneously parse themselves into a sequence of steps. Each step may reflect an estimation of the target (the moment of thought) followed by a ballistic approximation to the target. The iteration of this process may be thought as a progressive approximation, were the scale of the problem shrinks after each discrete step. We thus designed a variant of a shape recognition task in which subjects navigated in a space of simple shapes, parametrically varying the local curvature of the contours (Feldman and Singh, 2005), using real-time tracking of motor action in a decision task, as a measure of cognitive states reflecting an internal decision process.
Results
Participants had to complete a simple perceptual decision task. They saw 1 of 10 abstract shapes in 1 of the 4 possible corners of the display during a variable presentation time (between 50 and 800 ms) followed by a mask, lasting 106 ms (Figure 1A). Participants scrolled the mouse to navigate in a one-dimensional periodic space of shapes parameterized by a single parameter (φ) which could vary between 0 and 2π (Figure 1B). When they moved the mouse to the left (or right) φ increased (or decreased). The corresponding shape was displayed, frame by frame at 85 Hz refresh rate. Participants moved the mouse freely until they considered that the shape matched the stimulus, and then clicked to indicate the response (Figure 1A). As usually done in decision-making experiments, participants were asked to respond as fast and accurately as possible. During the response trajectory, we obtained a continuous measure of accuracy throughout the trajectory.
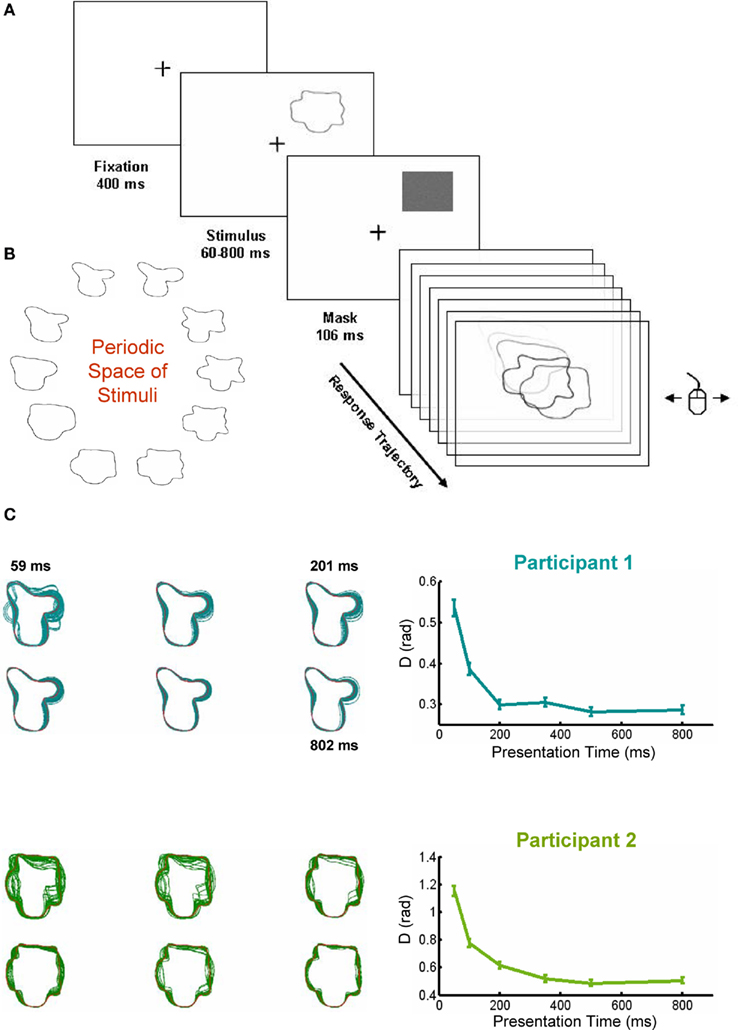
Figure 1. Experimental design and performance in the task. (A) Sketch of the experimental design. Subjects saw a shape for a variable duration (between 50 and 800 ms) at one of four possible positions, followed by a 106-ms mask. After the mask subjects moved the mouse from left and right to explore the shape space. They could move the mouse freely until the observed shape matched the presented target. (B) The periodic shape space, showing the 10 stimuli. (C) Performance (the distance between the responded shape and the presented target) increased with presentation time. Left panels: visual superposition of all responded shapes for each target (only two shown, stimulus in red), Right panels: performance increased with presentation time, reaching an asymptote at around 300 ms.
The accuracy of the response is determined by the distance between the responded object and the target:
where RT indicates the response time, i.e., the time between the presentation of the response screen and the mouse click. The distance ranges between 0 and π and, thus, chance performance is at π/2.
Two participants completed eight sessions in consecutive days. We first performed a one-way ANOVA with presentation time as the experimental factor and the mean performance for each session as repeated measures. Both subjects showed a significant effect of presentation time (Participant 1: F5, 35 = 24.2, p << 0.001; Participant 2: F5, 35 = 57.89, p << 0.001). The ANOVA reflected a very significant increase in performance with presentation time, which reached an asymptotic level about 200–300 ms (Figure 1C). Even thought an effect of learning was observed (data not shown), we present here the behavior across all sessions, as we do not want divert the attention from the main findings of the study.
As expected, the increase in performance was accompanied by a decrease in the SD (Participant 1: F5, 35 = 26.31, p << 0.001; Participant 2: F5, 35 = 27.81, p << 0.001), indicating that for increasing presentation times all responses are progressively clustered closer to the correct response. This can be seen explicitly (Figure 1C) superposing all the responded shapes to a given target (in red) for different presentation times. This representation further indicates that certain portions of the contour are more susceptible to confusion (although a precise analysis should take into account the restrictions of shape space) – in line with a series of studies which have indicated that information along contours is not homogeneous (Attneave, 1954; Barenholtz et al., 2003; Feldman and Singh, 2005).
The previous results merely corroborate previous findings. We showed that response accuracy saturates at about 300 ms (Suzuki and Cavanagh, 1998) and that errors are not uniformly distributed along the contour (Driver and Baylis, 1996; Barenholtz and Feldman, 2003; Barenholtz et al., 2003). In what follows, we concentrate on the main focus of this study: understanding the dynamics of response trajectories. Our experimental setup – in which we measured participants’ progression to the response in real-time – was specifically designed to address this question.
The smoothed raster plot of D(t) – after sorting all trials by RT showed a seemingly continuous pattern of convergence to the correct response (Figure 2A). However, when exploring single-trial dynamics, we observed in virtually every single trial a sequence of “stops,” i.e., instances in which the trajectory is frozen at a fixed point, and transitions (“walks”) between pairs of stops. This pattern closely resembles the dynamics of fixations and saccades observed in eye-movements.
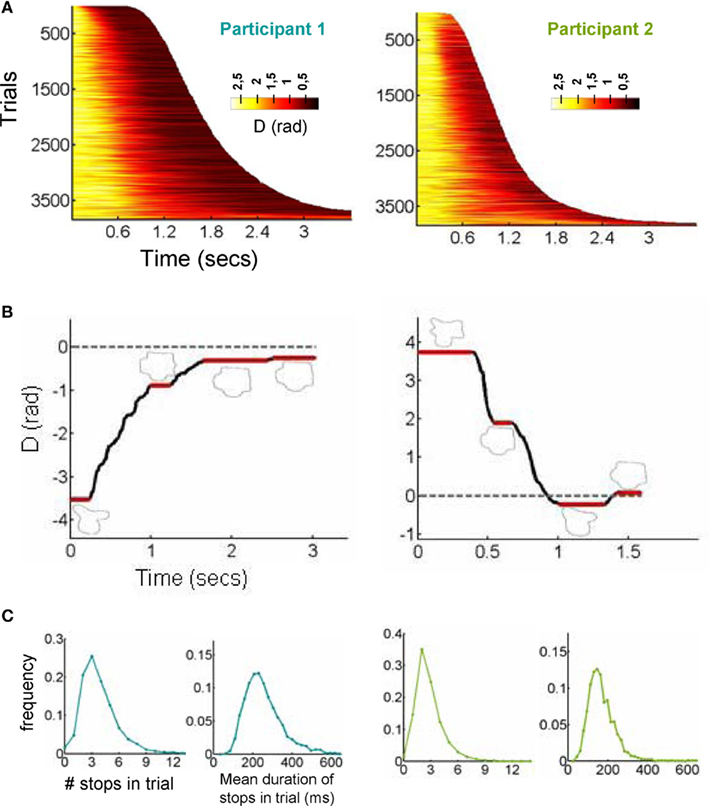
Figure 2. Discretization of a trajectory in a sequence of stops and explorations. (A) The smoothed raster of all decision trajectories, sorted by RT. The color code indicates the distance to the target. (B) The position of a representative trajectory (the zero value of the y-axis corresponds to the target). The trajectory reveals a series of stops (instances in which the participant does not move the mouse) which were observed in all trajectories. Sampling points with a distance greater than pi relates to the existence of a complete turn in the trajectory. (C) Histograms of number of stops per trajectory and stop duration. Stops were relatively fast (on average about 200 ms) and were unnoticed to participants.
A representative trajectory for each participant can be seen in Figure 2B (for videos of the reconstructed trajectory, see Videos in Supplementary Material). These trajectories start with a stop. This was expected since it constitutes a standard response initiation time, i.e., the time it takes the participants to initiate motor action and start moving the mouse toward the correct response. The most surprising aspect is that after advancing toward the correct response, participants make several stops. Interviews with the participants after all sessions had been completed revealed that none of them were aware of making stops in the decision process which is expected from their relatively short duration of about 200 ms. Indeed in a real-time reconstruction of the trajectory, the stops are not easily perceived (see Figure 2B and Videos in Supplementary Material). We identified stops using a clustering algorithm – very similar to those used for detecting fixation points in eye-movements (see Experimental Procedures for details). The mean number of stops per trajectory was close to 3 (Participant 1: 3.81 ± 0.03; Participant 2: 2.79 ± 0.03) and their duration was about 200 ms (Participant 1: 250 ± 2 ms; Participant 2: 166 ± 1 ms; Figure 2C). The number of stop was remarkably robust with over 65% of the trials having 2–4 stops.
This finding shows a ubiquitous, spontaneous, and unconscious segmentation of the convergence to the correct response in discrete instances. Our hypothesis was that these stops constitute moments of thought, i.e., instances in which subjects make an evaluation of the current state and initiate a new decision. We thus explored different predictions of this hypothesis, which relate the duration of the stops, the distance to the target and presentation time.
First, the duration of each stop should increase with the difficulty of the decision (Holmes et al., 2005; Palmer et al., 2005). In the first stop difficulty should be determined mainly by the duration of stimulus presentation. Second, if stops reflect a decision process, we should observe a distance effect which is virtually observed in all one-dimensional comparisons (Moyer and Landauer, 1967); RTs should increase when the position of the stop is closer to the target. Finally, as predicted by the classic speed accuracy trade-off (Wickelgren, 1977), for stops at comparable initial positions, the longer the duration of the stop one would expect that the subsequent walk (i.e., the position of the next stop) is closer to the target. In what follows, we show experimental evidence supporting these predictions (Figure 3).
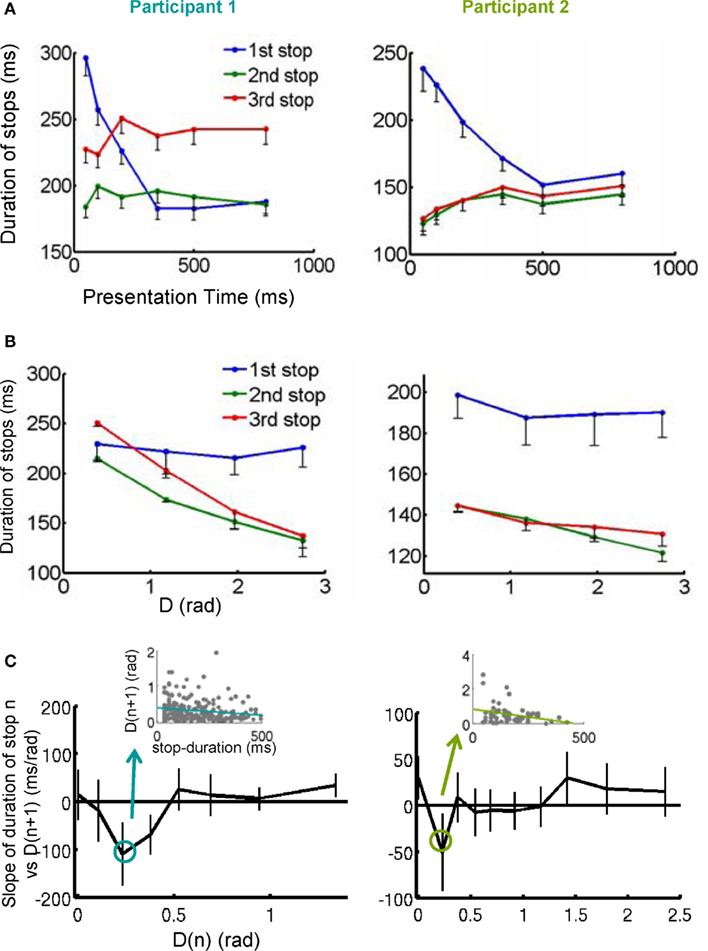
Figure 3. Stops as a sequence of moments of thought. (A) The duration of the first stop (blue trace) decreased with stimulus presentation. (B) The duration of the second and third stops decreased with the distance of the shape at the stop to the target. (C) For a certain subset of D(n) close to the target, the longer the duration of the stop, the shortest the distance to the target of the exploration following the stop. The y-axis of the plot is the slope of the linear regression between stop duration at D(n) vs. D(n + 1). Error bars represents the 95% confidence interval. Additionally, the inset shows an example of the negative correlation obtained in the linear regression analysis (Participant 1: F1, 2052 = 6.03, p < 0.05; Participant 2: F1, 696 = 4.06, p < 0.05). These results suggest that stops constitute internal decisions since their duration correlated with the difficulty of the decision in this instance and with the efficiency of the subsequent exploration.
We explored the first hypothesis through a general-linear-regression model, with presentation time and distance to the target as regressors. All results were consistent with the hypotheses and are summarized in Table 1 and the average data is represented in Figure 3A (regression to presentation time) and Figure 3B (correlation with distance to the target). Both participants showed the same dependencies: the first stop was negatively correlated with presentation time – the shorter presentations resulting in longer stops. The variability of subsequent stops was mostly explained by the distance to the target, also resulting in a significant negative correlation – the closer to the target, the longer the stop.
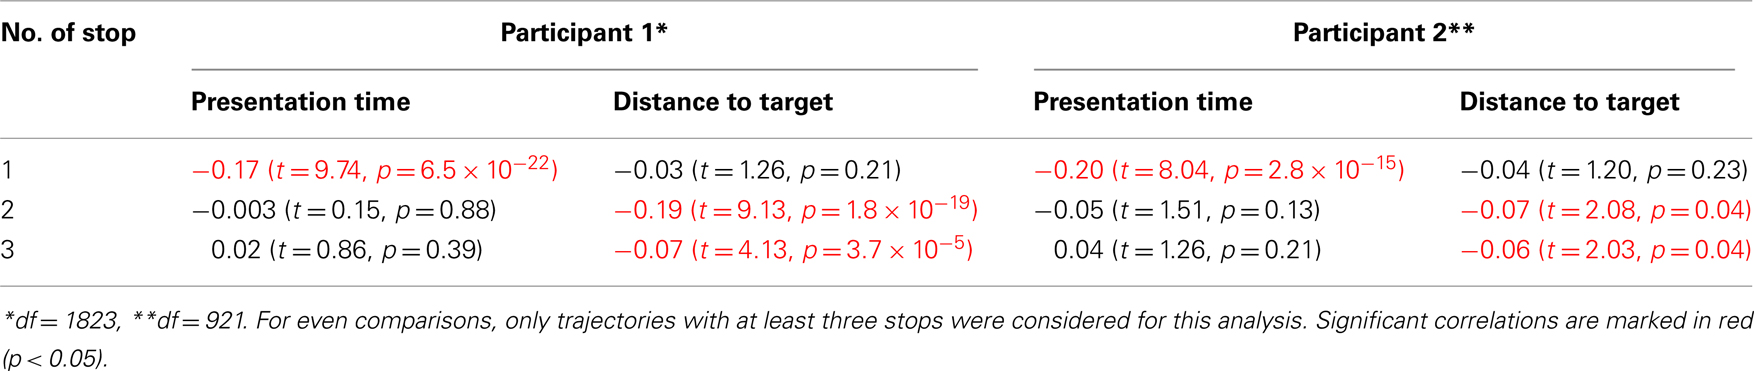
Table 1. Correlation coefficients and statistics of stop duration (for the first, second, and third stops) with presentation time and distance to target.
Next, we investigated the relationship between stop duration and the accuracy of the subsequent exploration. That is, we considered the correlation between the duration of stop n and D(n + 1) reasoning that longer stops should predict ballistic approximations which are closer to the target. Since D(n) and D(n + 1) are likely correlated, it is important to separate the contribution of both to the duration of stop n. Taking this into account, we measured the regression between the duration of stop n and D(n + 1) for different fixed, small intervals of D(n) (Figure 3C). We observed that for both participants there is an interval of D(n) – closer to the target –, for which the duration at stop n was predictive of D(n + 1): the longer the duration of the stop n, the closer the distance to the target at the stop n + 1 (inset Figure 3C and legend for statistics).
Discussion
We found that response trajectories in a decision task are spontaneously and unconsciously parsed into a discrete sequence that manifests itself a series of stops. A detailed exploration of these stops revealed that they constitute instance of decisions: their duration covaries as expected with the current status of task difficulty and with the precision of the subsequent excursion. While these properties constitute signatures of a decision process we cannot rule out the existence of additional factors that could play a role in the spontaneous parsing of the trajectory into a sequence of stops. A possibility could be that stops represent some perceptual stage (i.e., stops as fixed moments of stable perception) or even a mixture of a perceptual component and a central (decisional) one. One could envision a scenario where, similar to what happens during eye-movements, there is blurring of the input during motion in the shape space. A perceptual component underlying the stops would manifest itself as a fixed offset on the stop duration distribution (Pashler, 1984; Sigman and Dehaene, 2005, 2008). We have emphasized the central origin of the stops, linking them to “thought” since they reflect fingerprints of decision-making: stops are longer when the problem is more difficult (closer to the target) and, the longer stops predict better outcomes. However, a similar prediction might be expected for a purely sensory stage: longer observation times are needed when the target is closer and they would lead to better performance. However, even if stops reflected an effective “fixation,” i.e., freezing the image when motion is controlled with the hands and not with the eyes, which serves to extract reliable sensory information, this sensory information has to feed in turn a decision system (the action which has to be taken in light of this new evidence; Kamienkowski et al., 2011). The spontaneous parsing of a seemingly continuous stream is a robust finding; elucidating the exact function of each stop certainly requires more investigation. Future studies should dissect these fine aspects of the nature of the stops, and the generalization of these results to other tasks with varying perceptual, motor, and cognitive loads as well as different sensory modalities. Similarly, one could ask whether the stops are entangled with other behavioral markers of cognitive processes such as eye-movements, which could be required to evaluate the shape displayed during stops. The analysis presented here shows the behavior collapsed across sessions, and a trace of learning was observed during our analysis (data not shown). In order to have a better understanding of the processes behind the stops, it will be important to analyze their contribution to the different stages in the learning process.
Our findings can be viewed as a synthesis between discrete approaches to human cognition (Anderson and Lebiere, 1998; Zylberberg et al., 2011) and Fitts Law (Keele, 1968; Card et al., 1983, 1986), a quantitative theory which successfully describes the time to reach as target as a function of distance and accuracy which can be derived assuming a sequence of increasingly accurate movements until the target is reached. Our data support this mechanistic explanation of the Fitts heuristic proposal, which has received renewed attention with the pressure imposed to refine the ergonomy of human computer interactions.
Previous studies have used real-time tracking of motor action as a handle to cognition, providing a window to observe otherwise hidden cognitive states as they unfold in time (Spivey et al., 2005, 2009; Song and Nakayama, 2008). For instance it has been shown that trajectories toward a target are often initiated toward a distracter and only corrected after a measurable latency. These curved trajectories have served to measure objectively, the timing of internal decision processes (Spivey et al., 2005; Song and Nakayama, 2008). Compared to these previous studies, the trajectories in our experiments involved longer explorations and time (in the order of a second). The main novelty of this work is that this resulted in a spontaneous segmentation of the trajectories into a discrete sequence of explorations separated by stops. Such discretization has been found in a variety of behaviors, when the temporal-scales exceed the few 100 ms, such as eye-movements analysis of single trajectories, or perceptual rivalry between images (Murata et al., 2003; Mamassian and Goutcher, 2005). Also, although not measured precisely, indirect markers of spontaneous sub-tasking have been reported in other domains of cognition, as for instance in arithmetic or more generally complex problem solving (Shallice, 1982; Ullman, 1984; Dehaene and Changeux, 1997; Anderson and Lebiere, 1998; Zylberberg et al., 2011). Finally drawing and handwriting (and more generally complex motor actions) have been shown to involve a serial sequence of strokes, reflecting the existence of programs which can concatenate modular motor schemes (Viviani and Terzuolo, 1982; Viviani and Cenzato, 1985; Viviani, 1986; Viviani and Flash, 1995; Meulenbroek et al., 1996; Manoel Ede et al., 2002).
Here we extend these findings to the decision-making process, showing that it can be segmented into a sequence of instances of exploration and stabilization. Our finding that even simple navigation in an abstract space involves a discrete sequence of explorations and stops and, moreover, that these stops reveal a fingerprint of moments of thoughts suggests that such architecture may be ubiquitous and part of a fundamental organization of cognition. Such dynamics has been postulated by different theoretical and computation models, which suggest that cognition involves the transition between transiently stable microstates (Michel et al., 1999; Fingelkurts and Fingelkurts, 2005; Ito et al., 2007; Rabinovich et al., 2008; Schyns et al., 2009).
Experimental Procedures
Stimuli
Participants performed a shape identification task. Shapes were white on black contours belonging to an abstract one-dimensional shape space. To generate a periodical one-dimensional continuum of shapes we used the following method.
First we defined a two-dimensional space of shapes in polar coordinates, for each pair (a, b) in the plane, we associated the contour r(θ) corresponding to:
In turn, a and b are defined by a phase (φ) sampling the two-dimensional space through an ellipse, according to:
a = 0.65 · cos(φ) + 1.35
b = 2 · sin(φ) + 4
There is of course nothing particularly special about this set of parameters which were chosen by inspection to assure that the shapes would have “intermediate complexity.” The space of shapes is briefly sketched in Figure 1B, and in the Videos in Supplementary Material, an evolution of shapes as φ varies is shown.
Thus, the previous equations establish the correspondence of a contour for each φ ∈ [0,2π]. Within this space we chose 10 values of φ as the 10 distinct possible targets.
Perceptual Calibration of the Periodic Space of Forms
Since the metrics in φ has no correspondence with the perceptual metrics in shape space, we calibrated this space in a previous control experiment. We first sampled the interval [0,2π] at 10 equidistant points  Three participants performed this calibration experiment. The 10 different shapes were presented randomly for 106 ms (total of 900 trials) and subjects responded freely moving the mouse (a movement of the mouse corresponded to a movement in φ). We then measured the SD in the response for each value of
  . If the space was sampled in a perceptually uniform way, the SD would be the same across all shapes. We thus rescaled to a new unit given by:
where α(φ) is the inverse of the SD for the different shapes interpolated to the whole space using cubic splines. In this new unit, by definition, the SD is uniform across all stimuli. In the experiments reported here the shape space was sampled uniformly in this new variable.
Procedure
Participants seated in a comfortable chair at a distance of 60 cm from a 19′ computer screen (refresh rate of 85 Hz, resolution of 1152 × 864 pixels). Behavioral experiments were programmed in Matlab (v 7.5) using the Psychophysics Toolbox extensions (Brainard, 1997; Pelli, 1997). Each trial begun with a fixation cross, which lasted 401 ms. Following the fixation cross the target (1 of 10 arbitrary different shapes selected a priori) was presented for a variable duration (randomly chosen across trials) of 59, 106, 201, 354, 507, and 802 ms. The shape was presented at one of four possible positions (up-left, up-right, down-left, and down-right corners, with an eccentricity of 12.5°) and was followed by a 106-ms mask. The mask was a rectangular white noise image covering the area defined by the stimuli. The size of the stimulus was 8°. The set of stimuli presented was held constant through the experiment (see Figure 1B).
Following the mask, subjects saw a shape, randomly sampled from the periodic space (excluding a window centered on the stimulus with a half-size of 20% of diameter of the circular space) which was displayed at the center of the screen. The response shapes were larger than the stimuli, of a size of 14°.
Participants then could move freely the mouse, and the x-position of the mouse was mapped to a phase (with an equivalence of approximately 0.7 cm/rad). Thus, moving the mouse to the left and to the right, subjects could explore the shape space until they found the shape that had been presented. Mouse location was recorded at a sample rate of 85 Hz. Subjects were asked to indicate the chosen shape by clicking the mouse button when they thought the seen shaped matched the presented target. Two naïve participants (one 25-years-old male, and one 20-years-old female, both students of the University of Buenos Aires, Argentina) completed eight sessions of 480 trials in successive days. Each session lasted about 30 min.
Data analysis
In this paper we grouped all sessions for analysis. We did observe a trace of learning in this task, however we did not want this to distract from the main focus of this paper, which was the exploration of the dynamics of response trajectories. The effect of learning will be reported elsewhere. All the properties of stops reported in this article were conserved throughout the course of learning.
To give a general overview of the whole ensemble of trajectories, we sorted the trajectories by RT and smoothed them in the x-axis (Time) and y-axis (Trials), using a window size of 10 sampling points or trials, respectively.
Stops were calculated setting a threshold criterion to the velocity of mouse movement. Velocity measurements were first smoothed by local averaging with four neighbor points. We set an arbitrary threshold of 0.001 rad/sample (0.085 rad/s), small when compared to typical values for velocity (Participant 1: mean = 0.05 rad/sample, SD = 0.03 rad/sample; Participant 2: mean = 0.07 rad/sample, SD = 0.05 rad/sample). We exclude for analysis stops shorter than three sampling points and longer than eight times the SD of the distribution. We ruled out the possibility of the stops being caused by a lifting of the mouse from the table in control sessions where videos of the mouse motion were recorded.
Author Contributions
Martín Graziano, Pablo Polosecki, and Mariano Sigman designed research; Martín Graziano and Pablo Polosecki performed research; Martín Graziano, Pablo Polosecki, Diego Edgar Shalom, and Mariano Sigman analyzed data; and Martín Graziano, Pablo Polosecki, Diego Edgar Shalom, and Mariano Sigman wrote the paper.
Conflict of Interest Statement
The authors declare that the research was conducted in the absence of any commercial or financial relationships that could be construed as a potential conflict of interest.
Acknowledgments
This work was supported by grants from SECYT (PICT 38366), CONICET, and by the Human Frontiers Science Program.
Supplementary Material
The Supplementary Material for this article can be found online at http://www.frontiersin.org/Integrative_Neuroscience/10.3389/fnint.2011.00045/abstract
Video S1. Periodic space of shapes.
Video S2. Representative trajectory (slow motion).
Video S3. Representative trajectory same as SV2, in real-time.
Video S4. Representative trajectory (slow motion).
Video S5. Representative trajectory same as SV4, in real-time.
References
Anderson, J. R., and Lebiere, C. (1998). The Atomic Components of Thought. Mahwah, NJ: Lawrence Erlbaum Associates Publishers.
Barenholtz, E., Cohen, E. H., Feldman, J., and Singh, M. (2003). Detection of change in shape: an advantage for concavities. Cognition 89, 1–9.
Barenholtz, E., and Feldman, J. (2003). Visual comparisons within and between object parts: evidence for a single-part superiority effect. Vision Res. 43, 1655–1666.
Card, S., Moran, T., and Newell, A. (1983). The Psychology of Human-Computer Interaction. Hillsdale, NJ: Lawrence Erlbaum Associates.
Card, S. K., Moran, T. P., and Newell, A. (1986). The Model Human Processor: An Engineering Model of Human Performance. Oxford: John Wiley & Sons.
Dehaene, S., and Changeux, J. P. (1997). A hierarchical neuronal network for planning behavior. Proc. Natl. Acad. Sci. U.S.A. 94, 13293–13298.
Driver, J., and Baylis, G. C. (1996). Edge-assignment and figure-ground segmentation in short-term visual matching. Cogn. Psychol. 31, 248–306.
Feldman, J., and Singh, M. (2005). Information along contours and object boundaries. Psychol. Rev. 112, 243–252.
Fingelkurts, A. A., and Fingelkurts, A. A. (2005). “Mapping of brain operational architectonics,” in Focus on Brain Mapping Research, ed. F. J. Chen (Hauppauge, NY: Nova Science Publishers Inc.), 59–98.
Fujii, N., and Graybiel, A. M. (2003). Representation of action sequence boundaries by macaque prefrontal cortical neurons. Science 301, 1246–1249.
Gilbert, C. D., and Sigman, M. (2007). Brain states: top-down influences in sensory processing. Neuron 54, 677–696.
Good, I. J. (1979). Studies in the history of probability and statistics. XXXVII. A.M. Turing’s statistical work in world war II. Biometrika 66, 393–396.
Holmes, P., Shea-Brown, E., Moehlis, J., Bogacz, R., Gao, J., Aston-Jones, G., Clayton, E., Rajkowski, J., and Cohen, J. D. (2005). Optimal decisions: from neural spikes, through stochastic differential equations, to behavior. IEICE Trans. Fundam. 88-A, 2496–2503.
Hutchinson, R. A., Niculescu, R. S., Keller, T. A., Rustandi, I., and Mitchell, T. M. (2009). Modeling fMRI data generated by overlapping cognitive processes with unknown onsets using Hidden Process Models. Neuroimage 46, 87–104.
Ito, J., Nikolaev, A. R., and van Leeuwen, C. (2007). Dynamics of spontaneous transitions between global brain states. Hum. Brain Mapp. 28, 904–913.
Kamienkowski, J. E., Pashler, H., Dehaene, S., and Sigman, M. (2011). Effects of practice on task architecture: combined evidence from interference experiments and random-walk models of decision making. Cognition 119, 81–95.
Lashley, K. (1951). “The problem of serial order in behavior,” in Cerebral Mechanisms in Behavior, ed. C. A. Jeffres (New York, NY: John Wiley & Sons), 112–136.
Mamassian, P., and Goutcher, R. (2005). Temporal dynamics in bistable perception. J. Vis. 5, 361–375.
Manoel Ede, J., Basso, L., Correa, U. C., and Tani, G. (2002). Modularity and hierarchical organization of action programs in human acquisition of graphic skills. Neurosci. Lett. 335, 83–86.
Meulenbroek, R. G., Rosenbaum, D. A., Thomassen, A. J., Loukopoulos, L. D., and Vaughan, J. (1996). Adaptation of a reaching model to handwriting: how different effectors can produce the same written output, and other results. Psychol. Res. 59, 64–74.
Michel, C. M., Seeck, M., and Landis, T. (1999). Spatiotemporal dynamics of human cognition. News Physiol. Sci. 14, 206–214.
Moyer, R. S., and Landauer, T. K. (1967). Time required for judgements of numerical inequality. Nature 215, 1519–1520.
Murata, T., Matsui, N., Miyauchi, S., Kakita, Y., and Yanagida, T. (2003). Discrete stochastic process underlying perceptual rivalry. Neuroreport 14, 1347–1352.
Palmer, J., Huk, A. C., and Shadlen, M. N. (2005). The effect of stimulus strength on the speed and accuracy of a perceptual decision. J. Vis. 5, 376–404.
Pashler, H. (1984). Processing stages in overlapping tasks: evidence for a central bottleneck. J. Exp. Psychol. Hum. Percept. Perform. 10, 358–377.
Pelli, D. G. (1997). The VideoToolbox software for visual psychophysics: transforming numbers into movies. Spat. Vis. 10, 437–442.
Rabinovich, M. I., Huerta, R., Varona, P., and Afraimovich, V. S. (2008). Transient cognitive dynamics, metastability, and decision making. PLoS Comput. Biol. 4, e1000072.
Ratcliff, R. (1988). Continuous versus discrete information processing modeling accumulation of partial information. Psychol. Rev. 95, 238–255.
Ratcliff, R., and McKoon, G. (2008). The diffusion decision model: theory and data for two-choice decision tasks. Neural Comput. 20, 873–922.
Schyns, P. G., Gosselin, F., and Smith, M. L. (2009). Information processing algorithms in the brain. Trends Cogn. Sci. (Regul. Ed.) 13, 20–26.
Shadlen, M. N., and Newsome, W. T. (2001). Neural basis of a perceptual decision in the parietal cortex (area LIP) of the rhesus monkey. J. Neurophysiol. 86, 1916–1936.
Shallice, T. (1982). Specific impairments of planning. Philos. Trans. R. Soc. Lond. B Biol. Sci. 298, 199–209.
Sigman, M., and Dehaene, S. (2005). Parsing a cognitive task: a characterization of the mind’s bottleneck. PLoS Biol. 3, e37.
Sigman, M., and Dehaene, S. (2008). Brain mechanisms of serial and parallel processing during dual-task performance. J. Neurosci. 28, 7585–7598.
Smith, P. L., and Ratcliff, R. (2004). Psychology and neurobiology of simple decisions. Trends Neurosci. 27, 161–168.
Song, J. H., and Nakayama, K. (2008). Target selection in visual search as revealed by movement trajectories. Vision Res. 48, 853–861.
Spivey, M. J., Grosjean, M., and Knoblich, G. (2005). Continuous attraction toward phonological competitors. Proc. Natl. Acad. Sci. U.S.A. 102, 10393–10398.
Spivey, M. J., Richardson, D., and Dale, R. (2009). “The movement of eye and hand as a window into language and cognition,” in Oxford Handbook of Human Action, eds E. Morsella, J. A. Bargh, and P. M. Gollwitzer (New York, NY: Oxford University Press), 225–249.
Suzuki, S., and Cavanagh, P. (1998). A shape-contrast effect for briefly presented stimuli. J. Exp. Psychol. Hum. Percept. Perform. 24, 1315–1341.
Usher, M., and McClelland, J. L. (2001). The time course of perceptual choice: the leaky, competing accumulator model. Psychol. Rev. 108, 550–592.
Vickers, D. (1970). Evidence for an accumulator model of psychophysical discrimination. Ergonomics 13, 37–58.
Viviani, P. (1986). “Do units of motor action really exist?” in Generation and Modulation of Action Patterns, eds H. Heuer, and C. Fromm (Berlin: Springer-Verlag), 201–216.
Viviani, P., and Cenzato, M. (1985). Segmentation and coupling in complex movements. J. Exp. Psychol. Hum. Percept. Perform. 11, 828–845.
Viviani, P., and Flash, T. (1995). Minimum-jerk, two-thirds power law, and isochrony: converging approaches to movement planning. J. Exp. Psychol. Hum. Percept. Perform. 21, 32–53.
Viviani, P., and Terzuolo, C. (1982). Trajectory determines movement dynamics. Neuroscience 7, 431–437.
Wickelgren, W. A. (1977). Speed-accuracy tradeoff and information processing dynamics. Acta Psychol. (Amst.) 40, 67–85.
Keywords: decision-making, mental algorithms, sequential operations, vision
Citation: Graziano M, Polosecki P, Shalom DE and Sigman M (2011) Parsing a perceptual decision into a sequence of moments of thought. Front. Integr. Neurosci. 5:45. doi: 10.3389/fnint.2011.00045
Received: 11 June 2011; Paper pending published: 28 June 2011;
Accepted: 13 August 2011; Published online: 12 September 2011.
Edited by:
Sidarta Ribeiro, Edmond and Lily Safra International Institute of Neuroscience of Natal, BrazilReviewed by:
Timothy Gardner, Boston University, USADiego Andres Laplagne, The Rockefeller University, USA
Copyright: © 2011 Graziano, Polosecki, Shalom and Sigman. This is an open-access article subject to a non-exclusive license between the authors and Frontiers Media SA, which permits use, distribution and reproduction in other forums, provided the original authors and source are credited and other Frontiers conditions are complied with.
*Correspondence: Mariano Sigman, Laboratorio de Neurociencia Integrativa, Departamento de Física, Facultad de Ciencias Exactas y Naturales, Universidad de Buenos Aires and Instituto de Física de Buenos Aires, CONICET. Pabellón 1, Ciudad Universitaria, CP 1428, Buenos Aires, Argentina. e-mail: sigman@df.uba.ar