Temporal and spatial categorization in human and non-human primates
- Instituto de Neurobiología, Universidad Nacional Autónoma de México Campus Juriquilla, Queretaro, México
It has been proposed that a functional overlap exists in the brain for temporal and spatial information processing. To test this, we designed two relative categorization tasks in which human subjects and a Rhesus monkey had to assign time intervals or distances to a “short” or “long” category according to varying prototypes. The performance of both species was analyzed using psychometric techniques that showed that they may have similar perceptual, memory, and/or decision mechanisms, specially for the estimation of time intervals. We also did a correlation analysis with human subjects’ psychometric thresholds and the results imply that indeed, temporal and spatial information categorization share neural substrates. However, not all of the tested distances and intervals correlated with each other, suggesting the existence of sub-circuits that process restricted ranges of distances and intervals. A different analysis was done on the monkey data, in which the influence of the previous categorical prototypes was measured on the task currently being performed. Again, we found a significant interaction between previous and current interval and distance categorization. Overall, the present paper points toward common or at least partially overlapped neural circuits for temporal and spatial categorization in primates.
Introduction
Moment by moment our brain is presented with uncountable stimuli that contain spatial and temporal information. The processing of these magnitudes is basic for successful behavior and it has been proposed that common neural mechanisms are used for their measurement. Evidence supporting this hypothesis, sometimes referred to as A Theory of Magnitude or ATOM (Walsh, 2003), comes from very different sources. Elapsed time is widely represented graphically in spatial coordinates and our language contains many metaphors that speak of time as a spatial magnitude and vice versa (Casasanto and Boroditsky, 2008; Vallesi et al., 2008). Also, patients with brain lesions affecting spatial processing show accompanying deficits in temporal estimation (Basso et al., 1996) and the opposite case, enhanced magnitude processing, has also been reported in synesthetes (Teuscher et al., 2010; Cohen Kadosh et al., 2011). This suggests that indeed, similar neural circuits are engaged when time and space are quantified. Among the structures that have been involved in these circuits are the prefrontal cortex and the posterior parietal cortex, particularly in the right hemisphere (Bueti and Walsh, 2009).
However, some challenges have been made to this theory (Correa and Nobre, 2008). An issue that has not been addressed is the degree of overlap in the processing of these magnitudes. If time and space are regarded as similar dimensions by the brain, then particular time intervals should be equivalent to particular distances and vice versa. While much research has been done regarding the neural mechanisms behind the quantification of different time scales (Gibbon et al., 1997; Buonomano and Karmarkar, 2002; Buhusi and Meck, 2005), there are, to our knowledge, no reports of separate substrates for the processing of distinct spatial scales. At least four different mechanisms have been proposed to account for timing in different ranges, from microseconds to circadian rhythms. Do all of these timing mechanisms also process spatial magnitudes? If so, which range of distances is quantified by them? An issue that has already been investigated is the influence that one magnitude exerts over the other. Casasanto and Boroditsky (2008) tested human subjects on six different tasks that required subjects to reproduce either the length or the duration of visual stimuli. They found that the spatial features of the stimuli had a significant influence on subjects’ temporal estimates, but not the other way around. These results imply that there is an asymmetrical dependence in which temporal processing requires some degree of spatial representation. On the other hand, Rhesus monkeys did not seem to present this bias, since they were equally affected by irrelevant temporal or spatial information in their magnitude estimations (Merrit et al., 2010).
In the present work, we designed two categorization tasks in which time intervals in the millisecond range or distances in the millimeter range had to be categorized as “short” or “long” according to previously acquired prototypes. These tasks were performed by human subjects and one rhesus monkey. The rationale behind our approach is that categorization tasks are well characterized and allow the analysis of various psychophysical measures. Furthermore, categorization is one of the most common perceptual mechanisms in humans and consists in mentally grouping environmental stimuli into clusters known as categories. In the middle of a category lies a representative element, known as prototype, which has the greatest percentage of relevant features that characterize the category. Also, categories have limits or boundaries beyond which similar elements are not considered as members (Kéri, 2003). In fact, investigators have long hypothesized that the assignment of a particular stimulus to a category may be done either by comparing it to the prototype, the boundaries, or to the members in the category (Ashby and Maddox, 2005). Importantly, categorization is a relative and dynamic process, since the same object can be part of different and even opposed groups depending on the current context (Maddox, 2002; Roy et al., 2010). Many species are capable of categorization and Rhesus monkeys have been trained to perform different categorization tasks (Merchant et al., 1997; Romo et al., 1997; Freedman et al., 2001; Smith et al., 2004). The aim of this research was two-fold: first, we wanted to determine the similarities and differences in spatial and temporal categorization between both species. Second, we studied whether different psychophysical measures supported the notion of a common or a partially overlapped mechanism for magnitude processing. Our results point that both species do share some mechanisms for temporal and spatial categorization and that these magnitudes influence each other. They also propose that a particular range of time intervals may be considered as equivalent to specific distances.
Materials and Methods
Human Subjects
Participants
Twenty-five human subjects [13F, 12M; age 25.36 ± 3.49 years (mean ± SD)] with normal or corrected vision volunteered for this study. All subjects were right-handed and gave written consent before commencement of experiments. The study complied with the Declaration of Helsinki and was approved by the National University of Mexico Institutional Review Board.
Materials
We programmed two categorization tasks using Visual Basic (Microsoft Visual Basic 6.0, 1998) for the presentation of stimuli and behavioral data collection. All the tasks were performed in front of a computer monitor (HP 7540, 160 Hz refresh rate) with the chin and the forehead placed in a custom-made headrest that kept the subject’s eyes approximately 56 cm from the center of the monitor. A joystick (H000E-NO-C, CTI electronics, Stratford, CT, USA) was manipulated by the subject to control the position of the cursor.
Tasks
All subjects were tested on the Temporal (TCT) and Spatial (SCT) Categorization Tasks. In both tasks, subjects had to categorize eight different stimuli as “short” or “long,” the first four values being considered as “short” (see Table 1). In the case of SCT, subjects had to categorize eight different distances between two vertical bars, whereas in TCT they had to categorize eight different time intervals between the first and the second appearance of the bars. The temporal sequence of a trial was the same for both tasks (Figure 1). A circle appeared in the center of the screen with the cursor, represented by a small red dot, under it. The subject decided when to begin the trial by placing and maintaining the cursor inside the central circle. After a variable delay (500 + Δ 1,000 ms), two parallel bars (8° × 0.7° of visual angle) separated by a particular distance appeared briefly (50 ms) above the central circle, disappeared for a particular interval, and reappeared in the same position. In the SCT, the interval was kept constant in all the trials (669 ms) but the distance between the bars varied from trial to trial and could be any of the eight distances. In the TCT the opposite happened: the distance was kept constant (6° of visual angle), but the interval varied from one trial to the next. To help distinguish between tasks, the stimuli and the central circle were yellow in SCT and green in TCT. In both tasks, after a 1-s delay, two response circles were presented above the central circle. The leftmost circle represented the “short” category, whereas the rightmost represented the “long” category. The subject had to move the cursor to the response circle that matched the category of the stimulus, that is, the category of the trial’s distance in the SCT or the interval in the TCT, based on previously acquired prototypes and boundaries (see below). Subjects were instructed to maintain their gaze in a fixation point located inside the central circle during trial execution.
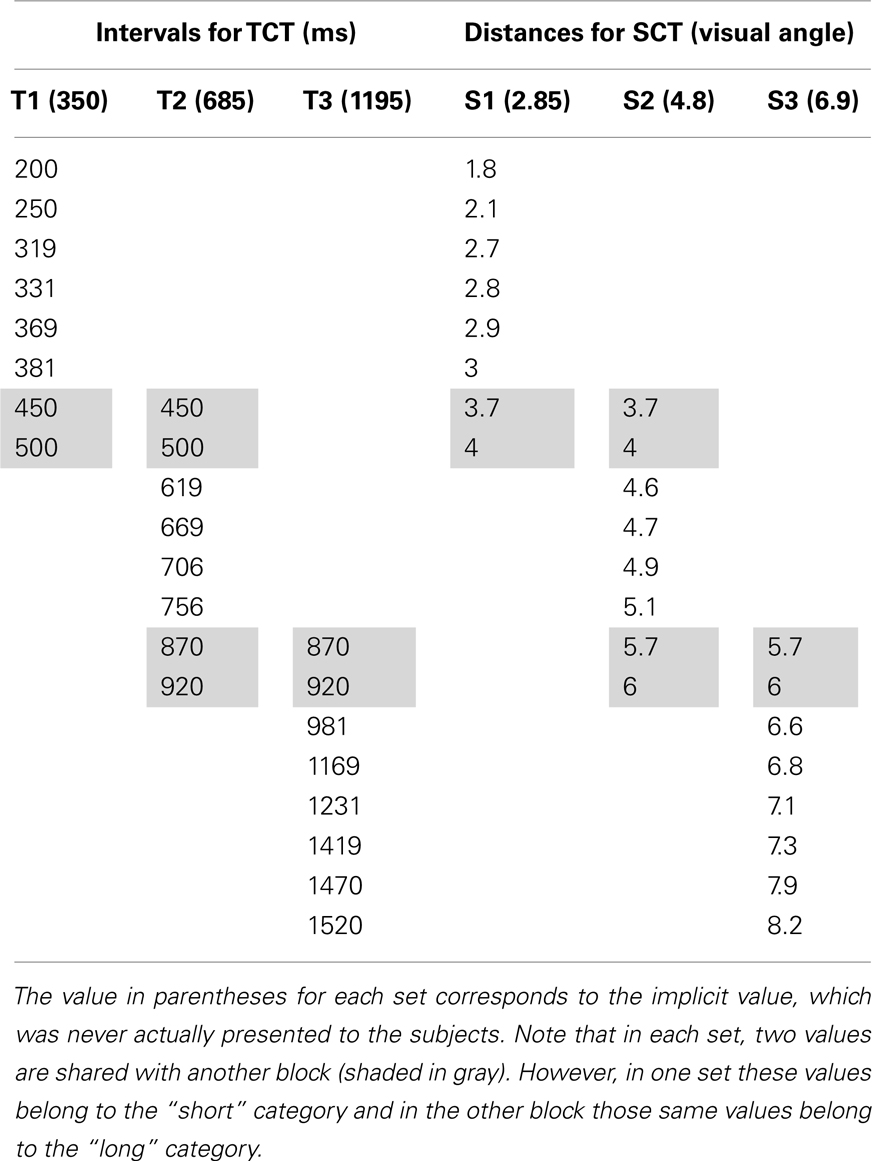
Table 1. Time and distance values used in TCT and SCT in human subjects.
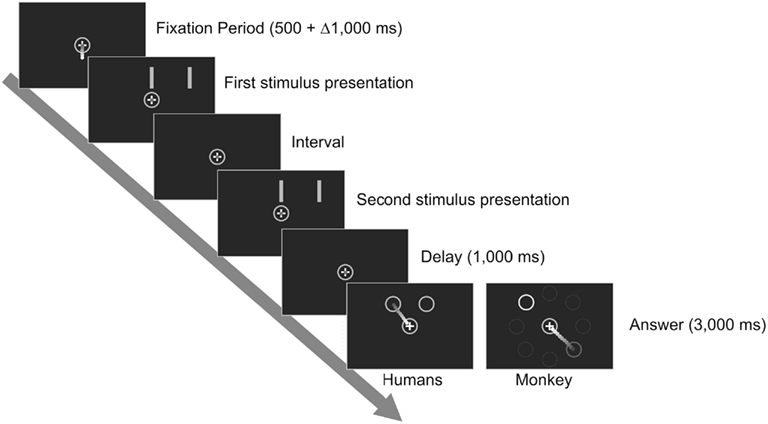
Figure 1. Sequence of events in a trial of the Categorization Tasks. In SCT the distance between the bars changes from trial to trial but the interval is the same in all trials. In TCT the interval varies from trial to trial but the distance between the bars remains constant. Humans reported their decision by introducing the cursor inside the leftmost circle if they categorized the stimulus as “short” or inside the rightmost circle if they categorized it as “long.” The monkey moved the cursor toward the circle with an orange outline if its decision was “short” and toward the circle with a blue outline if its decision was “long.” Depicted are the eight possible positions that the response circles could adopt in the monkey response configuration. In a particular trial only the two response circles were visible.
In order to categorize the stimuli, subjects first had to acquire a criterion. To accomplish this, the first 24 trials were part of the “Training Phase” in which only the shortest and the largest distances or intervals, corresponding to the category prototypes, were presented in an alternate fashion. We expected that in this way, subjects generated a mental implicit value, that is the distance or the interval midway between the two prototypes presented, which would serve as a limit or boundary between categories (see Table 1). The correct response circle was highlighted to the subject with a green outline while the incorrect one had a red outline. When the subject placed the cursor inside the correct circle, the word “correct” appeared under the central circle. Otherwise, the word “incorrect” would be read. The 96 trials that followed were regarded as part of the “Testing Phase,” in which the eight values were presented randomly from trial to trial. Each value appeared 12 times and the 96 trials constitute one block. In this phase, both response circles had a green outline, so the only information available to the subject to solve the task was the distance or the interval. No feedback was provided during this phase.
We captured the relative nature of the categorization process in the following way: We created three different sets containing eight stimuli values each, for both tasks (labeled S1, S2, and S3 for the SCT and T1, T2, and T3 for the TCT). The values in these sets were arbitrarily defined after preliminary tests with human subjects in which the aim was to obtain sigmoid-shaped psychometric curves. Only one set of stimuli was used in a particular block of trials (see Table 1). The three sets used on each task represent a continuum across the space or time spectrum and, importantly, were partially overlapped: the two shortest and the two longest values of the middle set were exactly the same as the two longest values of the first set and the two shortest values of the third set, respectively. This means that one particular value could be correctly categorized either as “short” or as “long” depending on the context, that is on the particular set being used in that block. All subjects did both tasks with the three sets for a total of six blocks. The order in which the tasks were performed was assigned randomly for each subject but they decided how many sessions they needed to complete them (two or three).
Analysis
Subroutines written in Matlab (MathWorks v. 7.6.0.324) and the SPSS statistical package (version 17, SPSS Inc., Chicago, IL, USA, 2008) were used for statistical analyses. The psychophysical relative threshold was calculated for each subject and for each block of trials from the subject’s psychometric curve, where the probability of long-interval categorization was plotted as a function of the stimulus magnitude. A logistic function was fitted to these data, and the relative threshold was computed as half the subtraction of the interval or the distance at 0.75p and at 0.25p. The psychophysical relative threshold is a measure of the amount of change that a stimulus must have in the studied dimension to be detected by the subject. In addition, the point of subjective indifference (PSE) was calculated as the interval or distance at 0.5p in the psychometric curves. Then, the constant error was defined as the difference between the PSE minus the implicit interval or distance.
The relative thresholds of each subject on each of the six blocks were used in a correlation analysis. The rationale behind this analysis is that if a common system is being used to solve these tasks, then a subject’s performance must be very similar throughout the six blocks. The level of statistical significance to reject the null hypothesis was α = 0.05.
Monkeys
Participant
One male Rhesus monkey (Macaca mulatta, 5.5 kg) was tested. All the experimental procedures were approved by the National University of Mexico Institutional Animal Care and Use Committee and conformed to the principles outlined in the Guide for Care and Use of Laboratory Animals (NIH, publication number 85–23, revised 1985).
Materials
The monkey performed the tasks using the same instruments as humans. It was seated in a primate chair with its head restrained by a head halo. The position of its gaze was monitored throughout the experiments with an infrared eye scanner (ISCAN, Inc., Woburn, MA, USA).
Tasks
The monkey performed TCT and SCT. The sequence of events in a trial was almost identical to the one described for humans with one exception: in this case, the outline of one response circle was now orange and was associated with the “short” category, whereas the other circle’s outline was blue and was associated with the “long” category. In this way, the response circles’ position could be varied on each trial without losing the stimulus–response association. Each circle could occupy one of eight possible locations around the central circle (see Figure 1). This manipulation was implemented to dissociate possible relationships between the categorization process and the motor implementation of the decision communication in future neurophysiological experiments. During the “Training Phase,” the color of the stimulus bars matched the color of the correct target, forcing the monkey to make a color-category association. Again, only the extreme values were presented during this phase, helping the monkey to create a mental implicit value. In the “Testing Phase” the color of the stimulus bars was always the same as the central circle’s, that is yellow in SCT and green in TCT, regardless of the stimulus category. Correct trials were rewarded in both phases with drops of juice, with a greater amount delivered in the Testing Phase because of the greater difficulty of these trials. Also, in TCT, reward was adjusted to be proportional to the set of values being categorized in order to avoid a preference for the shorter intervals: blocks performed with T2 gave the monkey more juice than T1 blocks, but less juice than T3 blocks. It is important to mention that the values used in TCT were the same as the ones used by humans. However, the values used in SCT were slightly larger (Table 2).
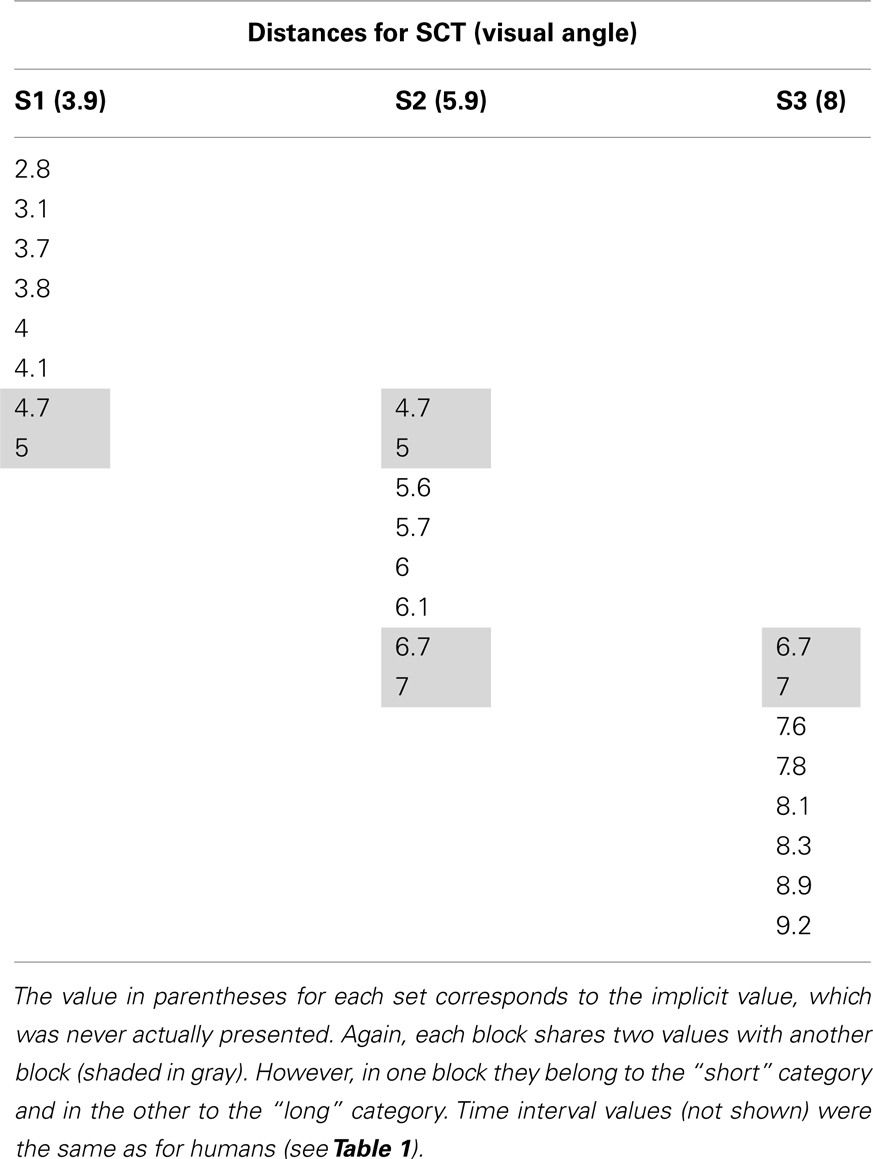
Table 2. Distance values used in SCT with the monkey.
Training
The monkey was trained using classical conditioning techniques with drops of juice as a reward for every correct trial. Food was provided ad libitum in its cage but water was only available during training sessions. Body weight was strictly controlled and extra water was provided if needed. The monkey was trained 6 days a week for sessions of 2–3 h of duration in which it consumed around 200 ml of juice (see Zarco et al., 2009). We first determined hand dominance by placing the monkey in the primate chair in front of the computer monitor with the joystick at arm-reaching distance and rewarding joystick grasping, which it did preferentially with its right hand. After that, training proceeded with its left arm restrained and the following increasingly complex behaviors were sequentially rewarded: First, the monkey had to move and maintain the cursor inside a yellow central circle. Then, it had to move the cursor to a response circle that appeared at random positions in the periphery. The color of this circle could be either blue or orange from trial to trial. The next step was waiting inside the central circle for the presentation of the two-bar stimulus, which also varied randomly in color between blue and orange, before moving to the single response circle. Even though the stimulus was irrelevant at this time, its’ color and that of the response circle always matched. The distance between the bars and their color were also co-varied, so when the color was orange, the distance was short (1.8° of visual angle, the shortest distance of set S1) and when the color was blue, the distance was long (8.2° of visual angle, the longest distance of set S3). Learning this took around 1 month.
A new level of difficulty was introduced by presenting the two response circles, orange and blue, simultaneously with a 1-s delay after stimulus presentation in pseudorandom positions around the central circle. The stimulus then became relevant, since the monkey had to remember its color and take the cursor to the response circle that matched it. This task was essentially the same as the “Training Phase” of SCT. The monkey learned this rule after approximately 5 months of training.
Once this had been achieved, we surgically implanted three head posts for skull fixation to a halo that maintained the monkey’s head in the same position during training (see Merchant et al., 2001 for details in the surgery). This allowed us to train the monkey to fixate its gaze in a window centered in the middle of the monitor. If the monkey exited this window before the presentation of the response circles, the trial was aborted and the fixation point flashed briefly. The diameter of this window was systematically reduced until the monkey performed the tasks with a 4° diameter window. We then introduced testing trials in which the color of the bars was the same as the central circle’s and the only information available to solve the task was the distance between them. The monkey had to take the cursor to the orange circle if the distance was short and to the blue circle if the distance was long. This task was essentially the same as the “Testing Phase” of SCT and it was done initially with the two extreme distances mentioned above. Once the monkey had learned the rule, we progressively shortened the difference between the “short” and “long” distances, added intermediate distances, and used different “short” and “long” prototypes for particular blocks of trials until the monkey was performing SCT with the three different value sets. However, after several weeks of training, the monkey rarely did the task using S1 values with a performance above chance. This forced us to increase slightly the distances tested (Table 2). Reaching a stable performance with blocks above 70% of correct trials took around 6 months. Once this task had been learned, training in TCT was started from the “Training Phase.” The central circle was now green and only two extremely different intervals (200 and 1520 ms) were presented from trial to trial. Again, when the short interval was presented, the stimulus bars were orange and when the long-interval was presented, the bars were blue. Training then proceeded in the same fashion as for SCT, with the progressive introduction of testing trials and the three different sets of intervals. In the end, around 2 years were needed for the monkey to perform the two tasks.
Analysis
As for humans’ data, subroutines written in Matlab (MathWorks v. 7.6.0.324) and the SPSS statistical package (version 17, SPSS Inc., Chicago, IL, USA, 2008) were used for the statistical analyses. Again, the psychophysical relative threshold was used as a measure of the monkey’s sensitivity. The PSE and the constant errors were also obtained as described for humans. In this case, the thresholds and constant errors were calculated for 19 blocks in the TCT and seven blocks in the SCT where the three set of stimuli showed a performance above 70% of correct trials and were computed in the same way as for humans. The level of statistical significance to reject the null hypothesis was α = 0.05.
Results
Human and Monkey Performance
Twenty-five human subjects and one monkey were tested on two relative categorization tasks in which either time intervals or distances in the millisecond and millimeter range respectively, were categorized as “short” or “long” according to previously instructed prototypes. Figure 2A shows the psychometric curves of both species for the three sets of values of TCT, in which the same stimuli were categorized by human subjects and the monkey. It can be seen that the curves are very similar across species, following the typical sigmoid shape characteristic of psychometric functions. Also, the slope of these curves decreases as a function of the values being categorized which implies that the scalar property is present in temporal categorization. This is more evident in Figure 2C, where the relative thresholds of the three curves are plotted as a function of the implicit value of the corresponding set of stimuli. Indeed, an ANOVA was carried out using the thresholds as dependent variable and the species as factors, and the results showed no significant differences in the timing thresholds between human subjects and monkeys [F(1,130) = 2.22, p = 0.138]. In addition, linear regressions between the timing threshold and the three implicit intervals were performed for each human subject and for each behavioral run in the monkey. Then, we performed ANOVAs where the slope or the intercept of such regressions were the dependent variable and the specie was the factor. The results showed no significant differences between species in neither the slope [F(1,42) = 1.73, p = 0.196] nor the regression intercept [F(1,42) = 0.001, p = 0.978], suggesting that the psychometric behavior in humans and Rhesus monkeys was very similar for interval categorization.
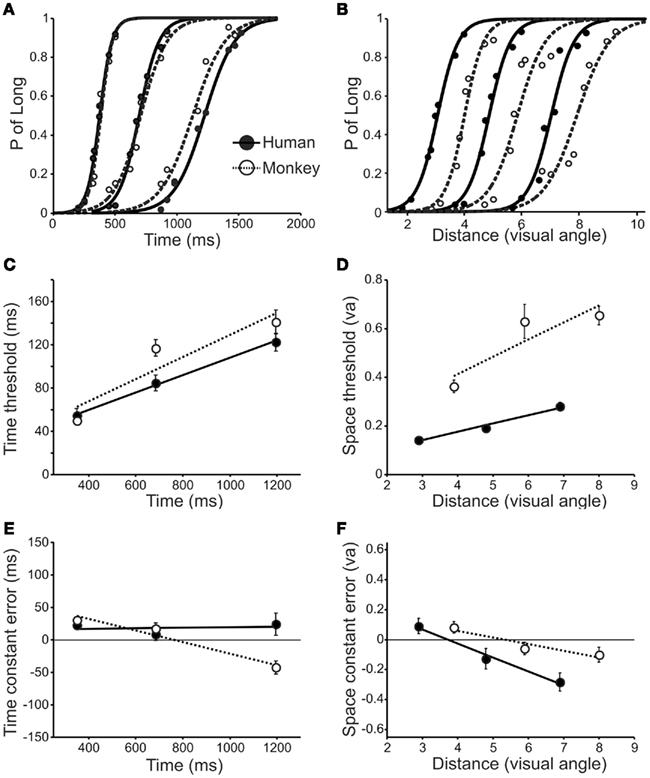
Figure 2. (A,B) Psychometric curves of the human subjects and the monkey for the three sets of values used in TCT (A) and SCT (B). (C,D) Relative thresholds during TCT (C) and SCT (D) as a function of the implicit values used in both species. (E,F) Constant error as a function of implicit values during TCT (E) and SCT (F); the horizontal line at zero corresponds to perfect accuracy. For thresholds and constant errors the lines correspond to the best linear regression models. Human subjects are depicted in solid lines and filled circles and the monkey in dotted lines and open circles.
The scenario was different for spatial categorization. Figure 2B shows the psychometric curves for SCT of both species. Again, both species present sigmoid-shaped curves, but the slope is evidently steeper for humans than for monkeys, especially for the larger distances. As shown in Figure 2D, the relative thresholds were larger in the monkey than in human subjects [ANOVA, F(1,94) = 133.9, p < 0.0001]. However, as was the case in TCT, the spatial relative thresholds also showed an increase as a function of the implicit distance, and therefore, we performed linear regressions between these parameters for each human subject and across behavioral runs in the monkey. The corresponding ANOVAs showed a significant increase in the regression slope [ANOVA, F(1,30) = 9.43, p = 0.005] and intercept [ANOVA, F(1,30) = 6.73, p = 0.015] in the monkey with respect to human subjects. These results indicate that the categorization of distances between spatial stimuli was not as precise in macaques as in humans, at least for the range tested in the present study. Nevertheless, Weber’s law is evident in both species.
On the other hand, we compared the constant error between species for the SCT and TCT (Figures 2E,F). Positive and negative constant errors are associated with under- and overestimation, respectively. For the TCT this measure was close to zero across implicit intervals in human subjects, whereas it showed a linear decrease as a function of the implicit interval in the monkey. The ANOVA showed marginal differences between species [F(1,130) = 3.88, p = 0.051]. In contrast, during the SCT the constant error showed a linear decrease as a function of implicit distance in both species with no significant differences between humans and monkeys [F(1,94) = 1.99, p = 0.161]. Overall, the constant error across implicit values was very close to zero for both species and tasks, which means that their estimation of the implicit value was very accurate.
To summarize, these findings suggest that the neural mechanisms for temporal categorization are similar between human subjects and macaques. Both species showed similar relative thresholds and a similar increase in temporal variability as a function of the implicit interval, following the scalar property of interval timing. In contrast, the monkeys showed larger relative thresholds for the SCT that could be due to differences in the processing of spatial information, the memory storage of spatial prototypes, or the decision process.
Human Space–Time Interactions
Previous studies have found that individual differences in the variability of execution of different timing are correlated (Keele et al., 1985; Spencer and Zelaznik, 2003; Merchant et al., 2008). This means that subjects that are good timers in one behavioral context are good timers in another one. Thus, the existence of significant intra-subject correlations in the temporal variability across different timing tasks has been taken as an indication of a common timing mechanism. In the present paper we used the individual variation in the thresholds for temporal and spatial categorization in order to determine whether there was a common magnitude mechanism across tasks. Correlations were carried out on the Z-scored relative threshold in order to analyze the precision of individual subjects between pairs of tasks.
Figure 3 shows the correlation matrix obtained from the comparison of the psychophysical relative thresholds of all the subjects in all the tasks. Three important results stem from this analysis: First, the three TCT sets were significantly correlated with each other (Pearson R T1–T2 = 0.694; T2–T3 = 0.348; T1–T3 = 0.454), a result that goes in accordance with the timing literature that proposes that at a single neural mechanism deals with time processing in the hundreds of milliseconds range (Gibbon et al., 1997). In contrast, in the case of SCT only S2 and S3 correlated significantly with each other (R = 0.338). Importantly, these were also the sets that correlated with the sets used for TCT. S2 correlated with T2 (R = 0.378) and S3 correlated with all three TCT sets (T1–S3 = 0.421; T2–S3 = 0.378; T3–S3 = 0.344). Blocks done with S1 values did not correlate with any other of the SCT or the TCT blocks.
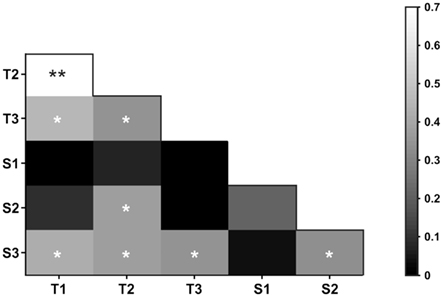
Figure 3. Correlation matrix showing the Pearson R value in a grayscale (inset, right) for all possible pairwise block comparisons. Asterisks indicate significant correlations (*p ≤ 0.05, **p ≤ 0.01).
These results support the hypothesis that at least in some scales temporal and spatial processing may be supported by common neural circuits. Furthermore, the fact that only some sets of distances correlated with each other and with the sets of intervals used, suggests that there may be sub-circuits specialized for the processing of narrow sub-ranges of distances and intervals which would be considered as equivalent magnitudes.
Monkey Space–Time Interactions
Due to the long training period in the monkey, it was impossible to use the individual differences in the performance variability between tasks to test whether a common magnitude mechanism exists across multiple Rhesus monkeys. Instead, we took advantage of the thousands of trials performed by the monkey in the SCT and TCT. The approach followed was to evaluate the effects of the set of values used in the previous block over the categorization performance of the current block during its initial and final trials within the SCT and TCT blocks, and then to determine the space–time interactions on this measure of categorization carryover. For this purpose, we first computed the normalized value of the difference in the number of correct trials between long minus short stimuli for the 20 initial test trials in the current block. A negative value of this normalized categorization bias indicates that the previous block-prototypes had an underestimation effect on the initial execution of the current block, whereas a positive value indicates an overestimation effect from the previous to the current categorization block. Indeed, Figure 4A shows that when the previous block was larger than the current one, there was a significant underestimation of the current block stimuli (t-test, p < 0.05), whereas when the previous was smaller than the current block there was a significant overestimation on the current block (t-test, p < 0.05). These effects were similar within the TCT (filled circles) and SCT (open circles) and were more evident between the sets T1 and T3, and between S1 and S3 (P>> and P<<, respectively) as shown in Tables 1 and 2. In contrast, when the normalized categorization bias was computed for the last 20 trails of the current block no significant under- or overestimation carryover effect was observed (Figure 4B). These results suggest that the previous short and long prototypes, within spatial or temporal categorization, had an initial influence on the current categorization performance, generating a bias that was congruent with the magnitude of the previous minus current block difference. The results also suggest that the influence of previous categorization prototypes was washed-out during task performance using newly instructed prototypes.
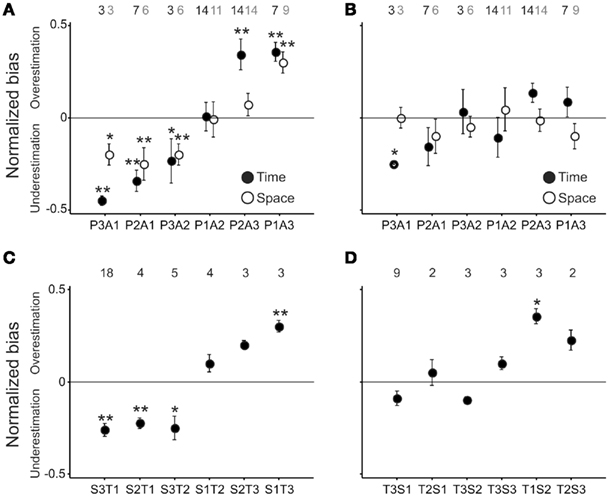
Figure 4. Normalized categorization bias as a function of the difference between the previous and current blocks of stimuli. (A) Normalized bias for the initial 20 trials of the current block for TCT (solid circle) and SCT (open circle). (B) Normalized bias for the last 20 trials of the current block for TCT (solid circle) and SCT (open circle). In both (A,B) the ordinate labels correspond to the notation PnAn, where P is for previous and A for actual stimulus, and n is the set number. (C) Normalized bias for the initial 20 trials of the current block, when the current was TCT and the previous SCT (i.e., S3–T1 corresponds to a current T1 and a previous S3). (D) Normalized bias for the initial 20 trials of the current block, when the current was SCT and the previous TCT. The number of runs analyzed for each combination is depicted on top of each panel; for (A,B) the black and gray numbers correspond to TCT and SCT, respectively. *p ≤ 0.1, ** p ≤ 0.05.
The next step was to evaluate whether the normalized categorization bias showed the same under/overestimation between the spatial and temporal categorization performance. The results showed that when the previous block was SCT and the current was TCT, there was congruent under- and overestimation on the initial 20 trials of the current block, with significant effects for the extreme magnitudes (S3 and T1, S1 and T3, t-test, p < 0.05; Figure 4C). These cross-magnitude carryover effects were smaller when the previous block was TCT and the current was SCT (Figure 4D).
These findings support the notion of a common magnitude mechanism across space and time, where the storage in memory of categorical prototypes from a previous block of trials of space has an influence on the current categorization performance of time. Consequently, it is possible that the memory representation of categorical prototypes has a similar neural representation for the two magnitudes.
Discussion
Many previous papers have addressed the ability of Rhesus monkeys to categorize a wide variety of stimuli, from concrete objects (Freedman et al., 2001) to abstract entities (Romo et al., 1997; Freedman and Assad, 2006). In the same line, the first important result of our work is that the monkey was able to categorize time intervals and distances. In fact, its performance in TCT was comparable to humans’. This implies that their timing, memory, and decision mechanisms may be very similar to ours, at least for the processing of single intervals. In this respect, results from our own laboratory (Zarco et al., 2009) have pointed out that monkeys are capable of producing timed movements, but their performance is significantly better when single, rather than multiple intervals, are generated. In turn, this may be a consequence of the ecological significance of timing for both species. While humans need to explicitly time multiple intervals for complex behaviors, such as dance or language, monkeys rarely process more than one interval.
The monkey was not as good in the SCT as it was in TCT. It required a distance of a minimum of 2.8° of visual angle to have a performance above 70%, whereas humans had no problem categorizing distances below 2°. This may also be related to the environment in which the two species live, with humans manipulating tools, discriminating letters, and handling objects much smaller than monkeys do. Of course, a possibility exists that this particular monkey was not good at categorizing distances. However, preliminary results with a second monkey show a similar trend. Yet, the monkey was able to correctly categorize the spatial magnitude and, in the same way as humans, presented an increase in the relative threshold which means it is in accordance with Weber’s law.
The constant errors, a measure of the accuracy of the categorization, showed that both species performed well in their estimation of the implicit values for each set. However, a tendency to underestimate the smaller values and to overestimate the larger ones was found for both tasks in monkeys, but only for SCT in humans. It has been argued the constant error is adjusted constantly as a function of the previous tasks, which reflects the influence of the global context on the current state of the system (Jones and McAuley, 2005). In this regard, it is possible that our experimental design accounts for some of the observed differences: the monkey performed at least six blocks per session, which would be sufficient for the constant error to be adjusted and minimized around the middle values. In contrast, humans normally performed only two or three blocks per session which would prevent the influence of previous blocks.
Another relevant finding is that there is a correlation between distance and interval categorization in humans. These results are in accordance with the hypothesis of an overlapped neural mechanism for the processing of these two magnitudes. However, not all the distances and intervals that we tested shared the same behavior. Categorization of distances below 3.7° of visual angle did not correlate with categorization of larger distances nor with any of the intervals. Conversely, larger distances not only correlated with each other but also with the time intervals used. This points toward possible subsets of the hypothetical magnitude processing circuits, each of which would be responsible for the quantification of different subscales. In this regard, distances in the 3.7–8.2° range may share the same neural substrate for estimation as intervals around 200 and 1520 ms. However, the degree of overlap may not be that straightforward. Distances between 3.7° and 6° only correlated with larger distances and with intervals between 450 and 920 ms. While more research is needed to support this notion, this result goes in hand with findings describing progressively wider tuning curves for the processing of bigger magnitudes (Nieder and Merten, 2007; Bartolo and Merchant, 2009; Merchant et al., 2011). In this sense, circuits that quantify larger distances would also be used to measure a broader range of intervals. Results obtained by Casasanto and Boroditsky (2008) may be considered as complementary to ours. They analyzed the influence that distances in the 7° to 27° range and intervals between 1,000 and 5,000 ms had on the estimation of each other. One of their results implies that for the 3,000 ms interval performance was best when presented together with a distance of 27° (800 pixels at the viewing distance and monitor resolution reported).
Finally, we investigated the carryover effect of the previous prototypes on the initial categorical performance with different current sets of values for the monkey. Within the spatial or temporal magnitudes the carryover found suggests an interference of the memory representation of the previous over the current prototypes. This interference might be due to the competition for the same neural substrates between the memory representation of the prototypes within each magnitude. In fact, a large set of studies in motor control have suggested that the interference between movement parameters in adaptation tasks of position-dependent visuomotor rotations (Tong et al., 2002) and velocity-dependent force fields (Brashers-Krug et al., 1996; Shadmehr and Brashers-Krug, 1997) are an evidence of shared neural resources for the encoding of these parameters. In addition, as in these motor adaptation tasks, we found a washout effect of the previous over the current block performance, emphasizing the dynamic and labile nature of the working memory representation of categorical prototypes. More importantly, the results also showed a cross-magnitude carryover effect of the previous spatial prototype on the initial performance of the current set of temporal stimuli but not the other way around. This is a similar finding to Casasanto and Boroditsky’s, (2008) for human subjects but not for monkeys (Merrit et al., 2010). They attribute this space–time asymmetry in humans to a metaphorical representation of more abstract entities, such as time, with entities that can be perceived through the senses, such as space. They also propose several explanations for the absence of this asymmetry in monkeys, among them language-related differences and the lack of mental time-travel abilities. However, the fact that we found a greater influence of space on temporal categorization in the trained monkey implies that this asymmetry may be rooted in the neural circuits for magnitude processing, irrespective of language or other complex abilities. Of course, our results come from only one monkey and more animals need to be tested in these and similar tasks. Nevertheless, these data support the hypothesis of a common or partially overlapping neural mechanism for the working memory storage of categorical information of time and space. Hence, the present findings increase the list of psychophysical approaches to study the nature of common neural underpinnings of complex variables, such as time and space, using categorization behavior (Wright et al., 1997; Nagarajan et al., 1998).
To conclude, using different analytical approaches in human subjects and monkeys we have found evidence that implies that the primate brain uses a common or partially overlapping mechanism to represent categorical information about space and time. In addition, the results showed that the categorization abilities of a Rhesus monkey are similar to human subjects’, especially for interval durations. Hence, the present paper indicates that the Rhesus monkey is a good animal model for studying the basis of spatial and temporal categorization. Indeed, the final goal of our research program is the neurophysiological study of the brain signals behind these highly complex cognitive abilities.
Conflict of Interest Statement
The authors declare that the research was conducted in the absence of any commercial or financial relationships that could be construed as a potential conflict of interest.
Acknowledgments
We thank Raúl Paulín for his technical assistance and the Graduate Program in Biomedical Sciences of the Universidad Nacional Autónoma de México. Supported by CONACYT: 053944 and 244466, PAPIIT: IN200511-22. Funding source: TIMELY COST ISCH TD0904.
References
Bartolo, R., and Merchant, H. (2009). Learning and generalization of time production in humans: rules of transfer across modalities and interval durations. Exp. Brain Res. 197, 91–100.
Basso, G., Nichelli, P., Frassinetti, F., and Di Pellegrino, G. (1996). Time perception in a neglected space. Neuroreport 7, 2111–2114.
Brashers-Krug, T., Shadmehr, R., and Bizzi, E. (1996). Consolidation in human motor memory. Nature 382, 252–255.
Bueti, D., and Walsh, V. (2009). The parietal cortex and the representation of time, space, number and other magnitudes. Philos. Trans. R. Soc. B Biol. Sci. 364, 2369–2380.
Buhusi, C. V., and Meck, W. H. (2005). What makes us tick? Functional and neural mechanisms of interval timing. Nat. Rev. Neurosci. 6, 755–765.
Casasanto, D., and Boroditsky, L. (2008). Time in the mind: using space to think about time. Cognition 106, 579–593.
Cohen Kadosh, R., Gertner, L., and Terhune, D. B. (2011). Exceptional abilities in the spatial representation of numbers and time: insights from synesthesia. Neuroscientist 17, 1–8.
Correa, A., and Nobre, A. C. (2008). Spatial and temporal acuity of visual perception can be enhanced selectively by attentional set. Exp. Brain Res. 189, 339–344.
Freedman, D. J., and Assad, J. A. (2006). Experience-dependent representation of visual categories in parietal cortex. Nature 443, 85–88.
Freedman, D. J., Riesenhuber, M., Poggio, T., and Miller, E. K. (2001). Categorical representation of visual stimuli in the primate prefrontal cortex. Science 291, 312–316.
Gibbon, J., Malapani, C., Dale, C. L., and Gallistel, C. (1997). Toward a neurobiology of temporal cognition: advances and challenges. Curr. Opin. Neurobiol. 7, 170–184.
Jones, M. R., and McAuley, J. D. (2005). Time judgments in global temporal contexts. Percept. Psychophys. 67, 398–417.
Keele, S. W., Pokorny, R. A., Corcos, D. M., and Ivry, R. (1985). Do perception and motor production share common timing mechanisms: a correctional analysis. Acta Psychol. (Amst) 60, 173–191.
Maddox, W. T. (2002). Toward a unified theory of decision criterion learning in perceptual categorization. J. Exp. Anal. Behav. 78, 567–595.
Merchant, H., Bartolo, R., Mendez, J. C., Perez, O., Zarco, W., and Mendoza, G. (2011). “What can be inferred from multiple-task psychophysical studies about the mechanisms for temporal processing?” in Time and Time Perception, ed. A. Vatakis (Berlin: Springer LNCS/LNAI series), 207–229.
Merchant, H., Battaglia-Mayer, A., and Georgopoulos, A. P. (2001). Effects of optic flow in motor cortex and area 7a. J. Neurophysiol. 86, 1937–1954.
Merchant, H., Zainos, A., Hernández, A., Salinas, E., and Romo, R. (1997). Functional properties of primate putamen neurons during the categorization of tactile stimuli. J. Neurophysiol. 77, 1132–1154.
Merchant, H., Zarco, W., and Prado, L. (2008). Do we have a common mechanism for measuring time in the hundreds of millisecond range? Evidence from multiple-interval timing tasks. J. Neurophysiol. 99, 939–949.
Merrit, D. J., Casasanto, D., and Brannon, E. M. (2010). Do monkeys think in metaphors? Representations of space and time in monkeys and humans. Cognition 117, 191–202.
Nagarajan, S. S., Blake, D. T., Wright, B. A., Byl, N., and Merzenich, M. (1998). Practice related improvements in somatosensory interval discrimination are temporally specific but generalize across skin location, hemisphere, and modality. J. Neurosci. 18, 1559–1570.
Nieder, A., and Merten, K. (2007). A labeled-line code for small and large numerosities in the monkey prefrontal cortex. J. Neurosci. 27, 5986–5993.
Romo, R., Merchant, H., Zainos, A., and Hernández, A. (1997). Categorical perception of somesthetic stimuli: psychophysical measurements correlated with neuronal events in primate medial premotor cortex. Cereb. Cortex 7, 317–326.
Roy, J. E., Riesenhuber, M., Poggio, T., and Miller, E. K. (2010). Prefrontal cortex activity during flexible categorization. J. Neurosci. 30, 8519–8528.
Shadmehr, R., and Brashers-Krug, T. (1997). Functional stages in the formation of human long-term motor memory. J. Neurosci. 17, 409–419.
Smith, J. D., Washburn, D. A., and Minda, J. P. (2004). Category learning in rhesus monkeys: a study of the Shepard, Hovland, and Jenkins (1961) tasks. J. Exp. Psychol. Gen. 3, 398–414.
Spencer, R. M., and Zelaznik, H. N. (2003). Weber (slope) analyses of timing variability in tapping and drawing tasks. J. Mot. Behav. 35, 371–381.
Teuscher, U., Brang, D., Ramachandran, V. S., and Coulson, S. (2010). Spatial cueing in time-space synesthetes: an event-related brain potential study. Brain Cogn. 74, 35–46.
Tong, C., Wolpert, D.M., and Flanagan, J. R. (2002). Kinematics and dynamics are not represented independently in motor working memory: evidence from an interference study. J. Neurosci. 22, 1108–1113.
Vallesi, A., Malcolm, A. B., and Schallice, T. (2008). An effect of spatial–temporal association of response codes: understanding the cognitive representations of time. Cognition 107, 501–527.
Walsh, V. (2003). A theory of magnitude: common cortical metrics of time, space and quantity. Trends Cogn. Sci. (Regul. Ed.) 7, 483–488.
Wright, B. A., Buonomano, D. V., Mahncke, H. W., and Merzenich, M. M. (1997). Learning and generalization of auditory temporal-interval discrimination in humans. J. Neurosci. 17, 3956–3963.
Keywords: time and space, categorization, psychophysics, Rhesus monkeys
Citation: Mendez JC, Prado L, Mendoza G and Merchant H (2011) Temporal and spatial categorization in human and non-human primates. Front. Integr. Neurosci. 5:50. doi: 10.3389/fnint.2011.00050
Received: 25 June 2011; Paper pending published: 09 July 2011;
Accepted: 21 August 2011; Published online: 08 September 2011.
Edited by:
Warren H. Meck, Duke University, USAReviewed by:
Domenica Bueti, Centre Hospitalier Universitaire Vaudois and University of Lausanne, SwitzerlandDustin Merritt, Duke University, USA
Copyright: © 2011 Mendez, Prado, Mendoza and Merchant. This is an open-access article subject to a non-exclusive license between the authors and Frontiers Media SA, which permits use, distribution and reproduction in other forums, provided the original authors and source are credited and other Frontiers conditions are complied with.
*Correspondence: Hugo Merchant, Instituto de Neurobiología, Universidad Nacional Autónoma de México Campus Juriquilla, Boulevard Juriquilla No. 3001, Queretaro, Mexico. e-mail: hugomerchant@unam.mx