Human processing of short temporal intervals as revealed by an ERP waveform analysis
- 1 Department of Human Science/Center for Applied Perceptual Research, Kyushu University, Fukuoka, Japan
- 2 Laboratory for Mathematical Neuroscience, RIKEN Brain Science Institute, Wako, Japan
To clarify the time course over which the human brain processes information about durations up to ∼300 ms, we reanalyzed the data that were previously reported by Mitsudo et al. (2009) using a multivariate analysis method. Event-related potentials were recorded from 19 scalp electrodes on 11 (nine original and two additional) participants while they judged whether two neighboring empty time intervals – called t1 and t2 and marked by three tone bursts – had equal durations. There was also a control condition in which the participants were presented the same temporal patterns but without a judgment task. In the present reanalysis, we sought to visualize how the temporal patterns were represented in the brain over time. A correlation matrix across channels was calculated for each temporal pattern. Geometric separations between the correlation matrices were calculated, and subjected to multidimensional scaling. We performed such analyses for a moving 100-ms time window after the t1 presentations. In the windows centered at <100 ms after the t2 presentation, the analyses revealed the local maxima of categorical separation between temporal patterns of perceptually equal durations versus perceptually unequal durations, both in the judgment condition and in the control condition. Such categorization of the temporal patterns was prominent only in narrow temporal regions. The analysis indicated that the participants determined whether the two neighboring time intervals were of equal duration mostly within 100 ms after the presentation of the temporal patterns. A very fast brain activity was related to the perception of elementary temporal patterns without explicit judgments. This is consistent with the findings of Mitsudo et al. and it is in line with the processing time hypothesis proposed by Nakajima et al. (2004). The validity of the correlation matrix analyses turned out to be an effective tool to grasp the overall responses of the brain to temporal patterns.
Introduction
When people are presented a sound or a pair of sounds for a time interval shorter than one second and asked later to finger-tap for the same duration, they are typically able to replicate the duration precisely, with some occasional biases (Woodrow, 1951; see also Povel, 1981). Similarly, people are generally capable of discriminating the relative durations of two time intervals of less than a second, making Weber ratios below 10% (e.g., Getty, 1975). These simple observations indicate that the human brain is able to register, store, reproduce, retrieve, and compare short time intervals, which Buhusi and Meck (2005) called “millisecond timing.” Indeed, processing time intervals below half a second is important in a number of situations for human beings, i.e., for motor control, speech generation and recognition, playing music, and dancing (Buhusi and Meck, 2005). There are a number of studies that have examined interval estimation within the millisecond range, including both psychophysical (e.g., Merchant et al., 2008; see Grondin, 2001 for a review) and neurophysiological studies (e.g., Gontier et al., 2007; Le Dantec et al., 2007; Gontier et al., 2009; Jin et al., 2009; Morillon et al., 2009; Harrington et al., 2010; see Gibbon et al., 1997; Macar and Vidal, 2004; Grondin, 2010 for reviews). They have addressed issues such as the laws and properties of time perception and timing processing, the cognitive modeling of such processing, and the underlying brain structures that mediate these processes. They have focused on veridical aspects of time perception and timing processing. However, the perceived or subjective durations can diverge from the actual duration in a consistent and systematic manner, as occurs when we are listening to musical rhythms. It is not clear how or when the representation of the actual duration is transformed in the brain into the representation of perceived duration.
In the present research, we focused on time perception of simple temporal patterns shorter than half a second. The participant was presented two neighboring empty time intervals marked by three successive tone bursts, and was asked to judge whether the two intervals had “equal” or “unequal” durations. An advantage of this paradigm is that we are able to dissociate physical equality and subjective equality of the two intervals exploiting an illusion called the “auditory temporal assimilation,” which has been demonstrated by Nakajima et al. (1991) followed by Miyauchi and Nakajima (2005) and ten Hoopen et al. (2006; see also Sasaki et al., 1998; and Hasuo et al., 2011). In a typical situation, two adjacent empty time intervals are marked by three tone bursts that are very likely to be perceived as having the same duration if the first time interval (t1) and the second time interval (t2) satisfy the following relationship: −80 ≤ t1–t2 ≤ 50 (ms).Note that the range is asymmetric around zero. Specifically, when t2 is longer than t1 by up to 80 ms (−80 ≤ t1–t2 < 0), t2 “shrinks” in its subjective duration as compared with its physical duration (see Figure 1 for a schematic illustration of the phenomenon). Making use of this illusion, we were able to generate a set of different temporal patterns that induced equal duration perceptions and another set of temporal patterns that did not induce equal duration perceptions to probe how temporal equality and inequality were distinguished in the brain.
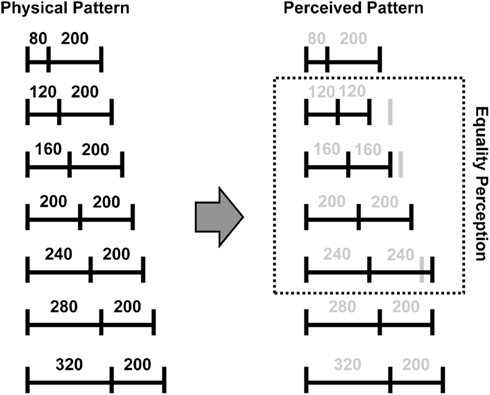
Figure 1. A schematic description of the equality perceptions of the temporal patterns used in the present study. Horizontal lines represent empty time intervals. Vertical lines represent tone bursts. Numbers indicate durations in milliseconds.
The auditory temporal assimilation may seem to be a specific instance of the time-order error (Fraisse, 1948; Allan, 1977; Hellström, 1985; Allan and Gibbon, 1994; see also Allan, 1979). However, as several investigators have argued (Sasaki et al., 2002; Nakajima et al., 2004), there are several differences between the extensively studied time-order error and the auditory temporal assimilation. First, the same patterns and magnitudes of the auditory temporal assimilation can be obtained robustly with a variety of psychophysical procedure, unlike the time-order error. Second, the magnitude of the perceptual change due to the auditory temporal assimilation can be as great as several tens of per cents. Third, the auditory temporal assimilation occurs only in a precisely restricted time range as described above.
Mitsudo et al. (2009) exploited this illusion and conducted event-related brain potential (ERP) experiments employing three-tone stimulus patterns. They measured EEGs while the participants were listening to a variety of temporal patterns. ERP waveforms were obtained by a conventional averaging method. In the judgment condition, the participants made judgments as to whether the two time intervals sounded equal in duration. In the no-judgment condition, they passively listened to the temporal patterns without judgments. For some temporal arrangements, the participants mostly perceived equality, either because the difference between them was below the limited accuracy of perceptual system, or because of the auditory temporal assimilation. In the other temporal arrangements, the participants mostly perceived inequality. Mitsudo et al. (2009) found a slow negative ERP component (SNCt) which was recorded from the right frontal recording sites immediately after the presentation of the whole temporal pattern in the judgment condition, but not in the no-judgment condition. Furthermore, they found that the SNCt was greater during the temporal patterns that were mostly perceived to have unequal durations.
The slow negative ERP component may be characterized in two ways. Because it is prominent in the comparison between the judgment and the no-judgment condition, it should be related to temporal judgment. In other words, it is a “time judgment” potential. In addition, because its amplitude is larger after perceptions of inequality than after perceptions of equality, it is also an “inequality detection” potential.
There was one unresolved issue in the study by Mitsudo et al. (2009). According to informal observations, the participants seem to have perceived equality or inequality even when it was not necessary to make related judgments. In the judgment condition, the SNCt was generated, and its amplitude allowed us to discriminate the participant’s perception of temporal equality and inequality. In contrast, in the no-judgment condition, the SNCt was not observed. Accordingly, we have sought in the present study to develop a general scheme in which subjective equality or inequality can be extracted from brain-derived signals.
We reanalyzed the data reported by Mitsudo et al. (2009) to clarify the automatic processing of temporal patterns in the brain. We attempted to establish a method to probe the potential process that differentiates inequality from equality both in the judgment and in the no-judgment condition. One difficulty in observing the relationship between the brain responses to various temporal patterns was that the grand average waveforms are often unable to be compared directly in the time domain because different temporal patterns have different total durations. If we time-lock our analysis to the onset of the first tone so that we can investigate the brain responses during the presentation of the temporal pattern, then the ends of the presentation of the temporal patterns would be misaligned. If we time-lock our analysis to the onset of the third tone so that we can investigate the brain responses after the presentation of the temporal pattern, then the starts of the presentation of the temporal patterns would be misaligned. We thus propose a way to avoid this kind of problem: to calculate correlation matrices across recording sites for each temporal pattern in the judgment and in the no-judgment condition. Unlike the direct comparison, individual time points are independent in the calculation of the correlation matrix. Irrespective of to which time point we may time-lock the data, critical variations between the recording sites are represented in the correlation matrix. If the same pattern of covariation appears at one interval in one time-series and at a different interval in another time-series, the covariation is reflected in the same manner in the resulting correlation matrices. We obtained and compared such correlation matrices.
Materials and Methods
ERP Recording
The data reported by Mitsudo et al. (2009) were combined with additional data they obtained after publication. The combined data were reanalyzed under the approval of the ethical committee of the Faculty of Design, Kyushu University. Details of the experiment are briefly reviewed here. EEGs were recorded from 19 scalp electrodes on a total of 11 adult participants. EEGs were sampled at 683 Hz and bandpass-filtered for the components between 0.27 and 300 Hz. The stimuli consisted of two adjacent empty time intervals marked by three successive 1000-Hz tone bursts that lasted 20 ms. The duration of the first time interval (t1) varied from 80 to 320 ms in steps of 40 ms (80, 120, 160, 200, 240, 280, and 320 ms). The duration of the second time interval (t2) was fixed at 200 ms (see Figure 1). There were also “dummy” trials where the duration of t2 was not 200 ms, so that the participants should not assume t2 was fixed and base their judgment only on t1. EEGs were not recorded during the dummy trials. There were two conditions in this experiment. In the judgment condition, the participants made judgments as to whether or not t1 and t2 had the same duration subjectively. They responded by pressing one of two buttons after each stimulus presentation. In the no-judgment condition, they listened to the temporal patterns without making judgments. They pressed one of the two buttons after each presentation, as a control for the motor behavior that was exhibited in the judgment condition. The no-judgment condition was presented to each participant before the judgment condition. The grand average waveforms were calculated after a standard artifact rejection procedure.
Categorization of the Temporal Patterns
The participants consistently rated the intervals as equal when t1 = 120, 160, 200, or 240 ms while t2 = 200 ms, but not when t1 = 80, 280, or 320 ms. Thus, we categorized the stimulus temporal patterns based on t1 (as indicated in parentheses) into (1) temporal patterns that produced perceptions of equality between t1 and t2 in most trials (120, 160, 200, or 240 ms) and (2) temporal patterns that produced perceptions of inequality in most trials (80, 280, or 320 ms). These patterns will be referred to as the equality patterns and the inequality patterns. Note that an equality pattern does not imply t1 and t2 were physically equal.
Multidimensional Scaling Analysis
We used a time window that extended from the onset of the second tone burst up to 600 ms after the onset. We computed a correlation matrix of the grand average waveforms across the 19 recording sites in this time window for each temporal pattern for each condition as follows:
where x is a 19 by 410 matrix representing the grand average waveform for each recording site, i and j denote the recording sites, and k denotes the time point. C is a 19 by 19 correlation matrix.
We then defined a separation between two matrices as the sum of squares of element-by-element differences between these correlation matrices.

where X and Y are 19 by 19 correlation matrices, and i and j denote the row and column which correspond to the recording sites.
We thus calculated the separation between each pair of the temporal patterns. For example, we define a separation between the brain response to the t1 = 80 ms pattern and that to the t1 = 120 ms pattern as follows:
where Ct1 is the correlation matrix calculated from the selective grand average waveform for t1.
The obtained separations were considered to be dissimilarity measures and subjected to a metric multidimensional scaling (MDS) to visualize the represented relationships between the temporal patterns. The dissimilarity matrix was as follows:

where s(i) and s(j) were either 80, 120, 160, 200, 240, 280, or 320 ms. The dissimilarity matrix was 7 by 7 if only one of the judgment and the no-judgment condition was considered, and it was 14 by 14 if both conditions were included.
In order to examine the robustness of the result of MDS, a bootstrap approach was undertaken. Namely, the data x was resampled and the whole procedure was repeated several times (10 times for the MDS analysis and 30 times for the time course analysis described later). An MDS result was discarded when the dissimilarity matrix was 7 by 7 and the stress was greater than 0.1 or when the dissimilarity matrix was 14 by 14 and the stress was greater than 0.2. Each trial in the bootstrapping procedure was represented by a plot in the MDS space. If a scatter of plots in an MDS configuration is dense, this indicates that the results are robust. The MDS was performed using MATLAB R2010b.
Time Course Analysis
Over the grand average ERP waveforms, we postulated fifty-one 100-ms time windows moving in 10-ms steps covering the 600-ms interval from the onset of the second tone burst to 400 ms after the onset of the third tone burst. For each time window, we computed the correlation matrix of the grand average waveforms across the 19 recording sites. Then, as described above, we calculated a separation that was defined as the sum of squares of element-by-element differences between the matrices for each pair of the temporal patterns. Finally, a relative categorical separation (RCS) was calculated for each time window as the proportion of the sum of the separations between the equality–inequality pairs to the sum of the separations between all the pairs:
where i and j denote the temporal patterns, and Ci and Cj denote the corresponding correlation matrices.
Utilizing correlation matrices to analyze EEG data is advantageous in several aspects. In the conventional ERP analyses, it is important to localize the component in space (in terms of the recording site) and in time (in terms of latency) precisely. In the analysis of correlation matrices, however, the focus is on more distributed properties of the response. The correlation matrix reflects covariations across different recording sites rather than variations at each individual site. The correlation matrix does not reflect timing or phase relationship of such covariations. In the analysis of distributed properties, a component is related to co-varying signals from multiple recording sites. Commonality between such components across responses to different temporal patterns must be reflected onto the correlation matrices. Distributed properties must be reflected in such comparisons. The present method is simple compared with conceptually similar measures such as coherence or phase locking (Lachaux et al., 1999). Despite its simplicity, the correlation matrix contains the most essential information as to which recording sites behave together. It is the basis for principal component analysis and other related multivariate analysis methods. An important advantage of utilizing correlation matrices is that a correlation matrix can be reduced to represent the most critical component(s) or factor(s).For example, it is useful to focus on specific principal components that are significant or to remove noise by eliminating insignificant components.
Results
Figure 2A shows the two-dimensional MDS results. The points with shorter t1 are presented on the left side, while the points with longer t1 are presented on the right side in the judgment condition, except that the diamonds (t1 = 320 ms) is to the left of the squares (t1 = 280 ms) overlapping the leftward triangles (t1 = 240 ms). There was a separation between the points representing the judgment condition and those representing the no-judgment condition. The judgment condition data (open symbols) are presented in the upper part of the figure, while the no-judgment condition data (filled symbols) are presented in the lower part. Thus, the first dimension roughly corresponds to the stimulus in the judgment condition, while the second dimension to the task. In a vertically-magnified view in Figure 2B, there was also a separation, in the judgment condition, between the points that represent the equality patterns and those that represent the inequality patterns. The equality patterns (triangles) are presented in the relatively upper part in the judgment condition, while the inequality patterns (circles, squares, and diamonds) are presented in the relatively lower part, in the middle of the figure. The three-dimensional MDS data led us to the same conclusions as the two-dimensional MDS data. The results of the MDS analysis were consistent with the original ERP analysis as there were differences between the judgment and the no-judgment condition and differences between the equality patterns and the inequality patterns in the judgment condition. This implies that we can quantitatively compare and characterize the ERP waveforms by analyzing the obtained correlation matrices. Using this correlation matrix method, we further examined the changes in the representations over time, focusing on the separation between the representations of equality patterns and the representations of the inequality patterns.
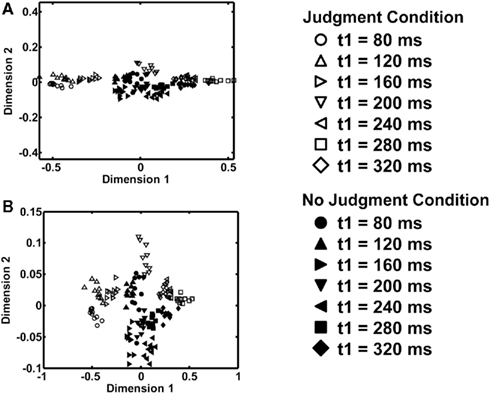
Figure 2. Results of the multidimensional scaling (MDS) analyses. Points representing the activations by the temporal patterns are shown in a two-dimensional layout. Open symbols indicate the results for the judgment condition, and filled symbols the results for the no-judgment condition. Different types of symbols indicate different temporal patterns. The scatter of a symbol shows the variability across different resamplings in bootstrapping (N = 10). (A) The conventional representation. (B) A vertically elongated representation.
Figure 3 shows the time course of the relative category separation as a function of the center of the time window for each condition. The “chance level” of the relative category separation is 0.57 assuming a homogeneous variance across the temporal patterns. Both in the judgment and in the no-judgment condition, separation peaks appeared after the second tone burst at −200 ms and after the third tone burst at 0 ms, i.e., after the first and after the second time interval.
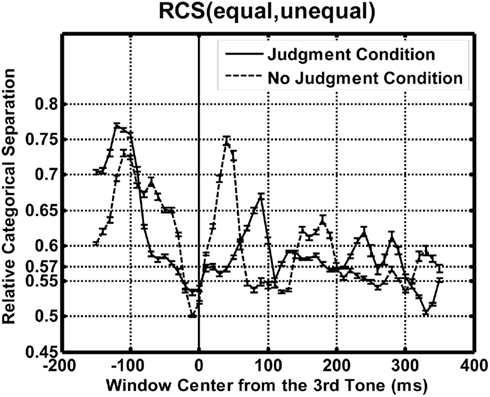
Figure 3. The results of the time course analyses. Relative categorical separations are plotted as a function of the temporal position of the time-window center for each condition. Solid and dashed lines show the results for the judgment and the no-judgment condition, respectively. The “chance level” of the relative category separation is 0.57 assuming a homogeneous variance across the temporal patterns. Error bars represent SE estimated by the bootstrapping (N = 30).
The apparent categorical separation between the equality patterns and the inequality patterns after the first t1 interval is interpreted as reflecting responses to the first time t1 interval, which occurred immediately before the analysis window. We need to be careful in interpreting the “separation” in this case, because the discrimination of inequality from equality was not possible before t2 was presented. The implications of these early peaks will be discussed later. A more interesting finding was that we were able to find a local maximum of the RCS immediately after the second interval t2. This should not be a response to the third tone burst or the second time interval t2, which immediately preceded the time window, because all of the tone bursts were the same, and the duration of t2 was kept constant at 200 ms for the trials to be analyzed. This separation must reflect t1, and it is probably related to the comparison between t1 and t2. This plot can be related to the original finding of the SNCt in that a peak appears immediately after presentation of t2 in the judgment condition. In addition, there was a qualitative agreement in the waveforms between the judgment and the no-judgment condition although there was a difference in timing.
Figure 4 shows the two-dimensional MDS result in the judgment condition with the 100-ms window centered (i) at the −120-ms peak after the first interval in Figure 4A, (ii) at the 90-ms peak after the second interval in Figure 4B, or (iii) at the 110-ms valley after these peaks in Figure 4C. In Figure 4B, at the point where the relative categorical separation was large, while the inequality patterns (filled circles, squares, and diamonds) occupied the right upper corner of the panel, the equality patterns (open triangles) occupied the left lower corner of the panel. They can be linearly separated, which means that the MDS showed an axis of dimension along which inequality–equality contrast was represented. In Figure 4C, at the point where the relative categorical separation was small, the inequality patterns (filled circles, squares, and diamonds) and the equality patterns (open triangles) were not separated. While the equality–inequality separation (t1 = 120, 160, 200, or 240 versus 80, 280, or 320 ms) was found at the peak before the second interval in Figure 4A along the diagonal from upper-left to lower-right, a separation between the short-duration pattern and the long-duration pattern (t1 = 80, 120, or 160 versus 240, 280, or 320 ms) was also found along the other diagonal from lower-left to upper-right there. No such separation by duration was found in Figure 4B. One plausible description of the pattern in Figure 4A, but not in Figure 4B, may be that each temporal pattern was represented separately according to its actual duration.
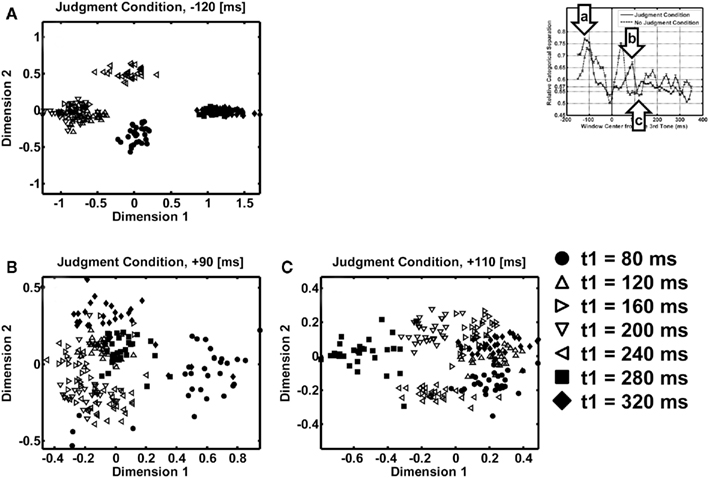
Figure 4. Results of the multidimensional scaling (MDS) analyses at specific time points for the judgment condition. (A) MDS at 120 ms before the onset of the third tone. (B) MDS at 90 ms after the onset of the third tone – at the peak of relative categorical separation. (C) MDS at 110 ms after the onset of the third tone – at the valley of relative categorical separation. Different symbols represent different temporal patterns. Filled symbols represent perceptually unequal temporal patterns. Open symbols represent perceptually equal temporal patterns. The scatter of a symbol shows the variability across different resampling in bootstrapping (N = 30).
Figure 5 shows the two-dimensional MDS results in the no-judgment condition with the 100-ms window centered (i) at the −110-ms peak after the first interval in Figure 5A, (ii) at the −70-ms peak after the first interval in Figure 5B, (iii) at the 40-ms peak after the second interval in Figure 5C, or (iv) at the 80-ms valley after the peaks in Figure 5D. In Figure 5C, at the point where the relative categorical separation was large, while the inequality patterns (filled circles, squares, and diamonds) occupied the right upper corner of the panel, the equality patterns (open triangles) occupied the left lower corner of the panel. They can be linearly separated, which means that the MDS showed an axis of dimension along which inequality–equality contrast was represented, similarly to the judgment condition. In Figure 5D, at the point where the relative categorical separation was small, the inequality patterns (filled circles, squares, and diamonds) and the equality patterns (open triangles) were not separated. At the peaks before the second interval in Figures 5A,B, we found the equality–inequality separation as well as the separation between the short-duration versus long-duration. The two-dimensional MDS described the categorical equality–inequality separation well, although the correlation matrices may have had three or more dimensions.
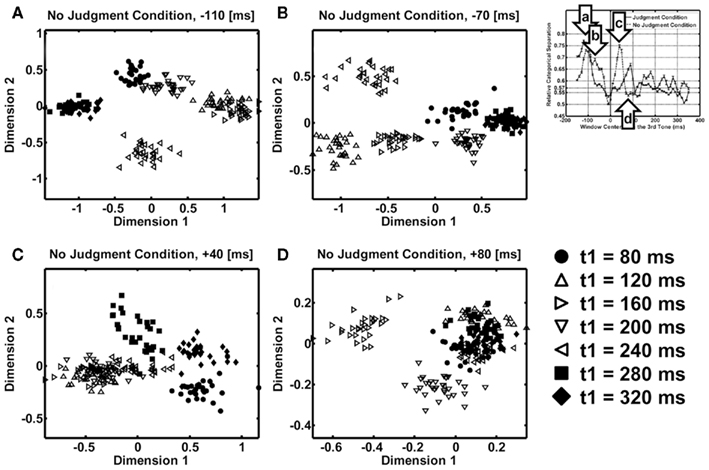
Figure 5. Results of the multidimensional scaling (MDS) analyses at specific time points for the no-judgment condition. (A) MDS at 110 ms before the onset of the third tone. (B) MDS at 70 ms before the third tone. (C) MDS at 40 ms after the third tone – at the peak of the relative categorical separation. (D) MDS at 80 ms after the third tone – at the valley of the relative categorical separation. Filled symbols represent perceptually unequal temporal patterns. Open symbols represent perceptually equal temporal patterns. The scatter of a symbol shows the variability across different resampling in bootstrapping (N = 30).
The peaks after the first interval may appear to represent an equality–inequality separation. One may argue that, after a couple of trials, the participants may have developed an implicit framework of t2, since, except for the dummy trials, the t2 interval in this experiment was fixed. If so, the participants may have started making comparisons before the second interval was presented.
This is unlikely, however, for two reasons. First, the asymmetry of the equality judgments observed in the judgment condition can be explained only by assuming that t2 was underestimated (Nakajima et al., 2004). Although the difference between t1 and t2 was 80 ms both when t1 = 120 ms and when t1 = 280 ms, equality was perceived only when t1 = 120 ms. According to Nakajima et al. (2004), t2 should be underestimated considerably in this particular condition, and this explains the asymmetry of equality judgment. This means that the participants judged equality/inequality after perceiving t2.
Second, the peaks after the first interval clearly represent the actual properties of the first interval. Figures 6 and 7 show time course of MDS plots after the presentation of the first interval (from upper-left to lower-right). Note that both in the judgment (Figure 6) and in the no-judgment (Figure 7) condition, the representation changes from arrangements corresponding to the individual temporal patterns to arrangements corresponding to the equality–inequality segregation. At the peaks after the first interval, the MDS representations of the temporal patterns show separation and clustering of the individual patterns. They also show residual separation between the short-duration (t1 = 80, 120, or 160 ms) and the long-duration (t1 = 240, 280, or 320 ms) patterns. In contrast, at the peaks after the second interval, the MDS representations of the individual patterns are more obscure, and only a robust segregation between the equal (t1 = 120, 160, 200, or 240 ms) and unequal (t1 = 80, 280, or 320 ms) category patterns appeared. It is no longer possible to find a dimension along which the short-duration and the long-duration patterns are separated. In order to confirm the above observations, we calculated the RCS between the short-duration patterns (t1 = 80, 120, or 160 ms) and the long-duration patterns (t1 = 240, 280, or 320 ms) in the same way as we had calculated the RCS between the equality patterns and the inequality patterns, and we plotted them in Figure 8. Whereas there were peaks after the first interval, no peak was found within 100 ms after the second interval. This plot corresponds to the above argument that the equality–inequality separations before and after the second interval have different implications. While the former is likely to be a by-product of the separate representations of individual time intervals, the latter seems to be related to the perception of the whole temporal patterns.
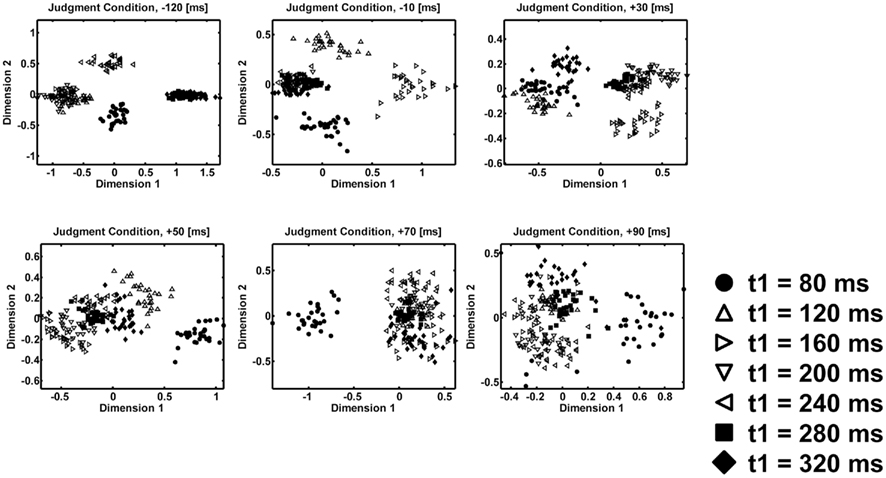
Figure 6. Time course of the multidimensional scaling (MDS) analyses after the presentation of the whole temporal pattern for the judgment condition. Different symbols represent different temporal patterns. Filled symbols represent perceptually unequal temporal patterns. Open symbols represent perceptually equal temporal patterns. The scatter of a symbol shows the variability across different resampling in bootstrapping (N = 30).
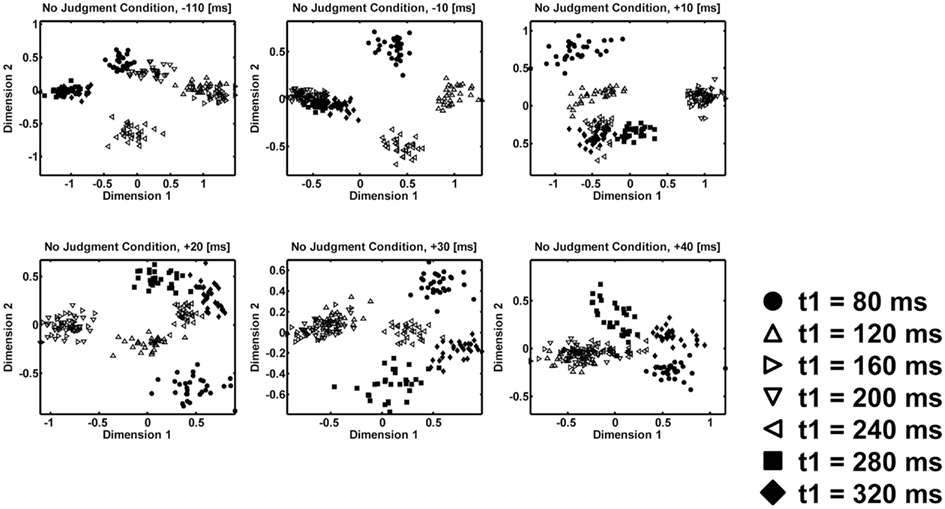
Figure 7. Time course of the multidimensional scaling (MDS) analyses after the presentation of the whole temporal pattern for the no-judgment condition. Different symbols represent different temporal patterns. Filled symbols represent perceptually unequal temporal patterns. Open symbols represent perceptually equal temporal patterns. The scatter of a symbol shows the variability across different resampling in bootstrapping (N = 30).
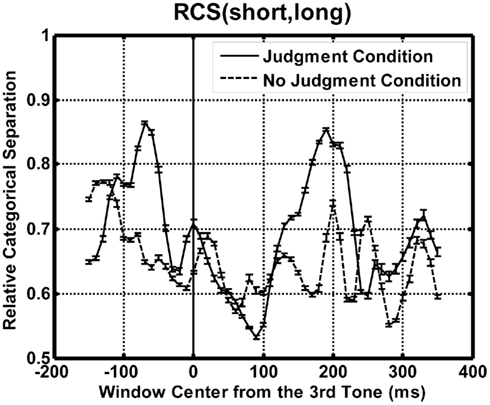
Figure 8. The relative categorical separation (RCS) between short-duration (t1 = 80, 120, or 160 ms) and long-duration (t1 = 240, 280, or 320 ms) patterns is plotted as a function of the temporal position of the time-window center for each condition. Solid and dashed lines show the results for the judgment and the no-judgment condition, respectively. The “chance level” of the relative categorical separation is 0.6 assuming a homogeneous variance across the temporal patterns. Error bars represent the SE estimated by bootstrapping (N = 30).
Additionally, the waveforms after the second interval contain much more information related to the equality/inequality of the neighboring intervals than those before the second interval. To show this quantitatively, we calculated the selective average waveforms for the equal and unequal judgment trials, for t1 = 280 ms. We then calculated their difference waveform and the mean square difference at each temporal point across all the recording sites, as plotted in Figure 9. If the participants had already started making comparisons after the first interval, we would have observed comparable differences before and after the presentation of the second interval (the third tone). This was not the case. The difference was clearly much greater after the second interval was presented. This may also support the argument that the judgment was made after, and not before, the second interval was presented. Only the t1 = 280 ms case is shown here because either the number of equal responses or the number of unequal responses was too small to obtain the selective average waveforms reliably for the other durations of t1. In these cases, the responses were too highly biased toward equality (when t1 = 120, 160, 200, or 240 ms) or toward inequality (when t1 = 80 or 320 ms).
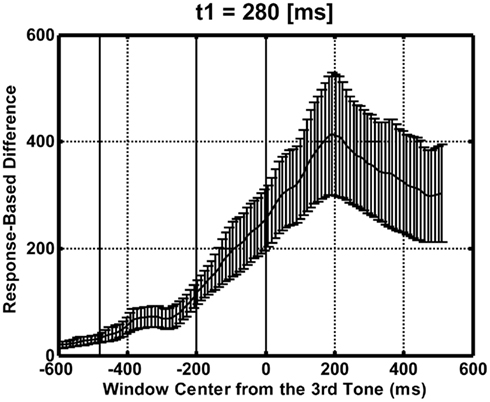
Figure 9. Time course of the mean square of the difference waveforms between the selective averages for the equal and the unequal response trials, across recording sites for t1 = 280 ms. Moving average was calculated using a 100-ms square-shaped time window. Solid vertical lines indicate the timings of the three tones. Error bars represent the SE across the participants (N = 11).
Discussion
In both the judgment and no-judgment conditions, our analyses revealed a peak in categorical separation between the equality and inequality temporal patterns immediately after the second time interval was presented. It is likely that these processing phases are associated with equality/inequality judgments. The peaks in both conditions are likely to correspond to the perception of the equality/inequality of temporal patterns whether there is a judgment task or not. We may tend to perceive regularity/irregularity of temporal patterns even if we are passively listening to them, and our correlation matrix analyses seem to have captured a representation of rhythmic patterns in the brain.
In the general context of timing and time perception, the presence of a very short processing period in the brain after the presentation of a time interval is consistent with a dominant view in the field of time perception, i.e., the scalar expectancy theory (SET; Gibbon, 1977). Temporal judgments are assumed to be based on an internal clock that has been described as a pacemaker-counter device, and one possible cause of counting errors is the latency of accumulation in the pacemaker-counter device (Gibbon, 1991; Gibbon and Church, 1984; Grondin, 2010; see also Wearden and Lejeune, 2008). Specifically, the short processing time after the third tone that appeared in our study may be associated with the latency of this putative counter device (e.g., Taatgen et al., 2007; van Rijn and Taatgen, 2008; Taatgen and van Rijn, 2011). For instance, in the animal timing literature, it has been shown that the accumulation of pulses in the counter depends on a switch mode (Meck, 1984). Some latency in this switch process probably causes the processing time delay apparent in the brain activity. The magnitude of this delay (the switch effect) is likely associated with attentional processes (Grondin and Rammsayer, 2003; Meck, 1984).
In the specific context of auditory temporal assimilation, Nakajima et al. (2004) argued that a large part of the auditory temporal assimilation can be explained by their processing time hypothesis (Nakajima et al., 1988). The processing time hypothesis postulates that the perceived duration of a physical time interval t is in proportion to the actual duration of that interval t plus a positive constant α for additional processing of the interval, and the total time perceived is in proportion to t + α. This hypothesis is in line with our current findings in that the post-stimulus processing was critical for time perception. The additional processing time α in the processing time hypothesis was psychophysically estimated to be about 80 ms or shorter depending on the stimulus context. This agrees with the fact that the brain-derived signature of the equality/inequality perception was observed within 100 ms after the presentation of t2.
Explanations of the results by the SET models and the processing time hypothesis are not mutually exclusive. To examine the theoretical relationship between these two models can be an innovative attempt. In the current context, it is important to emphasize the consistency between the processing time hypothesis and the present analysis. The processing time hypothesis has been developed on the basis of, and used for the explanation of, various types of quantitative psychophysical results including those related to unilateral auditory temporal assimilation (e.g., Nakajima et al., 1988, 2004), and auditory temporal assimilation has been the paradigm of our current neurophysiological study.
Contingent negative variations (CNVs) have been associated with the perception of short time intervals (Pfeuty et al., 2003, 2008; Macar and Vidal, 2004; Gontier et al., 2007, 2009; Le Dantec et al., 2007). Mitsudo et al. (2009) found that CNVs after the presentation of t1 were quantitatively related to the duration of t1. It is possible that, while the CNV is used for processing one interval, the SNCt is used for processing the relationship between two intervals. Takeichi et al. (2011) showed in a classifier analysis that the SNCt, or the ERP waveform after t2, contained information about the participants’ task and responses. In all the previous studies on time perception, the participants had been required to perform a perceptual task while their behavioral or neural responses had been recorded. One important characteristic of temporal processing, however, is that it can be automatic and can be performed irrespective of the task. Our current study captured such signals from the brain in relation to the perception of time intervals shorter than half a second. Linear separability was observed between the equality and the inequality patterns immediately after the presentation of t2, characterizing an equality/inequality dimension.
By calculating the separations between the correlation matrices, we determined categorical boundaries between equal and unequal cases in both the judgment and no-judgment conditions. We perceive rhythms in temporal patterns irrespective of whether we pay attention to those temporal patterns. It is well known that brain activity, such as mismatch negativity (Tervaniemi et al., 1994; Yabe et al., 1997) or gamma band activity (see Zanto et al., 2006), is observed in response to rhythmic irregularities without attention being paid to the stimulus. This current analysis is likely to be the first study in time perception research to relate observed brain activities to perceptions in the mind in a situation without explicit judgments, using brief, elementary temporal patterns. The fact that it is possible to observe related brain activities without explicit judgments within a period as short as 100 ms indicates that the current method should have a wide range of applications including clinical ones.
Conflict of Interest Statement
The authors declare that the research was conducted in the absence of any commercial or financial relationships that could be construed as a potential conflict of interest.
Acknowledgments
The authors are grateful to Takako Mitsudo and Shozo Tobimatsu for allowing us to reanalyze their data. The authors are also grateful to Kazuo Ueda and Gerard B. Remijn for their useful comments on an earlier version of the manuscript. Simon Grondin also gave us valuable suggestions. The study was supported by Tateisi Science and Technology Foundation and Grants-in-aid for scientific research from the Ministry of Education, Culture, Sports, Science, and Technology, Japan (20653054, 23653227, and 19103003).
References
Allan, L. G., and Gibbon, J. (1994). A new temporal illusion or the TOE once again? Percept. Psychophys. 55, 227–229.
Buhusi, C. V., and Meck, W. H. (2005). What makes us tick? Functional and neural mechanisms of interval timing. Nat. Rev. Neurosci. 6, 755–765.
Fraisse, P. (1948). Les Erreursconstantesdans la reproduction de courts intervallestemporels. Arch. Psychol. 32, 161–176.
Getty, D. J. (1975). Discrimination of short temporal intervals: a comparison of two models. Percept. Psychophys. 18, 1–8.
Gibbon, J. (1977). Scalar expectancy theory and Weber’s law in animal timing. Psychol. Rev. 84, 279–325.
Gibbon, J., and Church, R. M. (1984). “Sources of variance in an information processing theory of timing,” in Animal Cognition, eds H. L. Roitblat, T. G. Bever, and H. S. Terrace (Hillsdale, NJ: Erlbaum), 465–488.
Gibbon, J., Malapani, C., Dale, C. L., and Gallistel, C. R. (1997). Toward a neurobiology of temporal cognition: advances and challenges. Curr. Opin. Neurobiol. 7, 170–184.
Gontier, E., Le Dantec, C., Leleu, A., Paul, I., Charvin, H., Bernard, C., Lalonde, R., and Rebaï, M. (2007). Frontal and parietal ERPs associated with duration discrimination with or without task interference. Brain Res. 1170, 79–89.
Gontier, E., Paul, I., Le Dantec, C., Pouthas, V., Jean-Marie, G., Bernard, C., Lalonde, R., and Rebaï, M. (2009). ERPs in anterior and posterior regions associated with duration and size discriminations. Neuropsychology 23, 668–678.
Grondin, S. (2001). From physical time to the first and second moments of psychological time. Psychol. Bull. 127, 22–44.
Grondin, S. (2010). Timing and time perception: a review of recent behavioral and neuroscience findings and theoretical directions. Attent. Percept. Psychophys. 72, 561–582.
Grondin, S., and Rammsayer, T. (2003). Variable foreperiods and duration discrimination. Q. J. Exp. Psychol. 56A, 731–765.
Harrington, D. L., Zimbelman, J. L., Hinton, S. C., and Rao, S. M. (2010). Neural modulation of temporal encoding, maintenance, and decision processes. Cereb. Cortex 20, 1274–1285.
Hasuo, E., Nakajima, Y., and Hirose, Y. (2011). Effects of sound marker durations on rhythm perception. Perception 40, 220–242.
Hellström, Å. (1985). The time-order error and its relatives: mirrors of cognitive processes in comparing. Psychol. Bull. 97, 35–61.
Jin, D. Z., Fujii, N., and Graybiel, A. M. (2009). Neural representation of time in cortico-basal ganglia circuits. Proc. Natl. Acad. Sci. U.S.A. 106, 19156–19161.
Lachaux, J. P., Rodriguez, E., Martinerie, J., and Varela, F. J. (1999). Measuring phase synchrony in brain signals. Hum. Brain Mapp. 8, 194–208.
Le Dantec, C., Gontier, E., Paul, I., Charvin, H., Bernard, C., Lalonde, R., and Rebaï, M. (2007). ERPs associated with visual duration discriminations in prefrontal and parietal cortex. Acta Psychol. 125, 85–98.
Macar, F., and Vidal, F. (2004). Event-related potentials as indices of time processing: a review. J. Psychophysiol. 18, 89–104.
Meck, W. H. (1984). “Attentional bias between modalities: effect on the internal clock, memory, and decision stages used in animal time discrimination,” in Annals of the New York Academy of Sciences : Vol. 423, Timing and Time Perception, eds J. Gibbon and L. G. Allan (New York: New York Academy of Sciences), 528–541.
Merchant, H., Zarco, W., and Prado, L. (2008). Do we have a common mechanism for measuring time in the hundreds of millisecond range? Evidence from multiple-interval timing tasks. J. Neurophysiol. 99, 939–949.
Mitsudo, T., Nakajima, Y., Remijn, G. B., Takeichi, H., Goto, Y., and Tobimatsu, S. (2009). Electrophysiological evidence of auditory temporal perception related to the assimilation between two neighboring time intervals. Neuroquantology 7, 114–127.
Miyauchi, R., and Nakajima, Y. (2005). Bilateral assimilation of two neighboring empty time intervals. Music Percept. 22, 411–424.
Morillon, B., Kell, C. A., and Giraud, A.-L. (2009). Three stages and four neural systems in time estimation. J. Neurosci. 29, 14803–14811.
Nakajima, Y., Nishimura, S., and Teranishi, R. (1988). Ratio judgments of empty durations with numeric scales. Perception 17, 93–118.
Nakajima, Y., ten Hoopen, G., Sasaki, T., Yamamoto, K., Kadota, M., Simons, M., and Suetomi, D. (2004). Time-shrinking: the process of unilateral temporal assimilation. Perception 33, 1061–1079.
Nakajima, Y., ten Hoopen, G., and van der Wilk, R. (1991). A new illusion of time perception. Music Percept. 8, 431–448.
Pfeuty, M., Ragot, R., and Pouthas, V. (2003). When time is up: CNV time course differentiates the roles of the hemispheres in the discrimination of short tone durations. Exp. Brain Res. 151, 372–379.
Pfeuty, M., Ragot, R., and Pouthas, V. (2008). Brain activity during interval timing depends on sensory structure. Brain Res. 1204, 112–117.
Povel, D.-J. (1981). Internal representation of simple temporal patterns. J. Exp. Psychol. Hum. Percept. Perform. 7, 3–18.
Sasaki, T., Nakajima, Y., and ten Hoopen, G. (1998). Categorical rhythm perception as a result of unilateral assimilation in time-shrinking. Music Percept. 16, 201–222.
Sasaki, T., Suetomi, D., Nakajima, Y., and ten Hoopen, G. (2002). Time-shrinking, its propagation, and Gestalt principles. Percept. Psychophys. 64, 919–931.
Taatgen, N., and van Rijn, H. (2011). Traces of times past: representations of temporal intervals in memory. Mem. Cogn. 39, 1546–1560.
Taatgen, N., van Rijn, H., and Anderson, J. (2007). An integrated theory of prospective time interval estimation: the role of cognition, attention, and learning. Psychol. Rev. 114, 577–598.
Takeichi, H., Mitsudo, T., Nakajima, Y., Remijn, G. B., Goto, Y., and Tobimatsu, S. (2011). A neural decoding approach to auditory temporal assimilation. Neural Comput. Appl. 20, 965–973.
ten Hoopen, G., Sasaki, T., Nakajima, Y., Remijn, G., Massier, B., Rhebergen, K. S., and Holleman, W. (2006). Time-shrinking and categorical temporal ratio perception: evidence for a 1:1 temporal category. Music Percept. 24, 1–22.
Tervaniemi, M., Saarinen, J., Paavilainen, P., Danilova, N., and Näätänen, R. (1994). Temporal integration of auditory information in sensory memory as reflected by the mismatch negativity. Biol. Psychol. 38, 157–167.
van Rijn, H., and Taatgen, N. A. (2008). Timing of multiple overlapping intervals: how many clocks do we have? Acta Psychol. (Amst.) 129, 365–375.
Wearden, J. H., and Lejeune, H. (2008). Scalar properties in human timing: conformity and violations. Q. J. Exp. Psychol. 61, 569–587.
Woodrow, H. (1951). “Time perception,” in Handbook of Experimental Psychology, ed. S. S. Stevens (New York: Wiley), 1224–1236.
Yabe, H., Tervaniemi, M., Reinikainen, K., and Näätänen, R. (1997). Temporal window of integration revealed by MMN to sound omission. Neuroreport 8, 1971–1974.
Keywords: temporal judgment, event-related potential, slow negative component, correlation matrix, multidimensional scaling, auditory temporal assimilation, processing time hypothesis, principal component analysis
Citation: Nakajima Y and Takeichi H (2011) Human processing of short temporal intervals as revealed by an ERP waveform analysis. Front. Integr. Neurosci. 5:74. doi: 10.3389/fnint.2011.00074
Received: 26 May 2011;
Paper pending published: 07 July 2011;
Accepted: 13 October 2011;
Published online: 06 December 2011.
Edited by:
Warren H. Meck, Duke University, USAReviewed by:
Hedderik Van Rijn, University of Groningen, NetherlandsGuido Marco Cicchini, Consiglio Nazionale delle Ricerche, Italy
Copyright: © 2011 Nakajima and Takeichi. This is an open-access article subject to a non-exclusive license between the authors and Frontiers Media SA, which permits use, distribution and reproduction in other forums, provided the original authors and source are credited and other Frontiers conditions are complied with.
*Correspondence: Hiroshige Takeichi, Laboratory for Mathematical Neuroscience, RIKEN Brain Science Institute, 2-1 Hirosawa, Wako, Saitama 351-0198, Japan. e-mail: takeichi@riken.jp