Differential effects of parietal and frontal inactivations on reaction times distributions in a visual search task
- 1Centre de Neuroscience Cognitive, Centre National de la Recherche Scientifique, Université Claude Bernard Lyon, Bron, France
- 2Laboratoire de Neurophysiologie, Institute of Neuroscience, Université Catholique de Louvain, Brussels, Belgium
The posterior parietal cortex participates to numerous cognitive functions, from perceptual to attentional and decisional processes. However, the same functions have also been attributed to the frontal cortex. We previously conducted a series of reversible inactivations of the lateral intraparietal area (LIP) and of the frontal eye field (FEF) in the monkey which showed impairments in covert visual search performance, characterized mainly by an increase in the mean reaction time (RT) necessary to detect a contralesional target. Only subtle differences were observed between the inactivation effects in both areas. In particular, the magnitude of the deficit was dependant of search task difficulty for LIP, but not for FEF. In the present study, we re-examine these data in order to try to dissociate the specific involvement of these two regions, by considering the entire RT distribution instead of mean RT. We use the LATER model to help us interpret the effects of the inactivations with regard to information accumulation rate and decision processes. We show that: (1) different search strategies can be used by monkeys to perform visual search, either by processing the visual scene in parallel, or by combining parallel and serial processes; (2) LIP and FEF inactivations have very different effects on the RT distributions in the two monkeys. Although our results are not conclusive with regards to the exact functional mechanisms affected by the inactivations, the effects we observe on RT distributions could be accounted by an involvement of LIP in saliency representation or decision-making, and an involvement of FEF in attentional shifts and perception. Finally, we observe that the use of the LATER model is limited in the context of a visual search as it cannot fit all the behavioral strategies encountered. We propose that the diversity in search strategies observed in our monkeys also exists in individual human subjects and should be considered in future experiments.
Introduction
The parietal and frontal cortices have both been functionally involved in saccadic eye movements, visual attention and working memory. In humans, fMRI studies have revealed co-activations of these two regions in protocols involving any of these mechanisms (e.g., Corbetta et al., 1998; LaBar et al., 1999; Hopfinger et al., 2000; Cornette et al., 2001; Astafiev et al., 2003; Koyama et al., 2004; Naghavi and Nyberg, 2005; Olivers, 2008). This co-activation is so systematic that the “parieto-frontal” network is often viewed as a functional entity in itself, that does not require that the relative complementary roles of its components be distinguished. In monkeys, this parieto-frontal network is mainly constituted of the lateral intraparietal area (LIP) and the frontal eye fields (FEF). Accordingly, both areas have neuronal activities related to visual stimulation, saccadic eye movements, visual attention and memory (e.g., Bruce and Goldberg, 1985; Gnadt and Andersen, 1988; Barash et al., 1991; Colby et al., 1996; Kodaka et al., 1997; Gottlieb et al., 1998; Hanes et al., 1998; Bisley and Goldberg, 2003; Thompson et al., 2005; Sereno and Amador, 2006).
In order to distinguish the functional roles of LIP and FEF, we conducted a series of inactivation experiments (Wardak et al., 2002, 2004, 2006) while the monkeys were performing visual saccades and covert visual search, as a measure of visual attention. We observed very different effects of the inactivation of each area on the saccadic behavior. Indeed, FEF inactivations led to large deficits up to an incapacity for the monkey to produce contraversive saccades (Wardak et al., 2006), whereas LIP inactivations led to minor or no deficits (Li et al., 1999; Li and Andersen, 2001; Wardak et al., 2002). In contrast, in the covert visual search task, the inactivation of both areas induced a comparable increase in the mean reaction time (RT) necessary to detect a contralesional target, without any change in the slope of the RT as a function of the number of items present in the visual scene (Wardak et al., 2004, 2006). Only subtle differences could be observed between the inactivation of both areas. For example, the amplitude of the RT deficit was larger for difficult visual search conditions (difficult feature search and conjunction search) than for an easy condition (“pop-out” search) following the inactivation of LIP, while the amplitude of the deficit was constant across these conditions following that of the FEF (Wardak et al., 2011). There was also no change in the mean RT necessary to detect an ipsilateral target, except after FEF inactivation in one monkey.
Although mean RT is the most widely used measure of behavioral performance, it has some limitations and may not capture all the information contained in RT data. RTs, whether manual or saccadic, do not follow a Gaussian distribution. They are better described by an ex-gaussian distribution (Ratcliff, 1979). As a result, a change in the mean RT may reflect changes in different parameters of the actual distribution: a shift of the entire distribution or an increase of the tail for example. RT distributions could also be modified without any effect on the overall mean. The aim of the present paper is thus to reanalyse the effects of LIP and FEF inactivations on the manual RTs in a covert visual search (Wardak et al., 2004, 2006) by considering the entire RTs distribution rather than just the mean RT.
From a functional point of view, a RT reflects a set of processes, ranging from the visual processing to decision mechanisms. The effect of LIP and FEF inactivations on any of these processes will thus affect the RTs and their distribution. The LATER model, developed by Carpenter (Carpenter and Williams, 1995; Reddi and Carpenter, 2000; Reddi et al., 2003), provides an interesting framework for RT analysis. Indeed, it postulates that RTs are determined by the time taken by a decision signal to rise linearly, in response to the presentation of visual information, up to a threshold at which a response is initiated. This model considers the whole RT distribution and proposes that it can be modified either by a change in the rate of information accumulation (i.e., visual, perceptual processes) or by a change in the decision threshold (i.e., decision, cognitive, top-down processes). Both LIP and FEF have been proposed to accumulate evidence in favor of saccadic motor plans (e.g., Hanes and Schall, 1996; Shadlen and Newsome, 1996). However, these areas also contain visual and visuomotor neurons that have been shown to represent the visual saliency (Gottlieb et al., 1998; Thompson and Bichot, 2005) and to accumulate perceptual information (Shadlen and Newsome, 1996; Ding and Gold, 2012), that could lead to a perceptual decision about the presence of a target in the visual scene, even in a non-saccadic context (Ibos, Duhamel and Ben Hamed, submitted). In this study, we thus consider the possible involvement of LIP and FEF in a perceptual decision, and not in a motor decision like in saccadic tasks. According to several papers, the computation of this perceptual threshold or criterion could be internal to the areas accumulating the perceptual evidence (Wang, 2002; Machens et al., 2005; Wong and Wang, 2006). As the LATER model can also be effective in manual contexts (Madelain et al., 2007), it could provide a statistical evaluation of whether the accumulation process or the decisional threshold is altered by the focal inactivations of either area.
Materials and Methods
Subjects and Experimental Setup
Two monkeys (Monkey M, Macaca mulatta, and Monkey G, Macaca fascicularis) weighting around 6 kg participated in these experiments. We followed procedures in compliance with the guidelines of European Community on animal care (European Community Council, Directive No. 86-609, November 24, 1986). All the protocols used in this experiment were approved by the animal care committee (Department of Veterinary Services, Health and Protection of Animals, permit number 69 029 0401) and the Biology Department of the University Claude Bernard Lyon 1. Each monkey underwent two surgical sessions under propofol or isoflurane anesthesia to prepare for chronic recording of eye movements and extracellular cortical recordings. During the first surgery, the animals were implanted with scleral search coils (Judge et al., 1980) and a head-restraining device. A craniotomy was made over the left intraparietal sulcus, and a stainless-steel recording chamber was implanted to allow access to LIP with microelectrodes and injection needles. During the second surgery, a craniotomy was made over the left arcuate sulcus to access FEF in both monkeys.
Throughout the duration of the experiments, the monkeys were seated in a primate chair with their head restrained, facing a tangent translucent screen 35 cm away, which spanned ±55° of the visual field. A mechanical lever, which could be displaced only vertically, was fixed on the chair at hand level in front of the monkey. The contact between the monkey and the lever, and the press onto the lever, were electrically detected. Behavioral paradigms, visual displays, and storage of both neuronal discharge and eye and hand movements were under the control of a personal computer running a real-time data acquisition system (REX) (Hays et al., 1982). Visual stimuli were back-projected onto the screen by a Davis (Drammen, Norway) DL-450 video projector. Eye movements were recorded with the magnetic search coil technique (Primelec, Zurich, Switzerland), and horizontal and vertical eye positions were digitized at 250 Hz. All data analyses were performed off-line.
Behavioral Task
The monkeys were trained to perform a covert visual search. This task required the monkey to maintain fixation on a central fixation point and search, while keeping their eyes on the fixation point, in the visual periphery for the presence of a predefined target in an array containing two, four, or eight items. A trial started when the monkey's hand was in contact with the lever and then the central fixation point appeared. From 300 to 1000 ms after the foveation of the fixation point, up to three visual search displays appeared in succession, each lasting 200 ms, separated by a 1000 ms blank interval. The monkeys had to press the lever within 900 ms after the appearance of a display, which contained the target. If no target was present, the monkeys refrained from responding and waited for the next display without breaking fixation. The target appeared in the first, second, or third display with equal probability, hence pressing the lever at random would result in 33.3% of correct answers. Trials were interrupted if the monkey pressed the lever when no target was present or failed to maintain fixation. Both monkeys used their right hand to answer. Within a given trial, successive displays contained the same number of items, but the number of items per display varied randomly from one trial to the next. The visual items were circularly distributed at 10° of eccentricity, half on the left side and half on the right side of the fixation point. Visual fixation was controlled within a 2.5° or 3° wide window of tolerance.
Other than the covert visual search task on which the current study focuses, both monkeys were also trained on visually- and memory-guided saccade tasks (Wardak et al., 2002, 2006) and competition/extinction saccade task (Wardak et al., 2002 for Monkey M, not published for Monkey G). The only training difference between the two monkeys is that Monkey M was trained to an overt version of the visual search task (Wardak et al., 2002) before being trained for the covert visual search, whereas Monkey G never learned the overt task.
Visual Stimuli
The fixation point was a gray cross. The target was a pink diamond shape. We tested three visual search conditions (Figure 2A). In the conjunction search condition, the target was identified by a specific combination of two visual features, one shape and one color (always the pink diamond). The other combinations constituted the distractors (orange diamond, pink star, and orange star). All subtended the same visual angle of 1.8°. Two additional conditions were tested in which the target differed from the distractors by a single visual feature. In the easy feature search condition, there was only one distractor type of the same shape as, but different color from, the target (a blue or green diamond). In the difficult feature search condition, the distractors were heterogeneous and consisted of three different shapes of the same color as the target (pink).
LIP and FEF Identification
Identification of LIP was based on single-cell recordings. Single-neuron activity was recorded extracellularly with microelectrodes (Frederick Haer, 1–2 MΩ at 1 kHz), which were lowered through stainless steel guide tubes by means of a hydraulic microdrive (Narishige). Neuronal responses were recorded in the lateral bank of the intraparietal sulcus during visually guided saccade task, memory-guided saccade task, and fixation with passive visual stimulation to determine precisely both the location and extent of LIP and its borders with other well-characterized neighboring areas. Visual, memory, and/or saccadic neuronal activity were observed and used to identify LIP (Gnadt and Andersen, 1988; Colby et al., 1996), contrasting with the motion-, tactile-, arm-, and hand-related responses of the neighboring regions VIP, MIP, and AIP (Colby et al., 1993; Sakata et al., 1995; Johnson et al., 1996). We observed the rough topographic organization of the visual field representation in LIP as described previously by Ben Hamed et al. (2001). This representation helped us to choose the injection points for muscimol experiments in order to cover the whole area LIP and to avoid diffusion of the muscimol in the neighboring areas. Injection tracks corresponded to recording sites with both visual and saccadic-related activity.
In one monkey (Monkey M), the FEF was first located by using single-cell recordings. Neuronal responses were recorded mainly in the anterior bank of the arcuate sulcus, while the monkey was performing a memory-guided saccade task. Visual and saccadic neuronal activities were recorded andused to identify FEF. The localization of the FEF was confirmed in Monkey M and determined in Monkey G by using electrical microstimulation. The stimulations were delivered by a stimulator (Neurolog) through tungsten microelectrodes (50–500 kΩ at 1 kHz; Frederick Haer). Stimulations consisted in trains of biphasic pulses (pulse duration, 0.25 ms; train duration, 70 ms; stimulation frequency, 300 Hz) of varying intensity (range tested: 5–150 Å). The FEF was defined as the cortical region, the stimulation of which elicited saccadic eye movements for an intensity <50 μA (Tehovnik and Sommer, 1997). We observed the known topographical organization of the FEF, along the arcuate sulcus, with very small saccades elicited in the most ventrolateral part and large saccades in the most dorsomedial part of the FEF (Bruce et al., 1985). This representation helped us to choose the injection points for muscimol experiments to cover the whole area FEF and to avoid diffusion of the muscimol in the neighboring areas. Injection tracks corresponded to sites evoking saccades at very low intensity (10–40 μA).
LIP and FEF Inactivation
A solution of muscimol (Sigma, St. Louis, MO) in saline (8–12 μg/μl for LIP injections, 3–8 μg/μl for FEF injections) was injected with a 5 μl Hamilton syringe connected to a 29 gauge stainless steel needle. Muscimol, a GABAA agonist, was used because it interacts specifically with GABAA receptors and does not induce conduction block in fibers of passage. For LIP inactivation, three needle tracks were performed in each experiment and, along each track, two injections were made at distinct physiologically characterized sites of LIP, separated by 2–4 mm. For FEF inactivation, three needle tracks were performed in each experiment and, along each track, one injection was made. The volume injected at each site was 0.5 μl and was delivered continuously in 7.5 min by an automatic pump system. The total amount of muscimol injected in each experiment ranged between 24 and 36 μg for LIP inactivation, and between 4.5 and 12 μg for FEF inactivation. In Monkey G, three injections were made into the left parietal cortex and seven injections in the left frontal cortex. In monkey M, five injections were made in the left parietal cortex and seven injections into the left frontal cortex.
Both monkeys used their contralesional right hand to respond. After the injections were completed, we tested for the onset of muscimol effects with an extinction task (showing as an ipsilateral bias in choice to simultaneous bilateral presentation of two flashed visual targets), which is a reliable online behavioral marker of LIP inactivation effect (Wardak et al., 2002) or with a visual saccade task which is a reliable online behavioral marker of FEF inactivation effect (Wardak et al., 2006). This effect generally started 15–60 min post-injection. The order of the different task conditions was counterbalanced across inactivation experiments, and control data were always obtained on the following day and in the same order of presentation. The entire duration of behavioral testing never lasted more than 3 h, well within the accepted range of muscimol effects (Malpeli, 1999; Martin and Ghez, 1999). Two physiological saline injections, one into LIP and one into FEF, in Monkey M served as a further control for the specificity of the effects.
Data Analysis
Preliminary data analysis did not indicate a systematic tendency for LIP or FEF inactivation to affect particular target locations within the contralesional hemifield. Thus, for the sake of presentation clarity, results for different target locations were grouped by hemifield. Intrinsic to the design of our visual search task, with its sequential presentation of up to three stimulus arrays, is the possibility that monkeys learned to anticipate the necessary presence of the target on the third array, after two arrays with no target in them. Surprisingly, no effect of the order of presentation within a trial was observed on RT. Third array targets were not responded to faster than first or second array targets, suggesting that the three stimulus arrays were processed in the same manner [two-way ANOVA, number of items × presentation order; Monkey G, presentation order factor, p > 0.60 (p > 0.40), interaction p > 0.08 (p > 0.20) for the LIP (FEF) experiments data; Monkey M, presentation order factor, p > 0.09 (p > 0.38), interaction p > 0.37 (p > 0.11) for the LIP (FEF) experiments data]. Therefore, all subsequent statistical analyses were conducted on pooled data from the three types of trials. Behavioral data obtained during the sham injections of saline solution showed no significant difference with control sessions. To increase the statistical power of the analyses presented below, we pooled the result from all experiments, and we compared these data with pooled data obtained on the day after each inactivation experiment.
We used the LATER model to plot and interpret the changes in RT distributions (Carpenter and Williams, 1995; Reddi and Carpenter, 2000; Reddi et al., 2003). This simple model proposes that a decision signal rises linearly, in response to information about a target, to a threshold at which a response is initiated, at a rate that varies from trial to trial with a gaussian distribution (Figure 1A, left panel). Cumulative RT distributions are plotted as reciprobit plots, so that each distribution corresponds to a line (Figure 1A, right panels). The model originally makes two alternative predictions. A change of RT distribution can be explained by a change of accumulation rate, in which case the two lines corresponding to the each RT distribution are shifted one with respect to the other but remain parallel (shift, Figure 1B, left). Else, a change in RT distribution can be explained by a change of the decisional threshold, in which case the two lines swivel one with respect to the other and intercept at time = infinity (swivel, Figure 1B, middle). Finally, some authors introduced a third possibility of change (Madelain et al., 2007), which corresponds to a modification of the variance of the accumulation rate (σ), in which case the two lines rotate one with respect to the other around the median (rotate, Figure 1B, right). Specifically, for estimating the likelihood that the two RT distributions that are being compared result from a change in the accumulation rate, we identify the LATER model parameters (accumulation slope, RT distribution standard deviation, noise distribution standard deviation and the factor of accumulation rate change between the two conditions) that maximize the likelihood of observing these two distributions. For estimating the likelihood that the two RT distributions that are being compared result from a change in the decision threshold, we identify the LATER model parameters (accumulation slope, RT distribution standard deviation, noise distribution standard deviation, and the factor of decision threshold change between the two conditions) that maximize the likelihood of observing these two distributions. For estimating the likelihood that the two RT distributions that are being compared result from a change in the variance of the accumulation rate, we identify the LATER model parameters (accumulation slope, RT distribution standard deviation, noise distribution standard deviation, and the factor of RT distribution standard deviation change between the two conditions) that maximize the likelihood of observing these two distributions. Concurrent hypotheses were tested one against the other by evaluating which one is more likely using pair wise chi-square tests.
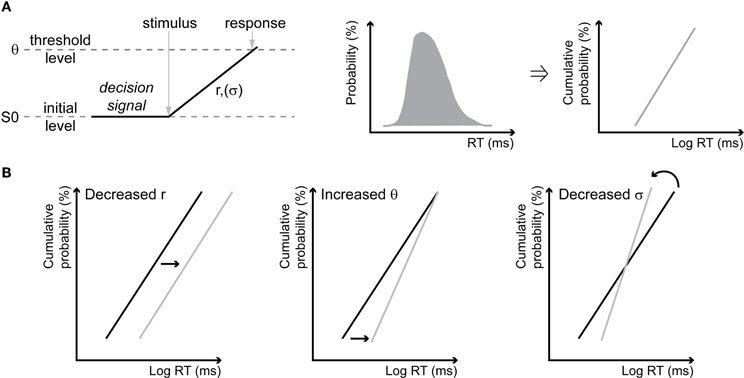
Figure 1. The LATER model and its hypotheses. (A) Schematic illustrations of the LATER model. Following the presentation of a stimulus, a decision signal rises linearly, with an accumulation rate r that has a variance σ, from a baseline value S0 to a decision threshold θ, at which point the response is produced (left). The cumulative reaction times distribution (middle) is plotted on a probit scale with a reciprocal time axis (right) resulting in a line according to the model (called reciprobits in the text). (B) Predictions of the model. A change in the accumulation rate r results in a shift of the reciprobit (shift, left). A change in the threshold θ results in a swiveling of the reciprobits, intercepting at time = infinity (swivel, middle). In addition to the initial hypotheses, some authors (Madelain et al., 2007) have also proposed that a change in the variance σ results in a rotation of the reciprobits around the median (rotate, right).
Results
Reaction Times Distributions in Control Condition
In an overt visual task, subjects' behavior is usually described in terms of number of saccades. When the task is covert, as in our case, the relevant measure is mean RT. In easy visual feature search tasks, classically called “pop-out” tasks, mean RT is constant whatever the number of items in the search array (Figure 2B, blue lines). In more difficult visual search tasks, mean RT increases as a function of the number of items (Figure 2B, difficult feature search, green lines, and conjunction search, red lines). Both monkeys thus show classical behavior.
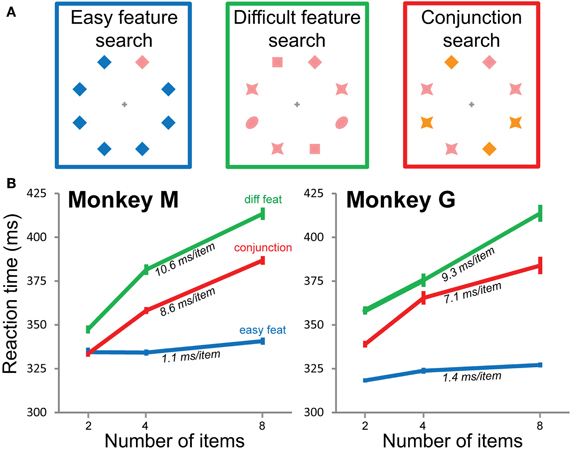
Figure 2. Visual search conditions and mean reaction times. (A) Three search conditions. The target is always the pink diamond, that can be presented along blue diamonds (easy feature search, blue, left), other pink objects (difficult feature search, green, middle), or other combinations of pink/orange and diamond/star (conjunction search, red, right). (B) Mean reaction times in the three search conditions for both monkeys as a function of the number of items in the visual scene. The slope for each condition and monkey is indicated on the corresponding curve. The three search conditions are always coded with the same colors in all the figures: blue = easy feature search, green = difficult feature search, red = conjunction search.
Figure 3 shows the RT distributions plotted as reciprobits (LATER model), as a function of the search condition and number of items. The first result is that, in the easy feature search condition, the RT distributions are indistinguishable and unaffected by the number of items in the search array, for both monkeys (blue lines). For the two difficult conditions, we observe: (1) an effect of the number of items on the distributions; (2) a difference between the two monkeys. We will first consider the behavior of Monkey M (Figure 3A). For the two difficult conditions (difficult feature search: green; conjunction search: red), the reciprobit plots are shifted when the number of items in the visual scene increases (likelihood shift > swivel for each 2 by 2 comparison, p < 0.05 for the three comparisons). According to the LATER hypotheses, this result means that, when the number of objects in the visual scene increases, the rate of information accumulation decreases. This suggests that Monkey M processed the different items of the visual scene in parallel.
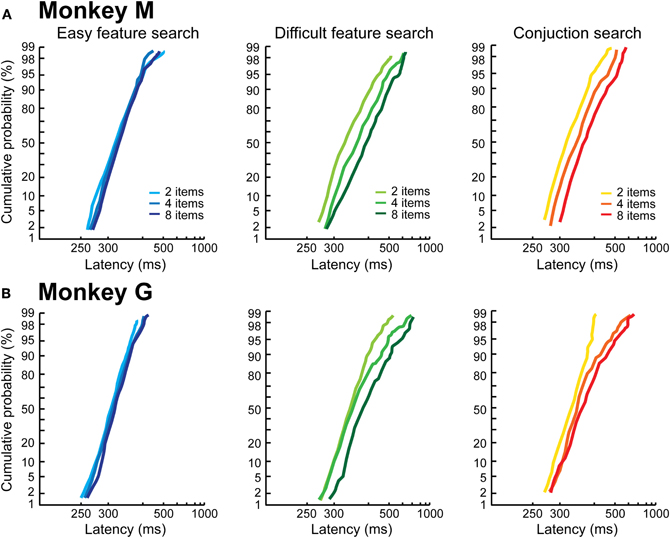
Figure 3. Control reaction time distributions as a function of the search condition. The distributions are plotted as reciprobits, as a function of the number of items, in Monkey M (A) and Monkey G (B).
The results are different for Monkey G. As can be observed in Figure 3B, the reciprobits for the difficult feature and conjunction search conditions do not look parallel, the lines start from the same point (except one) and then diverge. None of the LATER hypotheses (Figure 1B) fits this profile (likelihood is still higher for shift, significant for the 2 vs. 8 items comparison, and for the 2 vs. 4 items in the conjunction condition). Historically, target detection in a visual search task has been proposed to rely on two possible mechanisms, either a parallel or a serial mechanism (e.g., Treisman and Gelade, 1980; Nakayama and Silverman, 1986; Wolfe et al., 1989). A parallel processing of the visual scene would result in a shift in the reciprobit plots, as seen for Monkey M, because the more objects are present the more have to be processed in parallel, thus decreasing the rate of information accumulation. Could a serial processing account for the reciprobit plots of Monkey G? The fact that the reciprobits originate in the same point indicates that the earliest target detections Monkey G is able to produce are not affected by the number of items in the visual scene, fitting with a serial mechanism. In order to test for this serial hypothesis, we compared the real RT distributions for the difficult feature search condition (Figure 4, left) to simulated distributions under the hypothesis of a serial mechanism (Figure 4, middle). In classical visual search experiments in humans (e.g., Treisman and Gelade, 1980), the slope of the mean RT as a function of the number of items is used to estimate the timing of a single attentional shift. In our case, the slope for the difficult feature search in Monkey G is 9.3 ms/item (Figure 2B). For our simulation of the serial hypothesis, we thus used the easy feature search RT distribution as the basic distribution in Monkey G, for which only one attentional shift is necessary, and combined it with as many identical distributions, shifted in time by our experimental estimate of attentional spotlight shift time, as there were items still to be explored in the search array (the serial hypothesis proposes that the target is equi-probably found after 1, 2, …, n shifts of attention for a visual scene containing n items). As can be seen in Figure 4 (middle panels), the distributions resulting from this simulation do not match the real distributions (left panels), and the reciprobit plots are more parallel than diverging. Moreover, these simulated distributions fail to replicate the late RTs of the real distributions (black arrows).
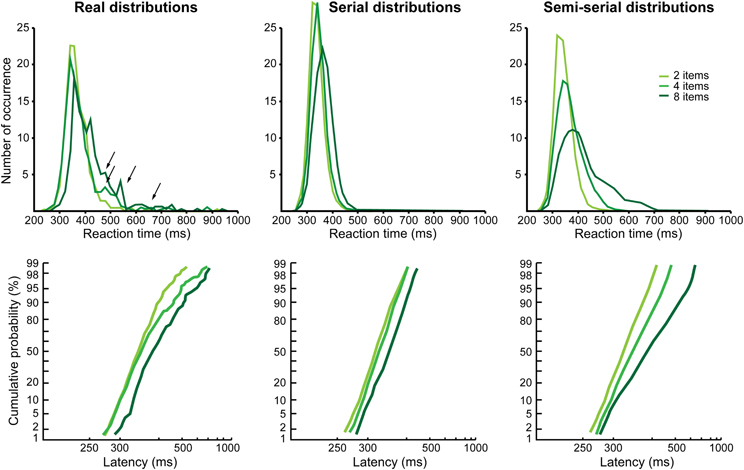
Figure 4. Real and simulated reaction times distributions for the difficult feature search condition in Monkey G. On the left, the real distributions and their corresponding reciprobits are shown as a function of the number of items (same data as in Figure 3B, middle panel). Black arrows correspond to late reaction times bumps in the distributions that could correspond to re-exploration (see text and below). The middle distributions correspond to a simulation of a purely serial search (the easy feature search distribution of Monkey G is used as the distribution for one attentional shift and, as the number of objects increases, we add the same distribution shifted by the timing we evaluated for a single attentional shift, estimated thanks to the slope of the mean reaction time in Figure 2B). The right distributions correspond to a simulation of a semi-serial search, combining parallel and serial processes. We used: (1) the easy feature search distributionas the distribution for one attentional shift; (2) an evaluation of 30 ms as the timing of a single attentional shift; (3) an exploration pattern that favors small numbers of shifts to find the target, but also supernumerary shifts corresponding to 7% of re-exploration of already explored objects (2 items: 70% of 1-shift +23% of 2-shifts +7% of 3-shifts; 4 items: 35% of 1- and 2-shifts +11.5% of 3- and 4-shifts +3.5% of 5- and 6-shifts; 8 items: 17.5% of 1-, 2-, 3-, and 4-shifts +5.75% of 5-, 6-, 7- and 8-shifts +1.75% of 9-, 10-, 11-, and 12-shifts).
Several aspects can account for this. First, 9.3 ms is very short for an attentional shift if we consider what has been estimated in humans. In visual search, the fastest attentional shift has been estimated around 50 ms (Wolfe, 1998; Wolfe et al., 2000; Horowitz et al., 2004). Using a dual stream task, Ibos et al. (2009) have estimated that an inter-hemispheric shift lasts around 55 ms, while an intra-hemispheric shift lasts around 38 ms. Using the same inter-hemispheric task in monkeys, we estimated an attention shift to last around 30 ms (unpublished data). This more plausible estimate in attention shift time will have as effect to produce more late RTs in the simulation. Second, it has been shown that, in an overt visual search task, subjects are not systematic and that they always re-explore some of the items. Nothdurft et al. (2009) estimated that there is 7% of re-exploration, whatever the number of items in the visual scene. Re-exploration could thus explain the late RTs in the tail of the real distributions and their absence from the simulated data. Third, it has been shown that, in an overt task, saccades that are not directed to the target usually land on the distractors that are the closest in feature to the target (Bichot and Schall, 1999). The same result is also obtained in a dual covert visual search task (Zenon et al., 2008, 2009a). This suggests that visual search, instead of calling on purely serial or purely parallel processes, actually involves a combination of serial shifts with a parallel pre-analysis of the scene. This should correlate with targets being preferentially found with a small number of attentional shifts, without excluding trials in which numerous shifts are needed to find the target (more shifts than just the number of items in the search array). An example of such a semi-serial scenario is presented in Figure 4 (right panels), favoring small numbers of shifts, with 7% of re-exploration (number of shifts > number of items), and a single shift lasting 30 ms. This simulation achieves a better replication of the real distributions and their characteristics, in particular the facts that the reciprobit plots start around a same point and diverge. A perfect fit of the data would require a precise individual estimation of several parameters of the search behavior: exact timing of the shift, difference between an intra- and an inter-hemispheric shift (Ibos et al., 2009) and exact proportion of trials with a small/large number of shifts.
To conclude this section, our data show that both monkeys have different behavioral strategies, and that the LATER model is well suited to describe a parallel processing of the visual scene as observed in Monkey M. For more complex behaviors involving, as in the case of Monkey G, serial processes, this model does not seem to provide an informative description of the functional processes underlying the RT distributions.
Effect of LIP Inactivation
LIP inactivation causes an increase in the mean RT necessary to detect a contralesional target, while no effect is observed for an ipsilesional target (Wardak et al., 2004). However, when the whole distribution is considered, a difference in the detection time of both ipsi- and contralesional targets between the control and inactivation condition is observed. Because the same effect is observed whatever the number of search items, and for sake of clarity, in the following, we pooled the data over search array configurations.
The effect of LIP inactivations on RT contralesional distributions is particularly clear in Monkey M. As can be observed in Figure 5A, the reciprobit inactivation plots (dashed lines) seem to swivel compared to the control data (solid line). This effect is significant in one of the search conditions, and marginally significant for another condition (easy feature p < 0.02, conjunction p = 0.072, difficult feature: likelihood swivel = likelihood shift). For Monkey G, only a tendency, going in the same direction, is observed for the difficult feature search condition (swivel p = 0.1), but globally there is no significant trend. Thus, at least in Monkey M, the effect of LIP inactivation appears to mainly affect the decision threshold.
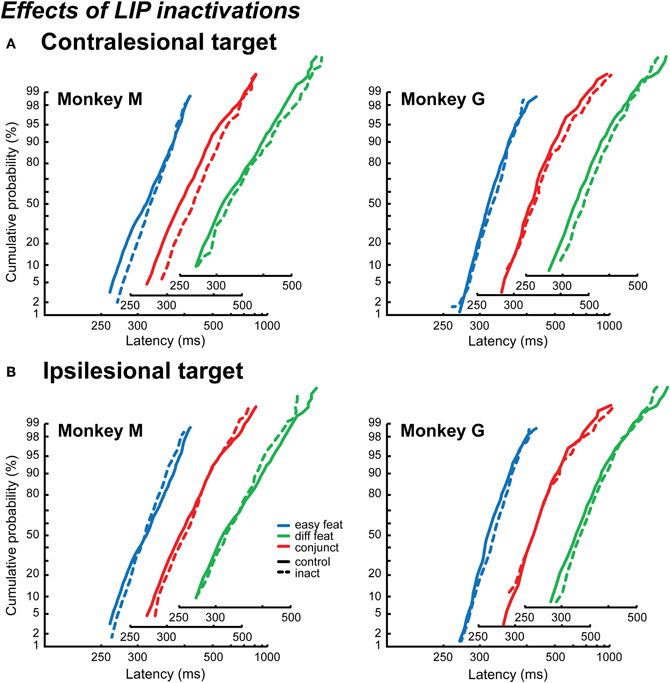
Figure 5. Effects of LIP inactivations on reaction time distributions. The distributions are plotted as reciprobits for the contralesional targets (A) and the ipsilesional targets (B), in Monkey M (left) and Monkey G (right). The different numbers of items conditions are cumulated, for the control conditions (solid lines) and the inactivation conditions (dashed lines). The x-axis is slightly shifted for the different search conditions in order to show the results more clearly.
Contrary to what was found when considering only the mean RT, an effect of LIP inactivations is observed on the ipsilateral distributions, especially in Monkey M. However, as can be observed in Figure 5B, this effect on the reciprobit plots is neither a shift nor a swivel, but rather a crossing of the lines. This kind of effect on the reciprobits has been observed by authors who manipulated the RT distribution of their subjects thanks to feedback, and it was specifically associated to a reduction in the variability of the distribution (Madelain et al., 2007). In the LATER model, this corresponds to a modification in the variance of the accumulation rate (σ), the result of which is a rotation of the two reciprobit lines one with respect to the other around the median (rotate, Figure 1B, right; Madelain et al., 2007). When including this rotation hypothesis to the LATER model, in addition to the swivel and shift hypotheses, it appears to explain Monkey M's results best (rotate vs. shift: p < 0.05 for easy featureand conjunction, marginally significant p = 0.068 for difficult feature search; rotate vs. swivel: p < 0.05 for easy and difficult feature search). None of these three hypotheses conclusively accounts for Monkey G ipsilesional distributions.
Focusing on Monkey M, we show that LIP inactivations affect the variance of the RT distribution for detecting an ipsilesional target. Why would it not affect also the variance of the RT distribution for a contralesional target? In fact, we cannot exclude this possibility. One limitation of the LATER model is that we cannot differentiate statistically a change of the decisional threshold (swivel) from a change in the accumulation rate taking place at the same time as a change in the variance (shift + rotate).
Effect of FEF Inactivation
The effects of FEF inactivations on RT distributions are very different from those of LIP inactivation (Figure 6). As for LIP inactivation results, we pooled the data for the different numbers of items.
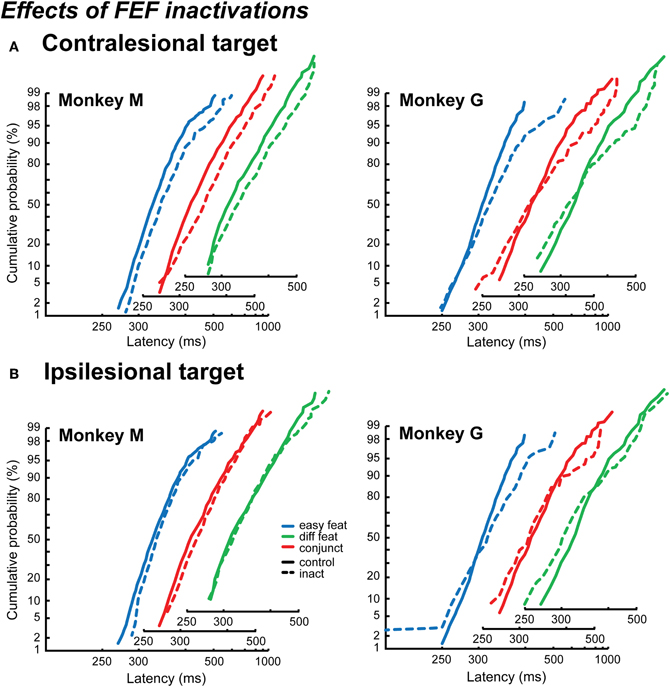
Figure 6. Effects of FEF inactivations on reaction time distributions. The distributions are plotted as reciprobits for the contralesional targets (A) and the ipsilesional targets (B), in Monkey M (left) and Monkey G (right). The different numbers of items conditions are cumulated, for the control conditions (solid lines) and the inactivation conditions (dashed lines). The x-axis is slightly shifted for the different search conditions in order to show the results more clearly.
As can be seen in Figure 6, the results from Monkey M and Monkey G are very different and are reminiscent of the different visual search strategies we describe in the control condition for each of them. In Monkey M, the reciprobit plots corresponding to the detection of a contralesional target (Figure 6A) are shifted with respect to the control condition for the three search conditions (likelihood shift > swivel > rotate, p < 0.01 for shift vs. swivel in the three conditions). This would correspond to a decrease in the accumulation rate. The effect on the ipsilesional reciprobit plots is smaller (Figure 6B) and no particular LATER hypothesis fits with the three search conditions (no significant difference between the shift and the swivel hypotheses). In Monkey G, we observe a rotation of the reciprobits, both for a contralesional and an ipsilesional target, in the three search conditions (Figures 6A and B; likelihood rotate > shift and swivel, p < 0.003 for all the comparisons), corresponding to an increase in the accumulation rate variance. The observations for ipsilesional target detections are very interesting as no significant effect was obtained when considering the mean RT independently of RT distribution (Wardak et al., 2006). A surprising result is also obtained in Monkey G for the easy feature search condition when the target is ipsilesional: we observe fast RTs, creating a second line in the reciprobit plot. Figure 7 shows that this result appears consistently for the three different numbers of items in the easy feature search configuration: these early RTs are comprised between 150 and 250 ms and correspond to less than 10% of the total distribution.
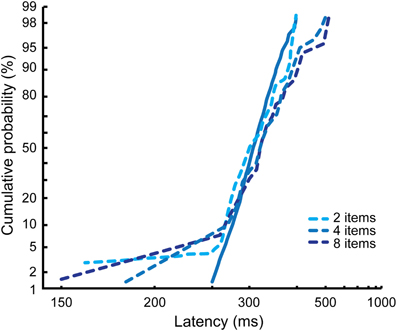
Figure 7. Effects of FEF inactivations on reaction time distributions for ipsilesional targets in the easy feature search condition in Monkey G. The different numbers of items conditions are cumulated for the control condition (solid line), but represented independently for the inactivation conditions (dashed lines).
Discussion
In the present work we reanalyze the effects of LIP and FEF inactivations on the monkeys' behavior in visual search tasks (Wardak et al., 2004, 2006) by considering the entire RT distributions and not only the mean RT. We use the LATER model to help us identify the possible functional mechanisms affected by these inactivations. We find that (1) the behavioral strategy to find the target differs between the two monkeys; (2) the effects of LIP and FEF inactivations are different, suggesting that different mechanisms are affected.
In the control condition, in the easy feature search condition, adding items affects neither the mean RT (Figure 2B) nor the RT distributions (Figure 3). However, we observe a different effect of adding items in the visual scene on the RT distributions of both monkeys in the two difficult search conditions. In Monkey M, adding items results in shifting the RT reciprobit plots. According to the LATER model, this corresponds to a decrease in accumulation rate, suggesting a parallel processing strategy. Indeed, adding items adds information in the visual scene representation and thus, in the context of a purely parallel target detection strategy, is expected to increase the time needed to reach a detection decision threshold. In Monkey G, the RT distributions corresponding to the different number of items conditions do not match any of the LATER hypotheses. We propose that, the best hypothesis that fits the data (i.e., reciprobit plots that start from a single point and then diverge as observed in Figure 3), is that of a combination of parallel and serial processes under the following constraints: (1) the target is mostly found after a small number of attentional shifts though in some trials more shifts are necessary, (2) some items of the visual scene can be visited more than once (corresponding to the re-exploration described by Nothdurft et al., 2009). Recent psychophysical observations confirm that such a mixed parallel and serial strategy prevails in difficult visual search contexts over purely serial processes (Guided Search theory, Wolfe et al., 1989; Zenon et al., 2008, 2009a,b). While the LATER model accurately accounts for a purely parallel process, it does not allow for a robust statistical fit of data generated from a mixed parallel/serial strategy. Incorporating an additional parameter, namely an increase in accumulation variance, improves the model's fitting of situations that produce a rotation in the reciprobit plots (Figures 5 and 6). However, it remains unable to describe complex situations inducing a combined shift plus rotation of the reciprobit plots, as expected from a mixed strategy involving parallel and serial sub-processes. Very few studies have looked at RT distributions in visual search tasks in humans (Strayer, 1997; Sung, 2008; Reynolds and Miller, 2009; Palmer et al., 2011). Heterogeneity in subjects' strategies has been observed (e.g., Figures 3–5 in Palmer et al., 2011) but never analysed nor discussed as an intrinsic aspect of visual search underlying sub-processes. We thus posit that, mirroring the individual visual strategies we describe here between our two monkeys, such individual differences also exist in human subjects and might explain some of the discrepancies in the visual search community, especially in experiments involving a very small number of subjects.
The effect of LIP inactivations on mean RT is an increase for the detection of a contralesional target, greater for difficult search conditions that for the easy condition, and no effect for the detection of an ipsilesional target except a decrease in RT variance for Monkey M (Wardak et al., 2004). Because the response to an easily detectable target is almost not affected, these results lead us to propose that LIP is involved in a kind of selection or competition process. What new light does considering the entire RT distribution bring about on the functional consequences of reversible inactivations? We do not observe an overall difference between the easy and the difficult searches. In Monkey M, LIP inactivations affect the detection of both a contra- and an ipsilesional target in different ways. For an ipsilesional target, the RT distributions show a reduced variance. For a contralesional target, the RT distributions show either an increased decisional threshold or a decreased variability combined to a decreased accumulation rate. Monkey G's results suggest the same trend, although our measures fail to reach statistically significance (nearly significant only for the most difficult search condition). From a functional point of view, a decrease in ipsilateral RT variance could correspond to a decrease in the level of noise in a saliency map. Alternatively, it could also correspond to a spatial bias (toward the ipsilesional side of space) narrowing the spatial representation considered for the search. These ipsilateral changes can be expected to have the following contralateral counterparts: (1) a noise increase (possibly correlating with an increased variance) that could lead the perceptual system to adjust the decisional threshold to avoid too many false alarms (we indeed observed more false alarms following LIP inactivations as reported in Wardak et al., 2004) and thus correspond to the swivel interpretation; or (2) after failing to find the target in the narrowed ipsilesional spatial map (imposing a fixed delay), a shift to search for the target in a narrowed contralesional spatial map, thus resulting in the observation of a shift combined with a rotation of the reciprobit plots. We cannot be more conclusive as both these functional (non-exclusive) hypotheses could fit with the possible roles of LIP in hosting a saliency map (Gottlieb et al., 1998) or participating to perceptual decision-making (Shadlen and Newsome, 1996).
The effects of FEF inactivations on mean RT are an increase for the detection of a contralesional target, equivalent for the three search conditions, and a small increase for the detection of an ipsilesional target for Monkey M (Wardak et al., 2006). Our original interpretation was that FEF inactivations affected the contraversive attentional shifts. The analysis of RT distributions shows very different results for the two monkeys that seem to match their control search strategy. In Monkey M, we observe a shift of the RT reciprobits for a contralesional target. As this monkey seems to analyze the visual scene in parallel, this would correspond to a decrease in the accumulation rate as proposed by the LATER model. This hypothesis would support the suggestion of some authors that FEF, like LIP, hosts a saliency map (Thompson and Bichot, 2005). However, this explanation cannot be generalized to the results of Monkey G. If we now focus on the ipsilateral detection behavior, Monkey M RT distributions are not very affected by FEF inactivations (even if it results in a small change in the mean RT). In contrast, in Monkey G, the reciprobit plots are very different from those of Monkey M, but very similar to contralesional target RT distributions: the general effect of FEF inactivations is an increase in RT variance. This could be due to an increased duration of contraversive attentional shifts. Alternatively, it could also result from an increase in the number of attentional shifts due to a working-memory deficit as has been shown in patients with frontal lesions (e.g., Walker et al., 1998). In addition to this general increased RT variance, these RT distributions also show that, especially for an ipsilesional target, many RTs are faster than in the control condition. A plausible interpretation is that, while contraversive shifts are longer following FEF inactivations, ispsiversive shifts are on the opposite faster. As these ipsilateral shifts can be produced both within the ipsilesional and the contralesional side of space, this could explain the complex shape of the reciprobits. These very short RTs for an ipsilesional target are also observed in an easy feature search condition, producing an early distribution separable from the main RT distribution (Figure 7). In the original LATER model, this kind of early distribution has been described as corresponding to express saccades. The fast manual RTs we describe are obviously functionally not equivalent to express saccades, but could correspond, as an alternative interpretation, to faster attentional shifts or a falicitated perception of the ipsilesional targets.
To conclude this section, we cannot propose a single functional mechanism that would be affected by FEF inactivations and explain the entire behavioral results of Monkey M and G, possibly because of their different behavioral strategies. However, our results fit with the proposed role of FEF in attention and perception (e.g., Thompson et al., 2005; Ding and Gold, 2012; also Ibos, Duhamel and Ben Hamed, submitted).
The LATER model we apply to our RT data completely relies on the assumption that the neuronal processes that underlie our behavioral observations follow a pure diffusion model with drift and low variance. Neuronal responses to target detection in the absence or in the presence (visual search task) of distracters are very similar in both the FEF (e.g., Thompson et al., 2005) and LIP (Oristaglio et al., 2006; Balan et al., 2008) and they reflect information accumulation about the presence of the target. However, to our knowledge, there is no report, in these two areas, of noticeable changes in baseline variability between these target detection and visual search conditions nor of baseline changes as a function of visual search difficulty or the number of distracters. The former situation is expected to lead sub-optimal fits by the model, while the latter situation is expected to lead an erroneous threshold change hypothesis. Only direct neuronal recordings can allow us to directly address this point and validate the framework RTs are interpreted in.
In conclusion, this re-analysis of the effect of LIP or FEF inactivations on RTs in a covert visual search task shows that the entire RT distribution contains information worth considering. For example, in Monkey G, the effects of FEF inactivations do not affect the mean RT for detecting an ipsilesional target, whereas their actual effects on the RT distribution is huge. We cannot conclude decisively about the functional mechanisms affected by both LIP and FEF inactivations, because several alternative hypotheses could fit the results. However, what is very clear is that both inactivations have very different effects on the RTs distributions in the two monkeys, much more striking that the subtle differences we already reported on mean RTs. These differences of results between the two monkeys most likely arise from the specific visual search strategy of each animal. Our analyses relied on the LATER model, which has been demonstrated to be a very useful tool to study RTs distributions, thanks to very few parameters. Here, we demonstrate a limitation of this model, in that it does not allow to fit all the behavioral strategies encountered in visual search.
Conflict of Interest Statement
The authors declare that the research was conducted in the absence of any commercial or financial relationships that could be construed as a potential conflict of interest.
Acknowledgments
We would like to thank P. Pouget for help with the LATER model, and J.-L. Charieau for invaluable technical assistance. This work was supported by the French Ministry of Research (Action ConcertéeIncitative Neuroscience).
References
Astafiev, S. V., Shulman, G. L., Stanley, C. M., Snyder, A. Z., Van Essen, D. C., and Corbetta, M. (2003). Functional organization of human intraparietal and frontal cortex for attending, looking, and pointing. J. Neurosci. 23, 4689–4699.
Balan, P. F., Oristaglio, J., Schneider, D. M., and Gottlieb, J. (2008). Neuronal correlates of the set-size effect in monkey lateral intraparietal area. PLoS Biol. 6:e158. doi: 10.1371/journal.pbio.0060158
Barash, S., Bracewell, R. M., Fogassi, L., Gnadt, J. W., and Andersen, R. A. (1991). Saccade-related activity in the lateral intraparietal area. II. Spatial properties. J. Neurophysiol. 66, 1109–1124.
Ben Hamed, S., Duhamel, J. R., Bremmer, F., and Graf, W. (2001). Representation of the visual field in the lateral intraparietal area of macaque monkeys: a quantitative receptive field analysis. Exp. Brain Res. 140, 127–144.
Bichot, N. P., and Schall, J. D. (1999). Effects of similarity and history on neural mechanisms of visual selection. Nat. Neurosci. 2, 549–554.
Bisley, J. W., and Goldberg, M. E. (2003). Neuronal activity in the lateral intraparietal area and spatial attention. Science 299, 81–86.
Bruce, C. J., and Goldberg, M. E. (1985). Primate frontal eye fields. I. Single neurons discharging before saccades. J. Neurophysiol. 53, 603–635.
Bruce, C. J., Goldberg, M. E., Bushnell, M. C., and Stanton, G. B. (1985). Primate frontal eye fields. II. Physiological and anatomical correlates of electrically evoked eye movements. J. Neurophysiol. 54, 714–734.
Carpenter, R. H., and Williams, M. L. (1995). Neural computation of log likelihood in control of saccadic eye movements. Nature 377, 59–62.
Colby, C. L., Duhamel, J. R., and Goldberg, M. E. (1993). Ventral intraparietal area of the macaque: anatomic location and visual response properties. J. Neurophysiol. 69, 902–914.
Colby, C. L., Duhamel, J.-R., and Goldberg, M. E. (1996). Visual, presaccadic and cognitive activation of single neurons in monkey lateral intraparietal area. J. Neurophysiol. 76, 2841–2852.
Corbetta, M., Akbudak, E., Conturo, T. E., Snyder, A. Z., Ollinger, J. M., Drury, H. A., Linenweber, M. R., Petersen, S. E., Raichle, M. E., Van Essen, D. C., and Shulman, G. L. (1998). A common network of functional areas for attention and eye movements. Neuron 21, 761–773.
Cornette, L., Dupont, P., Dalmon, E., and Orban, G. A. (2001). The neural substrate of orientation working memory. J. Cogn. Neurosci. 13, 813–828.
Ding, L., and Gold, J. I. (2012). Neural correlates of perceptual decision making before, during, and after decision commitment in monkey frontal eye field. Cereb. Cortex 22, 1052–1067.
Gnadt, J. W., and Andersen, R. A. (1988). Memory related motor planning activity in posterior parietal cortex of macaque. Exp. Brain Res. 70, 216–220.
Gottlieb, J. P., Kusunoki, M., and Goldberg, M. E. (1998). The representation of visual salience in monkey parietal cortex. Nature 391, 481–484.
Hanes, D. P., Patterson, W. F. 2nd, and Schall, J. D. (1998). Role of frontal eye fields in countermanding saccades: visual, movement, and fixation activity. J. Neurophysiol. 79, 817–834.
Hanes, D. P., and Schall, J. D. (1996). Neural control of voluntary movement initiation. Science 274, 427–430.
Hays, A. V., Richmond, B. J., and Optican, L. M. (1982). A UNIX-based multiple-process system for real-time data acquisition and control. WESCON Conf. Proc. 2, 1–10.
Hopfinger, J. B., Buonocore, M. H., and Mangun, G. R. (2000). The neural mechanisms of top-down attentional control. Nat. Neurosci. 3, 284–291.
Horowitz, T. S., Holcombe, A. O., Wolfe, J. M., Arsenio, H. C., and DiMase, J. S. (2004). Attentional pursuit is faster than attentional saccade. J. Vis. 4, 585–603.
Ibos, G., Duhamel, J.-R., and Ben Hamed, S. (2009). The spatial and temporal deployment of voluntary attention across the visual field. PLoS ONE 4:e6716. doi: 10.1371/journal.pone.0006716
Johnson, P. B., Ferraina, S., Bianchi, L., and Caminiti, R. (1996). Cortical networks for visual reaching: physiological and anatomical organization of frontal and parietal lobe arm regions. Cereb. Cortex 6, 102–119.
Judge, S. J., Richmond, B. J., and Chu, F. C. (1980). Implantation of magnetic searchcoils for measurements of eye position: an improved method. Vision Res. 20, 535–538.
Kodaka, Y., Mikami, A., and Kubota, K. (1997). Neuronal activity in the frontal eye field of the monkey is modulated while attention is focused on to a stimulus in the peripheral visual field, irrespective of eye movement. Neurosci. Res. 28, 291–298.
Koyama, M., Hasegawa, I., Osada, T., Adachi, Y., Nakahara, K., and Miyashita, Y. (2004). Functional magnetic resonance imaging of macaque monkeys performing visually guided saccade tasks: comparison of cortical eye fields with humans. Neuron 41, 795–807.
LaBar, K. S., Gitelman, D. R., Parrish, T. B., and Mesulam, M.-M. (1999). Neuroanatomic overlap of working memory and spatial attention networks: a functional MRI comparison within subjects. Neuroimage 10, 695–704.
Li, C. S., and Andersen, R. A. (2001). Inactivation of macaque lateral intraparietal area delays initiation of the second saccade predominantly from contralesional eye positions in a double-saccade task. Exp. Brain Res. 137, 45–57.
Li, C. S., Mazzoni, P., and Andersen, R. A. (1999). Effect of reversible inactivation of macaque lateral intraparietal area on visual and memory saccades. J. Neurophysiol. 81, 1827–1838.
Machens, C. K., Romo, R., and Brody, C. D. (2005). Flexible control of mutual inhibition: a neural model of two-interval discrimination. Science 307, 1121–1124.
Madelain, L., Champrenaut, L., and Chauvin, A. (2007). Control of sensorimotor variability by consequences. J. Neurophysiol. 98, 2255–2265.
Malpeli, J. G. (1999). Reversible inactivation of subcortical sites by drug injection. J. Neurosci. Methods 86, 119–128.
Martin, J. H., and Ghez, C. (1999). Pharmacological inactivation in the analysis of the central control of movement. J. Neurosci. Methods 86, 145–159.
Naghavi, H. R., and Nyberg, L. (2005). Common front-parietal activity in attention, memory, and consciousness: shared demands on integration? Conscious. Cogn. 14, 390–425.
Nakayama, K., and Silverman, G. H. (1986). Serial and parallel processing of visual feature conjunctions. Nature 320, 264–265.
Nothdurft, H. C., Pigarev, I. N., and Kastner, S. (2009). Overt and covert visual search in primates: reaction times and gaze shift strategies. J. Integr. Neurosci. 8, 137–174.
Olivers, C. N. L. (2008). Interactions between visual working memory and visual attention. Front. Biosci. 13, 1182–1191.
Oristaglio, J., Schneider, D. M., Balan, P. F., and Gottlieb, J. (2006). Integration of visuospatial and effector information during symbolically cued limb movements in monkey lateral intraparietal area. J. Neurosci. 26, 8310–8319.
Palmer, E. M., Horowitz, T. S., Torralba, A., and Wolfe, J. M. (2011). What are the shapes of response time distributions in visual search? J. Exp. Psychol. Hum. Percept. Perform. 37, 58–71.
Ratcliff, R. (1979). Group reaction time distributions and an analysis of distribution statistics. Psychol. Bull. 86, 446–461.
Reddi, B. A., Asrress, K. N., and Carpenter, R. H. (2003). Accuracy, information, and response time in a saccadic decision task. J. Neurophysiol. 90, 3538–3546.
Reddi, B. A., and Carpenter, R. H. (2000). The influence of urgency on decision time. Nat. Neurosci. 3, 827–830.
Reynolds, A., and Miller, J. (2009). Display size effects in visual search: analyses of reaction time distributions as mixtures. Q. J. Exp. Psychol. (Hove) 62, 988–1009.
Sakata, H., Taira, M., Murata, A., and Mine, S. (1995). Neural mechanisms of visual guidance of hand action in the parietal cortex of the monkey. Cereb. Cortex 5, 429–438.
Sereno, A. B., and Amador, S. C. (2006). Attention and memory-related responses of neurons in the lateral intraparietal area during spatial and shape-delayed match-to-sample tasks. J. Neurophysiol. 95, 1078–1098.
Shadlen, M. N., and Newsome, W. T. (1996). Motion perception: seeing and deciding. Proc. Natl. Acad. Sci. U.S.A. 93, 628–633.
Strayer, D. L. (1997). Testing race models of visual search. J. Exp. Psychol. Hum. Percept. Perform. 23, 566–581.
Sung, K. (2008). Serial and parallel attentive visual searches: evidence from cumulative distribution functions of response times. J. Exp. Psychol. Hum. Percept. Perform. 34, 1372–1388.
Tehovnik, E. J., and Sommer, M. A. (1997). Electrically evoked saccades from the dorsomedial frontal cortex and frontal eye fields: a parametric evaluation reveals differences between areas. Exp. Brain Res. 117, 369–378.
Thompson, K. G., and Bichot, N. P. (2005). A visual salience map in the primate frontal eye field. Prog. Brain Res. 147, 251–262.
Thompson, K. G., Biscoe, K. L., and Sato, T. R. (2005). Neuronal basis of covert spatial attention in the frontal eye field. J. Neurosci. 25, 9479–9487.
Treisman, A. M., and Gelade, G. (1980). A feature-integration theory of attention. Cogn. Psychol. 12, 97–136.
Walker, R., Husain, M., Hodgson, T. L., Harrison, J., and Kennard, C. (1998). Saccadic eye movement and working memory deficits following damage to human prefrontal cortex. Neuropsychologia 36, 1141–1159.
Wang, X. J. (2002). Probabilistic decision making by slow reverberation in cortical circuits. Neuron 36, 955–968.
Wardak, C., Ibos, G., Duhamel, J.-R., and Olivier, E. (2006). Contribution of the monkey frontal eye field (FEF) to covert visual attention. J. Neurosci. 26, 4228–4235.
Wardak, C., Olivier, E., and Duhamel, J.-R. (2002). Saccadic target selection deficits after lateral intraparietal area inactivation in monkeys. J. Neurosci. 22, 9877–9884.
Wardak, C., Olivier, E., and Duhamel, J.-R. (2004). A deficit in covert attention after parietal cortex inactivation in the monkey. Neuron 42, 501–508.
Wardak, C., Olivier, E., and Duhamel, J.-R. (2011). The relationship between spatial attention and saccades in the frontoparietal network of the monkey. Eur. J. Neurosci. 33, 1973–1981.
Wolfe, J. M., Alvarez, G. A., and Horowitz, T. S. (2000). Attention is fast but volition is slow. Nature 406, 691.
Wolfe, J. M., Cave, K. R., and Franzel, S. L. (1989). Guided search: an alternative to the feature integration model for visual search. J. Exp. Psychol. Hum. Percept. Perform. 15, 419–433.
Wong, K. F., and Wang, X. J. (2006). A recurrent network mechanism of time integration in perceptualdecisions. J. Neurosci. 26, 1314–1328.
Zenon, A., Ben Hamed, S., Duhamel, J.-R., and Olivier, E. (2008). Spatial and temporal dynamics of attentional guidance during inefficient visual search. PLoS ONE 3:e2219. doi: 10.1371/journal.pone.0002219
Zenon, A., Ben Hamed, S., Duhamel, J.-R., and Olivier, E. (2009a). Attentional guidance relies on a winner-take-all mechanism. Vision Res. 49, 1522–1531.
Keywords: LIP, FEF, visual search, inactivation, manual reaction times, LATER model, distribution
Citation: Wardak C, Ben Hamed S, Olivier E and Duhamel J-R (2012) Differential effects of parietal and frontal inactivations on reaction times distributions in a visual search task. Front. Integr. Neurosci. 6:39. doi: 10.3389/fnint.2012.00039
Received: 28 March 2012; Accepted: 11 June 2012;
Published online: 29 June 2012.
Edited by:
Christos Constantinidis, Wake Forest University, USAReviewed by:
Pierre Pouget, Vanderbilt University, USANarcisse Bichot, Massachusetts Institute of Technology, USA
Copyright: © 2012 Wardak, Ben Hamed, Olivier and Duhamel. This is an open-access article distributed under the terms of the Creative Commons Attribution Non Commercial License, which permits non-commercial use, distribution, and reproduction in other forums, provided the original authors and source are credited.
*Correspondence: Claire Wardak, Centre de Neuroscience Cognitive, Centre National de la Recherche Scientifique, UMR5229, Université Claude Bernard Lyon 1, 67 bd Pinel, Bron Cedex 69675, France. e-mail: wardak@isc.cnrs.fr