Grouping and classifying electrophysiologically-defined classes of neocortical neurons by single cell, whole-genome expression profiling
1
Gurdon Institute and Department of Biochemistry, University of Cambridge, Cambridge, UK
2
Department of Physiology, Development and Neuroscience, University of Cambridge, Cambridge, UK
The diversity of neuronal cell types and how to classify them are perennial questions in neuroscience. The advent of global gene expression analysis raised the possibility that comprehensive transcription profiling will resolve neuronal cell types into groups that reflect some or all aspects of their phenotype. This approach has been successfully used to compare gene expression between groups of neurons defined by a common property. Here we extend this approach to ask whether single neuron gene expression profiling can prospectively resolve neuronal subtypes into groups, independent of any phenotypic information, and whether those groups reflect meaningful biological properties of those neurons. We applied methods we have developed to compare gene expression among single neural stem cells to study global gene expression in 18 randomly picked neurons from layer II/III of the early postnatal mouse neocortex. Cells were selected by morphology and by firing characteristics and electrical properties, enabling the definition of each cell as either fast- or regular-spiking, corresponding to a class of inhibitory interneurons or excitatory pyramidal cells. Unsupervised clustering of young neurons by global gene expression resolved the cells into two groups and those broadly corresponded with the two groups of fast- and regular-spiking neurons. Clustering of the entire, diverse group of 18 neurons of different developmental stages also successfully grouped neurons in accordance with the electrophysiological phenotypes, but with more cells misassigned among groups. Genes specifically enriched in regular spiking neurons were identified from the young neuron expression dataset. These results provide a proof of principle that single-cell gene expression profiling may be used to group and classify neurons in a manner reflecting their known biological properties and may be used to identify cell-specific transcripts.
The question of the diversity of neuron types is a challenging contemporary problem in neuroscience (Nelson et al., 2006
). It is generally held that a definitive parts list is essential to the accurate description of neuronal circuits and their potential functions (Bota and Swanson, 2007
). However, the degree of neuronal diversity and its functional importance are areas of much debate, with a range of views on the degree to which neurons differ and the extent to which they should be grouped (see for example, Masland and Raviola, 2000
). Much of the difficulty in defining neuronal cell types has stemmed from the absence of agreement over which neuronal properties can and should be used to define a neuronal cell type. Current and previous strategies for classifying neurons in any region of the central nervous system (CNS) rely on the use of one or more neuronal property, such as morphology, neurotransmitters, passive and active electrical properties, and expression of small numbers of molecular markers, typically proteins (Ascoli et al., 2008
).
The use of those approaches is exemplified by the concerted effort by many researchers to define the diversity of GABAergic interneurons in the cerebral cortex (Ascoli et al., 2008
). Despite comprising 20% of the neurons in the mouse cortex (excitatory pyramidal cells constitute the other 80%), GABAergic interneurons are highly diverse in terms of morphology and electrical and molecular properties (Ascoli et al., 2008
). Ongoing studies have emphasised the notable diversity of GABAergic interneurons when classifying cells by morphology, projections and electrical properties (Helmstaedter et al., 2009a
,b
), or by neuropeptide expression (Karagiannis et al., 2009
). Classifications of interneurons based on electrical properties do not directly correspond to those based on molecular markers (Markram et al., 2004
), although it is possible to classify neurons by single cell RT-PCR analysis of expression of key genes, such as ion channels (Toledo-Rodriguez et al., 2004
). Excitatory pyramidal neurons also exhibit considerable diversity in terms of morphology and connectivity, although to a lesser degree than interneurons (Thomson and Lamy, 2007
).
In addition to now classical methods of defining cell types by mRNA and protein expression, there have been several notable studies using global expression profiling of defined groups of neurons to identify novel cortical cell type-specific transcripts (Arlotta et al., 2005
; Rossner et al., 2006
; Sugino et al., 2006
). Retrograde labelling from targets was used to isolate two classes of layer V neurons, enabling the identification of cell-type specific genes by expression profiling (Arlotta et al., 2005
). In a complementary approach, twelve mouse forebrain neuronal populations were isolated by cell-specific transgene expression and expression profiled to identify cell-specific gene expression combinations (Sugino et al., 2006
). A taxonomy of cell types based solely on the gene expression data correctly reflected the expected relationships between the different populations, confirming that global expression profiling can correctly identify neuronal subtypes (Sugino et al., 2006
).
Here we extend this approach to ask whether single neuron gene expression profiling can prospectively resolve neuronal subtypes into groups, independent of any phenotypic information, and whether those groups reflect meaningful biological properties of those neurons. To do so, we applied methods we developed to compare gene expression among single neural stem cells (Subkhankulova and Livesey, 2006
; Subkhankulova et al., 2008
) to study global gene expression between single neurons from layer II/III of mouse neocortex (Yano et al., 2006
).
In proof of principle experiments, we find that global expression profiling of single cortical neurons can be used prospectively to group and classify neurons in a manner reflecting their physiological properties. The potential advantage of this approach is that it suggests that deep sampling of complex neuronal populations by single cell expression profiling may be a useful approach for defining neuronal complexity in the CNS. However, in this case we used electrophysiology and morphology to restrict the diversity of the population analysed. It will be of interest in future studies to carry out single cell expression studies of unselected neuronal populations to assess whether it is possible to use such data to generate biologically meaningful groupings of neuronal types.
Patch-Clamp Recording from Neocortical Neurons
Forebrains were acutely harvested from postnatal CD1 mice ranging in age from 5 to 20 days sacrificed according to United Kingdom Home Office and local ethical guidelines. 300 μm thick sagittal slices of cortex containing the somatosensory region were cut with a vibratome (Microslicer DTK-3000, D. S. K., Kyoto, Japan). During slicing, tissue was kept in a low-sodium solution of the following composition (in mM): 254 sucrose, 2.5 KCl, 26 NaHCO3, 10 glucose, 1.25 NaH2PO4, 2 CaCl2, and 1 MgCl2. The recording Ringer solution contained (in mM):125 NaCl, 2.5 KCl, 25 NaHCO3, 25 glucose, 1.25 NaH2PO4, 2 CaCl2, and 1 MgCl2. Both slicing and recording solutions were equilibrated with 95% O2, 5% CO2 gas to a final pH of 7.4.
Single cortical neurons were identified in layer II/III of the slices using an infrared differential interference contrast microscope (Olympus BX50WI) and their electrophysiological properties were obtained by whole cell patch clamping as described (Tateno et al., 2005
), with the addition of recombinant RNase inhibitors to the pipette solution. Somatic patch-pipette recordings were made with a Multiclamp 700-A amplifier (Axon Instruments, Foster City, CA, USA) in current-clamp mode, correcting for prenulled liquid junction potential. Whole cell recording pipettes (Clark GC150T-7.5) of resistance 3.9–4.3 MΩ were filled with the following intracellular solution, based on that of Monyer and Jonas (1995)
: 140 mM KCl, 5 mM EGTA, 3 mM MgCl2, 5 mM HEPES, pH adjusted to 7.3 with KOH; in this case 200 units/ml of SUPERase-In RNase inhibitor (Ambion, Austin Texas, USA) were added and KCl concentration reduced to 125–130 mM to achieve the same final osmolarity as the Monyer and Jonas solution. Neurons for RNA harvesting were selected by morphology and on their firing properties in order to restrict the range of cell types sampled for gene expression profiling. Recordings were carried out at room temperature to reduce RNase activity. Signals were low-pass filtered at 5 kHz (4-pole Bessel filter) and sampled at 20 kHz with 12-bit resolution, using a National Instruments analog card, and custom software (MatDAQ, Hugh Robinson, 1995–2010), written in Matlab and C. Stimulus generation was also at a 20 kHz rate, with 12-bit resolution. All analysis was performed in Matlab (Mathworks, Natick, MA, USA). Classification of cells as regular spiking (RS) or fast spiking (FS) was based quantitatively on their clearly different spike shapes, and agreed with other features such as maximum spike rate and the qualitative pattern of spike firing at threshold (Tateno et al., 2004
), and the pyramidal (RS) and nonpyramidal (FS) morphology under infrared differential interference contrast optics. Action potentials from responses just above threshold were convolved with the first derivative of a Gaussian function: G’(t) = −t exp[−t2/(2σ2)], where σ = 1.3 ms, to produce a smoothed first-derivative of the action potential voltage trajectory. This was then aligned by the first negative-going zero-crossing (corresponding to the AP peak), and the interval to the second, positive-going zero-crossing (corresponding to the interspike membrane potential minimum) was measured. FS cells are defined as showing intervals less than 10 ms, while RS cells had intervals of 20 ms or greater.
Single Cell Total mRNA Amplification and Expression Profiling
The cytoplasmic contents of each neuron were harvested after recording by aspiration into the patch pipette and deposited in a total volume of 5 μl. Total RNA was isolated from the cytoplasmic contents by the acid phenol-guanidinum extraction method (Trizol, Sigma; (Chomczynski and Sacchi, 1987
). Total RNA was precipitated in ethanol in the presence of 100 pg polyinosinic acid (Sigma) and 1 μl of linear polyacrylamide (Ambion) as carriers to reduce the loss of low copy number mRNAs. Total mRNA from each of 18 neuronal cells was globally amplified using a PCR-based technique (Brady and Iscove, 1993
; Brady et al., 1995
; Iscove et al., 2002
) with minor variations (Subkhankulova and Livesey, 2006
). PCR products were purified with the CyScribe GFX Purification kit (Amersham Bioscience) and labeled with Cy3/Cy5-modified dCTP using Klenow DNA polymerase (BD Bioscience). The labeled samples were hybridized against a reference of amplified cDNA pooled from all of the neurons studied. Gene expression was studied using mouse oligonucleotide arrays printed in-house (65-mer, 23232 oligonucleotides representing ∼20,000 genes; Compugen oligonucleotide library) in pairs of dye-swapped hybridisations, as previously described (Subkhankulova and Livesey, 2006
; Subkhankulova et al., 2008
). Images of hybridised arrays were gathered on a microarray scanner (Axon Instruments GenePix). Data from single microarrays were extracted using the GenePix analysis package. The mean intensity of each feature (spot) and the local background at 532 nm (Cy3) and 635 nm (Cy5) were extracted. The background-corrected 635 nm/532 nm ratio was calculated for each feature as the initial measurement of relative mRNA levels for each gene represented on the array.
Single Cell qRT-PCR
Single cell qRT-PCR was carried out using the globally amplified single cell cDNA as a template. Each real time PCR mix contained was carried out in a 10 μl final volume, containing 0.2 μl of each primer (10 mM) and 5 μl 2 × Master mix (DyNAmo Capillary SYBR Green qPCR Kit, Finnzymes). Intron-spanning primers were designed to Emx1, a pyramidal neuron-specific transcript (Chan et al., 2001
), and GAD65/GAD2, a GABAergic interneuron-specific transcript (Katarova et al., 2000
), using Primer3 software
1
, based on gene transcript information from the Ensembl genome browser
2
. Primer sequences were: Emx2, GAGCGAGCCTTTGAGAAGAA and CTGGAACCACACCTTCACCT; GAD65/GAD2, AGATCGCCCCTGTATTTGTG and GCATGGCATACATGTTGGAG. Real-time PCR was performed in a LightCycler (Roche Diagnostics) according to DyNAmo Capillary SYBR Green qPCR protocol. Ct values were determined using the maximum second derivative function in the LightCycler software (Roche Diagnostics). Generation of PCR products was confirmed by melting curve analysis and gel electrophoresis. qPCR results were classified as absent (−) if Ct values were higher than 35 and no single peak was observed from the melting curve, detectable above background (+/−) if a single peak was observed from the melting curve and Ct values were lower than 34, and expressed significantly above background (+) if a single melting curve peak was present and Ct values were lower than 30.
Analysis of Microarray Data
All microarray data were analysed using the Acuity platform (Axon Instruments/Molecular Dynamics). Expression data from each array were normalized by locally-weighted regression (lowess) analysis. For data analysis of each group of arrays, data were filtered to remove low intensity features, features reporting gene expression in less than two thirds of the arrays in the set and features that did not show evidence for enriched expression in at least three cells in a set (empirically set at a 1.5-fold enrichment). Genes and arrays were pair-wise, hierarchically clustered using Pearson’s correlation coefficients as similarity metrics. Similar results were obtained using alternative hierarchical clustering metrics (Euclidean distance, for example), with minor variations in the assignment of cells within clusters. Hierarchical cluster dendrograms were built by iterative, pair-wise similarity comparisons, using Pearson’s correlation coefficients.
To identify genes with robust differential enrichment between young fast- and regular-spiking neurons, Student’s t-testing was used to identify genes differentially expressed between the two groups (p < 0.05). Expression ratios of genes identified as significantly differing in expression between the groups were averaged to rank genes for enrichment in RS or FS cells, and those groups were visualized by hierarchical clustering. In situ hybridization data for adult expression of genes identified as enriched in each cell class were extracted from the Allen Brain Atlas’ mouse brain database (mouse.brain-map.org) (Lein et al., 2007
).
Classification of Neurons into RS or FS Cell Types for Expression Profiling
The goal of this study was to explore whether the global expression profiles of neuronal cells could be used to prospectively cluster neurons into groups that reflected their neuronal firing properties. For this purpose, we chose to expression profile neurons in two broad categories of morphologically and electrophysiologically-defined cortical neurons: regular-spiking cells of pyramidal morphology, corresponding to glutamatergic, excitatory pyramidal neurons (Connors and Gutnick, 1990
); and fast-spiking, non-pyramidal cells, corresponding to GABAergic inhibitory interneurons of basket morphology that express parvalbumin (Kawaguchi and Kondo, 2002
). To do so, we analysed 18 cells from layer II/III of mouse neocortex harvested between postnatal days 5 (P5) and P20: 10 young neurons (all P13 and older) and 8 immature neurons (aged between P5 and P10). The firing properties of this set of neurons were measured individually for each cell, following which the cytoplasm of each cell was harvested for global mRNA amplification (Figure 1
).
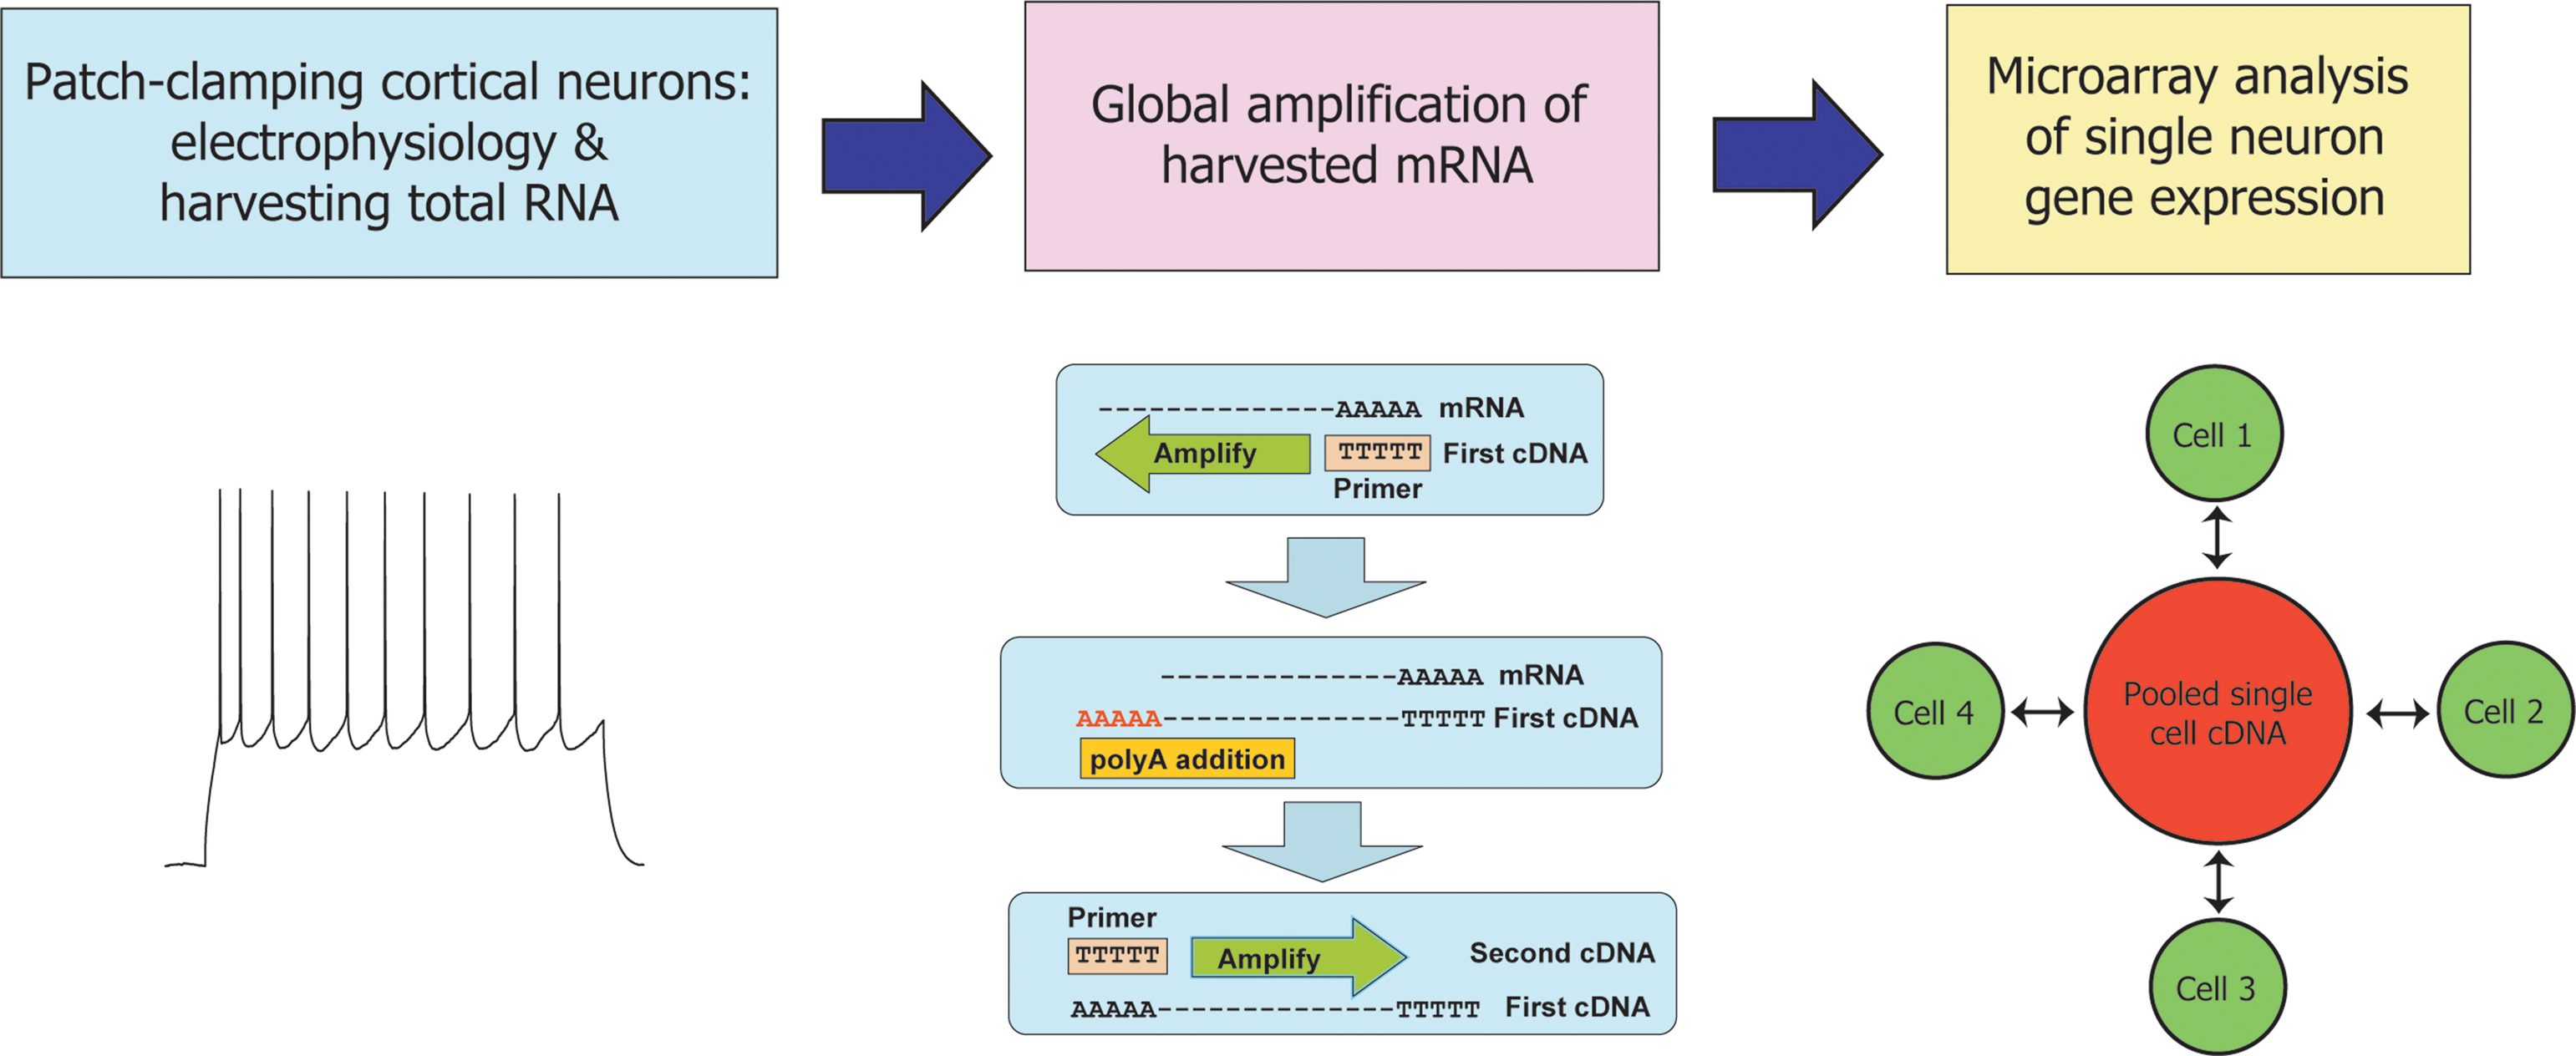
Figure 1. Expression profiling of single mouse cortical neurons following characterization of their electrical properties. Experimental design of the study reported here. Layer II/III neurons were patch-clamped and their firing properties analysed as described (Materials and Methods). The cytoplasmic contents of each cell were harvested by aspiration into the patch pipette and total single cell mRNA was amplified by a global polyadenylated PCR-based method. Amplified cDNA from each neuron was compared against a common reference of amplified cDNA pooled from all 18 cells in a set of paired, dye-swapped hybridizations, such that a total of 36 microarray hyridizations were performed.
The set of all recorded cells contained 7 RS and 11 FS cells. RS cells showed a pyramidal morphology, while FS cells generally had a nonpyramidal, multipolar morphology under infrared differential interference contrast microscopy (Connors et al., 1982
). As in a previous study (Tateno et al., 2004
), regular-spiking neurons (Figure 2
A) showed an ability to fire repetitively at very low frequencies (<10 Hz), a relatively slow spike waveform and lacked a pronounced after hyperpolarization. Fast-spiking neurons (Figure 2
B), in contrast showed a very fast action potential waveform, a large-amplitude, sharp after hyperpolarization, stable periodic firing only at a relatively high frequency (>10 Hz), and usually a high maximal firing rate. Depolarization block was pronounced at higher current levels in some recordings in each type of cell, potentially as a consequence of the high levels of RNase inhibitor, which is not a normal component of whole-cell pipette solutions.
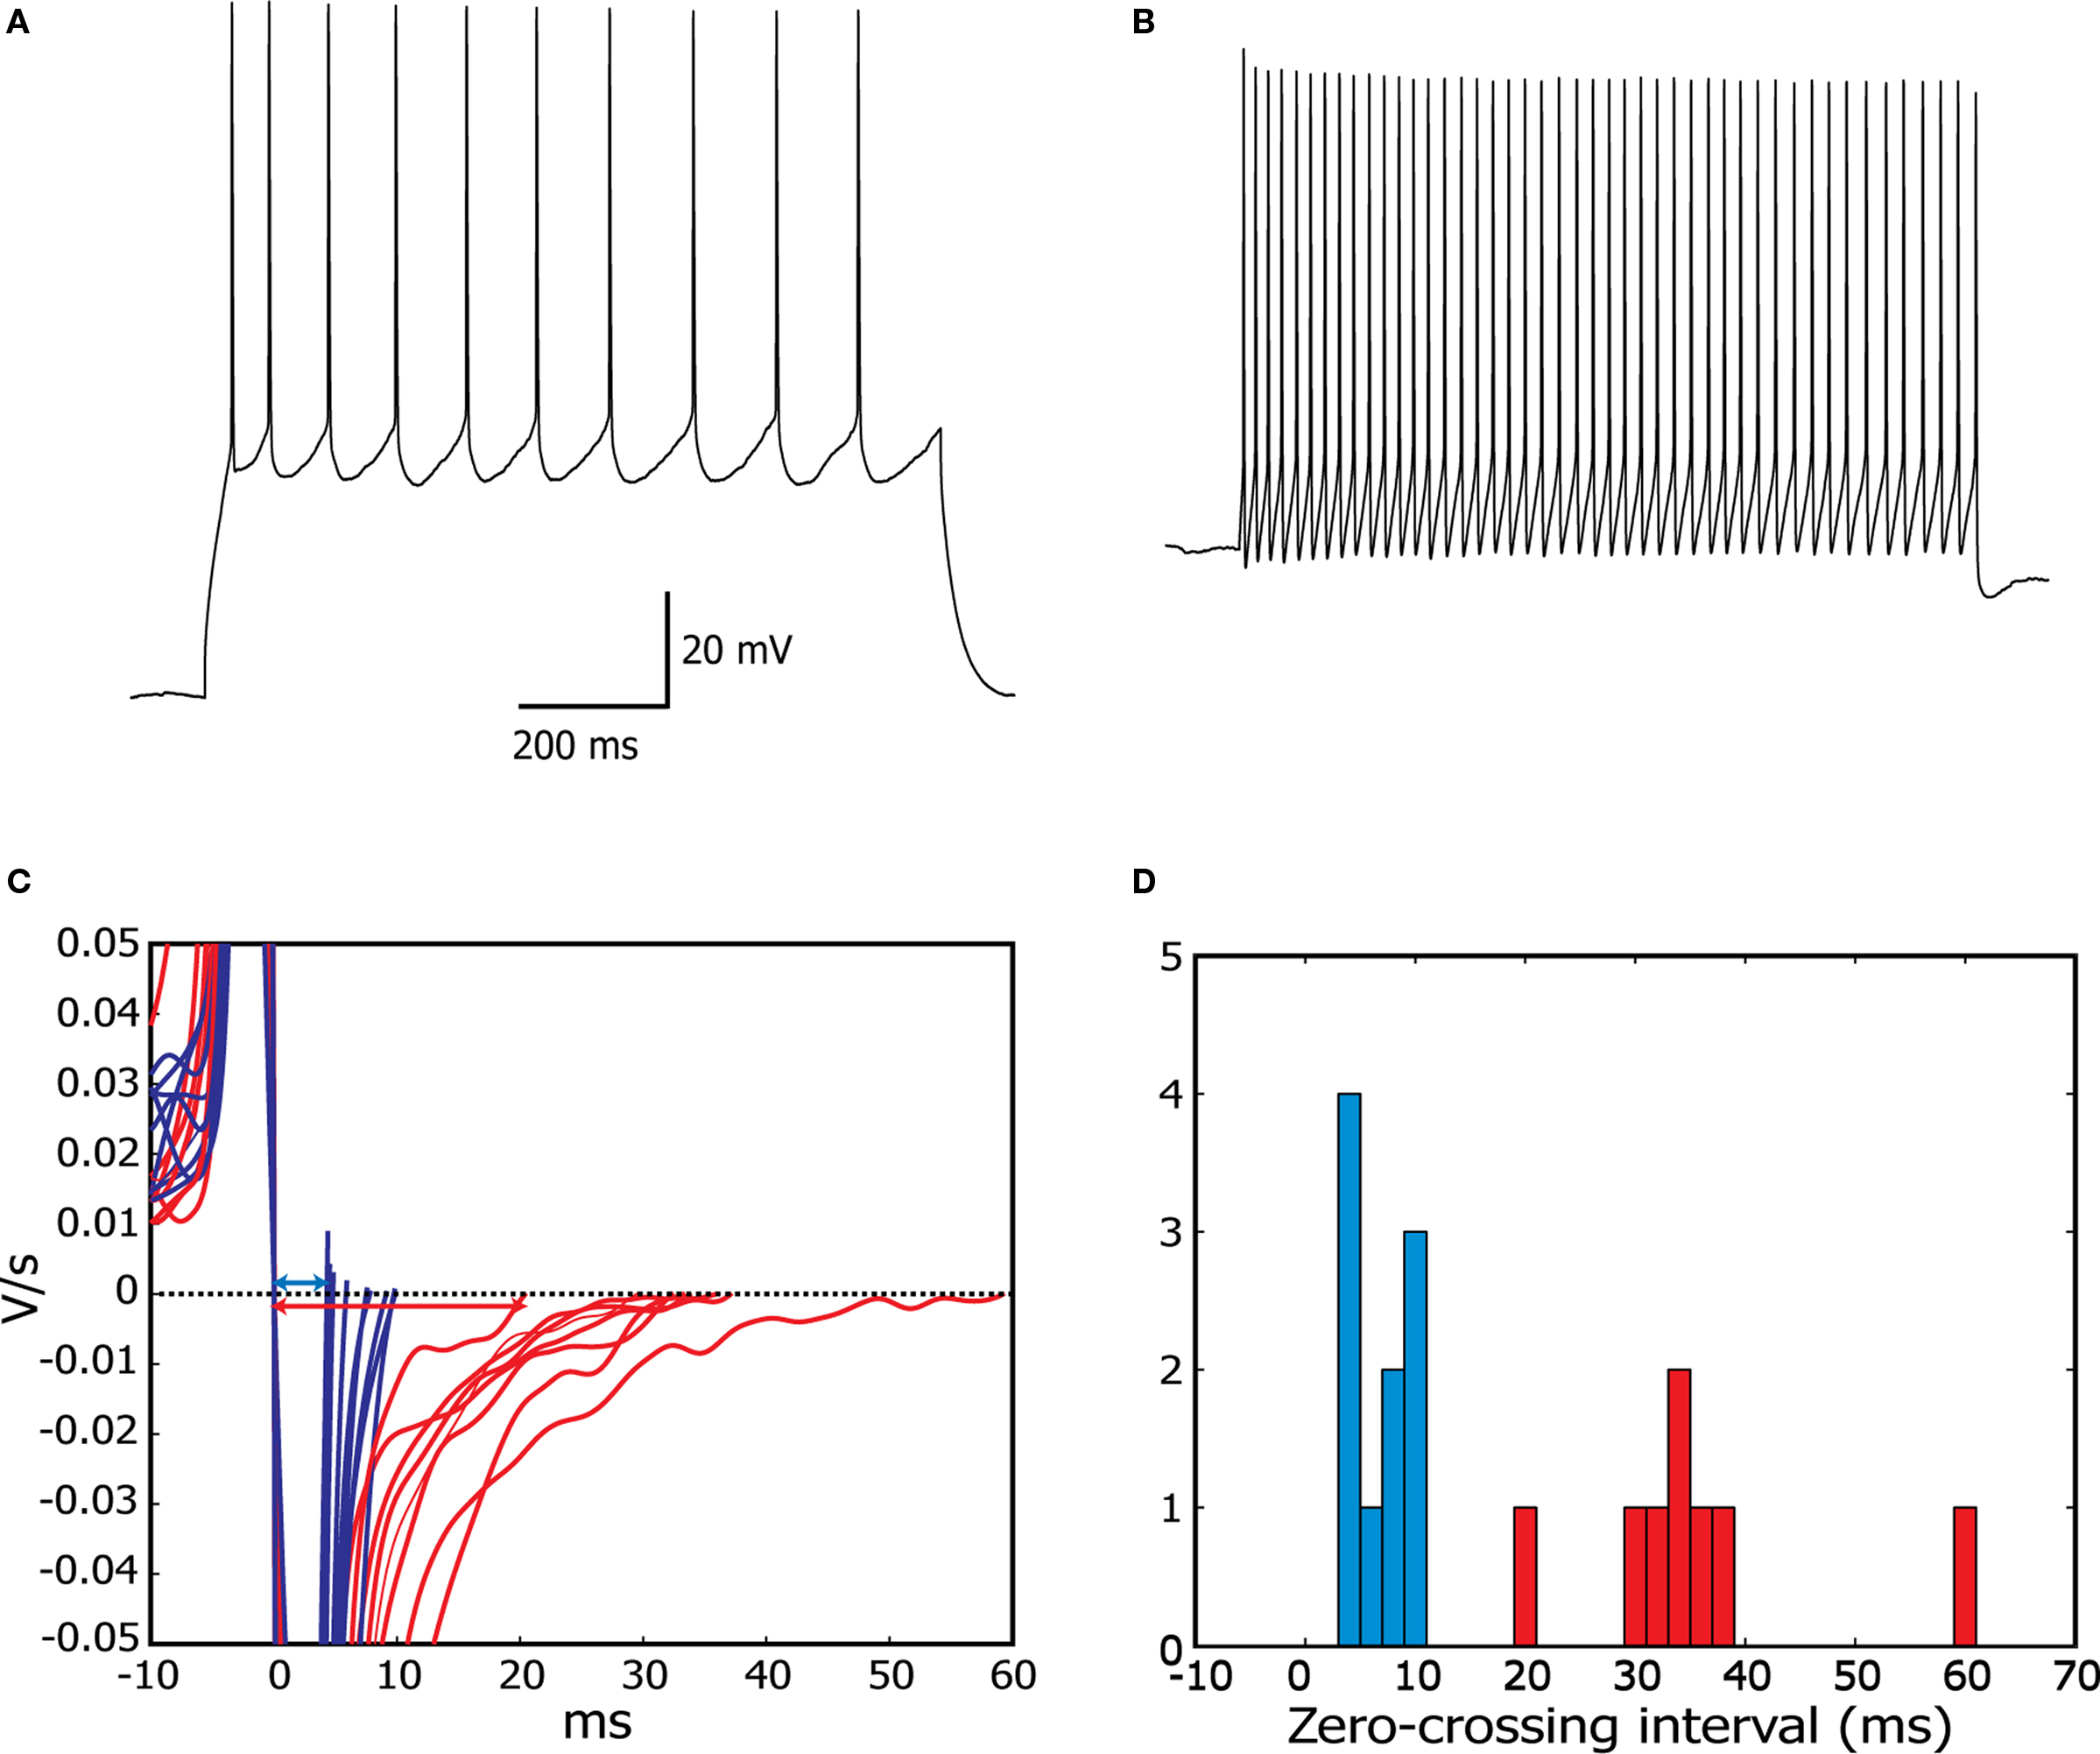
Figure 2. Assignment of neurons to fast-spiking or regular-spiking electrophysiological phenotypes in cortical slices. (A,B) Regular-spiking (A) and fast-spiking cells (B), responding to step current stimulation. (C) Smoothed derivative of the action potential signals for all cells, centered on the first downward zero-crossing, corresponding to the peak of the AP. This clearly separates the two characteristic spike shapes (FS, blue; RS, red). (D) Histogram of the interval between first and second (corresponding to interspike minimum) zero-crossings of the smoothed derivative, for all cells analysed. Fast-spiking cells are defined as having an interval of less than 10 ms, regular-spiking cells have intervals of over 20 ms (see Materials and Methods for details).
In addition to qualitatively matching the well-known RS and FS firing patterns, we distinguished the two cell types on a quantitative basis, using the smoothed first-derivative of action potentials elicited just above threshold (see Materials and Methods for details). The interval between zero-crossings of this derivative, corresponding to the interval between the peak of the action potential and the deepest point of the after-hyperpolarization was tightly clustered (Figures 2
C,D), below 10 ms for FS cells (blue), while it ranged from 20 to 60 ms for RS cells (red).
Neurons studied here demonstrated some diversity in firing patterns, however all could be clearly defined as FS or RS spiking types (Figure 3
; see Table S1 in Supplementary Material for details). Particularly at young ages, depolarization block is pronounced and can obscure the typical adult firing pattern, but the spike shape and the pattern of spiking within a certain window of stimulus currents leading to periodic firing, enabled a quite robust classification of such cells.
After analysis and recording of the electrophysiological properties of each neuron, the cytoplasmic contents of each cell were harvested. Total RNA was purified from each cell, reverse transcribed to cDNA and globally amplified (see Materials and Methods for details). Typically, 32–34 cycles of PCR produced 15–20 μg of amplified cDNA. Prior to global expression profiling, we further investigated the expression of cell-specific transcripts in the single cells by quantitative PCR (qPCR) analysis, using the amplified cDNA as a template. Quantitative PCR for the pyramidal cell-specific transcription factor Emx1 and for the GABAergic neuron-specific enzyme glutamic acid decarboxylase-2 (GAD2/GAD65) was used to distinguish between the two cell types (Figure 3
). For example, cells 9 and 13 were defined as RS by firing properties (Table S1 in Supplementary Material) and expressed significant levels of Emx1 and little or no GAD65 mRNA (Figure 3
). Similarly, cell 12 was classed as FS by firing properties and qPCR found that this cell was GAD65-positive and Emx1-low.
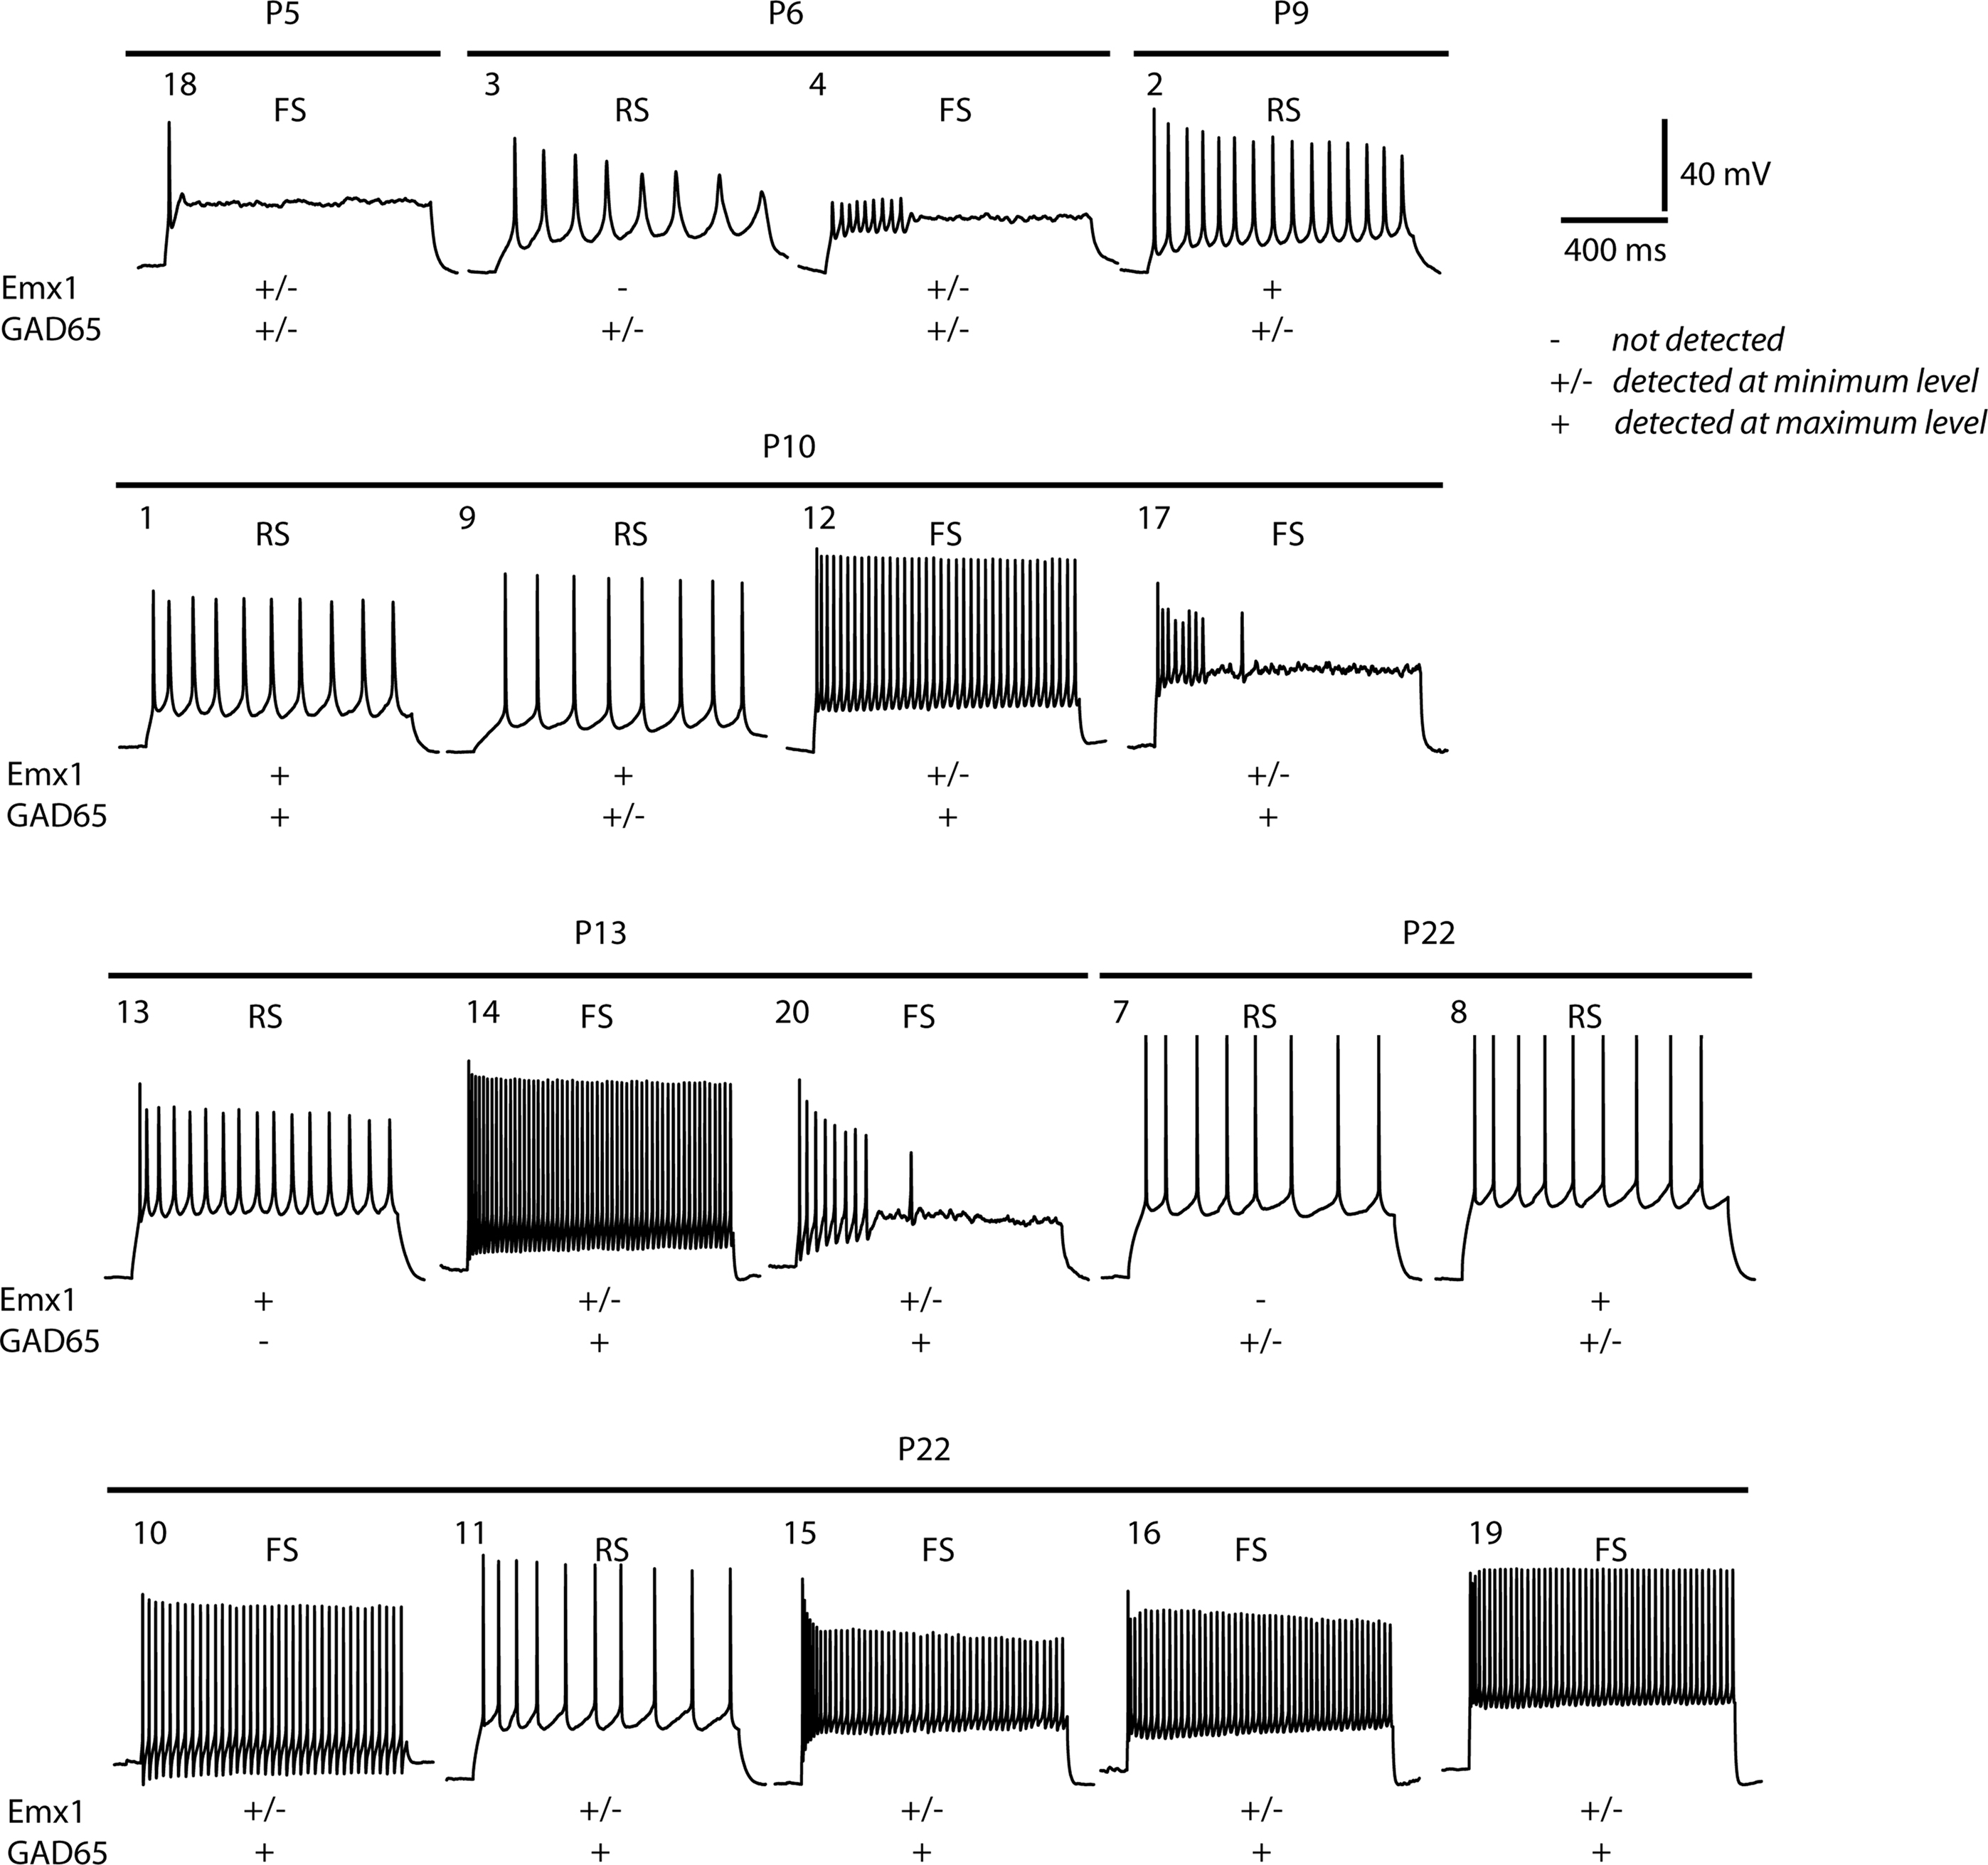
Figure 3. Typical firing patterns of the 18 layer II/III neurons analysed and their corresponding expression of pyramidal cell (Emx1) and interneuron (GAD65) markers. Expression levels: −, not detected; +/−, detected at low level; +, robustly detected. Cell numbers refer to the cell numbering system reported in Table S1 in Supplementary Material and used throughout the text.
However, there are notable exceptions in which expression of these markers was not detected in cells with clear electrophysiological phenotypes. For example, Emx1 was not detected in the RS cell 7. This absence of PCR-based detection of markers probably reflects drop-out or sampling of transcripts during the global cDNA amplification step, as we have observed previously in neural stem cells (Subkhankulova et al., 2008
). In contrast, the RS cell 1 was found to have both Emx1 and GAD65 mRNA by qPCR, but has pyramidal morphology. It is unlikely that this cell corresponds to a regular-spiking, non-pyramidal cell. As discussed below, cluster analysis based on gene expression indicates that this cell is a regular-spiking pyramidal neuron. Therefore, it may be that the presence of GAD65 mRNA represents contamination or a false-positive result due to the use of globally-amplified cDNA as the template for the subsequent qPCR.
Individual Expression Profiling Distinguished Two Groups of Young Cells Corresponding to FS and RS Neurons
The experimental design here was one in which gene expression in each cell was compared to a reference sample of cDNA pooled from the entire set of 18 young and immature cells studied in two dye-swap hybridisations. Statistical analysis found that the expression of the abundant transcript GAPDH, printed on the arrays more then 200 times, did not vary significantly among the cells (data not shown), confirming the overall quality of the combined procedures of RNA harvesting, amplification and microarray hybridisation.
To test the ability of global gene expression profiling to group and distinguish well-characterised types of neurons, we used the set of 10 young cells (P13–22) to examine if the classification of neurons by global expression analysis corresponded to the physiological classification of RS and FS cells. Cells were assigned to groups by unsupervised clustering according to the degree of similarity between pairs of cells (as calculated by Pearson correlation coefficients; Figure 4
). The cells formed two distinct groups of four and six cells each, as defined by gene expression (Figure 4
). Those two groups corresponded to the two electrophysiologically-defined groups, with the three RS cells forming one branch of the overall dendrogram, with one misplaced FS neuron, and a set of five FS cells plus one RS cell forming the other. Within the FS sub-tree there was a high degree of diversity of expression, although there were some cells that were highly similar in gene expression (cells 14, 15 and 19, Figure 4
).
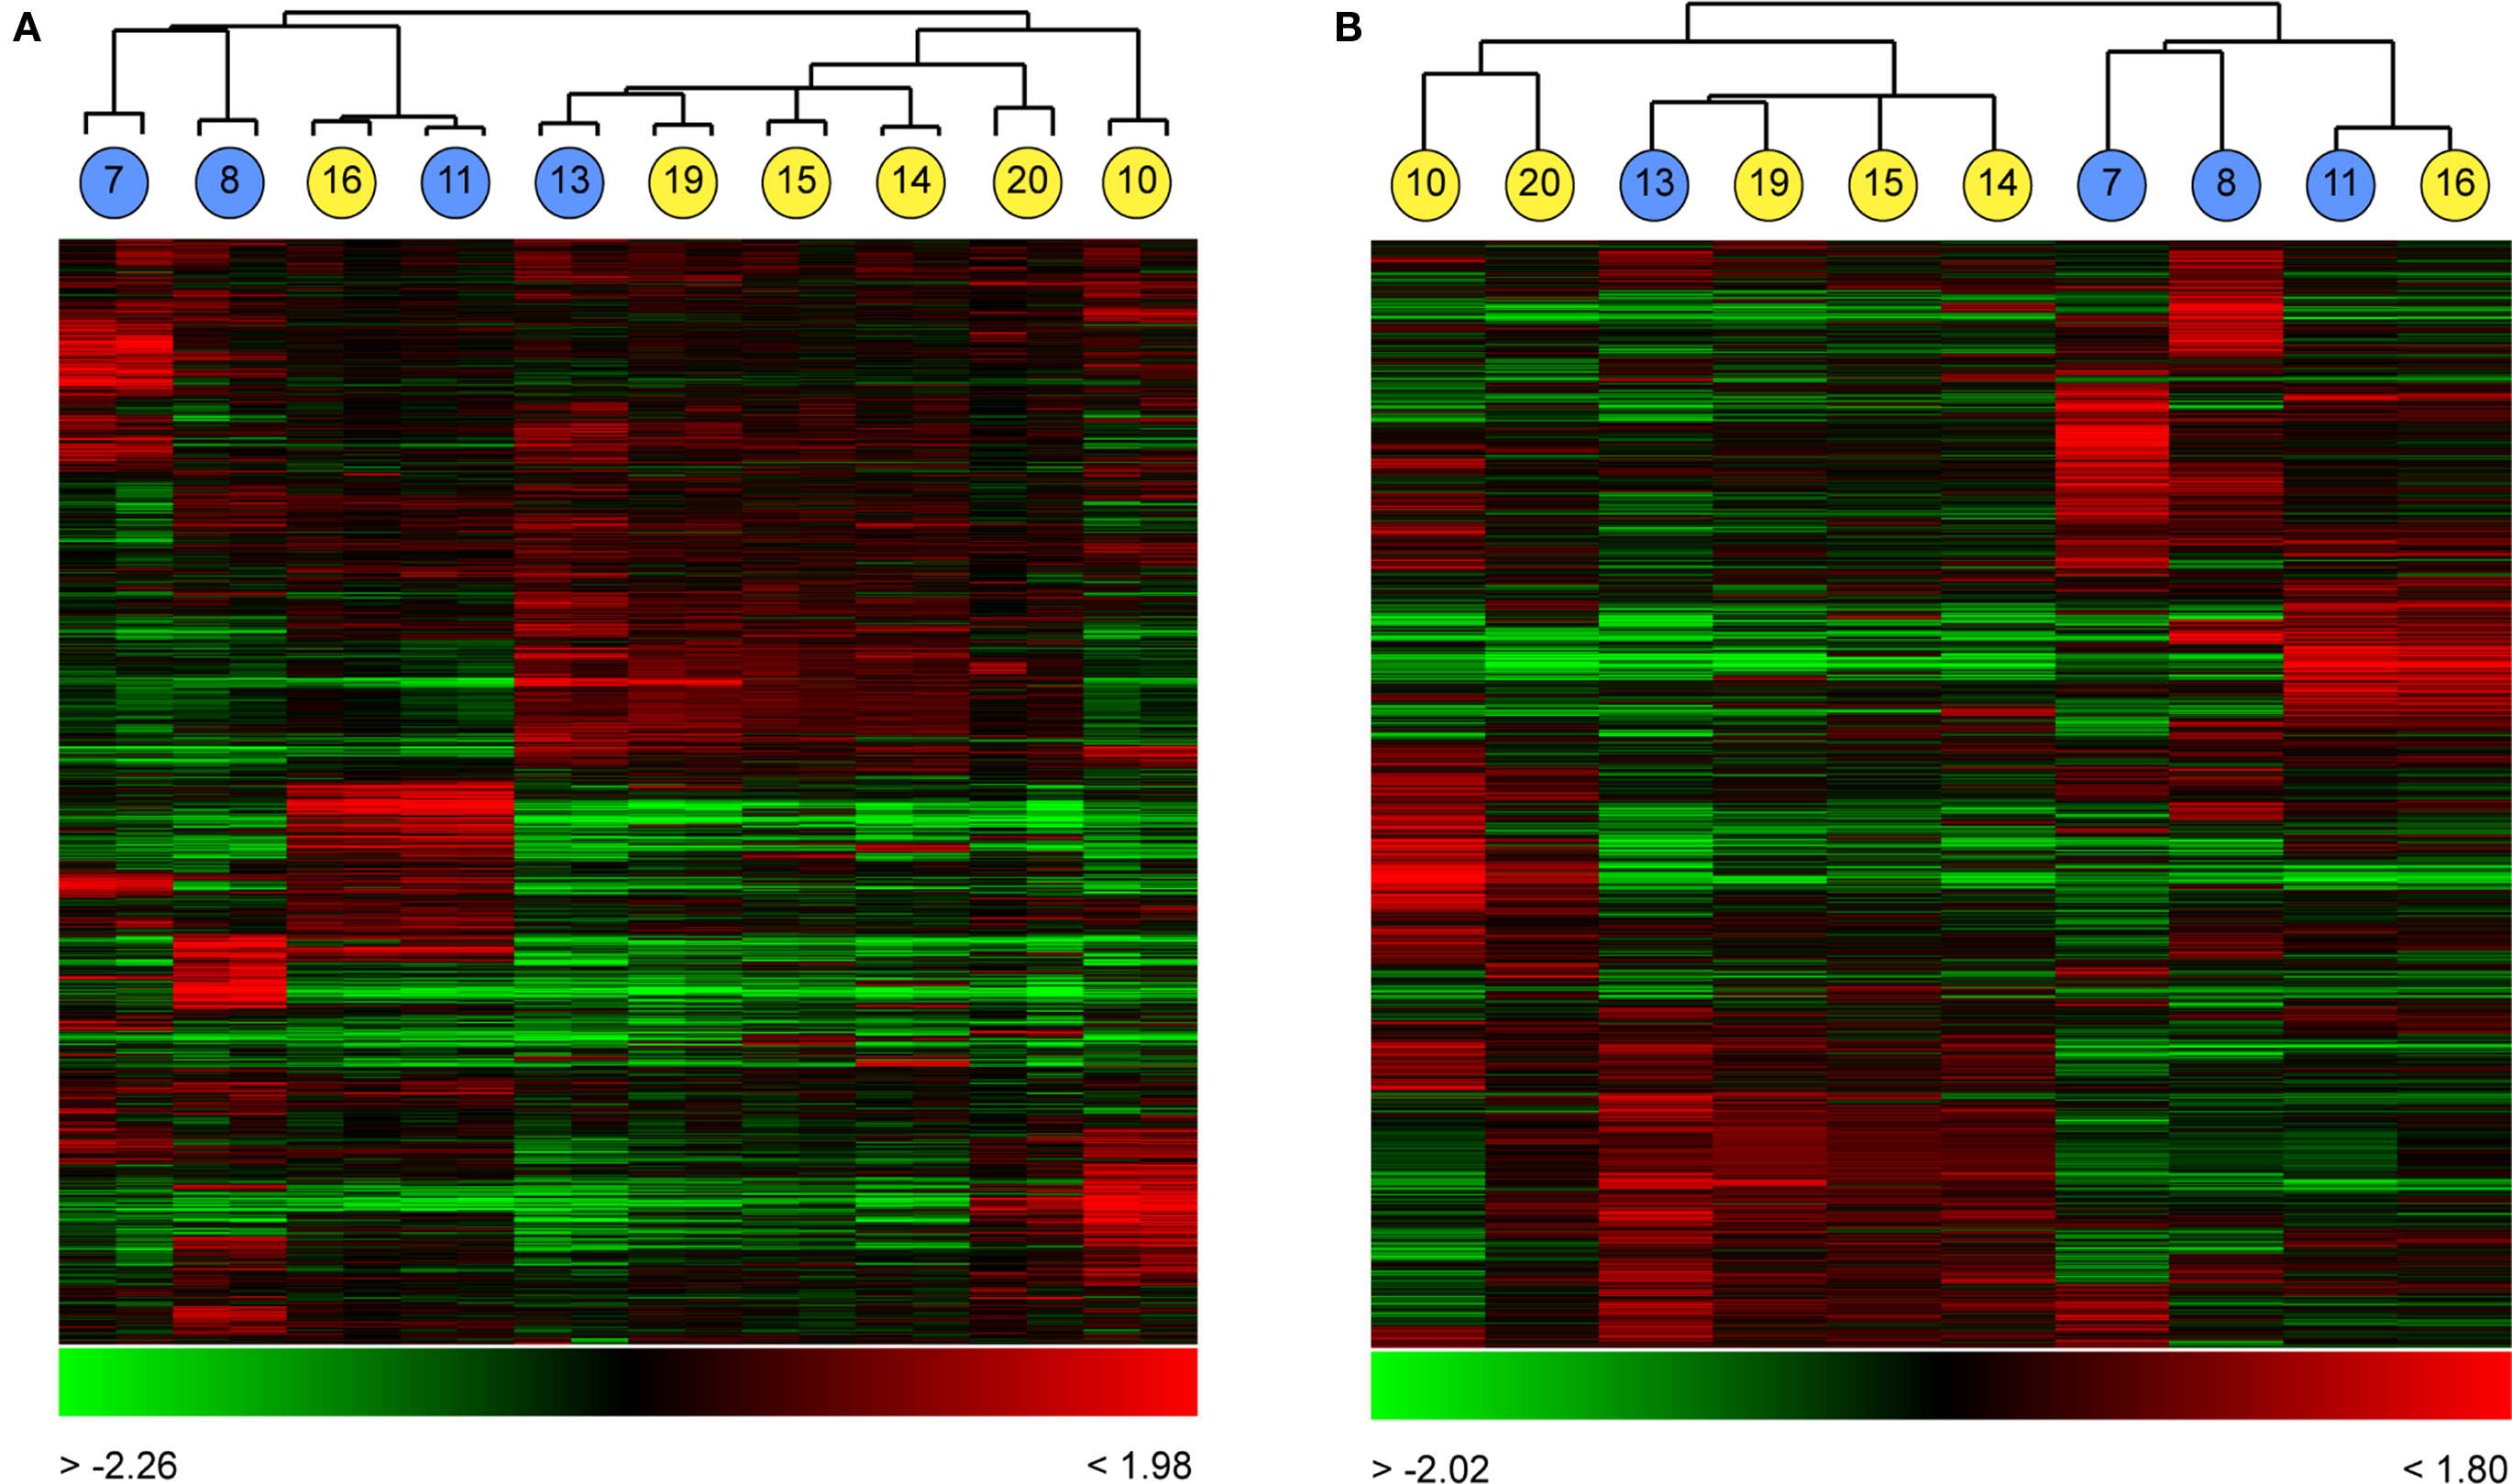
Figure 4. Grouping single cortical neurons by their global expression profiles. Ten neurons from layer II/III of somato-sensory cortex of young mice (P13�P22) were recorded from and expression profiled as described (Figure 1 and Materials and Methods). Cells were clustered based on Pearson correlation coefficients as a measure of similarity in gene expression. Clustering of these cells without averaging gene expression between the dye-swapped technical array replicates (A) resulted in the formation of two distinct clusters containing primarily fast-spiking neurons (yellow circles) or regular spiking neurons (blue circles), in each case with one RS and one FS neuron misassigned to each cell-type cluster. Numbers within circles correspond to the cell identifiers used in Figure 3
. Averaging gene expression between replicate arrays (B) did not change the cluster composition. In each cluster, each column represents expression data from a single array (A) or cell (B), each row expression ratio for a single gene. By convention, red colours indicate positive expression (enrichment) and green lower expression. The range of expression values is indicated by the colour bar beneath each cluster.
Single-Cell Expression Profiling Prospectively Classified RS and FS Neurons at Differing Developmental Stages
To study whether gene expression could group and classify a more complex population of neurons, we proceeded to use unsupervised cluster analysis to analyse the entire group of 18 layer II/III neurons ranging in age from P5 to P22. Based on firing properties, all neurons in this set could be designated as either RS or FS, but with some variation in their developmental stage, as reflected in their electrical properties (Figure 3
; Table S1 in Supplementary Material).
Cluster analysis by gene expression of all 18 neurons, independent of their firing properties, identified three major clusters (Figure 5
). The first group contained four regular-spiking neurons of a range of developmental stages (Figure 5
). The second cluster of 6 cells contained four FS neurons, of which three were immature, together with two cells, 2 (P9) and 11 (P22), whose firing properties were those of typical RS cells. The third cluster contains 6 fast-spiking neurons and two regular-spiking neurons (one young and one immature). Thus unbiased clustering based on global gene expression grouped this complex population of single cortical neurons in a manner that broadly reflects their firing properties, with a subset of neurons whose cluster assignment did not accurately reflect their firing properties.
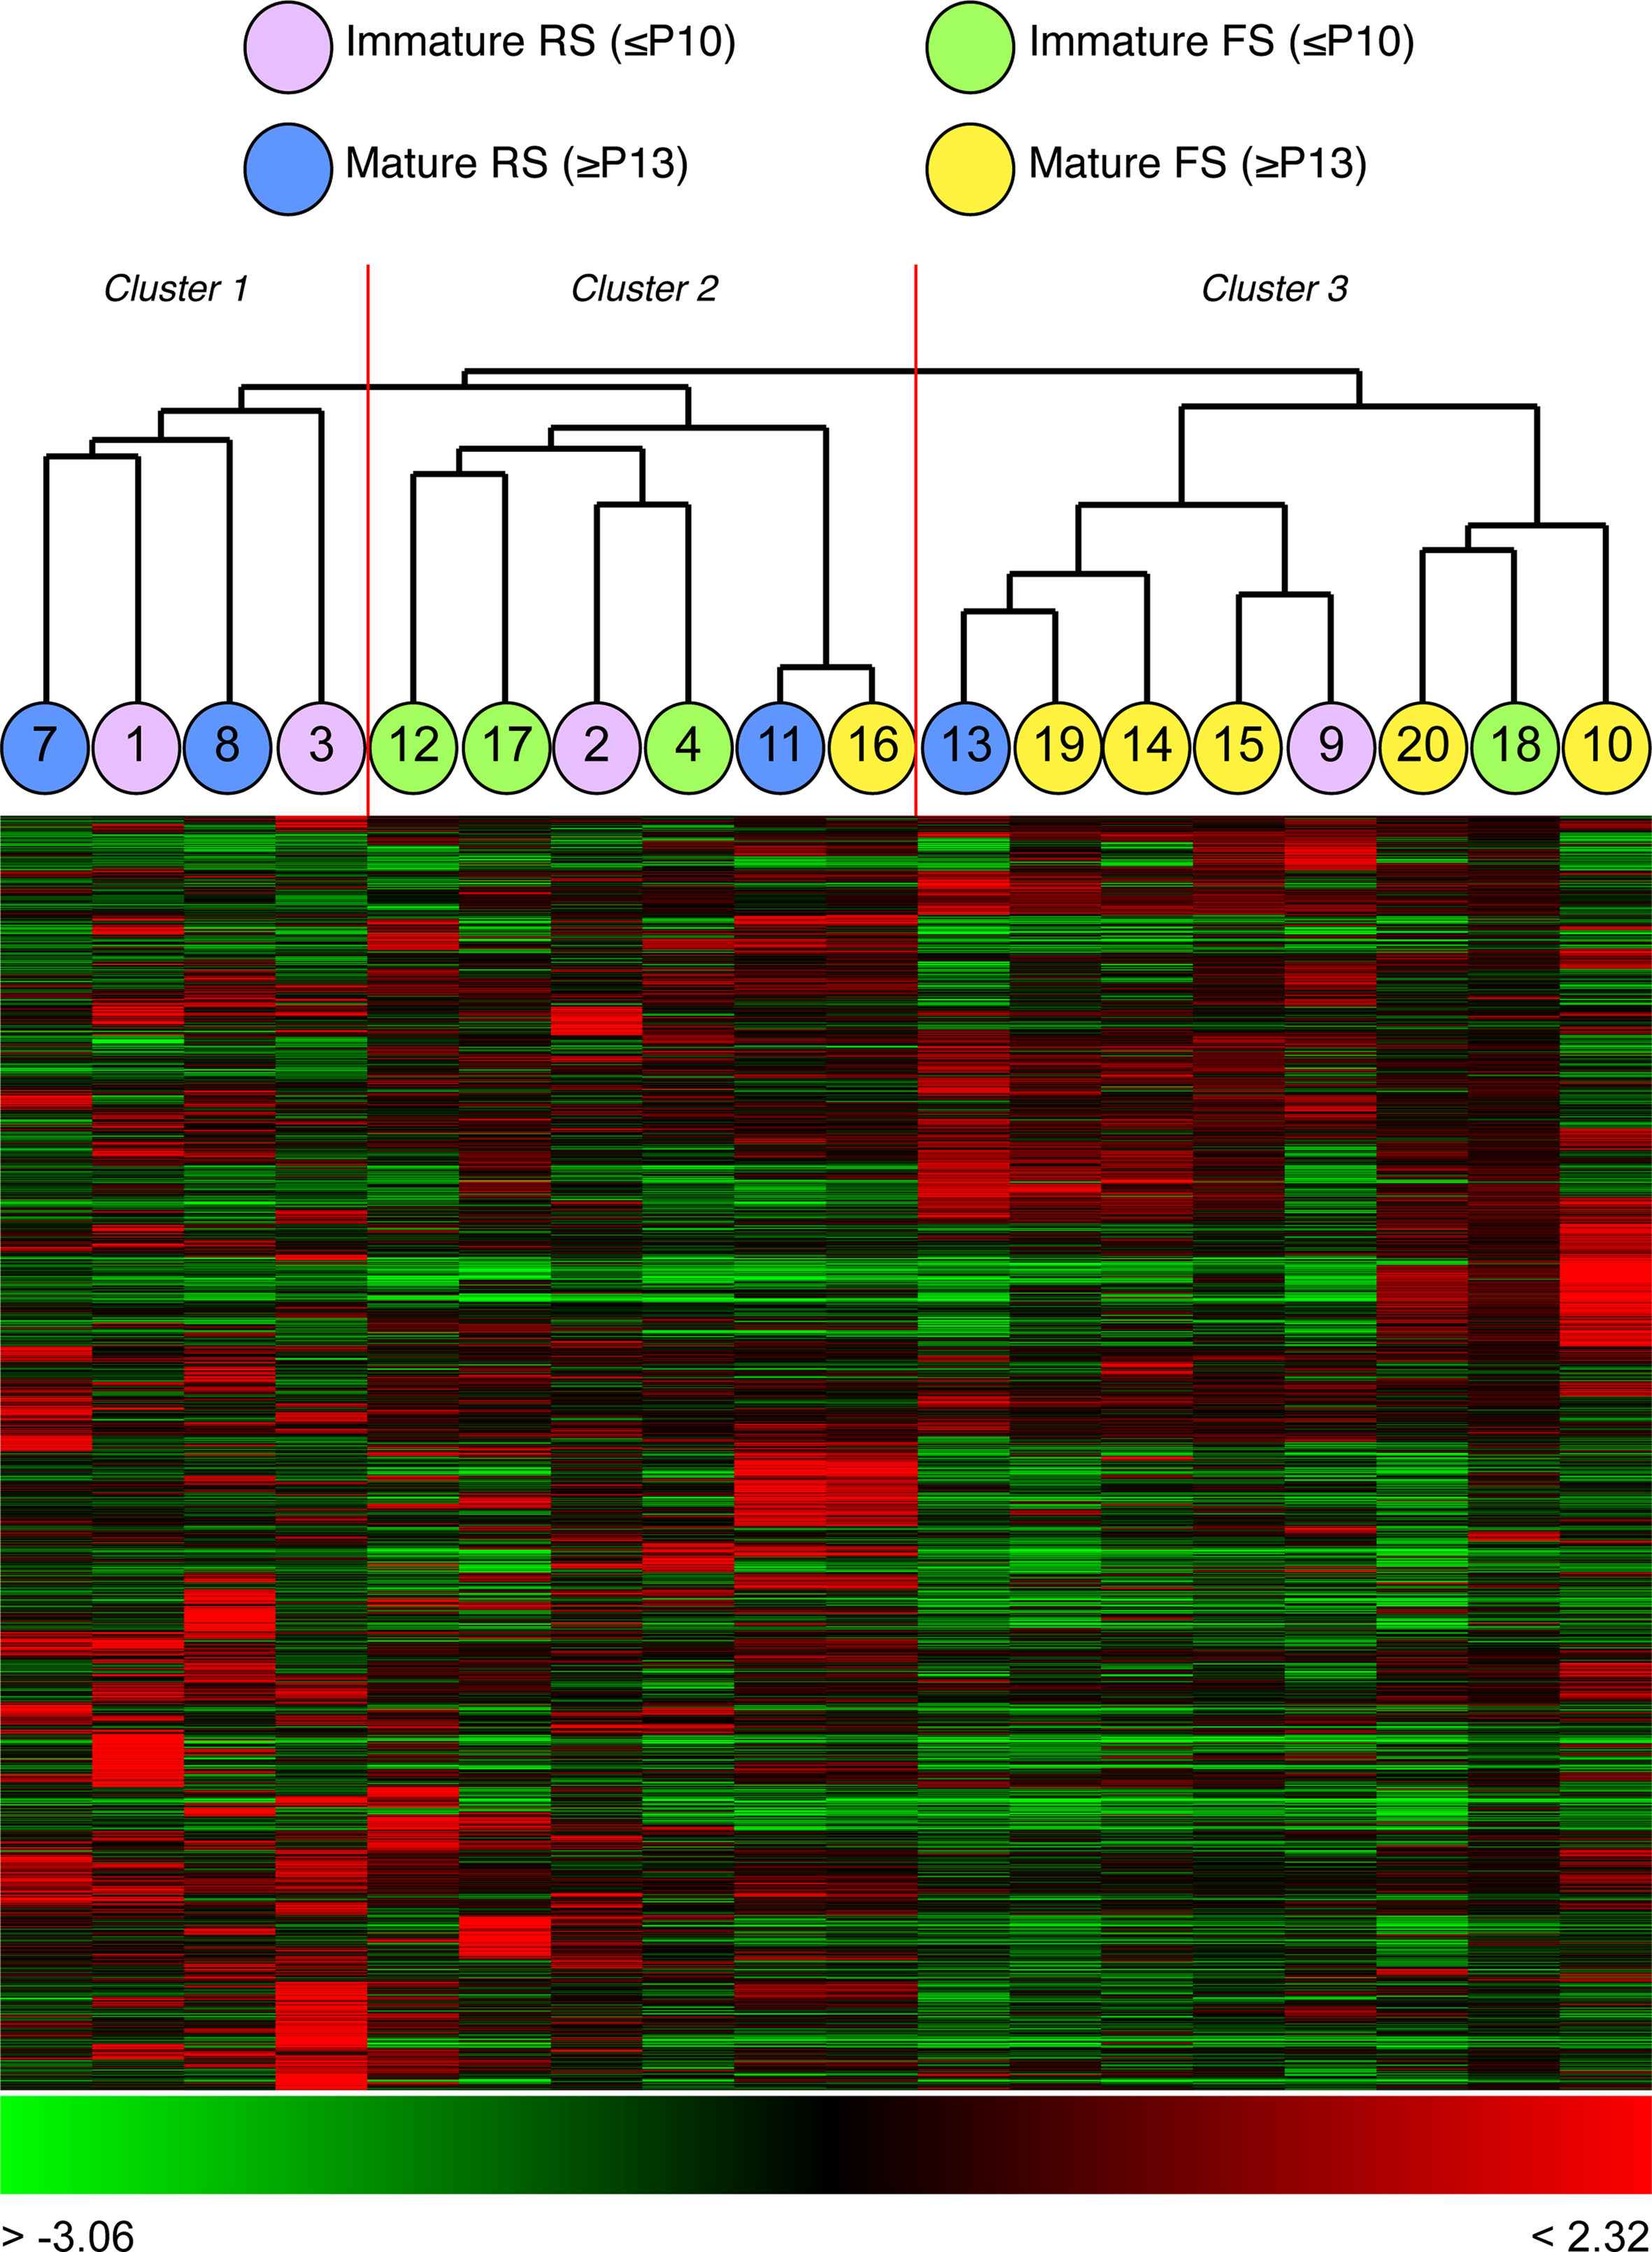
Figure 5. Clustering of all 18 neurons from four postnatal ages, based solely on global gene expression. Three major clusters can be observed: cluster one contains 4 RS neurons of different developmental stages; cluster two contains 6 neurons, 4 of which are FS and 2 are RS; cluster three contains 8 neurons, 6 of which are FS and 2 RS. Cell numbers correspond with those shown in Figure 3
. Each column represents expression data from a single or cell, each row expression ratio for a single gene. By convention, red colours indicate positive expression (enrichment) and green lower expression. The range of expression values is indicated by the colour bar beneath each cluster.
Identification of Transcripts Enriched in Regular-Spiking Neurons Compared with Fast-Spiking Cells
We used the firing properties and qPCR data to group the ten young (>P13) neurons into RS- and FS-type cells for the purpose of identifying genes differentially expressed between the two groups. Genes showing the most reproducible differences in expression between the two groups were selected using Student’s t-test (see Materials and Methods for details), and the gene expression values for each gene averaged within each group. Those genes were then clustered for visualization (Figure 6
A). At the statistical cutoff applied (p < 0.05), 482 mRNA transcripts with differential expression between the two groups were identified, 279 of which were enriched in RS cells and 203 enriched in FS cells (Table S2 in Supplementary Material). The sets of genes enriched in each group were functionally heterogeneous, including transcription factors, intracellular enzyme and plasma membrane proteins (Table S2 in Supplementary Material).
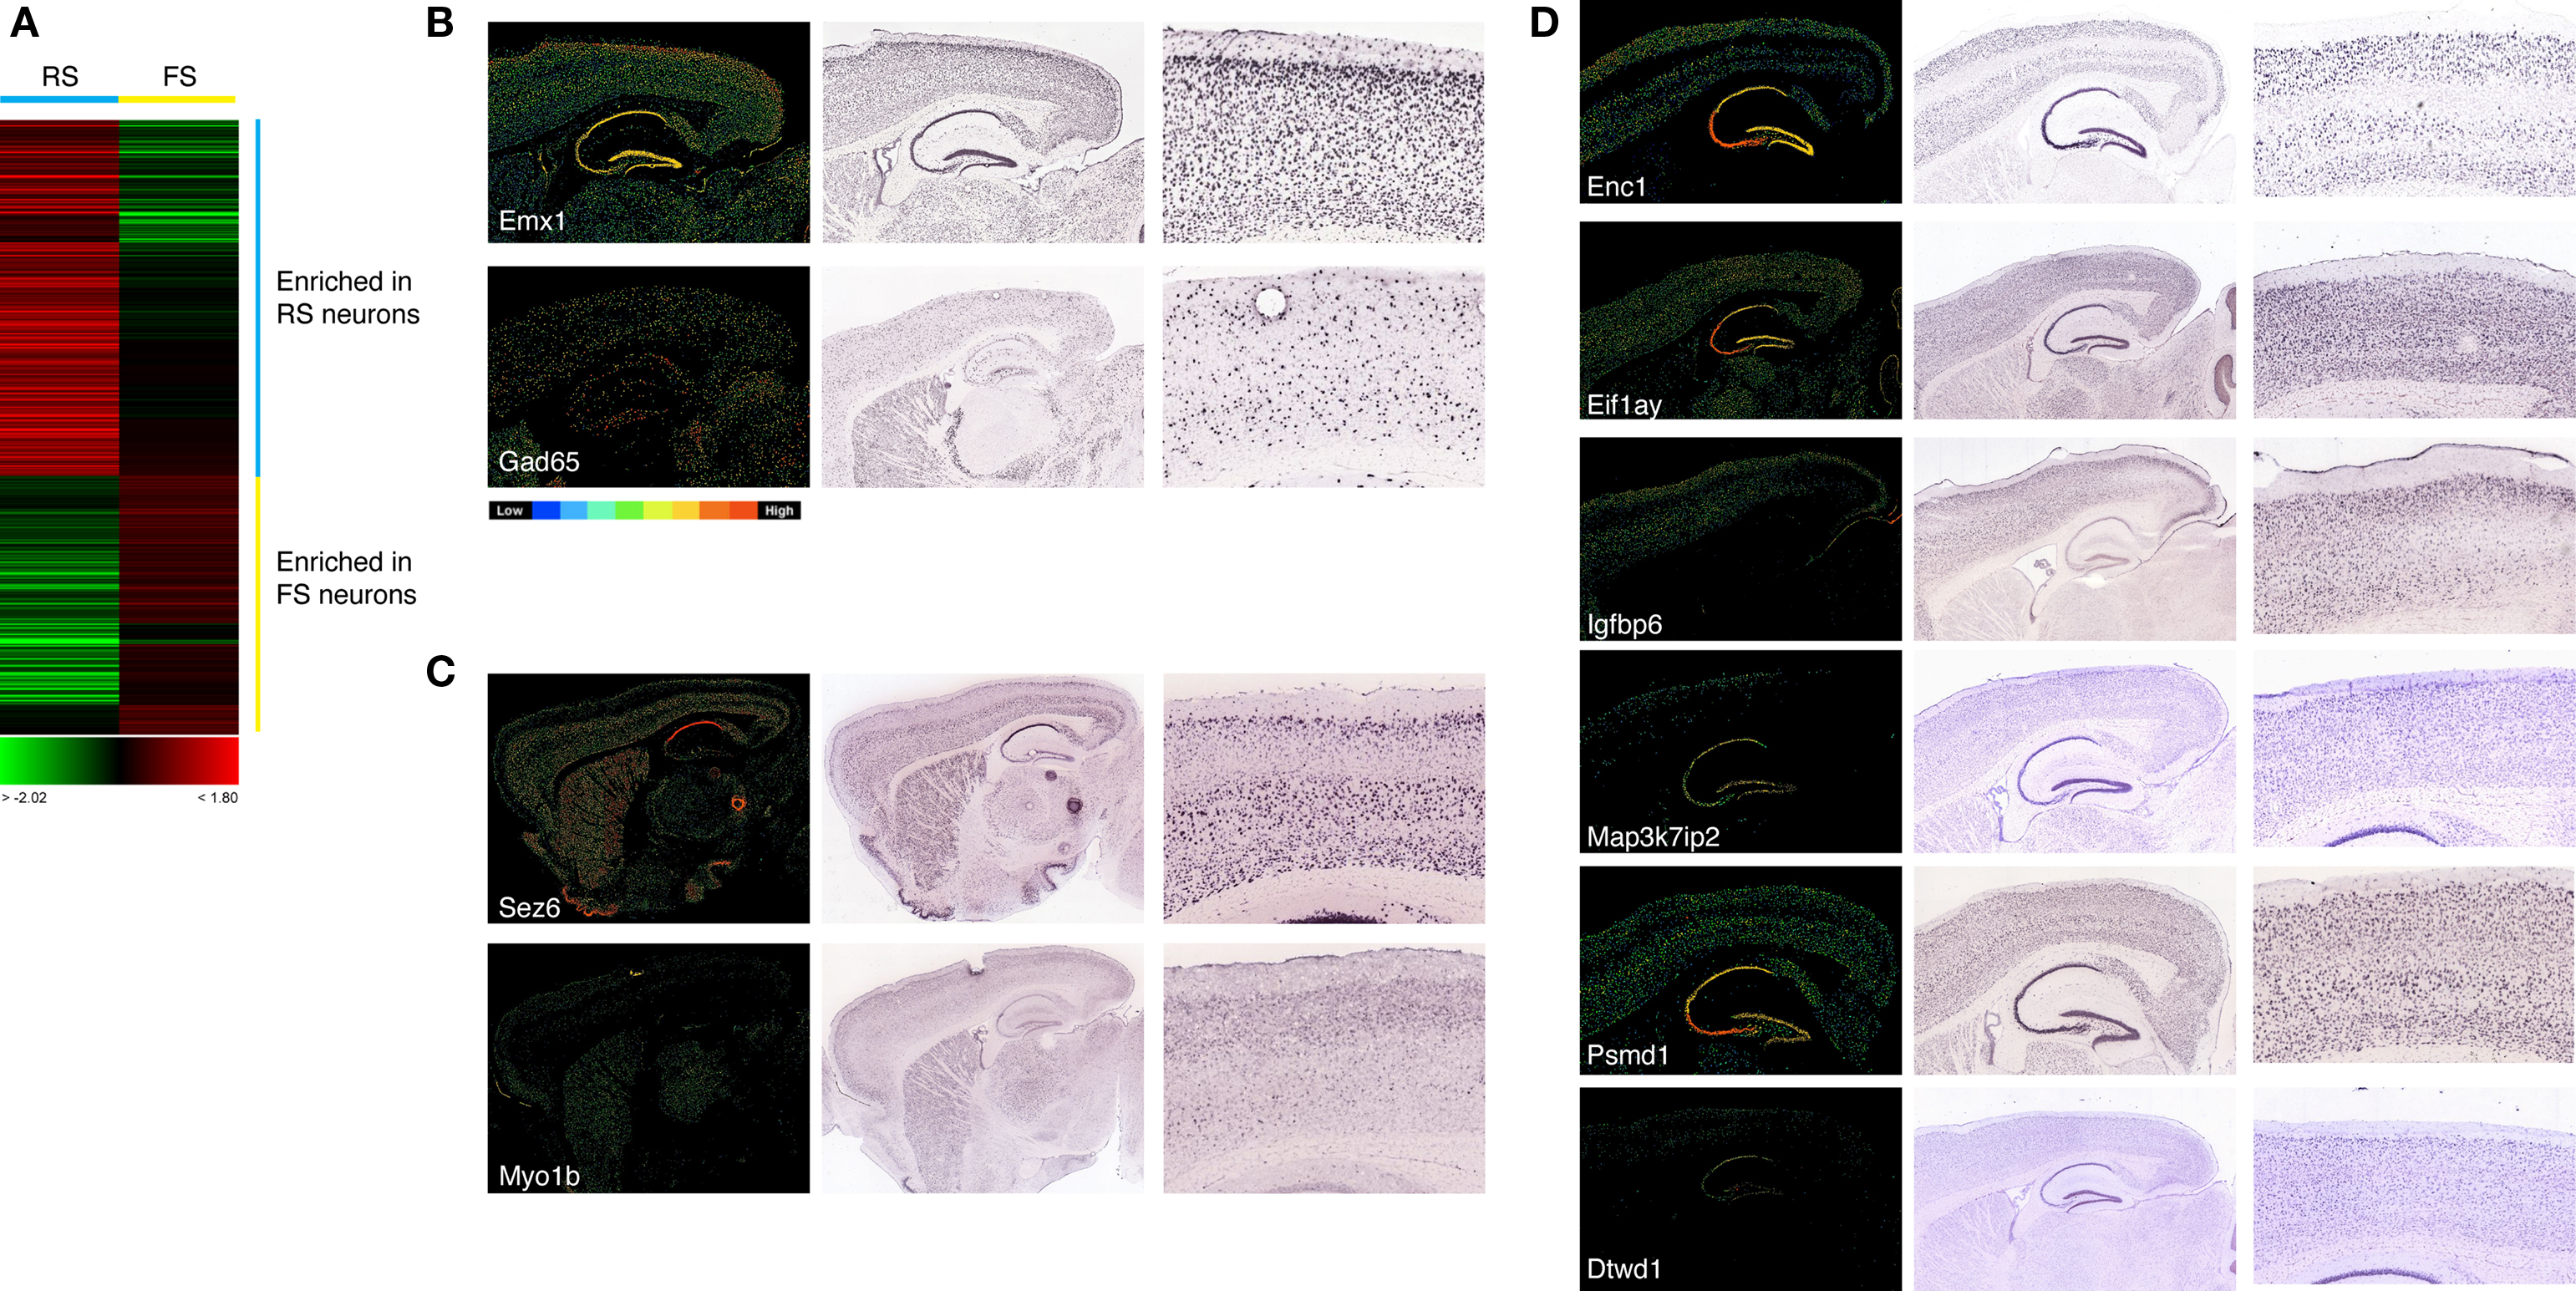
Figure 6. (A) Clustering of transcripts identified by t-test as enriched in either RS or FS cells. Expression is represented by a scale from green (enriched in FS cells) through red (enriched in RS cells). Each row represents expression for a single gene. (B) In situ hybridization patterns for the pyramidal neuron-specific transcript Emx1 and the GABAergic interneuron-specific transcript Gad65. Low power images are shown of mRNA in situ hybridizations of a set of differentially expressed genes on parasagittal sections of the adult mouse brain, from the Allen Brain Atlas (mouse.brain-map.org), along with a high power image of the expression in the somatosensory cortex. In all images the olfactory bulbs are to the left and the cerebellum to the right. For each non-radioactive ISH image, the corresponding Allen Brain Atlas expression analysis image is shown to clarify the relative expression of each gene according to scale of blue (low) to red (high) expression, as illustrated in the attached diagram. (C,D) Confirmation of cell-specific or enriched expression of genes identified by single cell expression profiling as enriched in FS cells (C) or RS cells (D). Genes are as indicated by the gene symbols in each panel. For the RS cell-enriched genes (D), expression can be observed both in some or all cortical layers and also in hippocampal pyramidal cells. FS-enriched genes (C) are expressed in interneurons in the striatum, as well as in the hippocampus and cortex.
To explore whether the enriched expression of genes identified by the array analysis as such in RS or FS cells, we made use of the public, large-scale in situ hybridization dataset for the adult mouse brain, the Allen Brain Atlas (Lein et al., 2007
). Many of the genes showing statistically significant differences in expression between the two groups of cells, but of low magnitude, were found to be pan-neuronally expressed (data not shown). However, for those genes that were significantly enriched in RS cells, that is pyramidal cells of the neocortex, we found many examples of genes that were either cortex-specific or highly enriched in expression in cortical and, in many cases, hippocampal pyramidal cells, when the expression patterns were compared with that of Emx1 (Figure 6
). Several of those genes are not just enriched in cortex, but also demonstrate specific expression in layers 2–4 of the cortex (see Figure 6
B for examples), demonstrating the ability of the single cell profiling approach to identify cell type-specific genes.
In this paper we have addressed the question of whether single neuron gene expression profiling can prospectively resolve neuronal subtypes into groups, independent of any phenotypic information, and whether those groups reflect meaningful biological properties of those neurons. To do so, we applied methods we have developed to compare gene expression among single neural stem cells to study global gene expression in 18 randomly picked neurons from layer II/III of mouse neocortex. The morphology, firing characteristics and electrical properties of the neurons enabled the classification of each cell as either fast- or regular-spiking, corresponding to inhibitory interneurons or excitatory pyramidal cells (Connors and Gutnick, 1990
). Unsupervised clustering of neurons by global gene expression resolved the cells into three groups and those corresponded broadly with the groups of fast- and regular-spiking neurons. Genes specifically enriched in RS neurons were identified from the expression dataset and confirmed as such in the public mouse brain in situ hybridisation databases. These results provide an initial proof of principle that single-cell gene expression profiling has the potential to be used to group and classify neurons in a manner reflecting their known biological properties and can be used to identify novel, cell type-specific transcripts.
Global Expression Profiling can Group Single Neurons into Classes that Reflect Meaningful Biological Properties
Previous expression profiling studies at the resolution of defined neuronal cell types have either focused on a small number of functionally important transcripts, such as ion channels or neurotransmitter systems (Cauli et al., 1997
, 2000
; van Hooft et al., 2000
), in single neurons or studied groups of neurons defined by a shared property: synaptic target (Arlotta et al., 2005
) or common expression of a transgene (Sugino et al., 2006
). While very powerful, those studies did not address the question of the ability of global expression profiling at the single cell level to prospectively group and classify neuronal cell types. In addition, the use of a single property to define group identity, by its very nature, will give an averaged expression profile of that population with no indication of underlying cellular heterogeneity. Given the difficulties encountered in classifying cortical interneurons using combinations of morphology, electrical properties and marker protein or gene expression (Ascoli et al., 2008
), we wished to investigate whether an unbiased, global assay of gene expression could identify groups of neurons independent of any other cellular property.
We generated global expression data from a relatively small sample of 18 morphologically and electrophysiologically characterized neurons and used those data to group the neurons by hierarchical cluster analysis. It is noteworthy that the data were not filtered to first derive a subset of transcripts that displayed variation in expression among the cells that would then be used to group the cells. In this case, the clustering based on gene expression was carried out independent of any phenotypic information. We found that this approach can group and classify cells that would be considered quite different in their cellular properties, including neurotransmitter type, morphology and developmental origins. However, we did find errors in assigning cells to clusters within this small and complex population of neurons. Secondly, we found that this approach also enabled the identification of novel cell type-enriched transcripts. It is not clear currently if single cell profiling is capable of distinguishing related, but distinct, classes of neurons, such as pyramidal cells from different cortical layers.
However, there are inherent limitations to this approach at present. Single cell expression profiling presents specific technical and biological challenges. Technically, current expression profiling technologies require amplification of the population of single cell mRNA, a process that can and does introduce noise, resulting in an altered transcript distribution. Importantly, this can lead to low abundance transcripts being called as absent in a random manner, due to inefficiencies in the early steps of reverse transcription and amplification (Subkhankulova et al., 2008
). In the data reported here, for example, we did not identify some genes that are known to be pyramidal or interneuron-specific, such as Emx1 or GAD65 (Katarova et al., 2000
; Chan et al., 2001
). From our previous work in neural stem cells, it is likely that this is due to a combination of technical issues, including inefficiencies in the global amplification method, the sensitivity of the array technique and the use of the pooled cells as a common reference. This last aspect of the experimental design is useful as it ensures that all genes expressed in the population are represented in the reference sample. However, the drawback of this approach is that, depending on the abundance of cell-specific transcripts in the pooled reference, some cell-enriched transcripts may not appear enriched when compared directly to the reference, rather they will appear depleted in the cells that do not express those genes.
A second potentially confounding biological problem is the noise inherent in gene expression in any cell and the consequent variation in absolute transcript numbers among phenotypically identical cells. We have previously found that there are significant differences in transcript abundance between phenotypically identical neural stem cells and that technical noise did not account for those differences (Subkhankulova et al., 2008
). Therefore, it is likely that it is necessary to sample the population deeply to ensure sufficient representation of each cell type and thereby compensate for the intrinsic variability of single cell transcript levels. Alternatively, reducing expression levels from continuous measurements to discrete bins or, in the extreme, to simple binary presence or absence calls, would potentially simplify the classification of cells based on expression of thousands of transcripts.
Can Global Expression Profiles be used to Predict Biological Properties of Neurons?
One long-term goal of single cell profiling is to use the combinatorial expression data to predict the biological properties of the neuron, essentially by constructing cellular models from single cell transcriptome data. Previous studies, based on single cell PCR data of expression of sets of ion channels, indicated that it is possible to correlate electrical properties with the expression of particular combinations of channels (Toledo-Rodriguez et al., 2004
). However, scaling this approach from tens to thousands of transcripts presents a considerable challenge, particularly if the relative levels of those transcripts, and not simply presence or absence of a given transcript, are included in the cellular modeling. Analyses of gene expression in single neurons have found that the levels of mRNAs for specific genes can vary considerably among cells of the same type (Schulz et al., 2006
, 2007
; Tobin et al., 2009
). It is likely that models of neuronal phenotype and electrical properties will require data on the levels of the corresponding proteins and also the possible protein-protein interactions and their functional significance. Current technologies for protein analysis have not achieved single cell resolution, but large-scale proteomic analyses of neurons have begun to provide data that will be useful in this context (Emes et al., 2008
).
Towards a Catalogue of Cortical Cell Types
Previous global expression studies of cortical neurons have produced a taxonomy of forebrain cell types (Sugino et al., 2006
) and identified many novel cell-specific transcripts in pyramidal cells (Arlotta et al., 2005
). Those studies have demonstrated that there are many examples of transcripts that can be used singly or in combination as discriminators of cortical cell types. The data presented here indicate that the global expression profiling approach has the potential to be extended to the single cell level, independent of any cellular property of cortical neurons, to sample the population of neurons in a cortical region in order to assess cellular diversity at the genetic level, group those cells and, ultimately, classify them by gene expression. As such, this approach provides a bottom-up approach that complements the top-down approach of identifying cell-specific expression patterns based on some group-defining property of a set of neurons. Together, these complementary approaches may enable the generation of a catalogue of cortical cell types, based on gene expression, which can be one element of a holistic classification of cortical neurons.
The authors declare that the research was conducted in the absence of any commercial or financial relationships that could be construed as a potential conflict of interest.
Tatiana Subkhankulova and Kojiro Yano were supported by the EU FP6 STREP, Neuro-Functional Genomics.
The Supplementary Material for this article can be found online at http://www.frontiersin.org/molecularneuroscience/paper/10.3389/fnmol.2010.00010/
Ascoli, G. A., Alonso-Nanclares, L., Anderson, S. A., Barrionuevo, G., Benavides-Piccione, R., Burkhalter, A., Buzsaki, G., Cauli, B., Defelipe, J., Fairen, A., Feldmeyer, D., Fishell, G., Fregnac, Y., Freund, T. F., Gardner, D., Gardner, E. P., Goldberg, J. H., Helmstaedter, M., Hestrin, S., Karube, F., Kisvarday, Z. F., Lambolez, B., Lewis, D. A., Marin, O., Markram, H., Munoz, A., Packer, A., Petersen, C. C., Rockland, K. S., Rossier, J., Rudy, B., Somogyi, P., Staiger, J. F., Tamas, G., Thomson, A. M., Toledo-Rodriguez, M., Wang, Y., West, D. C., and Yuste, R. (2008). Petilla terminology: nomenclature of features of GABAergic interneurons of the cerebral cortex. Nat. Rev. Neurosci. 9, 557–568.
Lein, E. S., Hawrylycz, M. J., Ao, N., Ayres, M., Bensinger, A., Bernard, A., Boe, A. F., Boguski, M. S., Brockway, K. S., Byrnes, E. J., Chen, L., Chen, L., Chen, T. M., Chin, M. C., Chong, J., Crook, B. E., Czaplinska, A., Dang, C. N., Datta, S., Dee, N. R., Desaki, A. L., Desta, T., Diep, E., Dolbeare, T. A., Donelan, M. J., Dong, H. W., Dougherty, J. G., Duncan, B. J., Ebbert, A. J., Eichele, G., Estin, L. K., Faber, C., Facer, B. A., Fields, R., Fischer, S. R., Fliss, T. P., Frensley, C., Gates, S. N., Glattfelder, K. J., Halverson, K. R., Hart, M. R., Hohmann, J. G., Howell, M. P., Jeung, D. P., Johnson, R. A., Karr, P. T., Kawal, R., Kidney, J. M., Knapik, R. H., Kuan, C. L., Lake, J. H., Laramee, A. R., Larsen, K. D., Lau, C., Lemon, T. A., Liang, A. J., Liu, Y., Luong, L. T., Michaels, J., Morgan, J. J., Morgan, R. J., Mortrud, M. T., Mosqueda, N. F., Ng, L. L., Ng, R., Orta, G. J., Overly, C. C., Pak, T. H., Parry, S. E., Pathak, S. D., Pearson, O. C., Puchalski, R. B., Riley, Z. L., Rockett, H. R., Rowland, S. A., Royall, J. J., Ruiz, M. J., Sarno, N. R., Schaffnit, K., Shapovalova, N. V., Sivisay, T., Slaughterbeck, C. R., Smith, S. C., Smith, K. A., Smith, B. I., Sodt, A. J., Stewart, N. N., Stumpf, K. R., Sunkin, S. M., Sutram, M., Tam, A., Teemer, C. D., Thaller, C., Thompson, C. L., Varnam, L. R., Visel, A., Whitlock, R. M., Wohnoutka, P. E., Wolkey, C. K., Wong, V. Y., Wood, M., Yaylaoglu, M. B., Young, R. C., Youngstrom, B. L., Yuan, X. F., Zhang, B., Zwingman, T. A., and Jones, A. R. (2007). Genome-wide atlas of gene expression in the adult mouse brain. Nature 445, 168–176.