GABAergic synaptic transmission regulates calcium influx during spike-timing dependent plasticity
- Department of Cell and Systems Biology, University of Toronto, Toronto, ON, Canada
Coincident pre- and postsynaptic activity of hippocampal neurons alters the strength of gamma-aminobutyric acid (GABAA)-mediated inhibition through a Ca2+-dependent regulation of cation-chloride cotransporters. This long-term synaptic modulation is termed GABAergic spike-timing dependent plasticity (STDP). In the present study, we examined whether the properties of the GABAergic synapses themselves modulate the required postsynaptic Ca2+ influx during GABAergic STDP induction. To do this we first identified GABAergic synapses between cultured hippocampal neurons based on their relatively long decay time constants and their reversal potentials which lay close to the resting membrane potential. GABAergic STDP was then induced by coincidentally (±1 ms) firing the pre- and postsynaptic neurons at 5 Hz for 30 s, while postsynaptic Ca2+ was imaged with the Ca2+-sensitive fluorescent dye Fluo4-AM. In all cases, the induction of GABAergic STDP increased postsynaptic Ca2+ above resting levels. We further found that the magnitude of this increase correlated with the amplitude and polarity of the GABAergic postsynaptic current (GPSC); hyperpolarizing GPSCs reduced the Ca2+ influx in comparison to both depolarizing GPSCs, and postsynaptic neurons spiked alone. This relationship was influenced by both the driving force for Cl− and GABAA conductance (which had positive correlations with the Ca2+ influx). The spike-timing order during STDP induction did not influence the correlation between GPSC amplitude and Ca2+ influx, which is likely accounted for by the symmetrical GABAergic STDP window.
Introduction
GABAergic synaptic transmission can be either excitatory or inhibitory at different stages of nervous system development (Kaila, 1994 ; Blaesse et al., 2009 ), or during various pathological states (Kahle et al., 2008 ). The polarity of GABAergic transmission (hyperpolarizing versus depolarizing) depends on the intracellular concentration of Cl− ([Cl−]i); this is because the GABAA receptor is a Cl−-permeable ion channel (Kaila, 1994 ). The [Cl−]i is largely determined by the cation-chloride cotransporters expressed in the neuronal membrane: NKCC1 accumulates Cl− into the neuron (Yamada et al., 2004 ; Dzhala et al., 2005 ), while KCC2 transports it out (Rivera et al., 1999 ). When neuronal Cl− is relatively high due to the dominant expression of NKCC1 during early development, the reversal potential for GABA (EGABA ≈ ECl) is depolarized with respect to the resting membrane potential and so GABAergic transmission is depolarizing and sometimes excitatory. In contrast, when neuronal Cl− is low due to the expression of KCC2 in the mature nervous system, ECl is hyperpolarized with respect to the resting membrane potential making GABAergic transmission inhibitory.
Recent studies have demonstrated that NKCC1 and KCC2 transporter function is not only regulated by their developmental program, but can also be regulated by neuronal activity (Fiumelli and Woodin, 2007 ; Blaesse et al., 2009 ). Coincident pre- and postsynaptic activity at GABAergic synapses results in GABAergic STDP (Woodin et al., 2003 ; Fiumelli and Woodin, 2007 ; Balena and Woodin, 2008 ; Saraga et al., 2008 ; Xu et al., 2008 ; Ormond and Woodin, 2009 ). Early in development, coincident pre- and postsynaptic activity strengthens inhibition through a Ca2+-dependent regulation of NKCC1, which hyperpolarizes ECl (Balena and Woodin, 2008 ). The same pattern of neuronal activity also modifies GABAergic transmission in the mature nervous system through a Ca2+-dependent decrease in KCC2 activity, which depolarizes ECl (Woodin et al., 2003 ). The spike-timing window for mature GABAergic inhibition has been characterized as symmetrical. Both positive and negative spike-timing intervals (within 15 ms; ±15 ms) decrease the strength of inhibition due to ECl depolarization (as described above). Non-coincident activity (±50 ms) also reduces inhibition, but through a decrease in conductance (Woodin et al., 2003 ).
During GABAergic STDP the Ca2+ influx occurs via voltage-gated Ca2+ channels (VGCCs) (Woodin et al., 2003 ) opened by the back-propagating action potential. When glutamatergic transmission occurs simultaneously with GABAergic STDP induction in hippocampal slices, Ca2+ can also influx via NMDARs (Ormond and Woodin, 2009 ). Because the opening of VGCCs and NMDARs are voltage-dependent, we hypothesize that GABAergic transmission, which regulates the postsynaptic membrane potential, will regulate the opening of these Ca2+ channel proteins. In turn, this would regulate the Ca2+ influx during GABAergic STDP. It is important to understand how GABAergic synapses regulate Ca2+ influx, because the magnitude of this influx can determine the outcome of plasticity induction (Kano, 1994 ; Bi and Poo, 1998 ; Nishiyama et al., 2000 ; Dan and Poo, 2006 ).
We examined Ca2+ dynamics during STDP induction in hippocampal neurons which have formed either depolarizing or hyperpolarizing GABAergic synapses. Using perforated patch-clamp recordings (with gramicidin) and imaging postsynaptic Ca2+ (using Fluo4), we investigated how the polarity and strength of GABAergic transmission regulates Ca2+ influx. We further analyzed this relationship by examining several aspects of GABAergic transmission, including GABAA conductance, ECl, and Cl− driving force. We found that GABAA-mediated transmission regulates Ca2+ influx during the induction of STDP, with the strength of the synapse significantly altering the magnitude of the postsynaptic Ca2+ influx in a linear fashion.
Materials and Methods
Hippocampal Cultures
Low-density cultures of dissociated embryonic rat hippocampal neurons were prepared as previously described (Balena and Woodin, 2008 ). In brief, embryonic day 18 (E18) pregnant Sprague-Dawley rats were briefly exposed to carbon dioxide and cervically dislocated in accordance with guidelines from the University of Toronto Animal Care Committee and the Canadian Council on Animal Care. Hippocampi were then removed and treated with trypsin for 15 min at 37°C, followed by gentle trituration. The dissociated cells were plated at a density of 50,000 cells/mL on poly-l-lysine coated 25 mm glass coverslips (in 35 mm Petri dishes). Cells were plated in Neurobasal medium (Invitrogen, Carlsbad, California, USA), supplemented with 2% B-27 (Invitrogen, Carlsbad, California, USA). Twenty-four hours after plating, half of the medium was replaced with the original plating medium containing 20 mM KCl. Forty-eight hours after plating, and every 3 days following, one third of the medium was replaced with DMEM (Invitrogen, Carlsbad, California, USA) supplemented with 10% heat-inactivated fetal bovine serum (Invitrogen, Carlsbad, California, USA), 10% Ham’s F12 with l-glutamine (Invitrogen, Carlsbad, California, USA), 1% penicillin-streptomycin (Sigma-Adrich, Oakville, Ontario, Canada), 10 mM KCl and 15 mM HEPES. Both glia and neurons were present under these culture conditions. Cells were recorded from after 8–13 days in culture.
Electrophysiology
Whole-cell perforated patch recordings using gramicidin (50 µg/mL; Sigma-Adrich, Oakville, Ontario, Canada) were performed on pairs of synaptically connected cultured hippocampal neurons. The recording pipettes were made from glass capillaries (World Precision Instruments Inc., Sarasota, Florida, USA), with a resistance of 4–10 MΩ. The pipettes were filled with an internal solution containing 150 mM KCl, 10 mM HEPES, and gramicidin, pH 7.4, osmolarity = 300 mOsmol. The cultures were continuously perfused (approximately 1 mL/min) with extracellular recording solution containing (in mM): 150 NaCl, 3 KCl, 3 CaCl2·2H2O, 2 MgCl2·6H2O, 10 HEPES, 5 Glucose, pH 7.4, osmolarity = 307–315 mOsmol. Recordings were performed with a MultiClamp 700B (Molecular Devices Inc., Sunnyvale, California, USA) patch-clamp amplifier. Signals were filtered at 5 kHz using amplifier circuitry. Data was acquired and analyzed using Clampfit 9 (Molecular Devices Inc., Sunnyvale, California, USA). Recordings started after the series resistance had dropped below 30 MΩ. For assaying synaptic connectivity, each neuron was stimulated at a low frequency (0.05 Hz) by a 1 ms step depolarization from −70 to +20 mV in voltage-clamp mode. GPSCs were distinguishable from excitatory postsynaptic currents (EPSCs) by longer decay times. Upon occasion we did detect autaptic GABAergic synapses in our cultures, however we did not examine these synapses in the present study. During the STDP induction protocol both neurons were switched to current-clamp mode and injected with current (minimal stimulation, 2 ms) both pre- and postsynaptically to generate an action potential in each cell at a frequency of 5 Hz for 30 s. The interval between spike induction was ±5 ms, which resulted in a spike-timing interval of ±1 ms between onset of the GABAergic postsynaptic potential (GPSP) and the postsynaptic action potential. This protocol resulted in 150 pairs of pre- and postsynaptic action potentials. All recordings were performed at room temperature (25°C).
The resting membrane potential was determined in current-clamp mode in the absence of current injection or synaptic activity. ECl was determined by varying the holding potential of the postsynaptic cell in 10 mV increments and measuring the resulting GPSC amplitude; each set of current-voltage (I–V) measurements was repeated after a 5-min interval. A linear regression of both sets of GPSC amplitude measurements was then used to calculate the voltage dependence of GPSCs. The intercept of this line with the abscissa was taken as ECl. The slope of the same line was taken as GPSC conductance. The difference between the resting membrane potential and ECl was taken as the driving force.
GABAA receptors are permeable to both HCO3− and Cl− (∼0.2–0.4 ratio; Kaila, 1994 ). Due to the relatively positive HCO3− equilibrium potential (∼−10 mV), which is set by mechanisms that control intracellular pH regulation (Kaila and Voipio, 1987 ), HCO3− mediates an inward, depolarizing current (Kaila and Voipio, 1987 ; Kaila et al., 1993 ; Gulledge and Stuart, 2003 ). However, our experiments were performed in bicarbonate-free solution buffered with HEPES, and thus GABAA receptor activation was solely mediating a Cl− current. For this reason we report ECl and not EGABA.
Fluorescence Imaging
To assess the effect of STDP induction on postsynaptic Ca2+ influx the hippocampal neurons were loaded with the membrane-permeable fluorescent Ca2+ indicator Fluo4-AM (Invitrogen; Carlsbad, CA, USA) for 30 min at 37°C, 5% CO2. The Fluo4 was dissolved in dimethyl sulfoxide (DMSO) and 20% pluronic acid to a stock concentration of 1 mM and then diluted to 1 µM in our extracellular recording solution. Following dye-loading the cells were thoroughly washed with extracellular recording solution. Cells were then transferred to the recording chamber of an inverted microscope (Olympus IX71) equipped with an Olympus 0.6 NA × 40 objective. Fluo4 was excited at 488 nm through a monochromator (Photon Technology International (Canada) Inc., London, ON), controlled by the ImageMaster software (Photon Technology International (Canada) Inc., London, ON). Fluorescence emission of labeled cells at 510 nm was detected with a 16-bit CCD camera (Cascade 650, Photometrics, Roper Scientific, Tuscon, AZ, USA). Images of 653 × 492 pixels were accumulated at 500–1000 ms intervals.
Fluorescence Analysis
Analysis of the fluorescence signals was performed off-line on the image sequences as they were originally acquired. Analysis was performed on regions of interest (ROIs) that encompassed approximately 80% of the soma (which ranged from 10–50 µM in diameter). Fluorescence was plotted against time to yield a graph of the fluorescence changes over the STDP induction period. F0 was taken to be the fluorescence from the last image before induction began. Fpeak was taken to be the maximum fluorescence level reached over the course of the induction. F30 was taken to be the fluorescence from the final image during the induction period. ΔF30 was calculated as the percentage difference between F0 and F30; ΔFpeak was calculated as the percentage difference between F0 and Fpeak. The area under the graph was normalized to F0 to provide Farea. We determined that photobleaching did not impact our Ca2+ analysis. This determination was made by comparing the fluorescence of quiescent cells during the first and last 5 s of a 30-s image acquisition and finding no significant difference in fluorescence (p = 0.06). Thus, we did not alter the image analysis further to account for photobleaching.
Statistical Analysis
All data are presented as mean ± SEM. Linear regression analysis was used to obtain correlation coefficients and corresponding p-values. One-way ANOVA was used to compare the Farea values of depolarizing and hyperpolarizing synapses to those of neurons fired alone (post only). Paired t-tests were used to compare ECl and resting membrane potential values when those values were obtained from the same neurons. All other statistical analysis used unpaired t-tests. All statistical analysis was performed using SigmaStat 2.03.
Results
Characterization and Localization of GABAergic Synapses
In order to examine Ca2+ influx during STDP induction, we first had to locate synaptically connected neurons and characterize the synapse between them. We did this using dual perforated patch-clamp recordings from pairs of hippocampal neurons cultured at a low density. Hippocampal cultures were prepared from E18 rats and recorded from after 8–13 days in culture; they contained glia, pyramidal neurons and GABAergic interneurons. Synaptic connections were identified by stimulating one neuron and monitoring for the presence of postsynaptic currents in the other. After we located a synapse, our first indication that it was GABAergic came from the relatively long time course of the GPSC in voltage-clamp mode (35.50 ± 3.37 ms for GPSCs, as opposed to 5.76 ± 0.64 ms for glutamatergic currents; Balena and Woodin, 2008 ). If the synapse had a time course consistent with GABAergic currents we then determined the ECl by constructing an I–V curve; the intersection of the curve with the x-axis was taken to be ECl (Figures 1 A,B). Because the extracellular recording solution was free of HCO3−, ECl ≈ EGABA. Based on the relation of ECl to resting membrane potential, we characterized GABAergic synapses as either: (1) depolarizing, when ECl was more positive than the resting membrane potential (Figure 1 A); or (2) hyperpolarizing, when ECl was more negative than the resting membrane potential (Figure 1 B). Depolarizing GABAergic synapses had an average ECl of −58.33 ± 2.63 mV, which was significantly different from the resting membrane potential of those neurons (−70.33 ± 1.17 mV; n = 12; paired t-test p < 0.001; Figure 1 C). In all cases ECl was hyperpolarizing with respect to action potential threshold, and thus depolarizing synapses were not excitatory. Hyperpolarizing synapses had an average ECl of −75.87 ± 1.74 mV, which was significantly different from their resting membrane potential values (−63.40 ± 2.44 mV; n = 10; paired t-test p < 0.001; Figure 1 C). There was a significant difference between the ECl values (p < 0.001) and resting membrane potential values (p = 0.014) of depolarizing and hyperpolarizing synapses. The slope of each I–V curve provided the GABAA conductance of that synapse. Depolarizing GABAergic synapses had a conductance of 1.85 ± 0.34 pS (n = 12), and hyperpolarizing synapses had a conductance of 1.74 ± 0.35 pS (n = 10); there was no significant difference between the conductances of the two populations (p = 0.824).
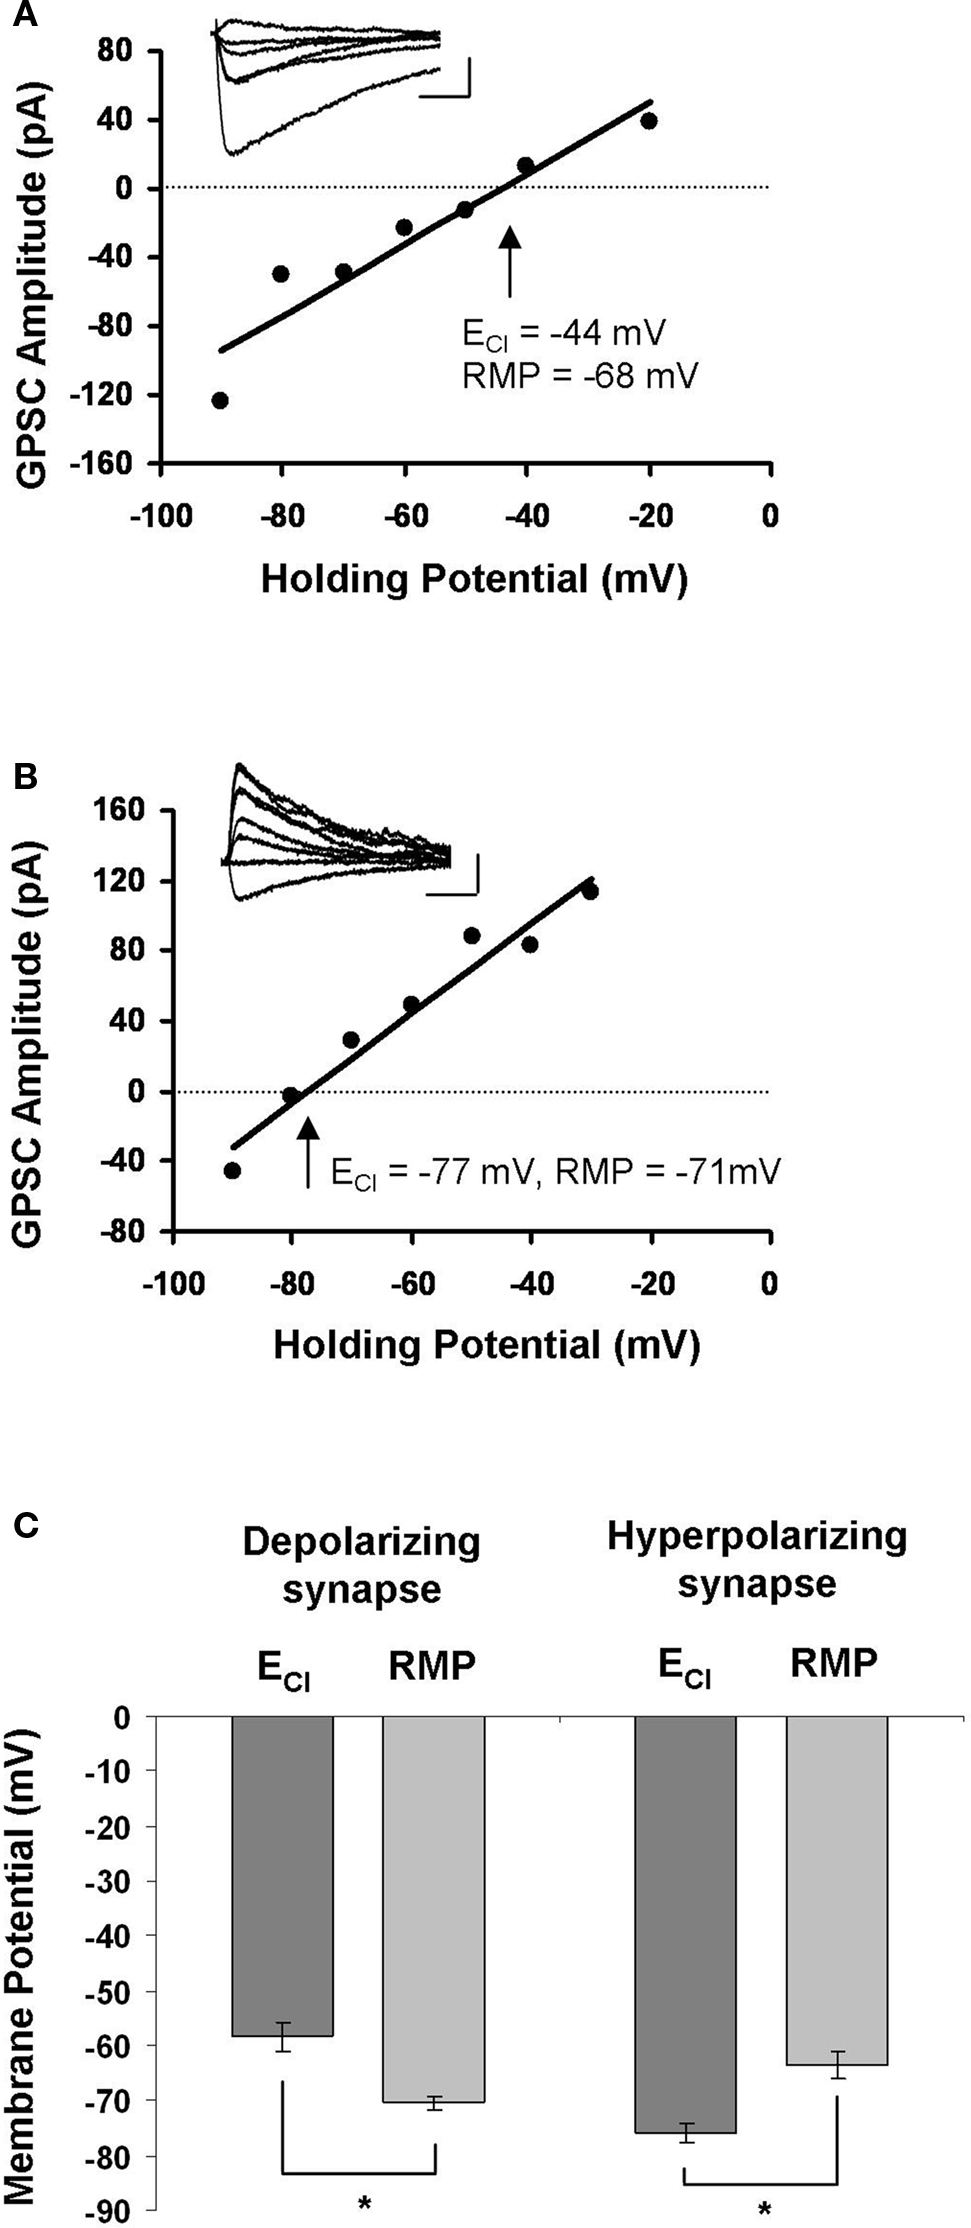
Figure 1. Characterization of GABAergic synapses. (A) Example of an I–V curve from a depolarizing GABAergic synapse. The postsynaptic membrane potential was stepped in 10 mV increments while stimulating GABAergic synapses to generate the I–V curve. The holding potential at which the GPSC amplitude was 0 mV (dashed line) was taken as ECl. Inset: sample traces of GPSCs recorded during the construction of the I–V curve. Legend: 20 ms, 45 mV. (B) Example of an I–V curve from a hyperpolarizing GABAergic synapse. Characterized as in (A). Legend: 20 ms, 45 mV. (C) The average ± SEM for ECl and resting membrane potential (RMP) at depolarizing and hyperpolarizing synapses. *indicates statistical significance.
Simultaneous STDP Induction and Imaging of Ca2+ Dynamics
Following characterization of the GABAergic synapse we examined the Ca2+ dynamics during the induction of STDP. To do this, we loaded neurons with the Ca2+-sensitive cell permeant fluorescent dye Fluo4-AM (Figures 2 A,B). A sequence of fluorescence images was then acquired at 1–2 Hz during STDP induction. GABAergic STDP was induced in current-clamp mode; both the pre- and postsynaptic neurons were induced to fire action potentials (using minimal stimulation) at a frequency of 5 Hz for 30 s. The interval between spike induction was ±5 ms, which resulted in a spike-timing interval of ±1 ms between onset of the GPSP and the postsynaptic action potential. This yielded a graph representing the changes in Fluo4 fluorescence (as a measure of Ca2+) over time (Figure 2 C). This data was normalized to the baseline fluorescence level and expressed as a percentage increase. We analyzed three measures of the change in fluorescence during STDP induction: (1) ΔF30 (%), the change in fluorescence from F0 to F30; (2) ΔFpeak (%), the change in fluorescence from F0 to Fpeak; and (3) Farea, the area under the curve normalized to F0. Increasing the image acquisition frequency to 100–200 ms intervals did not significantly change the ΔFpeak for depolarizing GABAergic synapses (p = 0.898), indicating that the standard acquisition rate was sufficient to resolve the peak of the Ca2+ fluorescence. We chose to exclusively examine the Ca2+ influx at the soma of the postsynaptic neurons for two reasons. First, the majority of GABAergic neurons innervate the proximal dendrites and soma of postsynaptic neurons (Cobb et al., 1995 ; Freund and Buzsaki, 1996 ; Di Cristo et al., 2004 ; Huang, 2006 ). Second, we recently demonstrated that GABAergic STDP is induced by feed-forward interneurons which target the soma of pyramidal neurons in the CA1 region of the hippocampus (Ormond and Woodin, 2009 ).
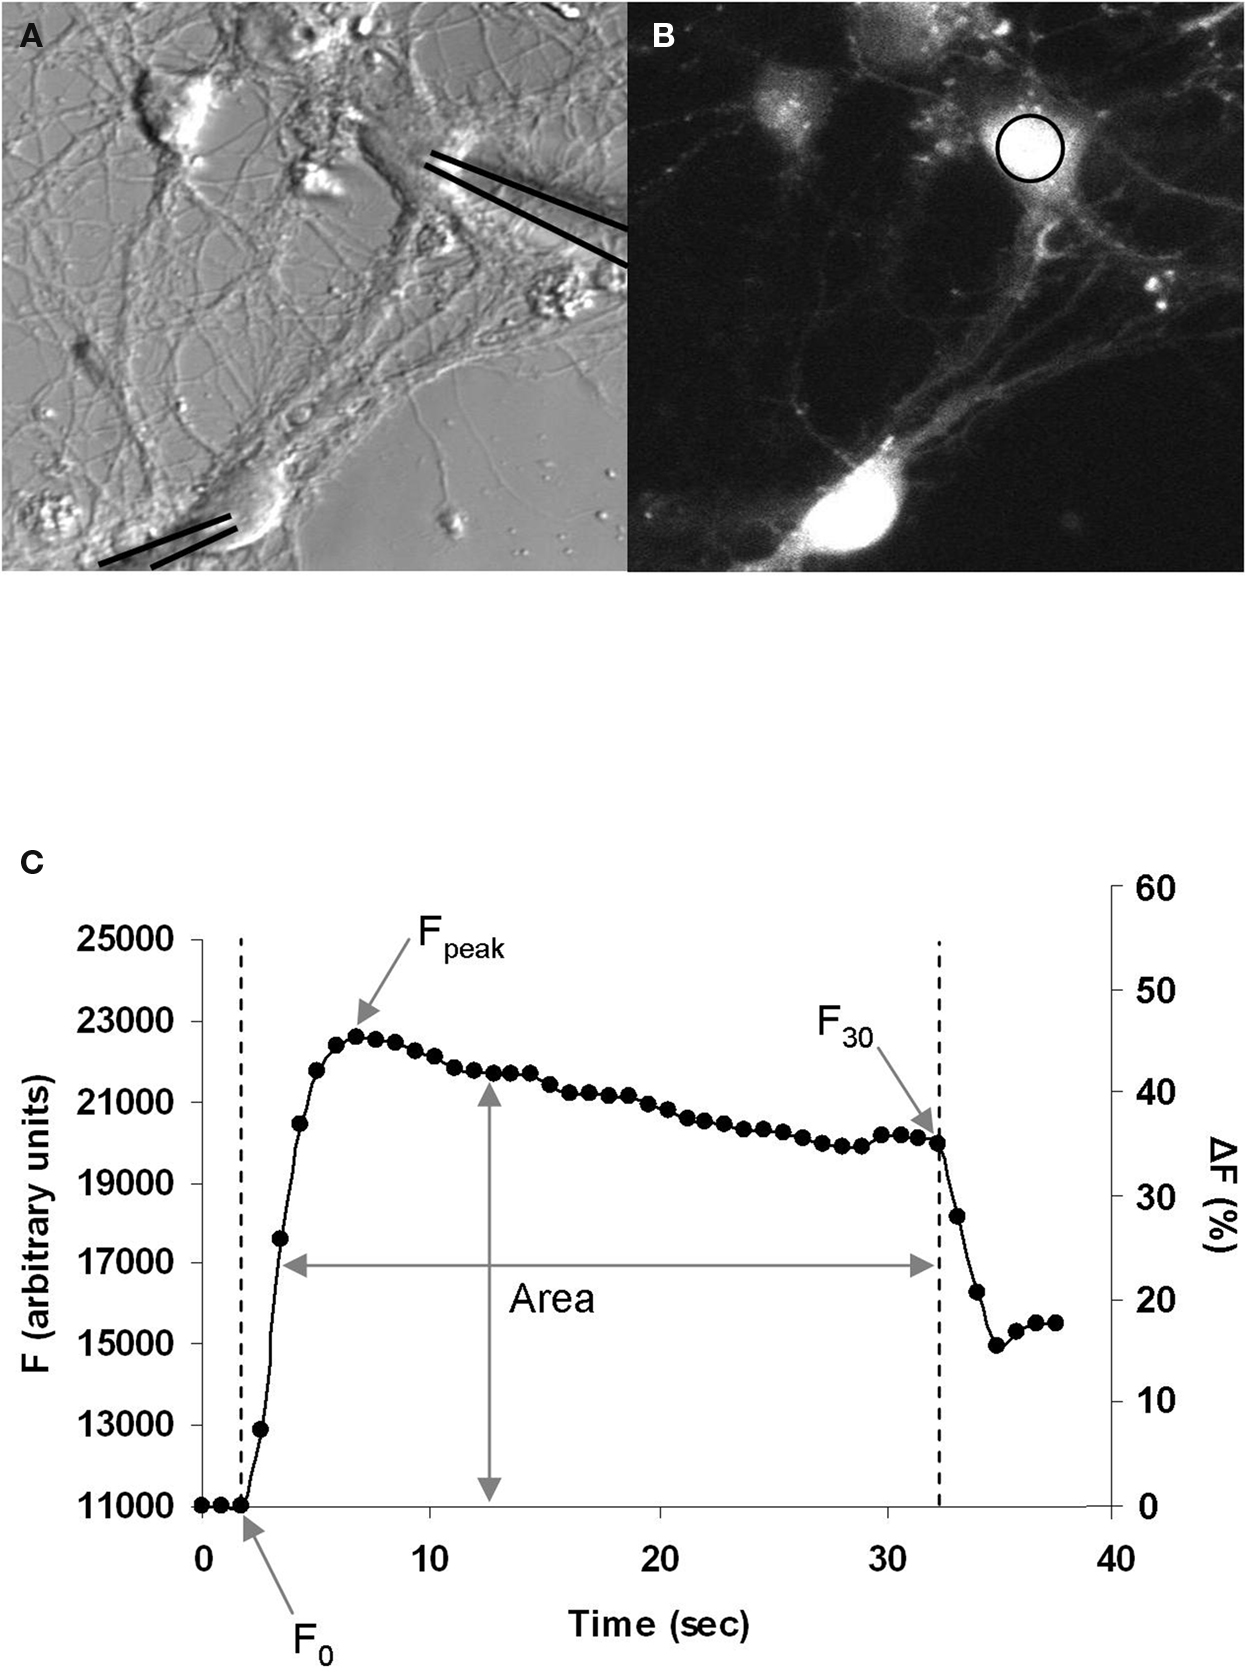
Figure 2. Postsynaptic Ca2+ imaging during GABAergic STDP induction. (A) Bright field image of neurons during recording. The recording pipettes have been overlaid with black lines to clearly indicate the neurons being recorded. (B) Fluo4-AM fluorescence image of the same neurons as in (A), measuring changes in Ca2+ during STDP induction. Ca2+ was measured in the area of interest on the soma (circle). (C) Example graph of the increase in Fluo4 fluorescence during induction, which begins at F0 with the onset of stimulation, peaks at Fpeak, and ends at F30 after 30 s of stimulation. The area of under the curve over this time period was used to calculate Farea, which normalizes the area to F0. Left axis: arbitrary fluorescence units. Right axis: the same graph expressed as a percentage increase from baseline.
GPSC Polarity Determines the Magnitude of Ca2+ Influx During STDP Induction
Ca2+ influx is required for GABAergic STDP (Woodin et al., 2003 ), but whether or not the dynamics of the influx depend on the properties of the synapse had not yet been determined. After recording from a population of neurons that included both depolarizing and hyperpolarizing GPSCs and imaging their Ca2+ dynamics, we examined the relationship between GPSC amplitude and Ca2+ influx during STDP induction. GPSC amplitude correlated strongly with Ca2+ influx (Farea); the linear regression analysis yielded similarly high r-squared value regardless of the spike-timing order [pre/post r-squared = 0.66 (p = 0.002), post/pre r-squared = 0.65 (p = 0.003), all synapses r-squared = 0.65 (p < 0.001); Figure 3 A]. GPSC amplitude also correlated strongly with other measure of Ca2+ influx, ΔF30 [pre/post r-squared = 0.65 (p = 0.002), post/pre r-squared = 0.60 (p = 0.005), all synapses r-squared = 0.62 (p < 0.001)] and ΔFpeak [pre/post r-squared = 0.62 (p = 0.004), post/pre r-squared = 0.63 (p = 0.004), all synapses r-squared = 0.62 (p < 0.001)]. Thus, regardless of the fluorescence measure examined, there was a strong relationship between Ca2+ influx and the nature of the GABAergic synapse; depolarizing synapses correlated with large increases in Ca2+, while hyperpolarizing synapses correlated with smaller increases.
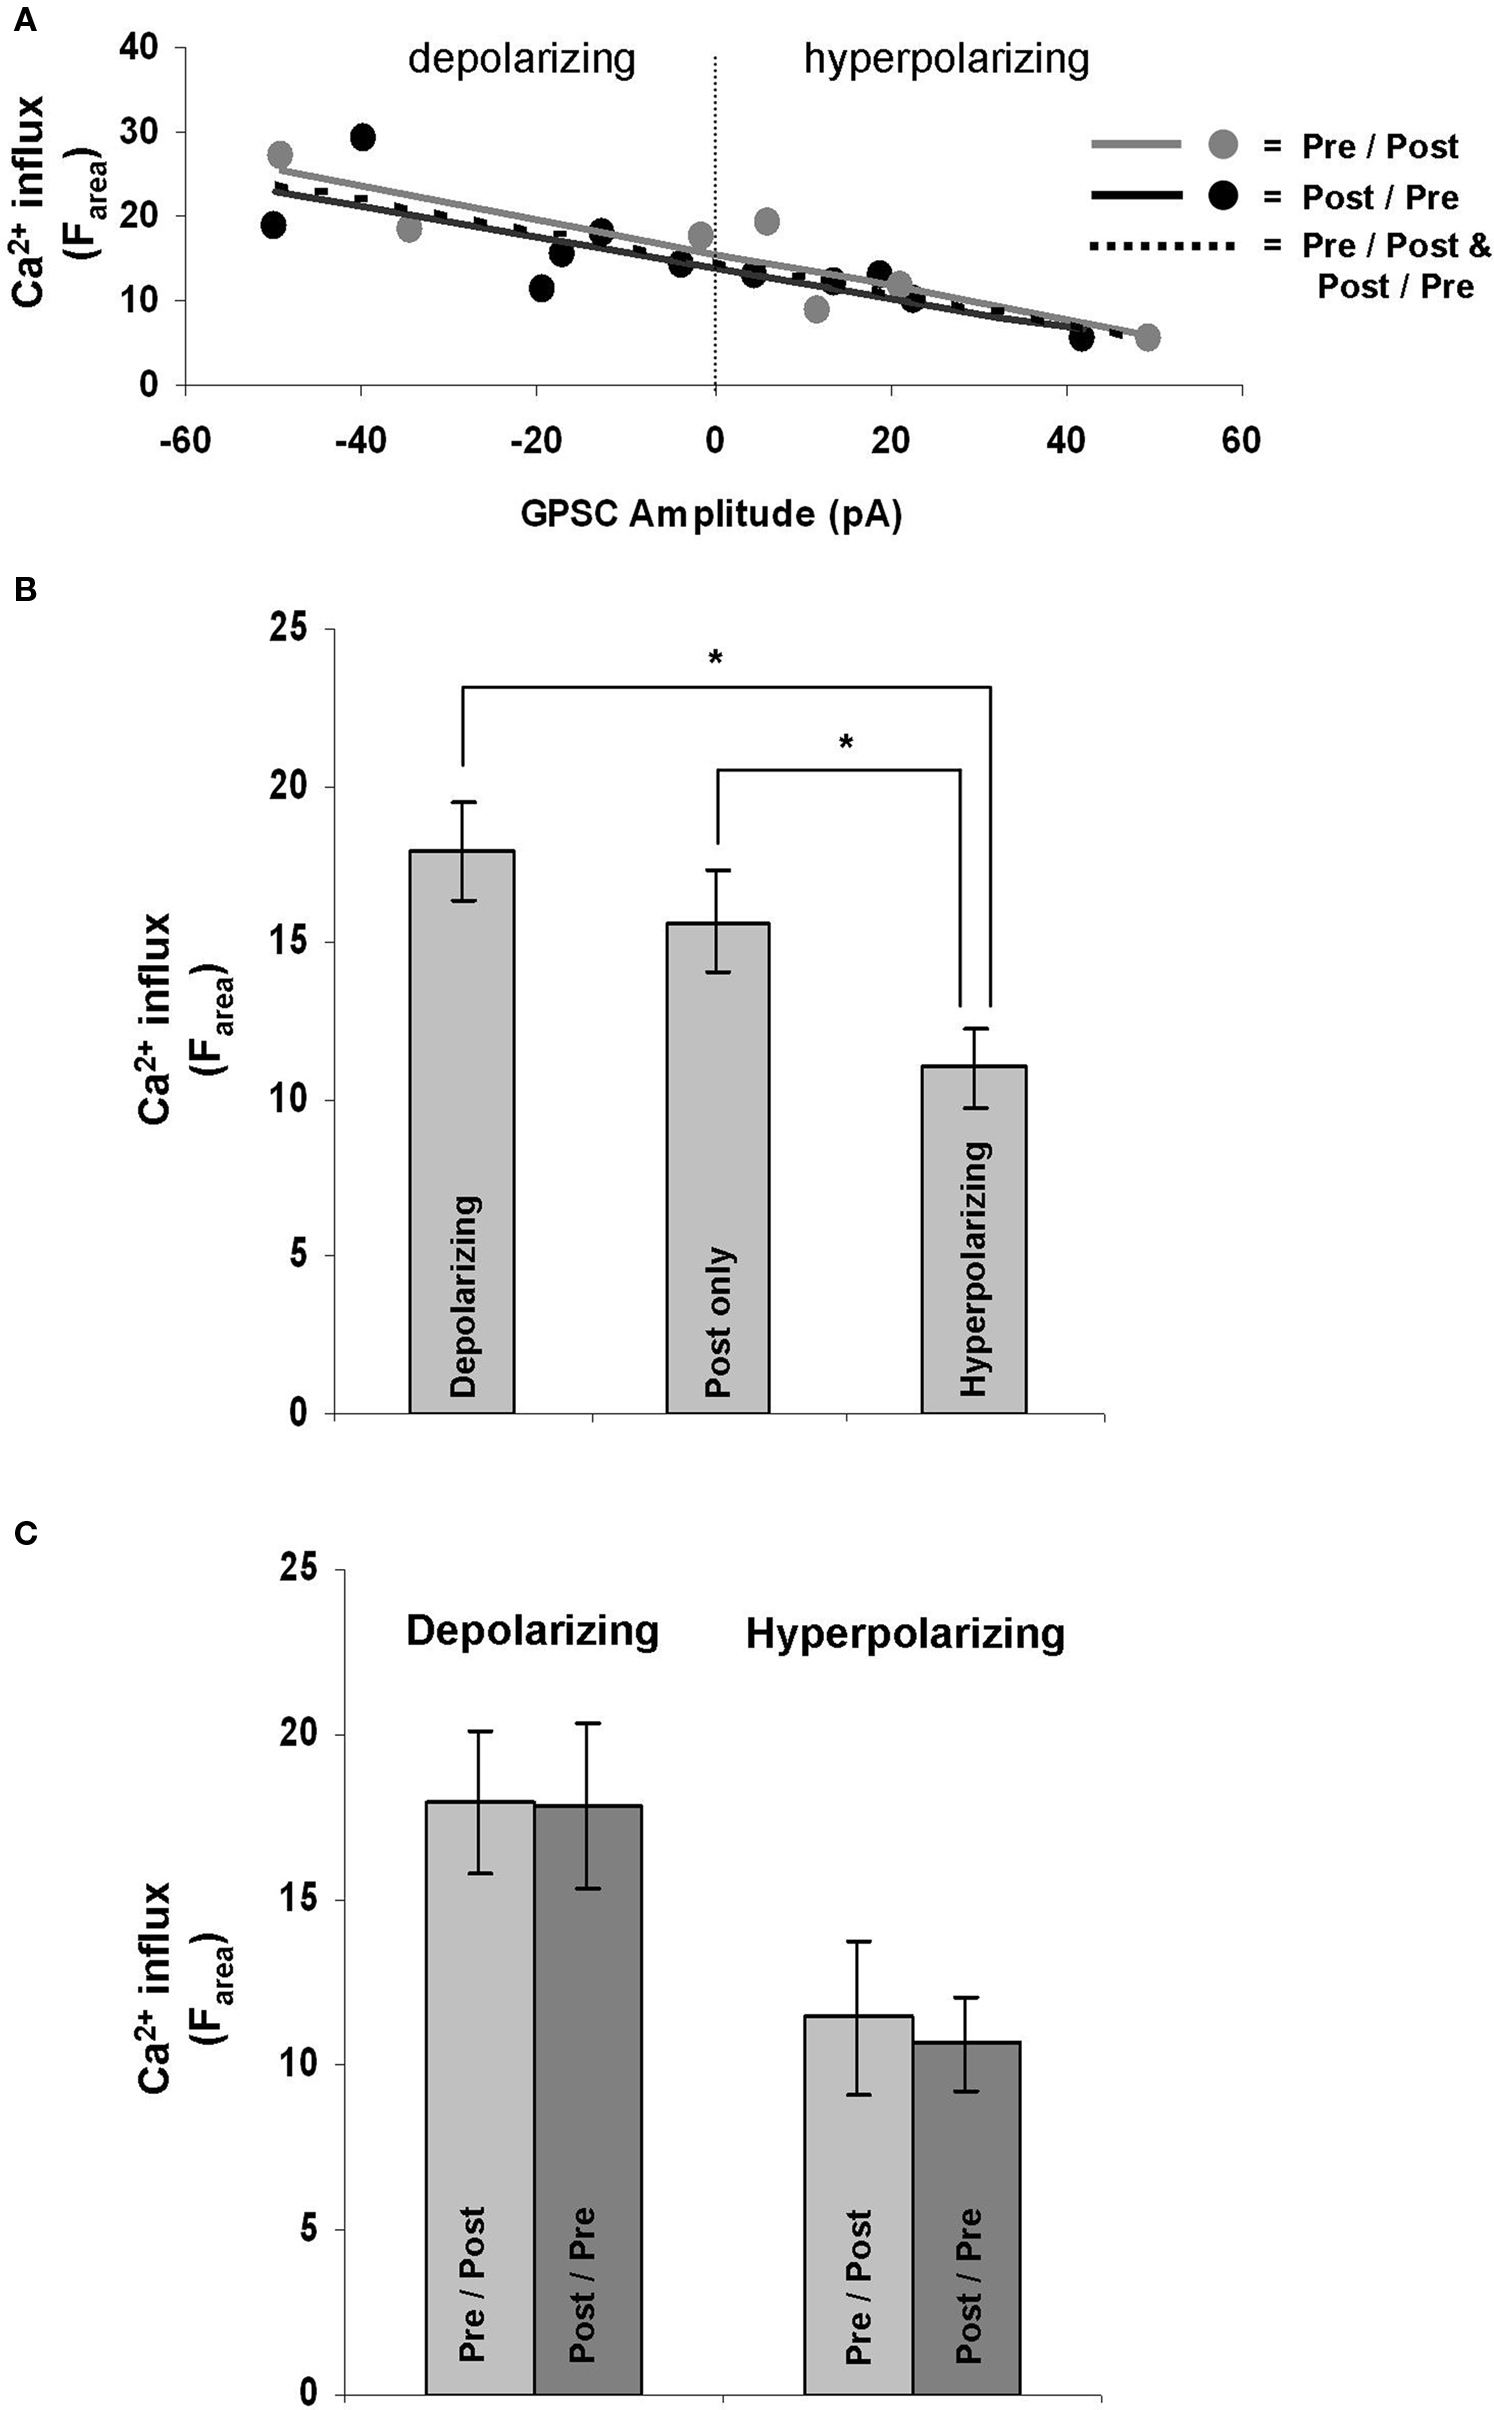
Figure 3. GPSC amplitude affects postsynaptic Ca2+ dynamics during STDP induction. (A) GPSC amplitude strongly correlates with Ca2+ influx regardless of the order of spike-timing. (B) Depolarizing synapses result in a significantly larger Ca2+ influx during STDP induction than do hyperpolarizing synapses (p = 0.004). Hyperpolarizing synapses also result in a significantly lower Ca2+ influx than the firing of a neuron alone (post only; p = 0.045). (C) There was no significant difference in Ca2+ influx when STDP was induced in post/pre or pre/post orders at depolarizing (p = 0.96) and hyperpolarizing synapses (p = 0.77).
The correlation between Ca2+ influx and GPSC amplitude was further quantified by comparing the fluorescence increase during STDP induction between all depolarizing synapses (ECl = −58.33 ± 2.63 mV; n = 12), all hyperpolarizing synapses (ECl = −75.87 ± 1.74 mV; n = 10), and neurons with no synapses (which we call “post only”; n = 11). The post only neurons were also stimulated at 5 Hz for 30 s. There were significant differences between the Ca2+ influx at depolarizing and hyperpolarizing synapses regardless of the measure analyzed (Farea p = 0.004; Fpeak p = 0.005; F30 p = 0.004; Figure 3 B). Ca2+ influx at hyperpolarizing synapses were also significantly different from the influx at post only neurons that fired in the absence of a synapse when Farea and F30 were analyzed (p = 0.04 and p = 0.048, respectively); however when Fpeak was analyzed there was not a significant difference between hyperpolarizing synapses and post only neurons (p = 0.06). Thus, we can conclude that depolarizing neurons let in the same amount of Ca2+ during STDP induction as the postsynaptic neurons spiking alone (independent of a synapse). However, when the GPSC becomes hyperpolarizing it has a strong ability to decrease the Ca2+ influx.
At glutamatergic synapses the order of spiking (pre/post versus post/pre) during STDP induction determines the polarity of the plasticity (LTP versus LTD, respectively; Bi and Poo, 1998 ). However, at GABAergic synapses the order of spiking during induction does not determine the nature of plasticity (as evidenced by the symmetrical spike-timing window Woodin et al., 2003 ). We thus hypothesized that Ca2+ influx during STDP induction should be independent of the spike-timing order. We found no significant difference in Ca2+ influx (Farea) between synapses induced with positive or negative spike-timing intervals; this was true for both depolarizing (p = 0.96) and hyperpolarizing synapses (p = 0.77; Figure 3 C). We also found no significant difference between the time taken for the Ca2+ influx to reach its maximum between pre/post and post/pre synapses (p = 0.968).
GABAergic Synapse Properties Determine Ca2+ Dynamics During STDP Induction
The Ca2+ influx during STDP induction was affected by GPSC amplitude. GPSC amplitude is determined by both ECl and GABAA conductance (Kaila, 1994 ); thus we asked which of these properties was the most influential in regulating postsynaptic Ca2+. We found that the linear regression of ECl versus Ca2+ influx (Farea) yielded low r-squared values [0.31 (p = 0.078) for pre/post synapses, 0.25 (p = 0.114) for post/pre synapses, and 0.26 (p = 0.015) for all synapses] (Figure 4 A). Low r-squared values indicate that the trend line does not accurately predict the relationship between ECl and Ca2+ influx. Thus, the difference between the slopes of the trend lines for pre/post and post/pre synapses does not necessarily indicate that the spike-timing order influences the Ca2+ influx. ECl also did not correlate strongly with ΔF30 [pre/post r-squared = 0.26 (p = 0.114), post/pre r-squared = 0.27 (p = 0.104), all synapses r-squared = 0.26 (p = 0.017)] or ΔFpeak [pre/post r-squared = 0.29 (p = 0.086), post/pre r-squared = 0.25 (p = 0.119), all synapses r-squared = 0.26 (p = 0.016)].
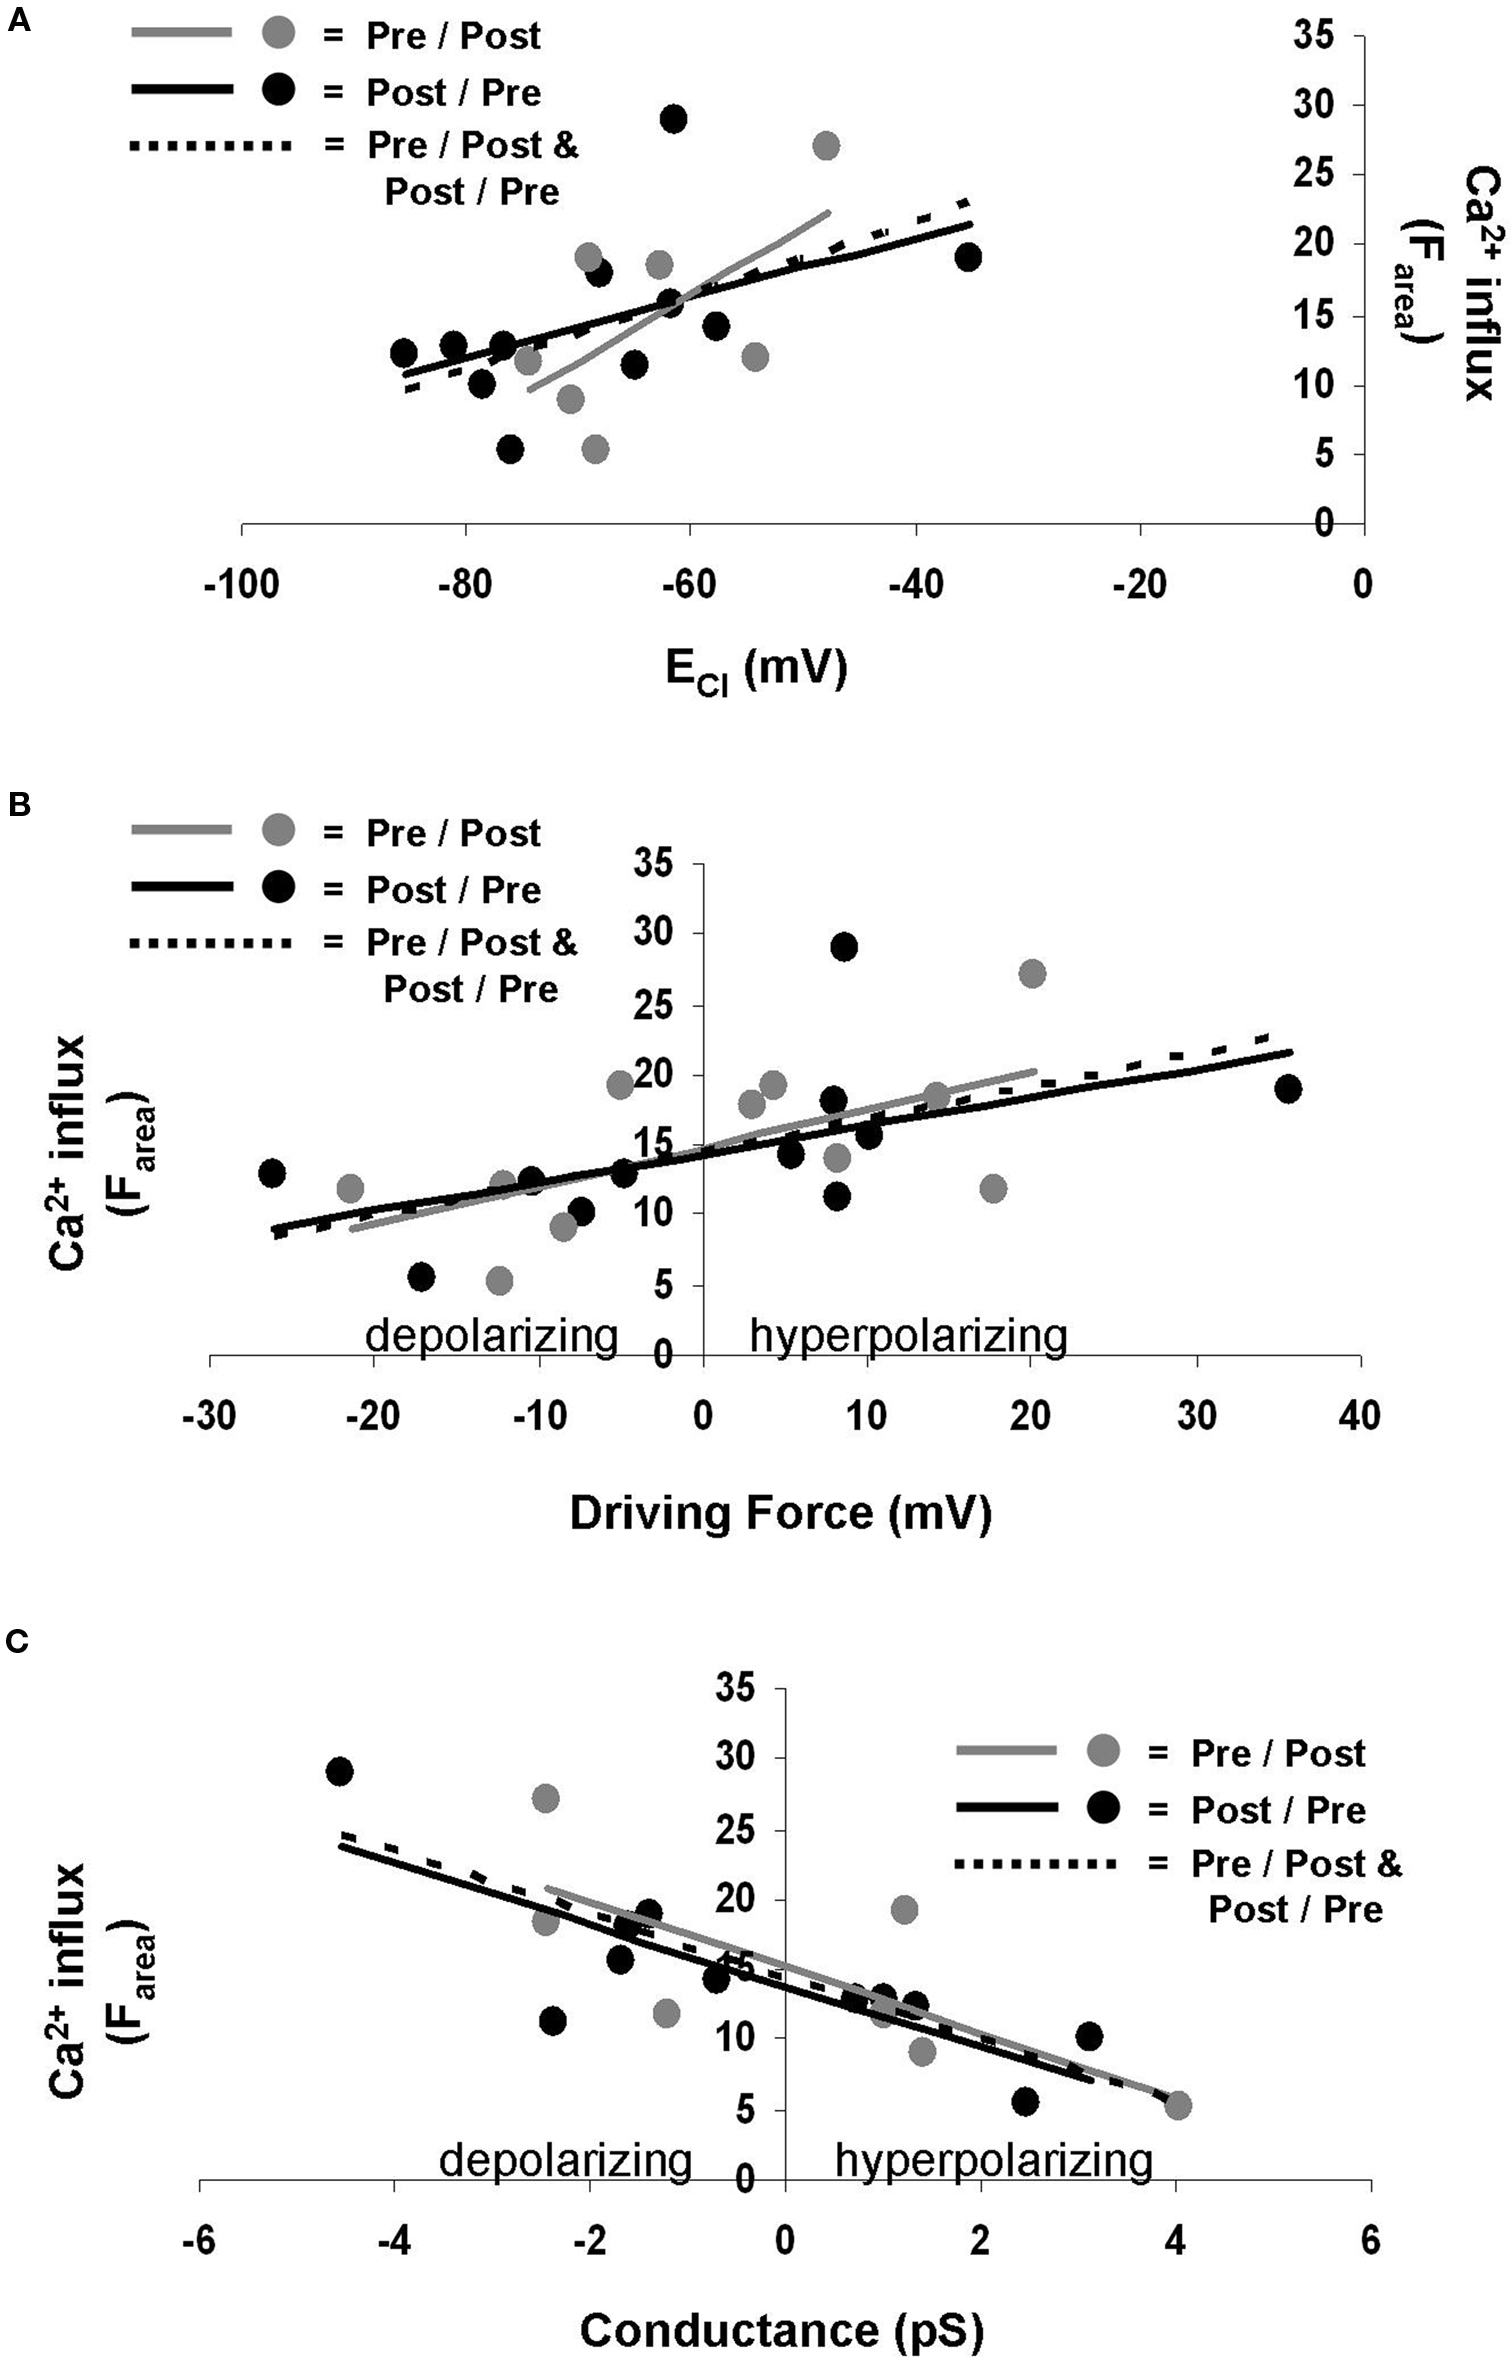
Figure 4. ECl, driving force, and GABAA conductance influence Ca2+ influx during STDP induction. (A) ECl does not correlate well with Ca2+ influx. Gray points and solid gray line represent pre/post synapses. Black points and solid black line indicate post/pre synapses. Dotted line indicates all synapses combined. (B) Driving force correlates better with Ca2+ influx. Gray points and solid gray line represent pre/post synapses. Black points and solid black line indicate post/pre synapses. Dotted line indicates all synapses combined. (C) GABAA conductance also correlates well with Ca2+ influx. Gray points and solid gray line represent pre/post synapses. Black points and solid black line indicate post/pre synapses. Dotted line indicates all synapses combined.
Perhaps a more useful measure when considering the Cl− gradient is the driving force for Cl−, which is the difference between the membrane potential and ECl. We found that the driving force correlated more strongly with Ca2+ influx (Farea) than did ECl alone, with r-squared values of 0.39 (p = 0.041) for pre/post synapses, 0.31 (p = 0.076) for post/pre synapses, and 0.34 (p = 0.004) for all synapses (Figure 4 B). Other measures of Ca2+ influx, ΔF30 [pre/post r-squared = 0.42 (p = 0.032), post/pre r-squared = 0.33 (p = 0.063), all synapses r-squared = 0.37 (p = 0.003)] and ΔFpeak [pre/post r-squared = 0.35 (p = 0.055), post/pre r-squared = 0.33 (p = 0.066), all synapses r-squared = 0.33 (p = 0.005)], provided similar results as Farea.
GABAA conductance was found to correlate with Farea to a higher degree than did ECl or driving force, with r-squared values of 0.57 (p = 0.007) for pre/post synapses, 0.68 (p = 0.002) for post/pre synapses, and 0.62 (p < 0.001) for all synapses (Figure 4 C). Conductance also correlated well with ΔF30 [pre/post r-squared = 0.52 (p = 0.013), post/pre r-squared = 0.62 (p = 0.004), all synapses r-squared = 0.56 (p < 0.001)] and ΔFpeak [pre/post r-squared = 0.52 (p = 0.012), post/pre r-squared = 0.66 (p = 0.003, all synapses r-squared = 0.58(p < 0.001)].
Discussion
At GABAergic synapses, the induction of STDP requires an increase in postsynaptic Ca2+ (Woodin et al., 2003 ; Xu et al., 2008 ; Ormond and Woodin, 2009 ). Depending on the stage of nervous system development GABAergic synapses can be either depolarizing or hyperpolarizing, which led us to hypothesize that the nature of GABAergic transmission regulates the magnitude of the Ca2+ influx. Our present results found this hypothesis to be true; depolarizing GABAergic synapses characteristic of immature neuronal circuits produced larger Ca2+ influxes during STDP induction than hyperpolarizing GABAergic synapses, which are more commonly found in the mature central nervous system. Our analysis further revealed that this relationship between GABAergic synapses and Ca2+ influx can be accounted for by the two main properties of GABAergic synapses (the driving force for Cl− and the GABAA receptor conductance) but did not depend on the order of spike timing.
It is already well known that synaptic transmission contributes to the postsynaptic Ca2+ influx during glutamatergic STDP induction (Markram et al., 1997 ; Bi and Poo, 1998 , 2001 ; Debanne et al., 1998 ; Zhang et al., 1998 ). At these excitatory synapses, Ca2+ influx occurs primarily via VGCCs opened by the back-propagating action potential, and via NMDARs opened by the coincident occurrence of the back-propagating action potential and postsynaptic glutamate binding. How can our understanding of the Ca2+ influx during glutamatergic STDP induction be related to GABAergic STDP? It depends on the polarity of the GABAergic synapse. When ECl sits below the resting membrane potential the GPSC will hyperpolarize the postsynaptic membrane during STDP induction, resulting in a smaller Ca2+ influx than if that same postsynaptic neuron was spiking alone (at 5 Hz for 30 s, in the absence of synaptic transmission). This smaller Ca2+ influx presumably results from hyperpolarizing GPSCs decreases the opening of VGCCs (which are activated by action potential firing during STDP induction). However, at depolarizing GABAergic synapses, the Ca2+ influx during STDP induction for both positive and negative spike-timing intervals does not differ significantly from when the postsynaptic neuron spikes alone. This indicates that the additional depolarization is insufficient to open more VGCCs, either because the majority of available VGCCs have already been opened by the action potential, or because the magnitude of depolarization is not sufficient to open VGCCs.
We already know that the required Ca2+ influx during GABAergic STDP occurs partly through L-type VGCCs (Woodin et al., 2003 ; Ormond and Woodin, 2009 ). However, this cannot be the only source of Ca2+ influx because when GABAergic synapses are blocked or absent (post only) the same spiking pattern which also opens VGCCs fails to induce plasticity. This indicates that there are either additional sources of Ca2+ influx required for STDP, or that a component of the GABAergic signaling combines with the L-type Ca2+ influx to induce plasticity. We have preliminary evidence for the involvement of T-type VGCCs during hyperpolarizing GABAergic STDP (Balena and Woodin, 2009 ); these channels require membrane hyperpolarization to be removed from their inactive state but also require subsequent membrane depolarization to become activated (Magee et al., 1995 ; Perez-Reyes and Lory, 2006 ). Thus during hyperpolarizing GABAergic transmission we believe that the Ca2+ influx occurs both through L-type VGCCs (which have a reduced opening compared to post only) and through T-type VGCCs.
The strength of GABAergic synapses depends upon both the conductance of the channel and on the driving force for ions flowing through the channel. Because we recorded in a HCO3−-free medium, EGABA ≈ ECl; thus the driving force through the GABAA receptors was largely determined by ECl. We found that neither the channel conductance nor the Cl− driving force alone could predict the relationship between GPSC amplitude and Ca2+ influx. This indicates that it is the combination of these properties of GABAergic transmission that is important in regulating Ca2+ influx during STDP induction.
At glutamatergic synapses, positive and negative spike-timing intervals lead to long-term potentiation and depression, respectively, resulting in an asymmetric spike-timing window (Markram et al., 1997 ; Bi and Poo, 1998 , 2001 ; Debanne et al., 1998 ; Zhang et al., 1998 ). In contrast, the spike-timing window for GABAergic synapses is symmetric, with coincident activity (within ±15 ms) resulting in decreased inhibition, independent of the spike- timing order (Woodin et al., 2003 ). This likely accounts for the non- significant differences in Ca2+-influx between positive and negative spike-timing intervals. However, the present study only examined spike-timing intervals of <5 ms; whether the results are similar for intervals >5 ms remains to be determined.
We identified a significant difference in the resting membrane potentials between depolarizing and hyperpolarizing synapses. This difference may result from our ability to identify GABAergic synapses where ECl sits close to the resting membrane potential; if ECl ≈ resting membrane potential there would be no driving force for Cl− and thus we did not characterize a synapse electrophysiologically. This may have biased our selection of synapses for those with larger driving forces; depolarizing synapses would be more likely to be found onto neurons with relatively hyperpolarized resting membrane potentials, and hyperpolarizing synapses would be common onto neurons with relatively depolarized resting membrane potentials.
Following acute neuronal trauma (van den Pol et al., 1996 ; Toyoda et al., 2003 ), oxygen-glucose deprivation (Galeffi et al., 2004 ), and seizure activity (Galanopoulou, 2007 ), there is a depolarization of ECl which renders GABAergic transmission depolarizing (Fiumelli and Woodin, 2007 ; Kahle et al., 2008 ). Based on our present results, this switch in the polarity of GABAergic transmission increases the amount of Ca2+ influx during subsequent neuronal activity. In fact, the magnitude of the ECl depolarization following neuronal insults is so large it often renders GABAergic transmission excitatory (Kahle et al., 2008 ), which should produce even larger Ca2+ influxes than those observed in the present study. This may be particularly relevant given that the large Ca2+ influxes resulting from neuronal injury contribute to cell death (Bano and Nicotera, 2007 ).
Taken together, a model emerges where postsynaptic Ca2+ influx is required for STDP induction at GABAergic synapses, and where the magnitude of this influx is regulated by the GABAergic transmission itself. Further work will be need to elucidate both how the Ca2+ influx in turn regulates ECl, and how the Ca2+ influx is regulated when GABAergic and glutamatergic STDP are induced simultaneously.
Conflict of Interest Statement
The authors declare that the research was conducted in the absence of any commercial or financial relationships that could be construed as a potential conflict of interest.
Acknowledgments
This work was supported by a Natural Sciences and Engineering Research Council of Canada (NSERC) Discover Grant to Melanie A Woodin, and a NSERC Fellowship to Trevor Balena.
References
Balena, T., and Woodin, M. A. (2008). Coincident pre- and postsynaptic activity downregulates NKCC1 to hyperpolarize E(Cl) during development. Eur. J. Neurosci. 27, 2402–2412.
Balena, T., and Woodin, M. A. (2009). “Calcium dynamics underlying the induction of inhibitory synaptic plasticity,” in Proceedings of the Society for Neuroscience Annual Meeting (Chicago, Illinois), 41.16.
Bano, D., and Nicotera, P. (2007). Ca2+ signals and neuronal death in brain ischemia. Stroke 38, 674–676.
Bi, G., and Poo, M., (2001). Synaptic modification by correlated activity: Hebb’s postulate revisited. Annu Rev Neurosci. 24, 139–166.
Bi, G. Q., and Poo, M. M. (1998). Synaptic modifications in cultured hippocampal neurons: dependence on spike timing, synaptic strength, and postsynaptic cell type. J. Neurosci. 18, 10464–10472.
Blaesse, P., Airaksinen, M. S., Rivera, C., and Kaila, K. (2009). Cation-chloride cotransporters and neuronal function. Neuron 61, 820–838.
Cobb, S. R., Buhl, E. H., Halasy, K., Paulsen, O., and Somogyi, P. (1995). Synchronization of neuronal activity in hippocampus by individual GABAergic interneurons. Nature 378, 75–78.
Dan, Y., and Poo, M. M. (2006). Spike timing-dependent plasticity: from synapse to perception. Physiol. Rev. 86, 1033–1048.
Debanne, D., Gahwiler, B. H., and Thompson, S. M. (1998). Long-term synaptic plasticity between pairs of individual CA3 pyramidal cells in rat hippocampal slice cultures. J. Physiol. (Lond.) 507(Pt 1), 237–247.
Di Cristo, G., Wu, C., Chattopadhyaya, B., Ango, F., Knott, G., Welker, E., Svoboda, K., and Huang, Z. J. (2004). Subcellular domain-restricted GABAergic innervation in primary visual cortex in the absence of sensory and thalamic inputs. Nat. Neurosci. 7, 1184–1186.
Dzhala, V. I., Talos, D. M., Sdrulla, D. A., Brumback, A. C., Mathews, G. C., Benke, T. A., Delpire, E., Jensen, F. E., and Staley, K. J. (2005). NKCC1 transporter facilitates seizures in the developing brain. Nat. Med. 11, 1205–1213.
Fiumelli, H., and Woodin, M. A. (2007). Role of activity-dependent regulation of neuronal chloride homeostasis in development. Curr. Opin. Neurobiol. 17, 81–86.
Galanopoulou, A. S. (2007). Developmental patterns in the regulation of chloride homeostasis and GABA(A) receptor signaling by seizures. Epilepsia 48(Suppl. 5), 14–18.
Galeffi, F., Sah, R., Pond, B. B., George, A., and Schwartz-Bloom, R. D. (2004). Changes in intracellular chloride after oxygen-glucose deprivation of the adult hippocampal slice: effect of diazepam. J. Neurosci. 24, 4478–4488.
Gulledge, A. T., and Stuart, G. J. (2003). Excitatory actions of GABA in the cortex. Neuron 37, 299–309.
Huang, Z. J. (2006). Subcellular organization of GABAergic synapses: role of ankyrins and L1 cell adhesion molecules. Nat. Neurosci. 9, 163–166.
Kahle, K. T., Staley, K. J., Nahed, B. V., Gamba, G., Hebert, S. C., Lifton, R. P., and Mount, D. B. (2008). Roles of the cation-chloride cotransporters in neurological disease. Nat. Clin. Pract. Neurol. 4, 490–503.
Kaila, K. (1994). Ionic basis of GABAA receptor channel function in the nervous system. Prog. Neurobiol. 42, 489–537.
Kaila, K., and Voipio, J. (1987). Postsynaptic fall in intracellular pH induced by GABA-activated bicarbonate conductance. Nature 330, 163–165.
Kaila, K., Voipio, J., Paalasmaa, P., Pasternack, M., and Deisz, R. A. (1993). The role of bicarbonate in GABAA receptor-mediated IPSPs of rat neocortical neurones. J. Physiol. 464, 273–289.
Kano, M. (1994). Calcium-induced long-lasting potentiation of GABAergic currents in cerebellar Purkinje cells. Jpn. J. Physiol. 44(Suppl. 2), S131–S136.
Magee, J. C., Christofi, G., Miyakawa, H., Christie, B., Lasser-Ross, N., and Johnston, D. (1995). Subthreshold synaptic activation of voltage-gated Ca2+ channels mediates a localized Ca2+ influx into the dendrites of hippocampal pyramidal neurons. J. Neurophysiol. 74, 1335–1342.
Markram, H., Lubke, J., Frotscher, M., and Sakmann, B. (1997). Regulation of synaptic efficacy by coincidence of postsynaptic APs and EPSPs. Science 275, 213–215.
Nishiyama, M., Hong, K., Mikoshiba, K., Poo, M. M., and Kato, K. (2000). Calcium stores regulate the polarity and input specificity of synaptic modification. Nature 408, 584–588.
Ormond, J., and Woodin, M. A. (2009). Disinhibition mediates a form of hippocampal long-term potentiation in area CA1. PLoS ONE 4, e7224.doi:10.1371/journal.pone.0007224.
Perez-Reyes, E., and Lory, P. (2006). Molecular biology of T-type calcium channels. CNS Neurol. Disord. Drug Targets 5, 605–609.
Rivera, C., Voipio, J., Payne, J. A., Ruusuvuori, E., Lahtinen, H., Lamsa, K., Pirvola, U., Saarma, M., and Kaila, K. (1999). The K+/Cl- co-transporter KCC2 renders GABA hyperpolarizing during neuronal maturation. Nature 397, 251–255.
Saraga, F., Balena, T., Wolansky, T., Dickson, C. T., and Woodin, M. A. (2008). Inhibitory synaptic plasticity regulates pyramidal neuron spiking in the rodent hippocampus. Neuroscience 155, 64–75.
Toyoda, H., Ohno, K., Yamada, J., Ikeda, M., Okabe, A., Sato, K., Hashimoto, K., and Fukuda, A. (2003). Induction of NMDA and GABAA receptor- mediated Ca2+ oscillations with KCC2 mRNA downregulation in injured facial motoneurons. J. Neurophysiol. 89, 1353–1362.
van den Pol, A. N., Obrietan, K., and Chen, G. (1996). Excitatory actions of GABA after neuronal trauma. J. Neurosci. 16, 4283–4292.
Woodin, M. A., Ganguly, K., and Poo, M. M. (2003). Coincident pre- and postsynaptic activity modifies GABAergic synapses by postsynaptic changes in Cl- transporter activity. Neuron 39, 807–820.
Xu, C., Zhao, M. X., Poo, M. M., and Zhang, X. H. (2008). GABA(B) receptor activation mediates frequency-dependent plasticity of developing GABAergic synapses. Nat. Neurosci. 11, 1410–1418.
Yamada, J., Okabe, A., Toyoda, H., Kilb, W., Luhmann, H. J., and Fukuda, A. (2004). Cl- uptake promoting depolarizing GABA actions in immature rat neocortical neurones is mediated by NKCC1. J. Physiol. 557, 829–841.
Keywords: calcium, chloride, spike-timing dependent plasticity, inhibitory synaptic transmission, hippocampus, KCC2, NKCC1, cation-chloride cotransporter
Citation: Balena T, Acton BA and Woodin MA (2010) GABAergic synaptic transmission regulates calcium influx during spike-timing dependent plasticity. Front. Syn. Neurosci. 2:16. doi: 10.3389/fnsyn.2010.00016
Received: 04 February 2010;
Paper pending published: 22 February 2010;
Accepted: 20 May 2010;
Published online: 28 June 2010
Edited by:
Per Jesper Sjöström, University College London, UKReviewed by:
David M. Lovinger, National Institutes of Health, USALaura Cancedda, Istituto Italiano di Tecnologia, Italy
Copyright: © 2010 Balena, Acton and Woodin. This is an open-access article subject to an exclusive license agreement between the authors and the Frontiers Research Foundation, which permits unrestricted use, distribution, and reproduction in any medium, provided the original authors and source are credited.
*Correspondence: Melanie A. Woodin, Department of Cell and Systems Biology, University of Toronto, 25 Harbord Street, Toronto, ON M5S 3G5, Canada. e-mail: m.woodin@utoronto.ca