Computational reconstitution of spine calcium transients from individual proteins
 Thomas M. Bartol1,2*†
  Daniel X. Keller2,3†
  Justin P. Kinney1
  Chandrajit L. Bajaj4
  Kristen M. Harris5
  Terrence J. Sejnowski1,2,6†
  Mary B. Kennedy7*†
- 1Computational Neurobiology Laboratory, Howard Hughes Medical Institute, The Salk Institute for Biological Studies, La Jolla, CA, USA
- 2Center for Theoretical Biological Physics, University of California, San Diego, La Jolla, CA, USA
- 3Neurosciences Department, University of California, San Diego, La Jolla, CA, USA
- 4Department of Computer Science, Center for Computational Visualization, University of Texas, Austin, TX, USA
- 5Department of Neuroscience, Center for Learning and Memory, University of Texas, Austin, TX, USA
- 6Division of Biological Sciences, University of California, San Diego, La Jolla, CA, USA
- 7Division of Biology and Biological Engineering, California Institute of Technology, Pasadena, CA, USA
We have built a stochastic model in the program MCell that simulates Ca2+ transients in spines from the principal molecular components believed to control Ca2+ entry and exit. Proteins, with their kinetic models, are located within two segments of dendrites containing 88 intact spines, centered in a fully reconstructed 6 × 6 × 5 μm3 cube of hippocampal neuropil. Protein components include AMPA- and NMDA-type glutamate receptors, L- and R-type voltage-dependent Ca2+ channels, Na+/Ca2+ exchangers, plasma membrane Ca2+ ATPases, smooth endoplasmic reticulum Ca2+ ATPases, immobile Ca2+ buffers, and calbindin. Kinetic models for each protein were taken from published studies of the isolated proteins in vitro. For simulation of electrical stimuli, the time course of voltage changes in the dendritic spine was generated with the desired stimulus in the program NEURON. Voltage-dependent parameters were then continuously re-adjusted during simulations in MCell to reproduce the effects of the stimulus. Nine parameters of the model were optimized within realistic experimental limits by a process that compared results of simulations to published data. We find that simulations in the optimized model reproduce the timing and amplitude of Ca2+ transients measured experimentally in intact neurons. Thus, we demonstrate that the characteristics of individual isolated proteins determined in vitro can accurately reproduce the dynamics of experimentally measured Ca2+ transients in spines. The model will provide a test bed for exploring the roles of additional proteins that regulate Ca2+ influx into spines and for studying the behavior of protein targets in the spine that are regulated by Ca2+ influx.
Introduction
One major goal of cellular neuroscience is to understand the molecular mechanisms that control the changes in synaptic strength governing learning and the formation of memory. It is well-established that the trigger for changes in synaptic strength in the CNS is influx of Ca2+ into dendritic spines (Franks and Sejnowski, 2002; Sjöström and Nelson, 2002). Thus, to understand the rules that govern changes in synaptic strength during normal brain function, and to clarify the interactions of pharmaceuticals with excitatory synapses, it is important to understand Ca2+ control mechanisms at a quantitative level. The basal level of Ca2+ in spines and dendrites and the size and timing of transient increases in Ca2+ during electrical activity are tightly controlled. Several decades of biochemical and biophysical work on individual enzymes and channels has resulted in detailed characterizations of the kinetic properties of proteins that are believed to regulate Ca2+ in spines and dendrites. At the same time, electrophysiologists have used fluorescent dyes that are sensitive to Ca2+ concentration to measure Ca2+ transients in spines produced by electrical signals in intact neurons. Here we use computer simulations to ask whether the aggregate behavior of the enzymes and channels believed to regulate Ca2+ in spines can account quantitatively for Ca2+ transients observed in spines in living neurons.
Synaptic strength is regulated by biochemical pathways driven by Ca2+ influx through N-methyl-D-aspartate-type glutamate receptors (NMDARs) and voltage-dependent Ca2+ channels (VDCCs) in dendritic spines (Kennedy, 2013). The direction of change in synaptic strength is critically dependent on the timing and amplitude of the Ca2+ influx (Magee and Johnston, 1997; Markram et al., 1997; Bi and Poo, 1998). Because NMDARs are sensitive to both voltage and glutamate, a few milliseconds difference in the timing of presynaptic release and postsynaptic depolarization can dramatically alter the amplitude and timing of Ca2+ transients and the direction of resulting changes in synaptic strength. It is particularly important to understand the complex mechanisms that regulate synaptic strength because mutations in several proteins that influence its regulation have been correlated with increased risk of mental diseases or with intellectual disability (Selkoe, 2002; Pinto et al., 2010; Hamdan et al., 2011; Sklar et al., 2011; Network and Pathway Analysis Subgroup of the Psychiatric Genomics, 2015).
As a first step, we have asked whether the properties of the crucial proteins that biochemists, pharmacologists, electrophysiologists and biophysicists have studied in vitro, together with our present understanding of their relative numbers and locations, are sufficient to explain the timing of Ca2+ transients observed experimentally in situ in stimulated spines. For a simpler system, biochemists would use a reconstitution experiment to try to reproduce the cellular behavior in question by combining purified proteins in a test tube (e.g., Kinoshita et al., 2001). However, full reconstitution experiments are not experimentally feasible for a complex function like control of Ca2+ concentration in spines because this function depends on the precise locations of the proteins on membranes and cytosolic structures.
As an alternative approach to experimental reconstitution, we generated a computer model in the program MCell (Kerr et al., 2008). The model incorporates realistic dendritic geometry, and includes the experimentally measured kinetics of the major Ca2+-handling proteins that are believed to control Ca2+ flux in spines of pyramidal neurons in area CA1 of the hippocampus (Table 1). It also incorporates their experimentally estimated numbers and spatial localizations. We show that application of a simulated electrophysiological stimulus to the model can produce Ca2+ transients that replicate the timing and amplitude of Ca2+ transients measured in spines in response to a back-propagating action potential (bAP; Sabatini et al., 2002). The successful reconstitution required adjustment of nine parameters within their range of experimental uncertainty.
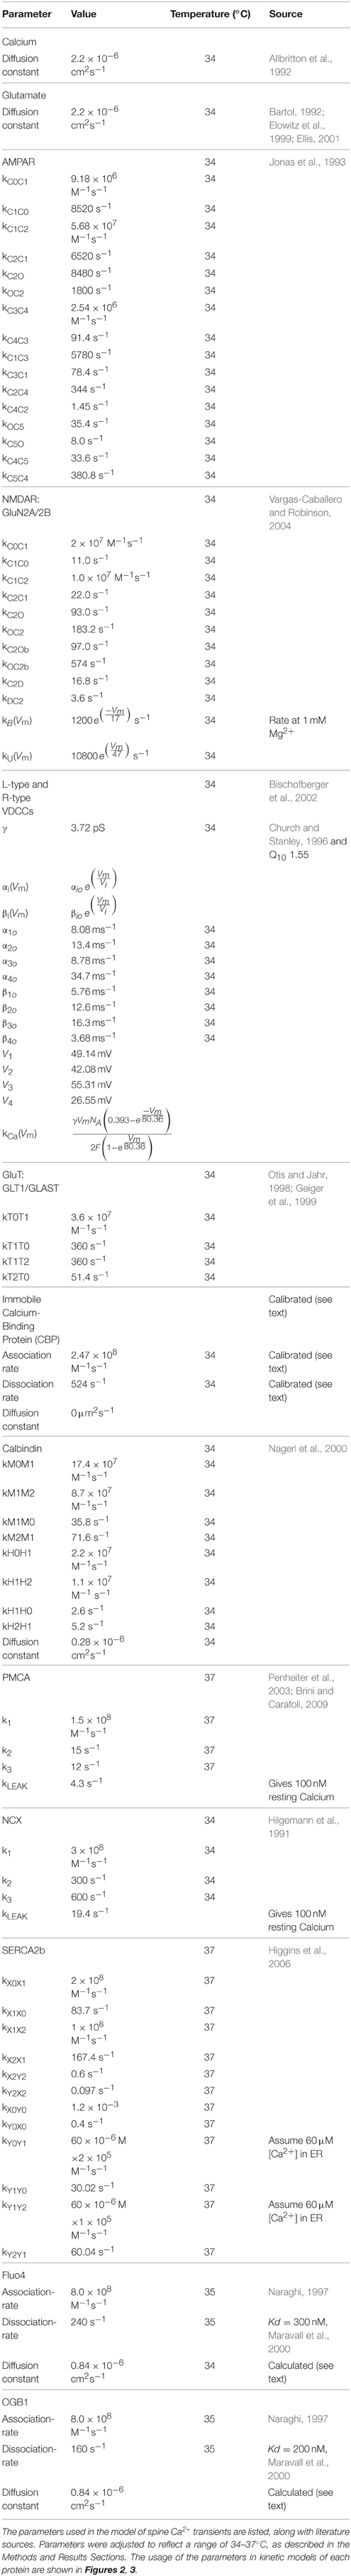
Table 1. Chemical kinetic rates and diffusion constants of molecules in model.
The calibration of parameters was done by adding appropriate fluorescent Ca2+ indicators to the model, simulating the response of the indicators to a bAP, and then comparing the simulated responses to experimental results obtained in the presence of the same indicators (Sabatini et al., 2002; Scheuss et al., 2006). After calibration, we removed the indicators so that the model better approximated the in vivo state, and again applied simulated electrophysiological stimuli. The cytosolic Ca2+ transients produced in this way had a faster rise time and higher amplitude than those previously calculated from experimental fluorescence data (Maravall et al., 2000; Sabatini et al., 2002; Yasuda et al., 2003). We believe that our estimates are likely to be more accurate because the previous calculations were made with equations that were derived assuming steady-state conditions for Ca2+ binding to proteins in the spine (Neher and Augustine, 1992); but, our simulations show that a steady state is not reached during the rapid Ca2+ transients produced by a single bAP.
Methods
The model was encoded in version 3.2 of the MCell Monte Carlo simulator (Kerr et al., 2008). MCell is a particle-based simulator of 3D reaction-diffusion systems. It permits the specification of a detailed cellular geometry and the assignment of discrete molecules, with their associated kinetics, to positions in the membrane, cytosol, or extracellular space. During the simulation, the diffusion of individual molecules is modeled as a pseudo-random walk constrained by the assigned diffusion constants. Fixed molecules have a diffusion constant of zero. Molecules can diffuse in two dimensions on the membrane, or in three dimensions in the cytosol and extracellular space. Interactions of molecules are detected by ray-tracing (Kerr et al., 2008), and binding events and/or first-order reactions are set to occur stochastically based on probabilities calculated from the kinetic rate constants assigned to each reaction. The global time step for all simulations was 1 μs. In MCell's reaction/diffusion algorithms, diffusion of individual molecules is simulated by a Monte Carlo random walk. The random walk is generated by scheduling each particle to move at a certain time in discrete spatial steps the length and direction of which are chosen by Monte Carlo sampling of the solution to the diffusion equation. During the simulation, time progresses by processing scheduled events in temporal order and the minimum elapsed time between events can be arbitrarily small. However, for internal accounting purposes the researcher specifies a global fixed timestep for keeping track of the states of most molecules. To balance computational efficiency and accuracy, molecules that move or react quickly can be scheduled to move/react with a finer temporal granularity than those that move/react more slowly. In our simulatins, we used this adaptive time stepping feature to simulate interaction of Ca2+ with a time step of 0.1 μs. Counting of reactions and molecules is described below. Data analysis was performed with custom Python scripts using Python-3.4, NumPy-1.9.2, SciPy-0.15.1, and matplotlib-1.4.3. Visualizations were created with the open source program Blender (blender.org) using the CellBlender addon. Both MCell and CellBlender are available at mcell.org.
Geometry
We started with a 6 × 6 × 5 μm cube of neuropil from stratum radiatum of the hippocampus reconstructed from electron micrographs of 100 serial sections (Figure 1, see Mishchenko et al., 2010; Kinney et al., 2013). The process of reconstruction, adjustment of extracellular space, and creation of water-tight triangulated surfaces for computer simulation is described in detail in Kinney (2009), Kinney et al. (2013), and Edwards et al. (2014). The reconstruction of the extent and tortuosity of the extracellular space permits accurate modeling of the time-course of diffusion of glutamate through and out of the synaptic cleft. The cube is centered on two segments of dendrite that are entirely included within the volume. We used these two for the reconstitution study (Figure 1C). The larger proximal apical dendritic segment has a mean diameter of 2.1 μm and contains 72 spines that are located completely within the volume (Figure 1D). The smaller dendritic segment has a diameter of 0.8 μm and contains 16 complete spines (Figure 1E). In these two dendrites, endoplasmic reticulum (ER) and mitochondria were traced and included in the reconstruction and simulations (Figures 1F,G). Protrusions of the smooth endoplasmic reticulum (SER) into the spine neck and head are present in 14 spines in the larger dendrite and three in the smaller dendrite (about 19% of the spines of both dendrites). This percentage is comparable to that reported by Spacek and Harris (1997) and Cooney et al. (2002). Although all of the membranous structures in the cube were included in the simulations to allow for appropriate glutamate diffusion and re-uptake, we collected data about Ca2+ flux only from these two dendritic segments and their spines.
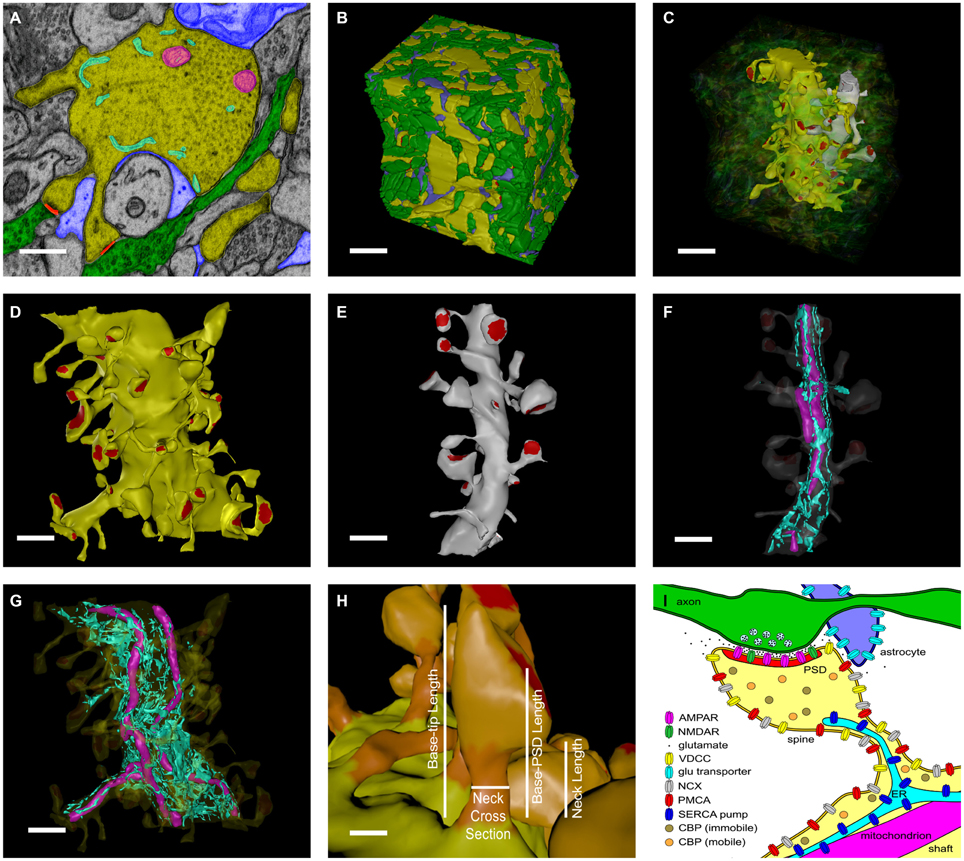
Figure 1. Reconstruction of hippocampal neuropil. (A) Hand segmentation of 2D-objects within a single EM thin section. The entire reconstruction consisted of 100 serial EM thin sections 50 nm thick. Each plasma membrane bound structure was traced in each thin section but only a few structures are highlighted here for illustrative purposes. A large apical dendrite is highlighted in yellow along with its enclosed endoplasmic reticulum (cyan) and mitochondria (magenta). Spines that are part of the principal dendrite, also shown in yellow, sometimes appear disjoint from the dendrite in a given thin section. Two axons that make synaptic contacts with two spines of the large apical dendrite in this plane of section are shown in green. PSDs and presynaptic active zones were annotated by enclosing them in a separate close-fitting contour (red). Processes of an astrocytic glial cell are shown in blue. Scale bar is 0.5 μm. (B) Reconstructed volume of neuropil. Dendrites are yellow. Axons are green. Astrocyte is blue. The extracellular space was adjusted so that the distance between components was 20 nm using an algorithm described in Kinney et al. (2013). Scale bar is 1 μm. (C) Two dendrites in the reconstructed volume were selected for simulations of glutamatergic synaptic transmission and postsynaptic calcium dynamics. A large apical dendrite is shown in yellow and a smaller branch dendrite is shown in light gray. The selected dendrites are shown in relation to one another embedded in the semitransparent neuropil. The synaptic contact areas (red) on the two selected dendrites were identified and labeled as shown in (D,E). Scale bar is 1 μm. (D,E) The PSD regions (red) of the large apical dendrite (D) and the smaller branch dendrite (E) were annotated. Scale bar is 1 μm. (F,G) Intracellular organelles of the small branch dendrite (F) and large apical dendrite (G), including the reconstructed endoplasmic reticulum (cyan) and mitochondria (magenta). Scale bar is 1 μm. (H) The spine head (light-orange), neck (dark-orange), and dendritic shaft (yellow) were also annotated. Geometric measurements used in the analysis are shown as annotations. The neck cross section area was measured at a point halfway along the length of the neck. Scale bar is 0.25 μm. (I) Summary of all neuropil elements included in the model. The PSD was used to lasso a region of the spine surface for NMDAR and AMPAR placement. Presynaptic vesicles are shown for illustration only and were not included in simulations; instead glutamate was released directly into the synaptic cleft (see Methods Section). Note that about 19% of spines in the reconstruction contained ER protruding from the dendritic shaft into the spine neck and head.
The locations of postsynaptic densities (PSDs) were defined by first tracing the contours of each PSD and active zone (AZ) on each original micrograph on which they appeared. The stack of such contours for a given PSD-AZ pair encloses the synaptic junction. The reconstructed contours include the intracellular extent of both the PSD and the AZ and intersect with the pre- and postsynaptic membrane associated with each. Therefore, we used the outer boundaries of the contours as a “3D-lasso” to tag surface mesh triangles representing the postsynaptic membrane and the location of the associated PSD (labeled in red for the large dendrite in Figure 1D).
MCell permits counting and tracking of molecules within a defined volume and also tracking of molecular fluxes across a defined surface. In the simulations reported here we tracked molecules of free Ca2+, Ca2+-bound to calcium binding proteins, and Ca2+ bound to indicator molecules in each spine head by creating “counting boxes” in which changing levels of each species were counted during the simulation. To count species in the spine head, a continuous form-fitting mesh was defined with its surface 5 nm from the outside surface of the spine head, and closed where the head connects with the neck. To count species in the entire spine, and to track the flux of Ca2+ through the base of the spine neck into the shaft, a second continuous form-fitting mesh was defined with its surface 10 nm from the outside surface of the spine (both head and neck), and closed at the place where the neck of the spine meets the dendritic shaft. Numbers of molecules within each counting box, and the flux between each spine and the shaft were measured at each time step of the simulations (1 μs), except for Ca2+, which was measured every 0.1 μs. All counts were recorded in an output file every 100 μs. Counts of molecules were sometimes converted to concentrations by converting to moles and dividing by the volume of the spine after subtracting the volume of any ER or mitochondria that intersected the sampling volume.
Stimuli
The simulations reported here were initiated by release of glutamate from a single site on the presynaptic membrane (see Keller et al., 2008). The release was accompanied by a simulated voltage change in the postsynaptic membrane represented by 1 μs step changes in voltage read from a file generated in the program NEURON. Stimuli were simulated by adapting a NEURON model of a layer 5 neocortical pyramidal cell (Mainen et al., 1995). The NEURON model was implemented in pyramidal neuron “j4,” and included INa, IK, IKM (K channel blocked by Ach acting through the muscarinic receptor), IKCa [Ca2+-dependent K channels (e.g., IBK, IK, ISK, and IAHP currents), passive K (resting K channel), ICaHVA (HVA-type Ca2+ channel), ICaLVA (LVA, or T-type Ca2+ channel) in spines only], PMCA pump mediating Ca2+ decay. Its geometry consists of the soma, 11 primary dendrites, and 87 branches, divided into 164 compartments. Details are available in the NEURON ModelDB (https://senselab.med.yale.edu/ModelDB/ShowModel.cshtml?model=2488).
Backpropagating action potentials (bAP) were simulated by injecting current into the axon hillock and recording the voltages experienced at a spine located on a dendritic branch ~100 μm from the soma, as described in Keller et al. (2008). The NEURON model did not contain glutamate receptors. The excitatory postsynaptic potential (EPSP) was simulated by injecting current into the spine head as an alpha function such that a 5.8 mV peak EPSP was produced (see Keller et al., 2008). The peak of the EPSP occurred about 0.3 ms after release and decayed in ~2 ms. The EPSP plus bAP was simulated by injecting current into a spine to create an EPSP and 10 ms later injecting current into the axon hillock to initiate an action potential. The time-varying voltages recorded at the spine during these three stimuli were used to drive voltage-dependent transition rates in the models of VDCCs and NMDARs. The voltage changes alter the kinetic constants for relief of the Mg2+ block of the NMDARs, determine the flux of Ca2+ through open NMDAR and VDCC channels, and alter the kinetic constants that drive gating of VDCCs. An NMDAR channel opens and fluxes Ca2+ in the simulation only when glutamate is bound to the receptor at the time that the Mg2+ block is relieved.
Proteins
Proteins were placed onto the membrane surfaces of the reconstructed dendrites or in the volume of the cytosol as shown in the cartoon in Figure 1I, and described in detail below. For each simulation initiated by a distinct random seed, proteins were placed randomly at a specified density or concentration, within each specified membrane or spatial compartment. Thus, the exact spatial locations of molecules and the sequences of stochastic binding events and enzymatic reactions vary randomly and depend on the seed used to initiate the simulation.
Sources of Ca2+ Influx
Glutamate receptors
AMPARs and NMDARs were placed into the postsynaptic membranes overlying the PSDs. The number of AMPARs is not a critical parameter in this study because the simulations are primarily concerned with Ca2+ influx through NMDARs and VDCCs. AMPARs are included in the simulation because AMPARs compete with NMDARs for binding of glutamate. Thus, the competition for binding of glutamate is modeled directly, allowing an accurate estimate of the activation of NMDARs. The density of AMPARs was set to 1200 μm−2 of PSD surface (120 receptors for a PSD of diameter 350 nm). In vivo, the number of AMPA receptors in spines is highly variable and is altered by synaptic plasticity (Nusser et al., 1998; Kharazia and Weinberg, 1999; Takumi et al., 1999; Racca et al., 2000). We have not included calcium-permeable AMPARs because they are relatively rare in excitatory synapses onto CA1 pyramidal neurons and are usually not a major source of Ca2+ flux. We used a kinetic model for activation of AMPARs by glutamate (Figure 2A; Table 1) based on an empirical model from Jonas et al. (1993) that describes recordings at 22–24°C from hippocampal slices of 15 to 24 day old rats. The model represents the behavior of AMPARs that contain a mixture of GluA1 and GluA2 subunits. We adjusted the parameters to 34°C using a Q10 of 2.0, because protein functions most commonly display a Q10 that is close to 2; thus, the adjustment is an approximation.
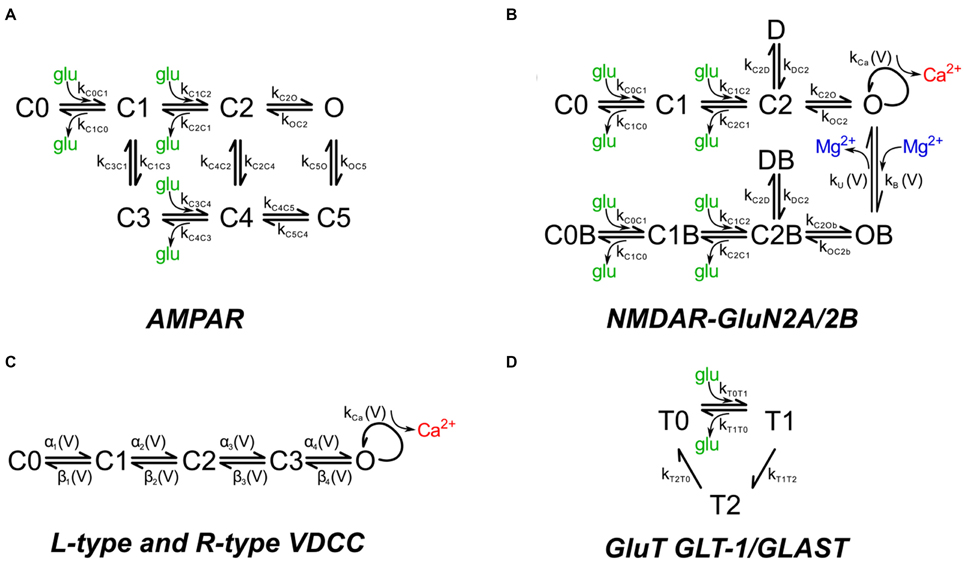
Figure 2. Chemical kinetic schemes of receptors, Ca2+ channels, and glutamate transporter. The kinetic rate constants for the reaction pathways are given in Table 1. (A) Glutamate-gated AMPAR with a mixture of GluA1 and GluA2 subunits and (B) glutamate-gated NMDA receptor with a mixture of GluN2A (NR2A) and GluN2B (NR2B) subunits were distributed on the dendritic spine head plasma membrane associated with the PSD. Mg2+ block was modeled by the asymmetric trapping block model of Vargas-Caballero and Robinson (2004). (C) Voltage-dependent Ca2+ channels on the spine head and neck are the sole source of calcium during backpropagating action potentials. (D) Glutamate transporter representing a combination of GLT-1 and GLAST transporter subtypes were distributed on the astrocytic glial processes.
NMDARs were placed in the membranes overlying PSDs at a density of 150 μm−2 (15 receptors for a PSD of diameter 350 nm). This number is consistent with estimates of receptor numbers per PSD in the literature (e.g., 5–30 NMDARs per PSD, Spruston et al., 1995). We used the asymmetric trapping block kinetic model for activation of NMDARs, which includes distinct activation and deactivation rates for Mg2+ free and Mg2+ bound channels (Vargas-Caballero and Robinson, 2004; Figure 2B; Table 1). Their measurements were made at a temperature of 24–25°C; as we did for the AMPA receptors, we multiplied the rates for the NMDA receptors by a factor of 2 to adjust them to 34°C. The peak opening of NMDAR channels (whether blocked or unblocked) occurs at an average of 20 ms after glutamate release. The extra synaptic NMDARs on which this kinetic scheme is based contain GluN1 and a mixture of GluN2A and GluN2B subunits and are believed to have a higher proportion of GluN2B subunits than synaptic receptors (Stocca and Vicini, 1998).
We simulated the behavior of the NMDAR channel during a bAP, or during an EPSP followed by a bAP, by adapting a previously published model of the electrical behavior of a layer 5 neocortical pyramidal cell made in the program NEURON (Mainen et al., 1995), as described in detail in Keller et al. (2008), and above under Stimulus. Briefly, we used NEURON to generate a time series of dendritic membrane voltages for dendrites at the appropriate apical location, and a current–voltage (I–V) curve indicating the Ca2+ current through the open channel at each voltage. For the calculation, Ca2+ conductance was set at 4.5 pS (10% of 45 pS) and ENMDA was set to 3 mV (Jahr and Stevens, 1993). The voltages were read by MCell and used to calculate probabilities of blocking and unblocking by Mg2+ from the equations for kB and kU in Table 1. When a receptor adopted an opened, unblocked state, the Ca2+ current through the pore was read from the I-V curve, and converted into the rate of Ca2+ flux per second according to the simple electrical equation,
with flux, J, in ions/s, current, I, in amperes, and F as Faraday's constant. For example, if a Ca2+ current of 1 pA flows through a receptor, MCell would use a flux rate of 3.12 × 10⁶ s−1 to generate Ca2+ ions at the cytosolic mouth of the pore. To simulate the flux of individual ions through an ionotropic receptor, MCell randomly samples the Poisson distribution of time of the next flux event calculated from the flux rate constant. Thus, ions move one at a time through the open pore and the time between flux events has a Poisson distribution, generating the correct stochastic noise.
Voltage-Dependent Calcium Channels (VDCCs)
Rapid, transient increases in dendritic Ca2+ occur when VDCCs in the membranes of spines and shafts are activated by excitatory postsynaptic potentials (EPSPs) or by bAPs. For the stimuli used in the simulations reported here, they are the largest source of Ca2+ influx. The precise complement of VDCCs in spines and shafts of pyramidal neurons is uncertain for two reasons. First, subtypes of VDCCs are sometimes difficult to separate pharmacologically. For example, CaV1.3 channels (one of two L-type channels) are difficult to distinguish from CaV2.3 channels (R-type) because both are resistant to inhibition by dihydropyridines (Higley and Sabatini, 2008). Second, neurons in different parts of the brain, such as the hippocampus and cortex, have distinct complements of Ca2+ channels in their dendrites (e.g., Markram et al., 1995; Koester and Sakmann, 2000; Bloodgood and Sabatini, 2007; Higley and Sabatini, 2008). Nonetheless, it is generally agreed that spines on pyramidal neurons in area CA1 of the hippocampus contain primarily R-type VDCCs with a small contribution from T-type channels; while the shafts of these same dendrites contain L, R, and T-type channels (Bloodgood and Sabatini, 2007).
The voltage sensitivity and activation kinetics of L and R-type channels are similar. However, R-type channels undergo slow inactivation during a depolarization of several 100 ms; whereas L-type channels do not (Magee and Johnston, 1995a). In this study, the activating stimuli were a single EPSP, and/or a single bAP. Therefore, we assumed that inactivation of the R-type VDCCs was not significant in the simulations reported here. This assumption permitted us to use a single kinetic scheme to represent both L- and R-type channels (Figure 2C). We adopted a five state kinetic scheme from Bischofberger et al. (2002; Figure 2C; Table 1). The scheme generated correct voltage sensitivity and activation curves at 23°C for L or R-type channels activated by single stimuli. We adjusted the parameters to 34°C using a Q10 of 2.0. A single channel conductance of 2.5 pS was reported by Church and Stanley (1996) based on measurements at 25°C of single channel conductances of VDCCs in chick ciliary ganglia at physiological Ca2+ concentration. As they suggested, we adjusted the conductance to 3.72 pS for 34°C using a Q10 of 1.55.
The probabilities of changes in state of individual channels and the Ca2+ ion influx through the open state was simulated by MCell in a manner similar to that described above for NMDA receptors. The time series of dendritic membrane voltages generated in NEURON was read by MCell and used to calculate αi and βi according to the equations in Table 1. The rate of Ca2+ flux through open channels at each membrane voltage (kCa) was calculated from Equation (2) (Bischofberger et al., 2002).
The rate constant kCa(Vm) has the units s−1.
VDCCs have been estimated to have a density of ~2 μm−2 in apical dendrites when measured in membrane patches (Magee and Johnston, 1995a). We arrived at a calibrated density for VDCC's on spines of 1.20 μm−2 and on shafts of 2.67 μm−2, as described under Results Section.
T-type channels are also present in spines; however, they are largely inactivated at the resting potential that we used in our model, and that was used in the experiments of Sabatini et al. (2002; −65 to −70 mV; Fraser and MacVicar, 1991). Thus, they would contribute only a small proportion of Ca2+ influx after a single bAP stimulus (Magee and Johnston, 1995b). Therefore, they are not included in this model.
Glutamate transporters
After its release, the excitatory transmitter glutamate is removed from the extracellular space by glutamate transporters in the astrocyte membrane. We placed transporters in the astrocytes at a density of 10,000 μm−2 in agreement with the measurements of Lehre and Danbolt (1998). Crystal structures of related transporters suggest that its diameter is ~5 to 8 nm, indicating a range of maximum packing densities of 16,000–40,000 μm−2 (Yernool et al., 2004; Penmatsa et al., 2013). Thus, the glutamate transporter occupies a large fraction of the surface of astrocytes.
We used a simplified kinetic scheme (Figure 2D), implemented by Geiger et al. (1999), that reproduces the major binding, unbinding, and translocation characteristics of glutamate transport in cerebellar Purkinje cells, which is primarily attributed to EAAT4 transporters (Otis and Jahr, 1998). In hippocampal astrocytes, glutamate transport is mediated predominantly by EAAT1 (GLT-1) with a lesser contribution by EAAT2 (GLAST; Danbolt, 2001); but see Hu et al. (2003) on EAAT4 expression. Full kinetic models, with rate constants, for EAAT1, including Na+, K+, H+, and voltage dependence (Bergles et al., 2002), and for EAAT2 (Wadiche and Kavanaugh, 1998) have been published. However, the reduced model accurately reflects the slow turnover rate and the binding affinity for glutamate in the μM range of EAAT1 and EAAT2 (Arriza et al., 1994; Wadiche et al., 1995; Bergles et al., 2002). Thus, we believe it is sufficient for the present study in which we release single quanta of glutamate at individual synapses.
This model is primarily concerned with understanding the major proteins contributing to Ca2+ flux in the postsynaptic spine, therefore, we didn't include glutamate transporters on presynaptic axonal processes, although they have been shown to be present there in neuronal cultures and in perfusion fixed brain tissue (Wang et al., 1998; Chen et al., 2004). We also didn't include them on the postsynaptic membrane, although some studies have suggested they can modulate NMDA receptor activation (Diamond, 2001). In our reconstructed neuropil, not all spines are immediately adjacent to an astroglial process, therefore, the time-course of persistence of glutamate in the synaptic cleft is likely to be highly variable from spine to spine in the simulations (Ventura and Harris, 1999; Witcher et al., 2007). Glutamate transporters in the synaptic membrane would reduce this variability, but are not likely to have a large effect on the overall activation of NMDA receptors.
Cytosolic Ca2+ Binding Proteins
Immobile cytosolic Ca2+-binding Proteins
Ca2+ ion is buffered in the cytosol by binding to mobile and immobile “buffers.” The immobile buffers are considered to be immobile proteins with a mixture of low and high affinities for calcium (Neher and Augustine, 1992). To simulate these proteins we have used a single immobile buffer at a concentration of 78.7 μM with a KD of 2.0 μM (Figure 3A). These values were chosen by calibrating the model so that it reproduces measurements of calcium fluxes after bAPs as described under Results Section. The concentration of immobile Ca2+ buffers in neurons have been estimated in the range of tens to a few 100 μM (Neher and Augustine, 1992; Maravall et al., 2000)
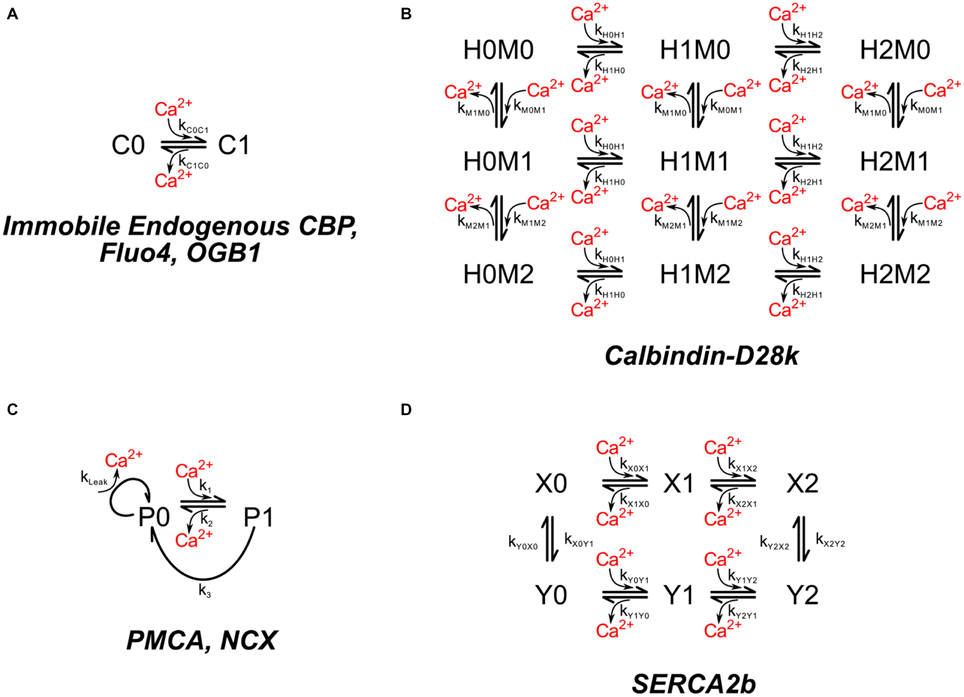
Figure 3. Chemical kinetic schemes of endogenous Ca2+ buffer, calbindin-D28k, Ca2+ pumps, and Na+–Ca2+ exchanger. (A) The interaction of Ca2+ with immobile endogenous CBPs was modeled as a simple first-order reversible reaction. Molecules of immobile endogenous CBPs were distributed throughout the volume of the dendritic and spine cytoplasm. (B) The mobile high affinity calcium buffer calbindin-D28k was included in the dendritic and spine cytoplasm. (C) Ca2+ pumps PMCA, and NCX were modeled with identical kinetic schemes but different rate constants. PMCA and NCX pumps were placed on the spines and dendritic shafts. (D) The SERCA pump was placed on ER membrane.
Calbindin
Calbindin is a major calcium buffering protein present in spines of hippocampal neurons. Its concentration in spines is debated. For simulations in which calbindin is included, we used 45 μM, the value reported for pyramidal neurons in area CA1 by Müller et al. (2005). We used the kinetic model for binding of Ca2+ to two high affinity sites and two medium affinity sites on calbindin published by Nagerl et al. (2000; Figure 3B; Table 1).
Fluorescent Ca2+ indicators
We calibrated parameters of the model by fitting the characteristic of simulated Ca2+ transients to measurements from Ca2+ transients in individual spines carried out with the use of the fluorescent Ca2+ indicators, Fluo-4 and Oregon Green 488-BAPTA (OGB-1; Sabatini et al., 2002). For the calibration process, a model of the appropriate fluorescent indicator was added to the dendritic cytosol as described under Results Section. The kinetic model for binding of Ca2+ by these indicators is shown in Figure 3A, and parameters are listed in Table 1. The diffusion constants were calculated from the Stokes/Einstein equation . We set ν equal to the viscosity of water (0.001 ) to approximate the cytosol. To calculate r (the hydrodynamic radius of the diffusing particle), we first calculated the volume (V) from the molecular masses of Fluo4 and OGB1 (1100 and 1200 g/mol, respectively) and their densities (~1.4 g/cc). Both values were obtained from LifeTechnologies.com. We then assumed that .
Removal of Ca2+ from the Cytosol
Experiments with fluorescent Ca2+ indicators and pharmacological agents indicate that Ca2+ is removed from the spine cytosol by the combined action of three transmembrane proteins, Na+/Ca2+ exchangers (NCX's), smooth endoplasmic reticulum Ca2+ ATPases (SERCA's), and plasma membrane Ca2+ ATPases (PMCA's).
NCX's
The NCX's have a relatively low affinity for Ca2+ (KD ~ 3 μM), but a large exchange capacity with turnover numbers sometimes as high as several thousand per second (Hilgemann et al., 1991; Carafoli et al., 2001). During calibration, the density of NCX's was set to 142 μm−2 on spines and 488 μm−2 on the shaft plasma membrane. These numbers are consistent with the finding of Lörincz et al. (2007) that shafts have a considerably higher density of NCXs than do spines. The kinetics of NCX were modeled by a Michaelis–Menten-like scheme (Figure 3C; Table 1). The turnover rate (k3) at which a pump with Ca2+ bound extrudes Ca2+ from the cell, was setat 600 s−1. The concentration of Ca2+ at which the pump operates at half maximum velocity (KM) was set at 3 μM (Blaustein and Lederer, 1999).
PMCA's
PMCA's, in contrast to NCX's, have a high affinity for Ca2+ (KD < 0.5 μM) and use the energy of ATP hydrolysis to reduce the Ca2+ concentration to its resting level with a turnover rate of ~12 s−1 measured in vitro (Penheiter et al., 2003; Caride et al., 2007). We used the same kinetic scheme to model PMCA kinetics as for NCXs, but with parameters of 12 s−1 for turnover rate and 0.18 μM for KM (Figure 3C; Table 1). The best fit to experimental measurements during the calibration (see Results and Discussion Sections), was obtained with a density of 998 μm−2 for PMCAs on the spine membrane and 488 μm−2 on the shaft plasma membrane.
SERCA's
About 19% of the spines in our sample contain SER. However, the ratio of spine SER membrane to spine plasma membrane is small, even in those spines. Nonetheless, we included SERCA pumps in the SER. The hippocampus expresses high levels of the SERCA2b isoform (Baba-Aissa et al., 1996), and only low levels of SERCA3 (Wuytack et al., 1995). We made the simplifying assumption that all of the SERCA pumps in CA1 pyramidal neurons are SERCA2B. SERCA pumps were placed on the SER membrane at a density of 1000 μm−2 (about half the density measured in RBL-2H3 mast cells by Means et al. (2006). The behavior of SERCA pumps is not fit well by the simple scheme that describes PMCA pumps (Figure 3C). Therefore, we modeled SERCA2b pumps according to a modification of the kinetic scheme from Higgins et al. (2006; Figure 3D; Table 1) for the SERCA pump at 37°C. We added individual Ca2+ binding events to the four state model in Higgins et al. (2006) to make a six state model, choosing a kon of 1 × 10⁸ M−1 s−1 for binding of each Ca2+ to states X0 and X1 to satisfy the requirement for fast transition rates between X0, X1, and X2. We calculated the koff values to maintain the KD's specified in Higgins et al. (2006). The kon rates for binding of Ca2+ to Y0 and Y1 were set to 1 × 10⁵ M−1 s−1 and the koff rates were calculated according to the specified KD's. These values allowed us to satisfy the Gibbs free energy constraints for binding and ATP hydrolysis as discussed in Higgins et al. (2006). We assumed a constant Ca2+ concentration of 60 μM in the ER lumen.
Boundary Conditions
Accurate modeling of a biochemical reaction–diffusion system requires appropriate treatment of the boundary conditions. We used a Neumann boundary condition; that is, we made the truncated ends of the two simulated dendritic segments reflective to Ca2+. This configuration causes Ca2+ flux to behave as if each dendritic segment were connected to a much greater length of dendrite, all seeing the same stimulus. Thus, when a back propagating action potential (bAP) activates VDCCs in a 5 μm length of dendrite, we assume that the electrical length constant of the dendrite would cause the bAP to activate VDCCs in the neighboring length of dendrite equally, causing Ca2+ ions to flow into and out of the segments at an equal rate.
The basal steady-state Ca2+ concentration was maintained at 100 nM by adjusting the leak rates of the PMCA's and NCX's (Figure 3C; Table 1). In addition to translocating Ca2+ out of the cell, PMCA's and NCX's allow a small leak of Ca2+ back into the cell. A leaky pump model is consistent with thermodynamic principles of reversibility and has significant advantages for calibration. If the rate of leaking and pumping is properly balanced in the rate constants of the kinetic scheme, then the resting [Ca2+] will be independent of pump density, and the proper resting [Ca2+] will be maintained with any number of pump molecules. The leaky pump model prevents the accidental introduction of standing gradients of Ca2+ or steady-state fluxes of Ca2+ along the length of the resting dendrite or between the spines and dendritic shaft. In contrast, standing gradients and fluxes would be virtually impossible to eliminate if the pumps and leaks were implemented as separate proteins. We used Michaelis–Menten equations to calculate the leak rate as follows. We assumed that the pump has an average basal extrusion rate (rex) at 100 nM Ca2+ that is related to the fraction of pumps with bound Ca2+ (fb) at that concentration: . The fraction of pumps with bound Ca2+, both at rest and after a stimulus, depends on the Ca2+ concentration. The quasi-steady-state assumption (Briggs and Haldane, 1925) yields the relations:
and
where is the number of pumps with Ca2+ bound.
therefore, substituting for KM and multiplying by k1 gives the relation:
which relates fb to [Ca2+].
Thus, we calculated fb and rex at resting [Ca2+] = 100 nM from the rate constants for PMCA's and NCX's in Table 1. We then set their leak rates equal to the calculated basal rex to produce a resting steady-state [Ca2+] of 100 nM. We set the Ca2+ leak rate for PMCA's at 4.3 s−1 and for NCX's at 19.4 s−1 (Table 1). These rates produced a steady-state basal [Ca2+] of 100 nM in simulations in which no stimulus was applied.
Modeling of Fluorescence Experiments
To simulate experimental results obtained with Ca2+ sensitive fluorescent dyes, we added 20 μM Fluo4, 50 μM Oregon Green Bapta 1 (OGB1), or 100 μM OGB1 to dendrites, as appropriate (Figure 3A; Table 1); and then simulated interaction of Ca2+ with the indicator with a time step of 0.1 μs during a simulated bAP stimulus, using MCell's adaptive time stepping. We directly recorded the amount of Ca2+ bound to indicator, the amount of unbound indicator, and the amount of free Ca2+ in the spines and shafts every 100 μs. Thus, we did not need to simulate the resulting fluorescence to obtain information about Ca2+ transients. To directly compare our simulation results to the experimental results of Sabatini et al. (2002), which they calculated using the method of Maravall et al. (2000), we estimated the Ca2+ transient by assuming that Ca2+ reaches rapid equilibrium with the fluorescent dye. At equilibrium,
where KD is the dissociation constant of Ca2+ from the dye, [B] is the concentration of dye bound to Ca2+, and [U] is the concentration of unbound dye.
Therefore, the estimated Ca2+ transient at each time step, , will be:
where is the steady state resting concentration of Ca2+ with no stimulus (i.e., 100 nM). To accurately simulate the data of Sabatini et al. (2002), we lowpass filtered the simulated transients () in the spine head and adjacent shaft (captured with a resolution of 1 μs) with a 250 Hz four-pole Bessel lowpass filter and sampled at 500 Hz to correspond with the experimental measurements.
Statistics
One hundred individual simulations, each with a new random seed, were carried out with each set of parameters. Ca2+ transients were recorded in the large spines (≥0.05 fl in volume) on the smaller diameter dendrite (seven spines) for calibration and in all spines on the larger diameter dendrite for later tests. The individual simulations were averaged for each spine, and then the means from each spine were averaged and the standard error of the mean was determined. This procedure closely recapitulates the statistical analysis of the experimental data (see Section Results). The random placement of membrane molecules for each simulation with a new random seed introduces more variability into simulations in each spine than would be observed in repeated scans of the same spine in an experiment, because it introduces stochastic variation of channel numbers within each individual simulated spine. Thus, the simulations mimic sampling of 100 spines with the same shape and size, but slightly different numbers and arrangements of proteins.
Results
Morphological Analysis
To compare the range of shapes and sizes of spines in the reconstructed neuropil to those reported previously in fixed hippocampal tissue, we measured several morphological parameters of the 72 spines (Figure 4A) on the larger reconstructed dendrite (Figures 4B–K). Spine head volumes ranged from 0.004 to 0.2 fl; base-to-tip lengths of spines from 0.48 to 1.45 μm; diameters of spine necks from 0.04 to 0.5 μm; and spine neck lengths from 0.08 to 1.1 μm. The average volume of spine heads was 0.03 μm3 (0.03 fl) and the average base-tip length of spines was 0.85 μm. These measurements are consistent with those of Harris and Stevens (1989) and as reviewed in Sorra and Harris (2000). The measurements were made after the extracellular volume fraction of the reconstruction was expanded from 8 to 20% to account for shrinkage artifacts during fixation (Kinney, 2009; Kinney et al., 2013). Thus, the good agreement with previous measurements shows that no significant distortions of the geometry were introduced by our correction methods.
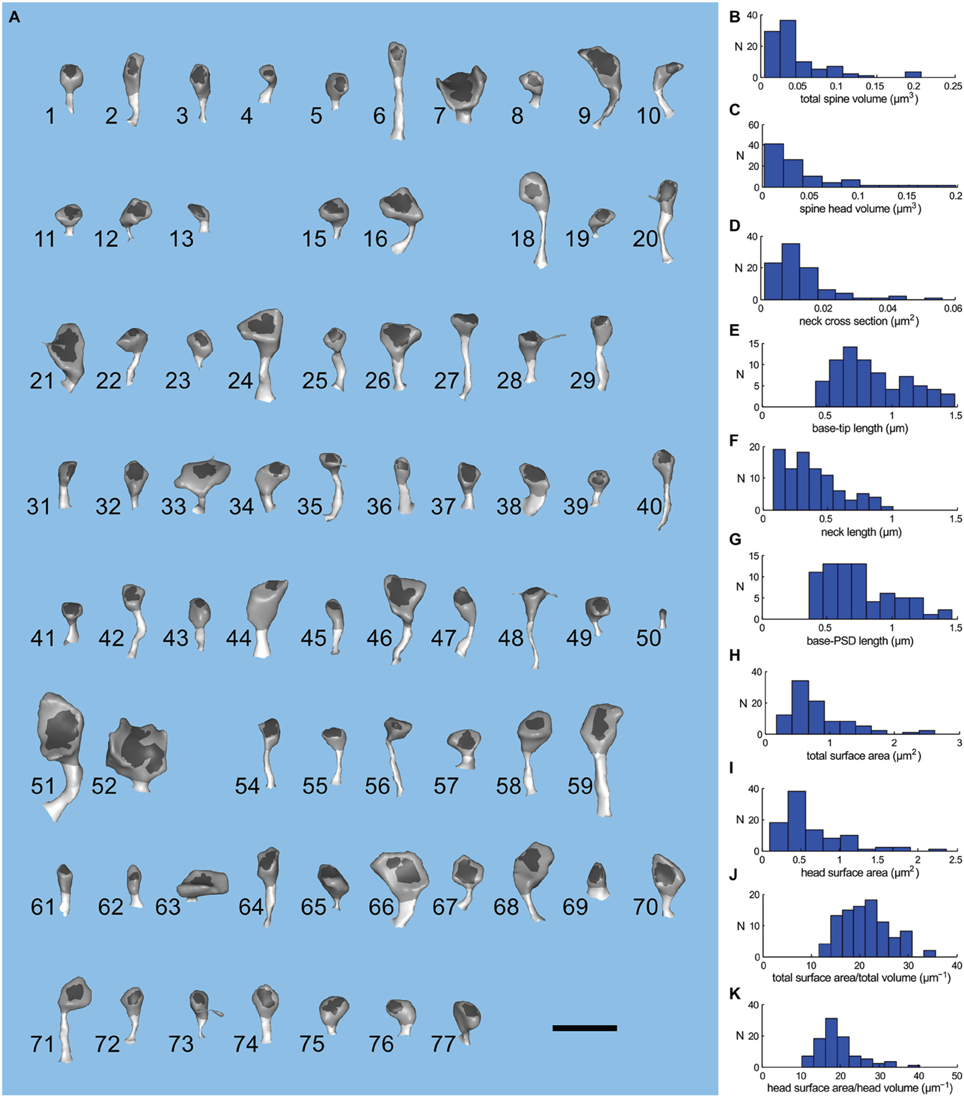
Figure 4. Geometry of spines of the large apical dendrite. (A) Visual index of the spines of the large apical dendrite. Spines have been oriented to view both head and neck. The PSD region is dark gray; spine head, medium gray; and spine neck, light gray. The spines are numbered 1–77 and have not been sorted. Five spines (numbers 14, 17, 30, 53, and 60) were omitted from the simulations because they were clipped by the boundary of the reconstructed volume. Thus, the apical dendritic segment contains 72 intact spines. The scale bar is 1 μm. (B–K) Distribution of geometric parameters of the spines. (B) Total spine volume. (C) Spine head volume. The average spine head volume in the sample was 0.03 μm3. (D) Spine neck cross sectional area. (E) Base-tip length. The average spine length from the base of the spine to the apex of the head was 0.85 μm. (F) Spine neck length. (G) Base to PSD length. (H) Total surface area. (I) Head surface area. (J) Ratio of total spine surface area to total spine volume. (K) Ratio of head surface area to head volume.
Calibration and Parameter Sensitivities
Although most of the kinetic parameters listed in Table 1 are reasonably well-constrained by values in the literature; the concentrations of some of the proteins within neurons are not known as precisely as others because they have been estimated based upon relatively low resolution data. Thus, to bring the Ca2+ transients predicted by the model into agreement with experiments of Sabatini et al. (2002), we adjusted nine parameters within reasonable previously measured physiological ranges, seven concentration parameters and the kon and koff of the endogenous buffer. The concentration parameters that we adjusted were: the densities of the PMCA, NCX, and VDCCs on spine and on shaft membranes; and the concentration of the immobile endogenous CBPs, which represent the sum of endogenous Ca2+-binding proteins (Table 2). In adjusting the concentrations of the PMCA and NCX pumps, we used an additional experimental constraint from Scheuss et al. (2006), who reported that PMCAs and NCXs each remove approximately the same amount of Ca2+ in response to a bAP. Thus, we adjusted the ratio of PMCA to NCX pumps such that they would extrude equal amounts of Ca2+ in spines of the size measured by Sabatini et al. (2002). This constraint reduced the number of free parameters to seven. The range over which each parameter was tested by manual trial and error to obtain initial preliminary best fit values is indicated in Table 2. The data upon which the ranges are based is discussed for each protein in the Methods Section under Proteins.
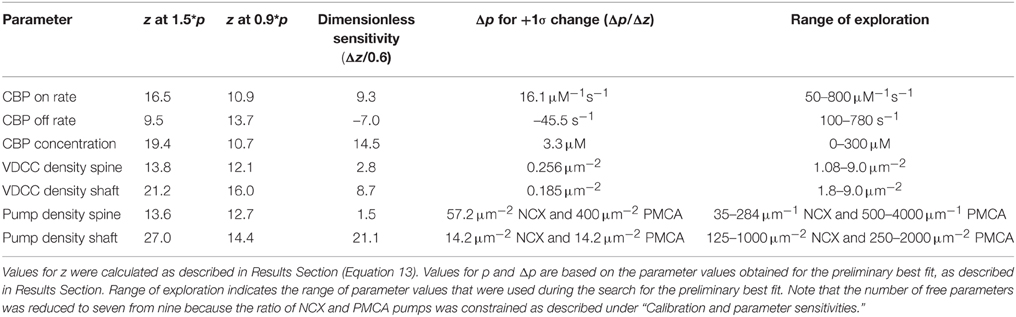
Table 2. Parameter sensitivity in four dimensional measurement space.
In their experiments, Sabatini et al. (2002) placed whole-cell clamps on the somas of CA1 pyramidal neurons and perfused them with three different fluorescent Ca2+ indicators at different concentrations to generate data from spines with a gradient of Ca2+ buffering capacities when buffering by the dyes is included. During the perfusion, as indicator diffused throughout the neuron, we assume that calbindin was washed out of spines because its size and diffusion constant are similar to those of the fluorescent indicators. Sabatini et al. then used a two-photon laser-scanning microscope, scanning at 500 Hz, to record the fluorescent transients in spines and the adjacent dendritic shafts in response to a bAP stimulus triggered by injecting current through the patch pipette. They state that Ca2+ transients were measured on small apical dendrites less than 2 μm in diameter and on spines in which the fluorescent signal could be reliably detected. Their data was gathered from 7 to 14 spines at four concentrations of indicator with six scans of each spine during which a single bAP was delivered. The fluorescent transients were converted into an estimate of the size of the Ca2+ transient, Δ[Ca2+]estim, using a previously published method (Maravall et al., 2000). Transients calculated from the six scans were then averaged for each spine, and then the means from each spine were averaged and the standard error of that mean was calculated. They determined the resting Ca2+ concentration in spines and shafts, the change in Ca2+ in response to a backpropagating action potential, and the decay time constant of the Ca2+ transient (τ), at each concentration of Ca2+ indicator. The endogenous buffering capacity, κe, of spines and shafts was then calculated by the method of Neher and Augustine (1992) in which the relationship of the size of the Ca2+ transient to the buffering capacity of the Ca2+ indicators is extrapolated to zero indicator concentration (see Figure 5).
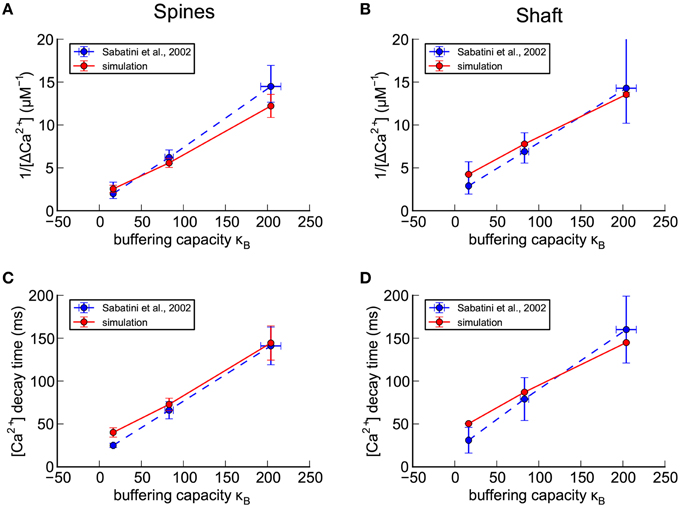
Figure 5. Calibration of nine parameters in spines and shafts of the small branch spine. (A–D) Confirmation of calibration of the shape of a Ca2+ transient in response to a bAP in the absence of calbindin (see Methods Section). For comparison with experimental results of Sabatini et al. (2002; shown as blue dashed lines), concentrations of exogenous fluorescent calcium indicators in the model were set to 20 μM Fluo4, 50 μM OGB1, or 100 μM OGB1. The simulated results for the best calibrated parameters, averaged for seven spines with volumes ≥ 0.05 fl, are shown as red lines. (A) For each concentration of indicator, the reciprocal of the averaged peaks of the calcium transients in the spines, 1/Δ[Ca2+], is plotted against the buffering capacity in the presence of indicator (κB) calculated as in Sabatini et al. (2002). The Δ[Ca2+], extrapolated to zero indicator, was in the range 0.5 to 1.0 μM (reciprocal of y-axis intercept) with κe in the range 16–50 (x-axis intercept). (B) The reciprocal of the averaged peaks of the calcium transients in the dendritic shaft is plotted against buffering capacity. The Δ[Ca2+], extrapolated to zero indicator, was 0.3 μM with κe = 62. (C) The averaged time constant of calcium decay in the spines is plotted against calcium buffering capacity. The calcium decay time constant, extrapolated to zero indicator in the spines was in the range 20–40 ms (y-axis intercept) with κe in the range 30–80 (x-axis intercept). (D) The averaged time constant of calcium decay in the dendritic shafts was plotted against buffering capacity. The calcium decay time constant, extrapolated to zero indicator in the dendritic shafts was 42 ms with κe = 75.
To simulate the Sabatini et al. (2002) experiments, we set the calbindin concentration in our model to zero, and added different Ca2+-sensing dyes to the model as described under Methods Section. We recorded the amount of Ca2+ bound to each indicator over time during a simulated bAP stimulus. For calibration, we used simulation data collected from spines on the smaller dendrite (shaft diameter 0.8 μm, Figure 1E) because its dimensions are closest to those in which Sabatini et al. (2002) made their measurements. In addition, we used only spines with volumes of 0.05 fl or larger (seven spines) because we reasoned that only the larger spines would have provided readily detectable and reliable fluorescence signals in an experimental setting.
We set four target values from the Sabatini et al. data, for each of the three different Ca2+ indicator concentrations: 1/peak Δ[Ca2+] and decay time (τ) for transients in the spine head, and the same two values for transients in the shaft (Figure 5). We then determined these four values from each of our simulations, as described in Methods Section, for each indicator concentration and parameter set.
To obtain preliminary values for the seven parameters that best fit the target values, we made manual systematic iterative adjustments of the densities of PMCAs, NCXs, and VDCCs, in the membranes, varying their values within the boundaries of estimates of their concentrations in the literature (see Methods Section and Table 2). We estimated the ratio of PMCA and NCX pumps that would remove equal amounts of Ca2+ from the spine head, as found in Sabatini et al. (2002), by calculating the mean concentration of Ca2+ during a typical transient and then using the KM's and turnover numbers of the two pumps to calculate the ratio of the pumps that would be required for each to remove an equal amount of Ca2+ at that concentration. The pumps were then kept at that ratio in both spine and shaft membranes, and the numbers of the pumps in spines and shafts were adjusted to keep this ratio constant during the trials to find preliminary best fit parameters. In other words, the densities of the two pumps in the spine head and in the shaft were each treated as one parameter, reducing the number of free parameters from nine to seven (Table 2). Before proceeding to the refinement stage described below, the ratio of their densities was readjusted slightly so that each of the pumps removed equal amounts of Ca2+ from both the shafts and the large spine heads. The concentration and Ca2+-binding rates of the immobile endogenous CBP in the cytoplasm were also adjusted until a reasonably good fit was obtained to the experimental plots of total buffer capacity, κB, against the amplitudes and decay times of the Ca2+ transients, in the presence of three different concentrations of fluorescent sensors (Figure 5).
We next refined the local fit and determined approximate parameter sensitivities using a form of Principal Component Analysis as follows. First, we constructed three 4 × 4 covariance matrices (Σ, Equation 9) for the three sets of four output values determined from the simulation data we collected from the seven spines. The calculations are summarized in Equations (10–12), where n is the number of spines observed (n = 7), xi and yi are the ith observation of output values x or y, respectively. Likewise, μx and μy are the mean output value for x or y, across n = seven spines.
where
and
We then averaged the three matrices together, element by element, to create an average covariance matrix. For this calculation, it would be ideal to use the experimental covariances. However, because we don't have access to the raw experimental data, we instead computed the average of the three covariance matrices from the simulation results. To the extent that we have chosen the correct arrangement of proteins for the simulations, this matrix should be similar to an experimental covariance matrix. The averaging reduces the dimensionality of the aggregate “output value space” from 12D (3 × 4D), which would be underdetermined by our seven variable parameters, to 4D, which is, instead, overdetermined by the seven variable parameters. This method is adequate for estimating parameter sensitivies and checking the goodness of fit, given the boundaries on the variable parameters, and the inherent noisiness of the original experimental measurements of Ca2+ transients by fluorescence methods.
We know from computational statistics and Principle Component Analysis that the four eigenvalues of this covariance matrix are the interdependent variances of each of the four output measurements in the direction of the eigenvectors (axes of the principle components). Thus, the square root of the eigenvalues equals 1 standard deviation (i.e., 1 sigma) in the direction of its associated eigenvector. We used the eigenvalues and eigenvectors to refine the fit and determine the parameter sensitivities by the following method. We ran 14 simulations in which each of the seven parameters was varied independently either increasing it to 1.5 times its preliminary best fit value, or decreasing it to 0.9 times its preliminary best fit value (14 groups of parameters). These increments were chosen so that the resulting change in the output value was large enough not to be occluded by the Monte–Carlo trial-to-trial variability, but small enough to ensure rough linearity between the change in output value and the change in the parameter value. These simulations were run for each of the three indicator concentrations. For each set of parameters, the four output values were calculated for each of the seven spines, averaging 100 simulation runs. Then the mean output values were averaged over the seven spines to obtain three sets of four averaged output values for each set of parameters at the three indicator concentrations. The three sets of four values were then averaged to obtain a single set of four values for each of the 14 sets of parameters. The target (experimental) values were represented as a point in four-space and each group of output values for the 14 sets of parameters was also represented as a point in four-space. The radial distances from the point in four-space representing the target (experimental) values to the point in four-space for each set of parameters was then calculated, and normalized by the square root of the corresponding eigenvalue (i.e., the standard deviation of the corresponding principal component) (Note that, after normalizing the radial distance we obtain, z, the Z-score in four dimensions). To do this calculation, the origins of the four eigenvectors with lengths scaled to 1 sigma, as derived from the corresponding eigenvalues, were placed at the four-dimensional point representing the four target experimental values. Then the distances (z) between the four experimental target values and the corresponding output values for the 14 sets of parameters was calculated by projecting the 14 four-dimensional points onto the four scaled eigenvectors. The ratio of the length of each projection to the length of the eigenvectors is a measure that represents the number of standard deviations, or Z-score, of one of the simulated values from the target value (i.e., 1/Δ[Ca2+] in the spine head or shaft, or decay time (τ) in the spine head or shaft). This operation projects, or transforms, the four original values into a new four-dimensional measurement space where the four transformed values are the coordinates of a point, m, whose distance, z (normalized by the standard deviation in each dimension) from the point representing the target value is given by the equation:
where the subscript, i, is the ith dimension of point m, the superscript s indicates the transformed simulated value, and superscript t indicates the transformed target experimental value. The change in z, Δz, over the fractional change in parameter value p, , is = for each parameter, where Δp = 1.5p − 0.9p or 0.6 × the preliminary best fit value. In the language of Principal Component Analysis, this calculation means that the difference vector between simulated and target measurements was projected onto the four principal components, and the resulting difference vector components were normalized by the standard deviations of these principal components.
We expressed the parameter sensitivity in Table 2 in two different ways. The first measure, , is a dimensionless measure that reflects the change in goodness of fit to the experimental target that results from changing p from 0.9*p to 1.5*p. The second measure, is a measure that indicates the change in p necessary to produce a change of +1σ in the goodness of fit to the experimental target. The values of in Table 2 indicate that VDCC density and pump density in the spine (2.8 and 1.5, respectively) are the least sensitive parameters and that the CBP concentration and pump density in the shaft (14.5 and 21.1, respectively) are the most sensitive parameters affecting the goodness of fit. It is important to note that z measures the goodness of fit in all four dimensions simultaneously. Furthermore, the goodness of fit is weighted equally by the variance of the simulation data in each of the four dimensions. This means that the simulation measurements that have smaller variances will affect the fit more sensitively than those with larger variances. It is evident in Figures 5B,D, that the variances of simulation measurements in the shaft are smaller than those in the spine. For this reason, the fit is more sensitive to parameters in the shaft than the corresponding parameters in the spine.
The column headed “Range of exploration” in Table 2 shows the range of values explored for each parameter during the manual search for the preliminary best fit. These ranges are consistent with the range of experimental measurements, as discussed in Methods Section. Though we cannot guarantee with certainty that other combinations of parameters will not fit as well as the values shown in Table 3, we found no such combinations within the indicated ranges of values.
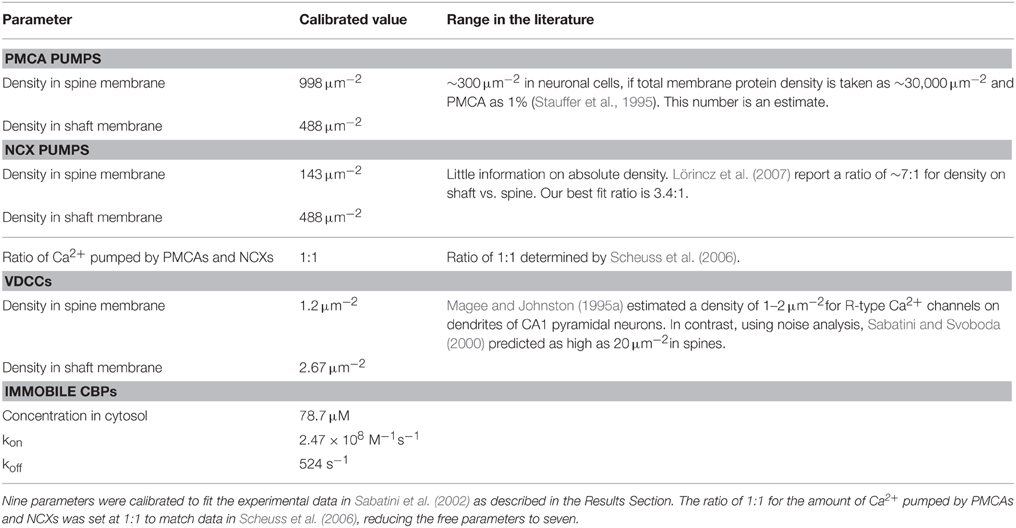
Table 3. Calibrated parameters.
To further improve the fit, we re-adjusted each parameter in the initial best-fit parameter set by an appropriate amount to decrease the final distance z, based on its . We assumed linearity of Δzover the change in parameter values (Δp = 0.6p) and extrapolated to minimum z. The output values calculated from the simulations showed a small improvement in fit and are plotted in Figures 5A–D. Additional adjustments of the parameters didn't significantly improve the overall fit. Table 3 shows the final parameters. For comparison, it also shows the corresponding experimental estimates of the parameters available in the literature.
The simulations predicted endogenous buffering capacities (κe) in the same range as reported by Sabatini et al. (2002) with values from 16 to 80 when the concentration of indicator was extrapolated to zero (see Methods Section and Figures 5A–D). The decay time constant for the Δ[Ca2+]estim transient was 42 ms in the dendrites and 20–40 ms in the spines when extrapolated to zero indicator, again in the same range reported by Sabatini et al. (2002). The extrapolated peak Δ[Ca2+]estim during the bAP was 0.3 μM in the dendrites and 0.5–1.0 μM in the spines, also in the range reported by Sabatini et al.
Relationship of Buffering Capacity to Amplitude and Decay Time of Δ[Ca2+]estim in the Large Dendrite
After we calibrated the model to match experimental data using the small dendrite, we used the same parameters to simulate Ca2+ transients for large spines on the large dendrite (13 spines ≥ 0.05 fl, shaft diameter ~2.1 μm (Figures 6A–D). The most striking difference between Ca2+ transients in the two dendrites is seen in the shafts. For each concentration of indicator, the simulated transient in the large shaft has a smaller amplitude (e.g., 1/Δ[Ca2+] is larger) than in the small shaft, and the decay time is longer, reflecting the smaller surface to volume ratio of the shaft with the larger diameter.
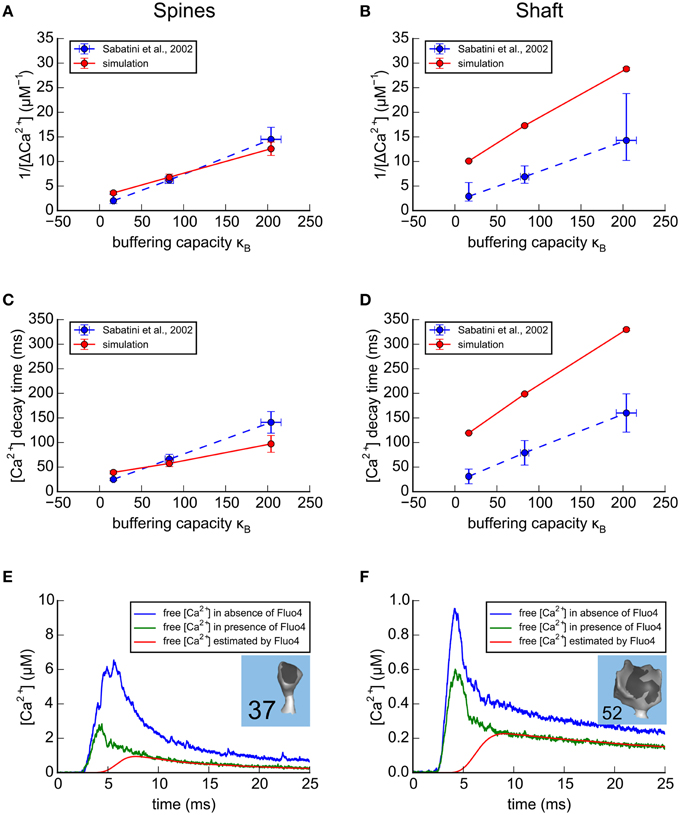
Figure 6. Results of simulations in the spines and shafts of the large apical dendrite using parameters optimized for the small branch dendrite. (A–D) Simulation of Ca2+ transients in response to a bAP in the absence of calbindin. As in Figure 5, for comparison with experimental results of Sabatini et al. (2002; shown as blue dashed lines), concentrations of exogenous fluorescent Ca2+ indicators in the model were set to 20 μM Fluo4, 50 μM OGB1, or 100 μM OGB1. The simulated results in the large apical dendrite, averaged for the 13 spines with volumes ≥0.05 fl are shown as red lines. (A) For each concentration of indicator, the reciprocal of the averaged peaks of the Ca2+ transients in the spines of the large apical dendrite, 1/Δ[Ca2+], is plotted against the buffering capacity in the presence of indicator (κB) calculated as in Sabatini et al. (2002). The Δ[Ca2+], extrapolated to zero indicator, was in the range 0.3–0.6 μM (reciprocal of y-axis intercept) with κe in the range 40–75 (x-axis intercept). (B) The reciprocal of the averaged peaks of the Ca2+ transients in the dendritic shaft is plotted against buffering capacity. The Δ[Ca2+], extrapolated to zero indicator, was 0.12 μM with κe = 75. (C) The averaged time constant of Ca2+ decay in the spines is plotted against Ca2+ buffering capacity. The Ca2+ decay time constant, extrapolated to zero indicator in the spines was 25 to 40 ms (y-axis intercept) with κein the range 60–120 (x-axis intercept). (D) The averaged time constant of Ca2+ decay in the dendritic shafts was plotted against buffering capacity. The Ca2+ decay time constant, extrapolated to zero indicator in the dendritic shafts was 100 ms with κe = 80. (E,F) Ca2+ transients in two spines of the calibrated model, in response to a bAP. Simulations were run in the presence and absence of 20 μM Fluo4 in a median size spine (E, spine #37, average of 32 trials) and in a large-size spine (F, spine #52, average of 59 trials). The average Ca2+ transients that would be estimated from the fluorescence of 20 μM Fluo4 are shown in red. The average Ca2+ transients, measured in the simulation by counting actual free Ca2+, are shown in the presence of Fluo4 (green), and in its absence (blue).
Effect of the Presence of Fluorescent Indicators on the Free Ca2+ Transient
One advantage of this model is that after it is calibrated to agree with experiments that were performed with Ca2+ indicators, they can be removed from the simulations to explore Ca2+ dynamics in the absence of indicators. We know that exogenous indicators alter the free Ca2+ transient, but their effect can't be measured by direct experiments. We used the calibrated model to simulate and compare free Ca2+ transients in a small (Figure 6E) and a large (Figure 6F) spine in response to a bAP as estimated from fluorescence measurements by the method of Maravall (red), and as recorded in the simulation in the presence (green) and absence (blue) of Fluo4. The peak of the free Ca2+ estimated from fluorescence is much smaller than the free Ca2+ transients recorded during the simulations, either in the presence or absence of Fluo4. This is because the response of the indicator is too slow to follow the rapid initial phase of the transient. Note that the indicator does accurately follow the slow decay phase of the transient when the free [Ca2+] is changing slowly enough that the indicator is able to track it.
Responses to EPSP, bAP, and EPSP+bAP Stimuli in a Median-size Spine
We examined simulated Ca2+ transients in the absence of indicator in more detail in a single median-size spine (#37), in response to three different stimuli; an EPSP alone, a bAP alone, and an EPSP preceding a bAP by 10 ms (EPSP+bAP; Figure 7). During the stimuli that included an EPSP, 1500 molecules of glutamate was released from a single site and bound to and activated AMPARs and NMDARs. We previously found that release of 1500 molecules of glutamate produces activation that most closely matches experimental estimates (Keller et al., 2008). The EPSP voltage was simulated as described under “Stimuli” in Methods Section.
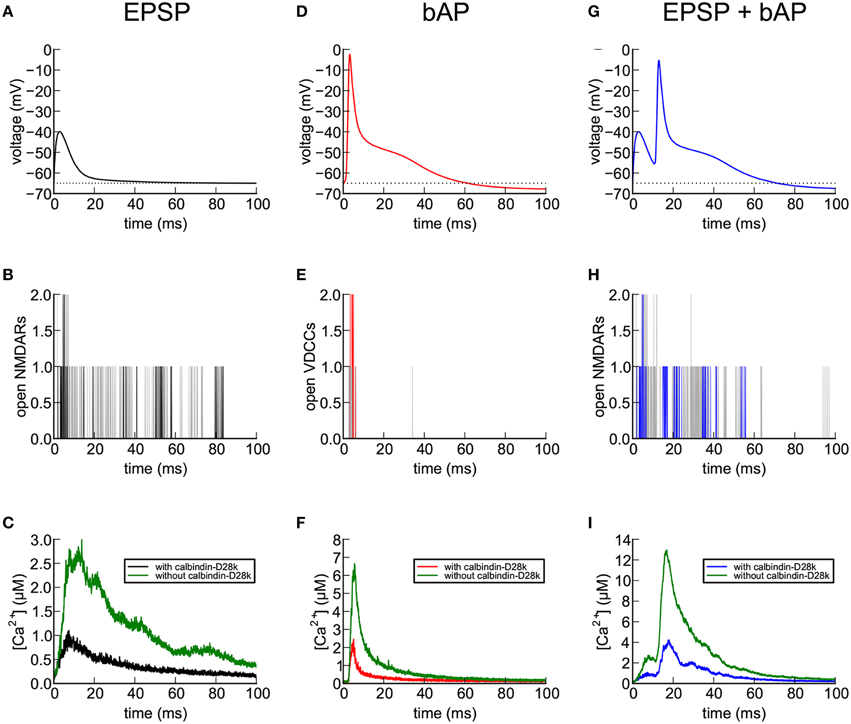
Figure 7. Calcium entry into spines in response to EPSP, bAP, and EPSP+bAP stimuli. Unless otherwise stated, the dendrite contained 45 μM calbindin-D28k and the signals are those recorded in spine #37. (A) Depolarization of the spine head following an EPSP stimulus. The voltage signal was generated from a NEURON simulation, as described in Methods Section. (B) NMDARs flickered between open and closed states during an EPSP. The black trace shows a single trial. Gray traces are superposition of five additional trials. (C) Ca2+ transients in the spine head in response to a single EPSP stimulus averaged over 56 trials in the presence (black) and absence (green) of calbindin-D28k. (D) Depolarization of the spine head following a bAP stimulus. The voltage signal was generated from a NEURON simulation as described in Methods Section). (E) VDCCs flickered between open and closed states during the bAP. The red trace shows a single trial. Gray traces are superposition of five additional trials. (F) Ca2+ transients in the spine head in response to a single bAP stimulus averaged over 32 trials in the presence (red) and absence (green) of calbindin-D28k. (G) Depolarization of the spine head following an EPSP+bAP stimulus. The voltage signal was generated from a NEURON simulation as described in Methods Section. (H) NMDARs flickered between open and closed states during an EPSP+bAP. The blue trace shows a single trial. Gray traces are superposition of five additional trials. (I) Ca2+ transients in the spine head in response to a single EPSP+bAP stimulus averaged over 86 trials in the presence (blue) and absence (green) of calbindin-D28k.
During a single EPSP (Figure 7A), activated NMDARs are mostly blocked by Mg2+. Thus, in the simulation, only a few flickered open stochastically (Figure 7B). The size of the EPSP (25 mV) is the average size for hippocampal CA1 pyramidal neurons, calculated by Harnett et al. (2012). Many of the EPSP trials in this simulation resulted in no Ca2+ influx at all because of the small number of activated and unblocked NMDARs. We computed the average of Ca2+ transients during the successful trials both in the presence (black) and absence (green) of calbindin (Figure 7C). In the presence of calbindin, successful trials produced a slow rising phase to a peak amplitude of about 1 μM, followed by a slow decay. In the absence of calbindin, the average peak amplitude was about 2.6 μM. Thus, the principal effect of calbindin on the Ca2+ transient is to reduce its overall magnitude. The noisiness in the averaged trace of the Ca2+ transient in Figure 7C is a result of stochastic opening and closing of the NMDARs and binding and unbinding of Ca2+ to the CBPs and pumps.
During a bAP (Figure 7D), the depolarization of the spine head caused the small number of VDCCs to flicker open and closed stochastically (Figure 7E) and Ca2+ flowed into the spine head through the open channels (Figure 7F). As with the EPSP stimulus, many trials with the bAP stimulus failed to open any VDCC channels and no Ca2+ influx occurred. We averaged the successful Ca2+ responses to a bAP and observed a rapid rising phase to a peak amplitude of about 2.2 μM in the presence of calbindin, followed by a rapid decay, and a peak of 6.5 μM in its absence. During the sustained influx of Ca2+, the rate of influx exceeded the rate at which internal Ca2+-binding proteins could bind the Ca2+, resulting in a rapid rise of free Ca2+ levels. When the Ca2+ influx stopped, the Ca2+-binding proteins and free Ca2+ rapidly reached a quasi-equilibrium. The Ca2+ was then removed from the spine by the Ca2+ pumps and by diffusion through the spine neck.
After a simulated EPSP+bAP stimulus (Figure 7G), only zero, one, or (rarely) two NMDARs became doubly bound by glutamate immediately after its release. Those that did cycled stochastically between closed and open states for much longer than VDCCs (Figure 7H). Because the Mg2+ block was relieved by the bAP, a large Ca2+ influx was observed in the spine head, followed by decay to baseline (Figure 7I). In the presence of calbindin (blue), the average amplitude of the Ca2+ transients during trials that resulted in Ca2+ influx was 4.0 μM and the time to decay to 10% of the peak was 65 ms. In the absence of calbindin (green), the peak amplitude was nearly 13 μM and the time to decay to 10% of the peak was 50 ms.
A visualization of simulated release and Ca2+ influx at spine #37 after an EPSP+bAP stimulus in the absence of calbindin is shown in Figure 8. Glutamate is released, diffuses, and activates receptors (Figures 8A–D). Ca2+ flows in through an opened NMDA receptor (Figure 8E) and is pumped out as the voltage decreases (Figure 8F). The visualization illustrates the level of detail that the simulations can reveal.
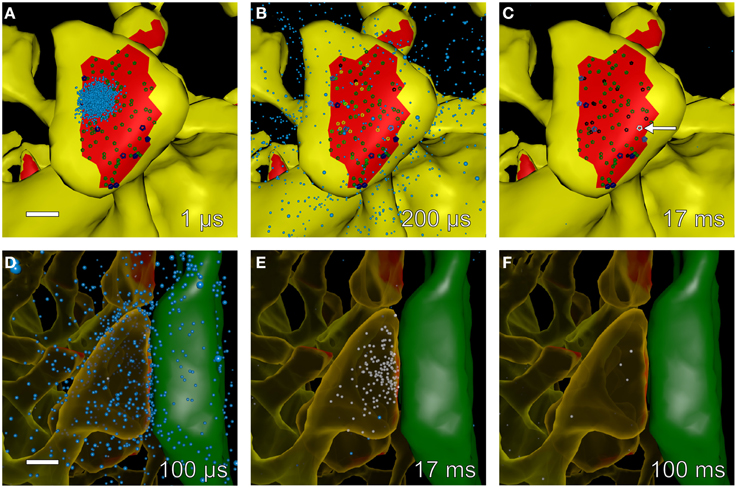
Figure 8. Snapshots of simulated glutamate release and postsynaptic calcium dynamics at different times during an EPSP+bAP stimulus. We used Cell Blender (see Methods Section) to visualize simulated glutamate release and calcium entry into spine #37 (see Figure 4A) during an EPSP+bAP stimulus. All other components of the neuropil were present in the simulation but are not displayed in the visualization. All scale bars are 0.25 μm. (A–C) Time-lapse sequence of glutamate (cyan dots) released onto a dendritic spine with unbound AMPARs (smaller, dark-green glyphs) and unbound NMDARs (larger, dark-blue glyphs). Snapshots (A–C) were made from data generated by MCell during a single trial and taken at 1, 200 μs, and 17 ms after glutamate release, respectively. Glutamate diffused rapidly throughout the synaptic cleft, binding to AMPARs and NMDARs. Singly bound AMPARs are shown as medium-green glyphs, doubly bound AMPARs as bright-green glyphs, open AMPARs as yellow glyphs, and desensitized AMPARs as black glyphs. Singly bound NMDARs are shown as medium-blue glyphs, doubly bound NMDARs as bright-blue glyphs, and open NMDARs as white glyphs. During this trial the peak of AMPAR activation occurred at ~200 μs and the peak of NMDAR activation occurred at ~17 ms when a single NMDAR flickered open (white glyph indicated by white arrow in C). (D–F) Time-lapse sequence of glutamate decay and calcium influx after stimulation. Snapshots for (D–F) were made from data generated by MCell during a single trial and taken at 100 μs, 17, and 100 ms after glutamate release, respectively. The presynaptic axon (green) on the right makes an en passant synapse with the postsynaptic spine (translucent yellow) on the left. Free glutamate molecules (cyan dots) diffuse from the synaptic cleft within a few microseconds and are taken up within a 100 ms by astroglial transporters (not visualized but present in the simulation). Some glutamate remains bound and activates NMDARs for many tens of microseconds allowing influx of calcium (white dots) as NMDARs flicker open and closed. In this example, calcium entered the spine through a single open NMDAR and was cleared from the spine head via calcium pumps in the spine membrane and by diffusion through the spine neck.
Fate of Calcium Entering Spines during a bAP and an EPSP+bAP Stimulus
During the first 100 ms of a bAP stimulus, we monitored the fate of all the Ca2+ that entered the spine in the absence or presence of calbindin (Figures 9A–D). For comparison, we also monitored the fate of Ca2+ after an EPSP+bAP stimulus in the presence of calbindin (Figures 9E,F). The Ca2+ fates following the three stimuli are shown for a median-sized spine (#37, Figures 9A,C,E) and a large spine (#52; Figures 9B,D,F). Ca2+ was tracked after its influx through both VDCCs and NMDARs. We recorded its binding to CBPs, NCXs and PMCAs, and its eventual efflux out of the spine via the pumps and via diffusion through the neck into the shaft. The pumps and CBPs bound Ca2+ as soon as it entered the spine (yellow). Only a tiny fraction of Ca2+ remained free in the spine (blue). Ca2+ that bound to pumps was eventually pumped out of the spine (red and white) unless it unbound before being pumped. Ca2+ bound to immobile CBPs was released gradually to be captured by pumps or to diffuse out of the spine neck either while free or while bound to calbindin (green).
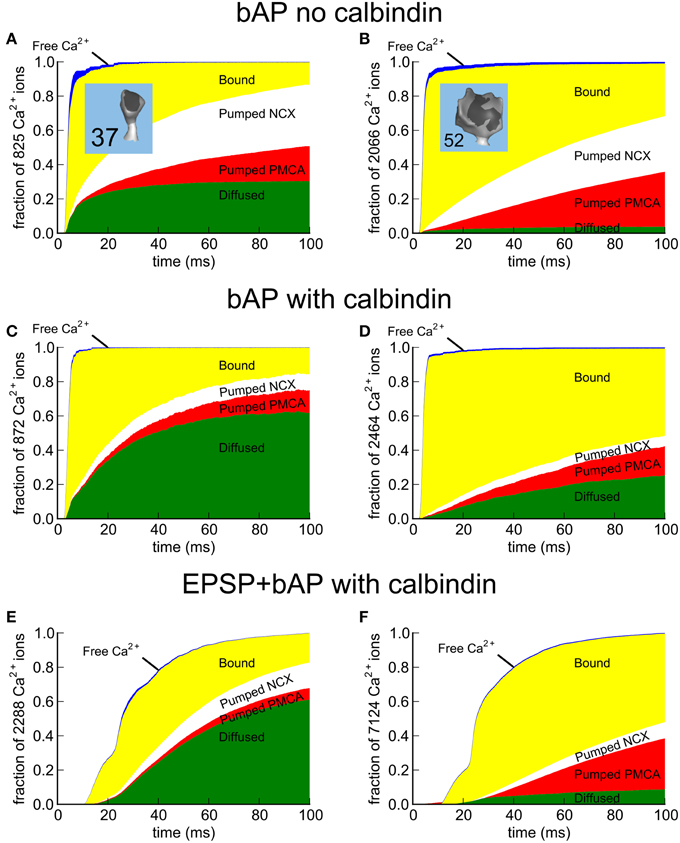
Figure 9. Fate maps of Ca2+ entering spines #37 and #52 in response to EPSP+bAP. The fate of all Ca2+ entering the spines was tracked for 100 ms after the stimulus. While inside the spine, Ca2+ can diffuse freely (blue) or bind to Ca2+-binding proteins and pumps (yellow). To restore the resting state, Ca2+ that enters is removed from the spine by PMCA pumps (red), NCX exchangers (white), or via diffusion through the spine neck (green) as free Ca2+ or while bound to mobile calbindin. (A,C,E) Fate of Ca2+ in median-size spine #37; (A) after a bAP in the absence of calbindin, (C) a bAP in the presence of calbindin, or (E) an EPSP+bAP in the presence of calbindin. (B,D,F) Fate of Ca2+ in large spine #52; (B) after a bAP in the absence of calbindin, (D) a bAP in the presence of calbindin, or (F) an EPSP+bAP in the presence of calbindin. Data is represented as a fraction of the total Ca2+ influx. The actual number of Ca2+ ions tracked is indicated in the y-axis label.
As expected, a larger fraction of total Ca2+ exits the median-size spine than the large spine by diffusion into the shaft. The principal effect of calbindin is to decrease the fraction of Ca2+ exiting via the pumps and to accelerate diffusion of Ca2+ into the shaft while it is bound to calbindin. Sabatini et al. (2002) reported that the length of time required for equilibration of Ca2+ between the spine and dendritic shaft during a bAP averaged 89 ± 31 ms, varying from 12 to 190 ms. They concluded that, in the absence of indicator (which diffuses faster than the endogenous CBPs), the time required for complete equilibration between the spine and shaft is likely to be longer than 1 s. Because the Ca2+ transient decays much faster than Ca2+ is cleared by diffusion, they concluded that diffusion through the spine neck is not likely to be a major determinant of the decay time of a Ca2+ transient produced by a bAP. Our simulations of Ca2+ movements are consistent with this conclusion.
Discussion
One goal of this study was to perform a “computational” reconstitution assay. We tested whether the locations, estimated numbers, and kinetic behavior, determined in vitro, of the major proteins believed to control the influx and efflux of Ca2+ in spines can account for the measured size and decay time of Ca2+ transients in a computer reconstruction of intact dendrites and spines. We have shown that the properties of these proteins can indeed account for the size and decay of the Ca2+ transients when incorporated into our model. This conclusion comes with several qualifications. Some of the required parameters, in particular, the densities of individual classes of proteins in subcellular membranes, are difficult to measure experimentally. Hence, we have sometimes used molecular numbers, and/or membrane protein densities measured in non-neuronal cells, to establish biologically reasonable densities. For example, the densities of Na+/Ca2+ exchangers (NCXs) and plasma membrane Ca2+ ATPases (PMCAs) on the membrane of the spine head have not been measured directly. In our calibrations, we found that the required density of PMCAs in the spine head is higher by a factor of 2–3 than their measured density in plasma membranes of other cell types (see below). The values of the densities of NCXs and PMCAs that fit our calibration depend, in part, on their assigned turnover numbers. However, it is not possible to be certain that the enzymatic turnover numbers measured in vitro for these two pumps accurately reflect the turnover numbers in vivo. For example, if the turnover rate for PMCAs is higher in vivo than the rate measured in vitro, a lower density of PMCAs would be sufficient to account for the transients observed in vivo. Nonetheless, all of the final parameters in this model are within reasonable physiological limits. Thus, we conclude that the set of proteins we have used in the model, to a first approximation, can serve as the principal regulators of Ca2+ transients in spines. In addition, we conclude that the properties of these proteins, measured in vitro in the studies we have chosen (see Methods Section), are not likely to be grossly different than their properties displayed in vivo. Another area of experimental uncertainty is the immobile endogenous buffer, which represents the aggregate concentration and binding rates of the set of cytosolic proteins that bind Ca2+. The concentration (79.7 μM) and KD of the CBP that we established during the calibration are reasonable considering the high total protein concentration in the cytosol, and the weak binding properties of most immobile Ca2+ binding proteins. Because the concentration of the immobile buffer is not well-constrained by experiments, one might wonder whether a different concentration of CBP's would result in an equally good fit with a different set of values for the other parameters. However, there was not another good fit within the range of each of the parameters that we searched (Table 2). Because the range of parameters that we searched was determined by the range of their values measured previously in vitro, we conclude that there are not multiple sets of physiologically realistic parameters that are compatible with a global fit of the cellular experimental data we have used.
The distribution of PMCA and NCX pumps between spine and shaft is qualitatively consistent with studies showing that Ca2+ pumps are distributed unevenly in dendrites and spines. In some situations, PMCA pumps appear to cluster at the neck and base of the spine head or in the PSD (Burette and Weinberg, 2007; Burette et al., 2010; Weinberg, personal communication). There have been no direct experimental estimates of the density of PMCA's on spine or dendritic membranes. However, in non-neuronal cells, PMCAs have been estimated to be 0.1% of plasma membrane proteins and 0.3–1% in neuronal cells (Stauffer et al., 1995). Quinn et al. (1984) estimated the density of total proteins in the plasma membrane of a BHK cell at 30,000 μm−2. Those numbers suggest that the neuronal membrane density of PMCA pumps would be estimated to be as high as 300 μm−2. Our final calibrated density of 998 μm−2 in the spine membrane is about three times that value. Biochemical estimates of densities of the pump on plasma membrane have some uncertainty because it is difficult to know what proportion of an isolated membrane fraction is plasma membrane, and because the measures by immunoblot of labeled phosphorylation intermediates are often semi-quantitative (Stauffer et al., 1995). Nonetheless, because of the importance of rapid Ca2+ transients in spines, one might expect them to have a higher PMCA density than BHK cells, particularly at the postsynaptic interface. A prediction of our model is that one of three things is true (or some combination): 1. PMCAs are present at a higher density in spines than in non-neuronal cells; 2. they have a higher turnover number in vivo than measured in vitro; or 3. there are additional factors important for removing Ca2+ from the spine that are not well-understood by molecular neurobiologists. We favor the idea that PMCAs are expressed at unusually high levels in the spine membrane because spines have evolved to exert tight control over Ca2+ fluxes.
The model presented here doesn't include several additional spine membrane components that can modulate the timing and/or amplitude of Ca2+ transients under particular conditions, or in particular synaptic types. These components include SK channels, calcium-permeable AMPARs, metabotropic receptors, and inositol trisphosphate (IP3) and ryanodine receptors in SER. SK channels hyperpolarize the spine membrane in response to an initial Ca2+ influx, and thus strongly modulate the influx of Ca2+ during repetitive stimulation (Ngo-Anh et al., 2005). They do not have a large effect during a single bAP or EPSP+bAP. Their influence on Ca2+ influx during the kinds of repetitive stimuli that lead to synaptic plasticity will be important to add to this model for future studies. Ca2+-permeable AMPARs are believed to play a role in excitatory synapses onto inhibitory GABAergic neurons (Mahanty and Sah, 1998; Laezza and Dingledine, 2004). Under some circumstances, they may also play a transient role in Ca2+ influx into spine synapses during consolidation of LTP (Plant et al., 2006). They don't appear to be an important source of Ca2+ influx in the majority of glutamatergic synapses onto excitatory neurons. Ca2+ stores in SER containing IP3 or ryanodine receptors are present in a small proportion of spine synapses in the hippocampus (~20%). We have not modeled those spines in the present study. It will be interesting to examine the effect of the presence of Ca2+-permeable AMPARs and Ca2+ stores on spine Ca2+ transients in future studies.
Our model of Ca2+-handling permits accurate simulation of diffusion of Ca2+ and mobile Ca2+-binding proteins through spine necks and into the nearby dendritic shafts, assuming a fairly uniform cytosol. However, we have not included agents that might mediate changes in the diffusional barrier in the spine neck, such as highly cross-linked actin cytoskeleton or mobile organelles that might move transiently into the neck (Bloodgood and Sabatini, 2005). Thus, our results do not reflect these influences.
We found that the single exponential decay of the fluorescence of Fluo-4 and OGB1 observed in the experiments of Sabatini et al. (2002) constrained the values of the on-rate and the KD of the immobile CBP. When the on-rate of the immobile CBP was set significantly slower than the on-rates of Fluo4 or OGB1, the decay of the simulated fluorescence transient (i.e., Ca2+-bound to the indicator) was best fit by two exponential curves, one fast and one slow. As the on-rate of the immobile CBP was increased and approached the on-rate of the indicator, the shape of the decay phase of the fluorescence transient was better fit by a single exponential. Furthermore, the off-rate (and therefore the overall KD) of the immobile CBP also had to be balanced against that of the indicator to avoid a biphasic exponential decay of the fluorescence transient. This phenomenon can be understood by noting that during the rising phase of a transient, the buffer or dye with the higher on-rate will initially bind most of the Ca2+, but during the decay phase the buffer or dye with the lower KD (i.e., highest affinity and slowest off-rate) will eventually bind the most Ca2+ (Markram et al., 1998). The best-fit parameters we found for the immobile CBP allows the indicator to bind and retain most of the Ca2+ throughout the fluorescence transient while also fitting the experimental measurements of endogenous buffering capacity.
To understand and model the biochemical responses to Ca2+ in the postsynaptic spine, including the interaction of Ca2+ with calmodulin and its target proteins, it is important to know the precise height and time course of the Ca2+ transients. Since our simulations allow us to measure free [Ca2+], with or without added indicator and with or without lowpass filtering, we were able to measure both the perturbation of free Ca2+ due to the added indicator, and the error in the estimation of free Ca2+ based on the fluorescence signal (Figures 6E,F). The error in the estimation arises from two factors: (1) the estimation method requires the assumption that free and indicator-bound Ca2+ are in quasi-equilibrium; in other words, the indicator binds Ca2+ fast enough to track the Ca2+ transient accurately; and (2) the estimation method assumes that the data acquisition and subsequent lowpass filtering of the fluorescence signal are fast enough to track the fluorescence transient. The model shows that both of these assumptions are false. Ca2+ does not approach equilibrium with the indicator during the transient, and the Ca2+ peak is significantly attenuated by the lowpass filter.
The comparison of Ca2+ fluxes into a median size spine and a large spine (Figures 6E,F, 9) reveal that, although a larger amount of Ca2+ flows into the larger spine, the effective concentration of free Ca2+ reached in that spine is smaller because the Ca2+ is averaged over a much larger volume. Our future studies will examine in more detail, in different sizes and shapes of spines, the relationship between the surface to volume ratio of a spine and the concentrations and local interactions of Ca2+ in the spine cytosol after a stimulus.
The model presented here will be a useful adjunct to experimental studies of the regulatory systems that control synaptic strength. For example, the basic model of Ca2+ handling in spines provides a test bed in which the sensitivity of Ca2+ transients to changes in the numbers and parameters of other modulating proteins can be predicted both independently and in combination. The model will also enable future studies in which calmodulin and its target enzymes will be added to the spine cytosol to test and predict how Ca2+ influx, triggered by a wide variety of stimuli, can affect activation of Ca2+-regulated enzymes that control synaptic plasticity.
Conflict of Interest Statement
The authors declare that the research was conducted in the absence of any commercial or financial relationships that could be construed as a potential conflict of interest.
Acknowledgments
This work was supported by NIH grants NS21184, MH095980, and NS074644 (KH), NIH grants NS44306 and DA030749 (MK, TS, TB), NIH grants MH079076 and P41-GM103712 (TJS, TB), NIH grant EB00487 (CB), NSF grant OCI-1216701 (CB), the Howard Hughes Medical Institute, the Texas Emerging Technologies Fund, and the Gordon and Betty Moore Foundation. We thank B. Dylan Bannon for comments on the manuscript.
References
Allbritton, N. L., Meyer, T., and Stryer, L. (1992). Range of messenger action of calcium ion and inositol 1,4,5-trisphosphate. Science 258, 1812–1815. doi: 10.1126/science.1465619
Arriza, J. L., Fairman, W. A., Wadiche, J. I., Murdoch, G. H., Kavanaugh, M. P., and Amara, S. G. (1994). Functional comparisons of three glutamate transporter subtypes cloned from human motor cortex. J. Neurosci. 14, 5559–5569.
Baba-Aissa, F., Raeymaekers, L., Wuytack, F., De Greef, C., Missiaen, L., and Casteels, R. (1996). Distribution of the organellar Ca2C transport ATPase SERCA2 isoforms in the cat brain. Brain Res. 743, 141–153. doi: 10.1016/S0006-8993(96)01037-2
Bartol, T. M. (1992). A Study of Miniature Endplate Current Generation at the Vertebrate Neuromuscular Junction using Electrophysiology and Monte Carlo Simulation. Ph.D. thesis, Cornell University, Ithaca, NY.
Bergles, D. E., Tzingounis, A. V., and Jahr, C. E. (2002). Comparison of coupled and uncoupled currents during glutamate uptake by GLT-1 transporters. J. Neurosci. 22, 10153–10162.
Bi, G., and Poo, M.-M. (1998). Synaptic modifications in cultured hippocampal neurons: dependence on spike timing, synaptic strength, and postsynaptic cell type. J. Neurosci. 18, 10464–10472.
Bischofberger, J., Geiger, J. R., and Jonas, P. (2002). Timing and efficacy of Ca2C channel activation in hippocampal mossy fiber boutons. J. Neurosci. 22, 10593–10602.
Blaustein, M. P., and Lederer, W. J. (1999). Sodium/calcium exchange: its physiological implications. Physiol. Rev. 79, 763–854.
Bloodgood, B. L., and Sabatini, B. L. (2005). Neuronal activity regulates diffusion across the neck of dendritic spines. Science 310, 866–869. doi: 10.1126/science.1114816
Bloodgood, B. L., and Sabatini, B. L. (2007). Nonlinear regulation of unitary synaptic signals by CaV(2.3) voltage-sensitive calcium channels located in dendritic spines. Neuron 53, 249–260. doi: 10.1016/j.neuron.2006.12.017
Briggs, G. E., and Haldane, J. B. (1925). A note on the kinetics of enzyme action. Biochem. J. 19, 338–339. doi: 10.1042/bj0190338
Brini, M., and Carafoli, E. (2009). Calcium pumps in health and disease. Physiol. Rev. 89, 1341–1378. doi: 10.1152/physrev.00032.2008
Burette, A. C., Strehler, E. E., and Weinberg, R. J. (2010). A plasma membrane Ca2C ATPase isoform at the postsynaptic density. Neuroscience 169, 987–993. doi: 10.1016/j.neuroscience.2010.05.062
Burette, A., and Weinberg, R. J. (2007). Perisynaptic organization of plasma membrane calcium pumps in cerebellar cortex. J. Comp. Neurol. 500, 1127–1135. doi: 10.1002/cne.21237
Carafoli, E., Santella, L., Branca, D., and Brini, M. (2001). Generation, control, and processing of cellular calcium signals. Crit. Rev. Biochem. Mol. Biol. 36, 107–260. doi: 10.1080/20014091074183
Caride, A. J., Filoteo, A. G., Penniston, J. T., and Strehler, E. E. (2007). The plasma membrane Ca2C pump isoform 4a differs from isoform 4b in the mechanism of calmodulin binding and activation kinetics: implications for Ca2C signaling. J. Biol. Chem. 282, 25640–25648. doi: 10.1074/jbc.M701129200
Chen, W., Mahadomrongkul, V., Berger, U. V., Bassan, M., Desilva, T., Tanaka, K., et al. (2004). The glutamate transporter GLT1a is expressed in excitatory axon terminals of mature hippocampal neurons. J. Neurosci. 24, 1136–1148. doi: 10.1523/JNEUROSCI.1586-03.2004
Church, P. J., and Stanley, E. F. (1996). Single L-type calcium channel conductance with physiological levels of calcium in chick ciliary ganglion neurons. J. Physiol. 496(Pt 1), 59–68. doi: 10.1113/jphysiol.1996.sp021665
Cooney, J. R., Hurlburt, J. L., Selig, D. K., Harris, K. M., and Fiala, J. C. (2002). Endosomal compartments serve multiple hippocampal dendritic spines from a widespread rather than a local store of recycling membrane. J. Neurosci. 22, 2215–2224.
Danbolt, N. C. (2001). Glutamate uptake. Prog. Neurobiol. 65, 1–105. doi: 10.1016/S0301-0082(00)00067-8
Diamond, J. S. (2001). Neuronal glutamate transporters limit activation of NMDA receptors by neurotransmitter spillover on CA1 pyramidal cells. J. Neurosci. 21, 8328–8338.
Edwards, J., Daniel, E., Kinney, J., Bartol, T., Sejnowski, T., Johnston, D., et al. (2014). VolRoverN: enhancing surface and volumetric reconstruction for realistic dynamical simulation of cellular and subcellular function. Neuroinformatics 12, 277–289. doi: 10.1007/s12021-013-9205-2
Ellis, R. J. (2001). Macromolecular crowding: an important but neglected aspect of the intracellular environment. Curr. Opin. Struct. Biol. 11, 114–119. doi: 10.1016/S0959-440X(00)00172-X
Elowitz, M. B., Surette, M. G., Wolf, P. E., Stock, J. B., and Leibler, S. (1999). Protein mobility in the cytoplasm of Escherichia coli. J. Bacteriol. 181, 197–203.
Franks, K. M., and Sejnowski, T. J. (2002). Complexity of calcium signaling in synaptic spines. Bioessays 24, 1130–1144. doi: 10.1002/bies.10193
Fraser, D. D., and MacVicar, B. A. (1991). Low-threshold transient calcium current in rat hippocampal lacunosum-moleculare interneurons: kinetics and modulation by neurotransmitters. J. Neurosci. 11, 2812–2820.
Geiger, J. R. P., Roth, A., Taskin, P., and Jonas, P. (1999). “Glutamate-mediated synaptic excitation of cortical interneurons,” in Ionotropic Glutamate Receptors in the CNS, eds P. Jonas and H. Monyer (Heidelberg: Springer-Verlag), 363–398. doi: 10.1007/978-3-662-08022-1_11
Hamdan, F. F., Daoud, H., Piton, A., Gauthier, J., Dobrzeniecka, S., Krebs, M. O., et al. (2011). De novo SYNGAP1 mutations in nonsyndromic intellectual disability and autism. Biol. Psychiatry 69, 898–901. doi: 10.1016/j.biopsych.2010.11.015
Harnett, M. T., Makara, J. K., Spruston, N., Kath, W. L., and Magee, J. C. (2012). Synaptic amplification by dendritic spines enhances input cooperativity. Nature 491, 599–602. doi: 10.1038/nature11554
Harris, K. M., and Stevens, J. K. (1989). Dendritic spines of CA1 pyramidal cells in the rat hippocampus: serial electron microscopy with reference to their biophysical characteristics. J. Neurosci. 9, 2982–2997.
Higgins, E. R., Cannell, M. B., and Sneyd, J. (2006). A buffering SERCA pump in models of calcium dynamics. Biophys. J. 91, 151–163. doi: 10.1529/biophysj.105.075747
Higley, M. J., and Sabatini, B. L. (2008). Calcium signaling in dendrites and spines: practical and functional considerations. Neuron 59, 902–913. doi: 10.1016/j.neuron.2008.08.020
Hilgemann, D. W., Nicoll, D. A., and Philipson, K. D. (1991). Charge movement during NaC translocation by native and cloned cardiac NaC/Ca2C exchanger. Nature 352, 715–718. doi: 10.1038/352715a0
Hu, W. H., Walters, W. M., Xia, X. M., Karmally, S. A., and Bethea, J. R. (2003). Neuronal glutamate transporter EAAT4 is expressed in astrocytes. Glia 44, 13–25. doi: 10.1002/glia.10268
Jahr, C. E., and Stevens, C. F. (1993). Calcium permeability of the N-methyl-D-aspartate receptor channel in hippocampal neurons in culture. Proc. Natl. Acad. Sci. U.S.A. 90, 11573–11577. doi: 10.1073/pnas.90.24.11573
Jonas, P., Major, G., and Sakmann, B. (1993). Quantal components of unitary EPSCs at the mossy fibre synapse on CA3 pyramidal cells of rat hippocampus. J. Physiol. (Lond). 472, 615–663. doi: 10.1113/jphysiol.1993.sp019965
Keller, D. X., Franks, K. M., Bartol, T. M. Jr., and Sejnowski, T. J. (2008). Calmodulin activation by calcium transients in the postsynaptic density of dendritic spines. PLoS ONE 3:e2045. doi: 10.1371/journal.pone.0002045
Kennedy, M. B. (2013). Synaptic signaling in learning and memory. Cold Spring Harb. Perspect. Biol. a016824. doi: 10.1101/cshperspect.a016824
Kerr, R. A., Bartol, T. M., Kaminsky, B., Dittrich, M., Chang, J.-C. J., Baden, S. B., et al. (2008). Fast Monte Carlo simulation methods for biological reaction-diffusion systems in solution and on surfaces. SIAM J. Sci. Comput. 30, 3126–3149. doi: 10.1137/070692017
Kharazia, V. N., and Weinberg, R. J. (1999). Immunogold localization of AMPA and NMDA receptors in somatic sensory cortex of albino rat. J. Comp. Neurol. 412, 292–302.
Kinney, J. P. (2009). Investigation of Neurotransmitter Diffusion in Three-dimensional Reconstructions of Hippocampal Neuropil. Thesis, University of California, San Diego, CA.
Kinney, J. P., Spacek, J., Bartol, T. M., Bajaj, C. L., Harris, K. M., and Sejnowski, T. J. (2013). Extracellular sheets and tunnels modulate glutamate diffusion in hippocampal neuropil. J. Comp. Neurol. 521, 448–464. doi: 10.1002/cne.23181
Kinoshita, K., Arnal, I., Desai, A., Drechsel, D. N., and Hyman, A. A. (2001). Reconstitution of physiological microtubule dynamics using purified components. Science 294, 1340–1343. doi: 10.1126/science.1064629
Koester, H. J., and Sakmann, B. (2000). Calcium dynamics associated with action potentials in single nerve terminals of pyramidal cells in layer 2/3 of the young rat neocortex. J. Physiol. 529(Pt 3), 625–646. doi: 10.1111/j.1469-7793.2000.00625.x
Laezza, F., and Dingledine, R. (2004). Voltage-controlled plasticity at GluR2-deficient synapses onto hippocampal interneurons. J. Neurophysiol. 92, 3575–3581. doi: 10.1152/jn.00425.2004
Lehre, K. P., and Danbolt, N. C. (1998). The number of glutamate transporter subtype molecules at glutamatergic synapses: chemical and stereological quantification in young adult rat brain. J. Neurosci. 18, 8751–8757.
Lörincz, A., Rózsa, B., Katona, G., Vizi, E. S., and Tamás, G. (2007). Differential distribution of NCX1 contributes to spine-dendrite compartmentalization in CA1 pyramidal cells. Proc. Natl. Acad. Sci. U.S.A. 104, 1033–1038. doi: 10.1073/pnas.0605412104
Magee, J. C., and Johnston, D. (1995a). Characterization of single voltage-gated NaC and Ca2C channels in apical dendrites of rat CA1 pyramidal neurons. J Physiol. 487(Pt 1), 67–90. doi: 10.1113/jphysiol.1995.sp020862
Magee, J. C., and Johnston, D. (1995b). Synaptic activation of voltage-gated channels in the dendrites of hippocampal pyramidal neurons. Science 268, 301–304. doi: 10.1126/science.7716525
Magee, J. C., and Johnston, D. (1997). A synaptically controlled, associative signal for Hebbian plasticity in hippocampal neurons. Science 275, 209–213. doi: 10.1126/science.275.5297.209
Mahanty, N. K., and Sah, P. (1998). Calcium-permeable AMPA receptors mediate long-term potentiation in interneurons in the amygdala. Nature 394, 683–687. doi: 10.1038/29312
Mainen, Z. F., Joerges, J., Huguenard, J. R., and Sejnowski, T. J. (1995). A model of spike initiation in neocortical pyramidal neurons. Neuron 15, 1427–1439. doi: 10.1016/0896-6273(95)90020-9
Maravall, M., Mainen, Z. F., Sabatini, B. L., and Svoboda, K. (2000). Estimating intracellular calcium concentrations and buffering without wavelength ratioing. Biophys. J. 78, 2655–2667. doi: 10.1016/S0006-3495(00)76809-3
Markram, H., Helm, P. J., and Sakmann, B. (1995). Dendritic calcium transients evoked by single back-propagating action potentials in rat neocortical pyramidal neurons. J. Physiol. 485(Pt 1), 1–20. doi: 10.1113/jphysiol.1995.sp020708
Markram, H., Lübke, J., Frotscher, M., and Sakmann, B. (1997). Regulation of synaptic efficacy by coincidence of postsynaptic APs and EPSPs. Science 275, 213–215. doi: 10.1126/science.275.5297.213
Markram, H., Roth, A., and Helmchen, F. (1998). Competitive calcium binding: implications for dendritic calcium signaling. J. Comput. Neurosci. 5, 331–348. doi: 10.1023/A:1008891229546
Means, S., Smith, A. J., Shepherd, J., Shadid, J., Fowler, J., Wojcikiewicz, R. J., et al. (2006). Reaction diffusion modeling of calcium dynamics with realistic ER geometry. Biophys. J. 91, 537–557. doi: 10.1529/biophysj.105.075036
Mishchenko, Y., Hu, T., Spacek, J., Mendenhall, J., Harris, K. M., and Chklovskii, D. B. (2010). Ultrastructural analysis of hippocampal neuropil from the connectomics perspective. Neuron 67, 1009–1020. doi: 10.1016/j.neuron.2010.08.014
Müller, A., Kukley, M., Stausberg, P., Beck, H., Muller, W., and Dietrich, D. (2005). Endogenous Ca2C buffer concentration and Ca2C microdomains in hippocampal neurons. J. Neurosci. 25, 558–565. doi: 10.1523/JNEUROSCI.3799-04.2005
Nagerl, U. V., Novo, D., Mody, I., and Vergara, J. L. (2000). Binding kinetics of calbindin-D28k determined by flash photolysis of caged Ca2C. Biophys. J. 79, 3009–3018. doi: 10.1016/S0006-3495(00)76537-4
Naraghi, M. (1997). T-jump study of calcium binding kinetics of calcium chelators. Cell Calcium 22, 255–268. doi: 10.1016/S0143-4160(97)90064-6
Network Pathway Analysis Subgroup of the Psychiatric Genomics, C. (2015). Psychiatric genome-wide association study analyses implicate neuronal, immune and histone pathways. Nat. Neurosci. 18, 199–209. doi: 10.1038/nn.3922
Neher, E., and Augustine, G. J. (1992). Calcium gradients and buffers in bovine chromaffin cells. J. Physiol. 450, 273–301. doi: 10.1113/jphysiol.1992.sp019127
Ngo-Anh, T. J., Bloodgood, B. L., Lin, M., Sabatini, B. L., Maylie, J., and Adelman, J. P. (2005). SK channels and NMDA receptors form a Ca2C-mediated feedback loop in dendritic spines. Nat. Neurosci. 8, 642–649. doi: 10.1038/nn1449
Nusser, Z., Lujan, R., Laube, G., Roberts, J. D. B., Molnar, E., and Somogyi, P. (1998). Cell type and pathway dependence of synaptic AMPA receptor number and variability in the hippocampus. Neuron 21, 545–559. doi: 10.1016/S0896-6273(00)80565-6
Otis, T. S., and Jahr, C. E. (1998). Anion currents and predicted glutamate flux through a neuronal glutamate transporter. J. Neurosci. 18, 7099–7110.
Penheiter, A. R., Bajzer, Z., Filoteo, A. G., Thorogate, R., Török, K., and Caride, A. J. (2003). A model for the activation of plasma membrane calcium pump isoform 4b by calmodulin. Biochemistry 42, 12115–12124. doi: 10.1021/bi027098C
Penmatsa, A., Wang, K. H., and Gouaux, E. (2013). X-ray structure of dopamine transporter elucidates antidepressant mechanism. Nature 503, 85–90. doi: 10.1038/nature12533
Pinto, D., Pagnamenta, A. T., Klei, L., Anney, R., Merico, D., Regan, R., et al. (2010). Functional impact of global rare copy number variation in autism spectrum disorders. Nature 466, 368–372. doi: 10.1038/nature09146
Plant, K., Pelkey, K. A., Bortolotto, Z. A., Morita, D., Terashima, A., McBain, C. J., et al. (2006). Transient incorporation of native GluR2-lacking AMPA receptors during hippocampal long-term potentiation. Nat. Neurosci. 9, 602–604. doi: 10.1038/nn1678
Quinn, P., Griffiths, G., and Warren, G. (1984). Density of newly synthesized plasma membrane proteins in intracellular membranes II. Biochemical studies. J. Cell Biol. 98, 2142–2147. doi: 10.1083/jcb.98.6.2142
Racca, C., Stephenson, F. A., Streit, P., Roberts, J. D., and Somogyi, P. (2000). NMDA receptor content of synapses in stratum radiatum of the hippocampal CA1 area. J. Neurosci. 20, 2512–2522.
Sabatini, B. L., Oertner, T. G., and Svoboda, K. (2002). The life cycle of Ca2C ions in dendritic spines. Neuron 33, 439–452. doi: 10.1016/S0896-6273(02)00573-1
Sabatini, B. L., and Svoboda, K. (2000). Analysis of calcium channels in single spines using optical fluctuation analysis. Nature 408, 589–593. doi: 10.1038/35046076
Scheuss, V., Yasuda, R., Sobczyk, A., and Svoboda, K. (2006). Nonlinear [Ca2C] signaling in dendrites and spines caused by activity-dependent depression of Ca2C extrusion. J. Neurosci. 26, 8183–8194. doi: 10.1523/JNEUROSCI.1962-06.2006
Selkoe, D. J. (2002). Alzheimer's disease is a synaptic failure. Science 298, 789–791. doi: 10.1126/science.1074069
Sjöström, P. J., and Nelson, S. B. (2002). Spike timing, calcium signals and synaptic plasticity. Curr. Opin. Neurobiol. 12, 305–314. doi: 10.1016/S0959-4388(02)00325-2
Sklar, P., Ripke, S., Scott, L. J., Andreassen, O. A., Cichon, S., Craddock, N., et al. (2011). Large-scale genome-wide association analysis of bipolar disorder identifies a new susceptibility locus near ODZ4. Nat. Genet. 43, 977–983. doi: 10.1038/ng.943
Sorra, K. E., and Harris, K. M. (2000). Overview on the structure, composition, function, development, and plasticity of hippocampal dendritic spines. Hippocampus 10, 501–511. doi: 10.1002/1098-1063(2000)10:5<501::AID-HIPO1>3.0.CO;2-T
Spacek, J., and Harris, K. M. (1997). Three-dimensional organization of smooth endoplasmic reticulum in hippocampal CA1 dendrites and dendritic spines of the immature and mature rat. J. Neurosci. 17, 190–203.
Spruston, N., Jonas, P., and Sakmann, B. (1995). Dendritic glutamate receptor channels in rat hippocampal CA3 and CA1 pyramidal neurons. J. Physiol. (Lond). 482, 325–352. doi: 10.1113/jphysiol.1995.sp020521
Stauffer, T. P., Guerini, D., and Carafoli, E. (1995). Tissue distribution of the four gene products of the plasma membrane Ca2C pump. A study using specific antibodies. J. Biol. Chem. 270, 12184–12190. doi: 10.1074/jbc.270.20.12184
Stocca, G., and Vicini, S. (1998). Increased contribution of NR2A subunit to synaptic NMDA receptors in developing rat cortical neurons. J. Physiol. 507(Pt 1), 13–24. doi: 10.1111/j.1469-7793.1998.013bu.x
Takumi, Y., Ramirez-León, V., Laake, P., Rinvik, E., and Ottersen, O. P. (1999). Different modes of expression of AMPA and NMDA receptors in hippocampal synapses. Nat. Neurosci. 2, 618–624. doi: 10.1038/10172
Vargas-Caballero, M., and Robinson, H. P. (2004). Fast and slow voltage-dependent dynamics of magnesium block in the NMDA receptor: the asymmetric trapping block model. J. Neurosci. 24, 6171–6180. doi: 10.1523/JNEUROSCI.1380-04.2004
Ventura, R., and Harris, K. M. (1999). Three-dimensional relationships between hippocampal synapses and astrocytes. J. Neurosci. 19, 6897–6906.
Wadiche, J. I., Arriza, J. L., Amara, S. G., and Kavanaugh, M. P. (1995). Kinetics of a human glutamate transporter. Neuron 14, 1019–1027. doi: 10.1016/0896-6273(95)90340-2
Wadiche, J. I., and Kavanaugh, M. P. (1998). Macroscopic and microscopic properties of a cloned glutamate transporter/chloride channel. J. Neurosci. 18, 7650–7661.
Wang, G. J., Chung, H. J., Schnuer, J., Pratt, K., Zable, A. C., Kavanaugh, M. P., et al. (1998). High affinity glutamate transport in rat cortical neurons in culture. Mol. Pharmacol. 53, 88–96.
Witcher, M. R., Kirov, S. A., and Harris, K. M. (2007). Plasticity of perisynaptic astroglia during synaptogenesis in the mature rat hippocampus. Glia 55, 13–23. doi: 10.1002/glia.20415
Wuytack, F., Dode, L., Baba-Aissa, F., and Raeymaekers, L. (1995). The SERCA3-type of organellar Ca2C pumps. Biosci. Rep. 15, 299–306. doi: 10.1007/BF01788362
Yasuda, R., Sabatini, B. L., and Svoboda, K. (2003). Plasticity of calcium channels in dendritic spines. Nat. Neurosci. 6, 948–955. doi: 10.1038/nn1112
Keywords: dendritic spines, calcium pumps, calcium channels, synaptic calcium, synaptic plasticity
Citation: Bartol TM, Keller DX, Kinney JP, Bajaj CL, Harris KM, Sejnowski TJ and Kennedy MB (2015) Computational reconstitution of spine calcium transients from individual proteins. Front. Synaptic Neurosci. 7:17. doi: 10.3389/fnsyn.2015.00017
Received: 19 June 2015; Accepted: 11 September 2015;
Published: 07 October 2015.
Edited by:
Per Jesper Sjöström, The Research Institute of the McGill University Health Centre, CanadaReviewed by:
Roberto Araya, University of Montreal, CanadaVictor Matveev, New Jersey Institute of Technology, USA
Copyright © 2015 Bartol, Keller, Kinney, Bajaj, Harris, Sejnowski and Kennedy. This is an open-access article distributed under the terms of the Creative Commons Attribution License (CC BY). The use, distribution or reproduction in other forums is permitted, provided the original author(s) or licensor are credited and that the original publication in this journal is cited, in accordance with accepted academic practice. No use, distribution or reproduction is permitted which does not comply with these terms.
*Correspondence: Thomas M. Bartol, Computational Neurobiology Laboratory, c/o The Salk Institute, 10010 North Torrey Pines Road, La Jolla, CA 92037, USA, bartol@salk.edu;
Mary B. Kennedy, Division of Biology and Biological Engineering, California Institute of Technology, MC: 216-76, Pasadena, CA 91125, USA, kennedym@its.caltech.edu
†These authors have contributed equally to this work.