Distinct synaptic and neurochemical changes to the granule cell-CA3 projection in Bassoon mutant mice
 Sandra Dieni
 Sigrun Nestel
 Mirjam Sibbe
 Michael Frotscher
 Sabine Hellwig
- 1Neurochemistry Laboratory, Department of Molecular Psychiatry, University Hospital Freiburg, Freiburg, Germany
- 2Department of Neuroanatomy, Institute of Anatomy and Cell Biology, University of Freiburg, Freiburg, Germany
- 3Institute for Structural Neurobiology, Center for Molecular Neurobiology Hamburg, Hamburg, Germany
Proper synaptic function depends on a finely-tuned balance between events such as protein synthesis and structural organization. In particular, the functional loss of just one synaptic-related protein can have a profound impact on overall neuronal network function. To this end, we used a mutant mouse model harboring a mutated form of the presynaptic scaffolding protein Bassoon (Bsn), which is phenotypically characterized by: (i) spontaneous generalized epileptic seizure activity, representing a chronically-imbalanced neuronal network; and (ii) a dramatic increase in hippocampal brain-derived neurotrophic factor (BDNF) protein concentration, a key player in synaptic plasticity. Detailed morphological and neurochemical analyses revealed that the increased BDNF levels are associated with: (i) modified neuropeptide distribution; (ii) perturbed expression of selected markers of synaptic activation or plasticity; (iii) subtle changes to microglial structure; and (iv) morphological alterations to the mossy fiber (MF) synapse. These findings emphasize the important contribution of Bassoon protein to normal hippocampal function, and further characterize the Bsn-mutant as a useful model for studying the effects of chronic changes to network activity.
Introduction
Proper hippocampal function depends on a finely-tuned balance between excitation and inhibition within the neuronal network, where any changes to this setting can have secondary effects on events such as protein synthesis and structural organization. A case in point is a genetic mouse model that is deficient in the full-length form (420 kD) of the presynaptic scaffolding protein Bassoon, but instead expresses a shorter form of the protein (180 kD) lacking the regions encoded by exons 4 and 5 of the Bassoon (Bsn) gene (Altrock et al., 2003). It is assumed that many functions of Bsn are abrogated in this mutant, with major effects on synaptic transmission that manifest phenotypically as episodic generalized seizures in mature mutant mice (Altrock et al., 2003; Ghiglieri et al., 2009). This renders the Bsn-mutant mouse model as a means by which to monitor the effects of perturbed neuronal network activity.
In addition to the changes in synaptic function, macroscopic analyses of the Bsn-mutant brain have demonstrated functional and structural alterations to cortical structures. Manganese-enhanced magnetic resonance (MR) imaging and metabolic labeling with [14C]-2D-deoxyglucose revealed altered cortical activation patterns in Bsn-mutant mice (Angenstein et al., 2007), while a follow-up MR spectroscopy study uncovered a reduction in neuronal density in cortical layer V but found an overall increase in cortical and hippocampal volumes (Angenstein et al., 2008). A more detailed analysis of the Bsn-mutant hippocampus at the microscopic level confirmed that hippocampal volume is enlarged, with stereological quantification of principal neurons in the dentate gyrus (DG) and Ammon’s horn revealing enhanced neurogenesis and reduced apoptosis (Heyden et al., 2011). Changes in certain aspects of hippocampal plasticity were identified as potential correlates of the epileptic seizure activity in Bsn-mutant mice, where CA1 neurons were found to harbor abnormal dendrite structure and failed to elicit long term potentiation (LTP; Sgobio et al., 2010). Furthermore, mossy fiber boutons (MFBs), which form a major synapse with CA3 complex spines and play an important role in hippocampal plasticity (Evstratova and Tóth, 2014), were found to undergo an abnormal course of physiological maturation during the postnatal period (Lanore et al., 2010).
One of the most striking neurochemical changes identified at the subcellular level in the Bsn-mutant brain thus far is the dramatic increase in hippocampal brain-derived neurotrophic factor (BDNF) protein concentration (Heyden et al., 2011). This was subsequently confirmed at the immunohistochemical level, where intense BDNF immunoreactivity was confined to hippocampal neuropil layers and largely corresponded to increased presynaptic BDNF storage in MFBs (Dieni et al., 2012).
Given the well-defined role of BDNF in the regulation of synaptic plasticity and transmission in the adult brain (reviewed in Park and Poo, 2013), the present study investigated whether other mechanisms known to modulate certain aspects of synaptic plasticity were also affected by the altered physiological environment that manifests in the Bsn-mutant hippocampus. Immunohistochemical and morphometric analyses of hippocampi at the light and electron microscopic level revealed that the increased presynaptic levels of BDNF in Bsn-mutants are accompanied by changes in the expression of other key neurochemical and structural markers of neuronal plasticity.
Materials and Methods
Mouse Lines
Brain tissue was derived from Bsn-mutant mice, a mouse line lacking the full-length (420 kD) form of Bassoon (BsnΔEX4/5; see Altrock et al., 2003). Wild-type (WT) littermates were used as controls. All experiments were performed in accordance with the institutional guidelines of the University of Freiburg. The use of animals was approved by the Animal Welfare Ethics Committee from the Regional Council of Freiburg.
Preparation of Tissue for Immunostaining
Eight-week-old mice (n = 7 per genotype) were transcardially perfused with 0.9% NaCl followed by a mixture of 4% PFA and 0.1% glutaraldehyde in 0.1 M phosphate buffer (PB), pH 7.4. Brains were removed and post-fixed with 4% PFA in 0.1 M PB for 1 h before thorough washing in 0.1 M PB. Coronal sections (50 μm) were cut along the septotemporal axis of the hippocampus on a vibratome (Leica) and further processed for either immunohistochemistry or pre-embedding immunogold labeling.
Antibodies for Immunostaining
BDNF was detected with the mouse monoclonal BDNF antibody Mab#9 (anti-BDNF; Kolbeck et al., 1999) directed against the mature domain of BDNF (Dieni et al., 2012). For postsynaptic labeling, a rabbit polyclonal antibody against Synaptopodin (“anti-synpo”; #163002; Synaptic Systems), and a guinea pig polyclonal antibody against activity-related cytoskeletal protein (“anti-Arc”; #156005; Synaptic Systems) were used. For labeling of neuropeptides within the MF projection, rabbit polyclonal antibodies against Met-enkephalin (“anti–Met-enk”; Millipore) and Cholecystokinin (anti-CCK; #P06307; Millipore) were applied. Microglia were detected with a rabbit polyclonal antibody against ionized calcium-binding adaptor molecule 1 (“anti-Iba1”; #019-19741; Wako Chemicals). Reelin was detected with a mouse monoclonal Reelin (clone G10) antibody (“anti-Reelin”; #MAB5364; Millipore), while for Calbindin-D28K (CB) labeling, a polyclonal rabbit antibody (“anti-CB”; #CB-38a; Swant) was used. 4′6-Diamidine-2-phenylindol (DAPI, 1:1000, 1 mg/mL solution, ThermoScientific) was used for nuclear counterstaining.
Immunofluorescence
Antigen retrieval (30 min in sodium citrate buffer (pH 8.5) at 80°C; Jiao et al., 1999) was performed on WT and Bsn-mutant sections prior to antibody application. The staining protocol for all antibodies was identical, and 50 mM tris-buffered saline (TBS, pH 7.4) was used throughout to wash the sections. Sections were blocked either with 3% M.O.M. (Mouse-on-Mouse blocking serum, Vector Laboratories; for anti-BDNF only) or 20% normal donkey serum (NDS) for 1 h at RT. Primary antibodies were diluted in a solution of 3% bovine serum albumin (BSA), 2% NDS, and 0.2% Triton X-100 in TBS to yield the following final concentrations/dilutions: 10 μg/ml anti-BDNF, 2 μg/ml anti-Arc, 1:000 anti-synaptopodin, 3 μg/ml anti–Met-enk, 1:2000 anti-CCK, 1:1000 anti-Iba1, 1:250 anti-Reelin, 1:1000 anti-Calbindin and 1:1000 anti-Iba1. Sections were incubated for 1–3 nights at 4°C in 1–2 primary antibodies. For fluorescent signal detection, the following Alexa Fluor–conjugated secondary antibodies were used: donkey anti–rabbit-488 or -555, donkey anti–mouse-555 or -647, and donkey anti–guinea pig–Cy5 (1:400; all purchased from Millipore, Germany). Labeled sections were mounted onto glass slides and coverslipped with fluorescent mounting medium (Dako).
Confocal Microscopy
Immuno-labeled hippocampal sections were viewed on a Zeiss Axiovert 200 inverted microscope equipped with Plan-Apochromat 20× (numerical aperture, NA: 0.75) or 63× (oil DIC; NA: 1.4) objectives and attached to a spectral confocal laser system (LSM 510, Carl Zeiss) powered by Zeiss LSM 4.2 Meta Software (Carl Zeiss Microimaging, Germany). The tissue was scanned with 488 nm, 543 nm and 633 nm laser lines to detect the corresponding Alexa fluorophores. High resolution images (1024 × 1024 pixels) of optical sections (z-slices) were captured using sequential line (average of 4) scanning. Maximal projection images of confocal z-series (stacks) were generated where indicated in the figure legends. Images were arranged and annotated using Corel Draw 12 software (Corel Corporation).
Quantification and Data Analyses of Immunohistochemistry
Cell Counts
The density of Reelin- or Arc-labeled cells was determined in three coronal sections of septal hippocampus per animal (n = 3–4 animals per genotype). Cell numbers were estimated bilaterally in the DG, and the area of interest was measured using ImageJ 1.40 analysis software (National Institutes of Health). Cell densities are expressed as the number of cells per 100 μm2.
Quantitative Assessment of Met-Enk-, CCK- and Calbindin-Staining Intensity (SI)
Single plane confocal images of each immunohistochemical marker were converted into a black and white binary format in ImageJ, and the relative numbers of black and white pixels within a defined region of interest (ROI) of the MF pathway (i.e., hilus and stratum lucidum, SL) were automatically generated. For each immunohistochemical marker, the ROI area in which the pixels were counted was identical in each section measured. The number of white pixels were deemed proportional to the fluorescence SI, whereby sections with increased immunostaining had a higher fraction of white pixels. The mean percentage of white pixels was calculated for each marker per group.
Assessment of Synaptopodin-SI
Two investigators (SD, SH) blinded to genotype data independently assessed synaptopodin staining intensity (SI) in the entire molecular layer (ML) of the DG, as well as in the inner (IML), middle (MML) and outer (OML) sublayers (n = at least 3–4 animals per genotype) according to an a priori defined score (0 = no staining, 1 = weak SI, 2 = moderate SI, 3 = strong SI). In cases of discrepant ratings, a consensus between both investigators was reached.
Three-Dimensional (3D) Reconstruction of Microglia
Confocal z-scans of hilar Iba-1 positive microglia were acquired through a 40× objective (NA 1.4, oil immersion) at 0.8 μm intervals. Image series were saved in lsm format and opened in NeuronStudio software (Wearne et al., 2005). Each cell (n = 15–20 per genotype) was manually traced using the neurite tool and a 3D model was generated thereafter. An automated Sholl analysis was also performed on each digitized cell.
BDNF Immunogold Electron Microscopy
Fifty micro meter vibratome sections from WT and Bsn-mutants were processed for pre-embedding immunogold labeling as previously described (Dieni et al., 2012). Briefly, sections were snap frozen to increase antigenicity, blocked in 3% M.O.M. and incubated in anti-BDNF (20 μg/ml) for three nights at 4°C. After thorough washing with 50 mM TBS, sections were treated overnight at 4°C with 1.4 nm gold-conjugated mouse IgG (1:100). Bound gold particles were enhanced using a silver intensification kit (HQ Silver; Nanoprobes) and sections were then fixed for 10 min in 1% GA solution. Sections underwent osmification (0.5% OsO4 and 6.86% sucrose in 0.1 M PB) for 40 min, were treated with 1% uranyl acetate in 70% ethanol (EtOH) for 35 min, and dehydrated in increasing grades of EtOH. After washing in propylene oxide, the tissue was embedded in Durcupan (Fluka). Ultrathin sections (60 nm) of CA3 were cut and mounted on formvar-coated copper grids.
Morphometric Analyses of Mossy Fiber Boutons
Mossy Fiber Bouton/CA3 Spine Dimensions
For measurement of MFB profile areas and folding indices, as well as relative spine areas and numbers per bouton, the SL was located in ultrathin sections mounted onto a LEO-906E electron microscope (Zeiss) and optically viewed at a magnification of 6000. Composite digital images (3 × 3) were then captured and assembled using a TRS “sharp-eye” HSC 2048 digital camera system (Schneider Systemtechnik GmbH, Germany) and the “Multiple Image Acquisition” function in AnalySIS acquisition software (Soft Imaging Systems, Olympus, Germany). Captured images from WT (n = 5) and Bsn-mutant (n = 7) sections were opened in the analysis software Cell∧P (Soft Imaging Systems, Olympus, Germany) and MFBs were unambiguously identified according to their well-defined morphology (i.e., high density of synaptic vesicles, numerous synaptic contacts with CA3 complex spines, non-synaptic puncta adherentia at dendritic shafts, relatively large surface area). The perimeter and area of each identified MFB and its associated spines were measured. The folding index of each MFB was then calculated by dividing the area by the perimeter, whereby a relative lower ratio represented a higher degree of folding (Zhao et al., 2012). At least 20 MFBs and 60 spines per animal (WT: n = 5; Bsn: n = 7) were analyzed.
Dense Core Vesicles Distance from Presynaptic Membrane
MFBs containing labeled dense core vesicles (DCV) were then selected for analyses, in which the direct distance to the membrane of each DCV was determined with the straight line measuring tool in Image J. Seventeen BDNF-labeled MFBs in WT mice (n = 5), and 12 labeled MFBs in Bsn-mutants (n = 3) were analyzed.
Data Acquisition and Statistical Analysis
Mean values per animal were calculated for each parameter analyzed and group means (WT vs. Bsn-mutant) were compared. The software package SPSS191 was used for statistical analyses. Statistical differences between groups were assessed using a Student’s t-test (normally-distributed data), or a non-parametric Wilcoxon-test (two-sided). To test for the effects of genotype and distance from soma on microglial morphology, a two-factorial analysis of variance (ANOVA) with post hoc Tukey-Kramer HSD test was applied. In all tests, significance was assigned when p < 0.05. All values are expressed as mean ± SEM.
Results
Met-Enkephalin and Cholecystokinin show Differential Changes in Immunohistochemical Distribution in Bsn-Mutants
Based on the observation that Bsn-mutants display a dramatic increase in hippocampal BDNF protein concentration (Heyden et al., 2011), particularly in the MF projection pathway (Dieni et al., 2012), it was of interest to investigate whether the immunohistochemical expression of two other small neuropeptides that are normally localized to MFs and known to modulate certain aspects of neuronal excitability was also affected in the Bsn-mutant. Hippocampal sections were first stained with antibodies against the methionine form of enkephalin (Met-enk), a small opioid that is derived from pro-enkephalin and stored in DCVs (Cheng et al., 1995). In WT hippocampi, Met-enk immunoreactivity (-IR; Figure 1C) showed a similar distribution pattern to BDNF (Figure 1A) in SL, although it appeared to be confined to a smaller subset of MFBs (Figures 1C,E,G). In Bsn-mutant mice, Met-enk-IR showed an upregulation in SL (Figure 1D), similar to BDNF-IR (Figure 1B). This difference was confirmed by quantifying the immunofluorescent signal in terms of pixel intensity in the MF pathway (proportion of white pixels in WT: 34.7 ± 4.4% vs. Bsn: 74.7 ± 3.1%; 2-sided t-test: p < 0.0001). Image overlay revealed a higher degree of overlap in comparison to WT sections between Met-enk-positive (+) and BDNF+ puncta in SL (Figure 1F), which at higher resolution was shown to correspond to a greater proportion of BDNF+/Met-enk+ MFB profiles (Figure 1H). Therefore, Met-enk shows a strong increase in SI in parallel with BDNF, thus leading to a putative increase in the number of MFBs that contain both peptides. This suggests that BDNF and Met-enk peptides might respond to similar stimuli for their transcription and release.
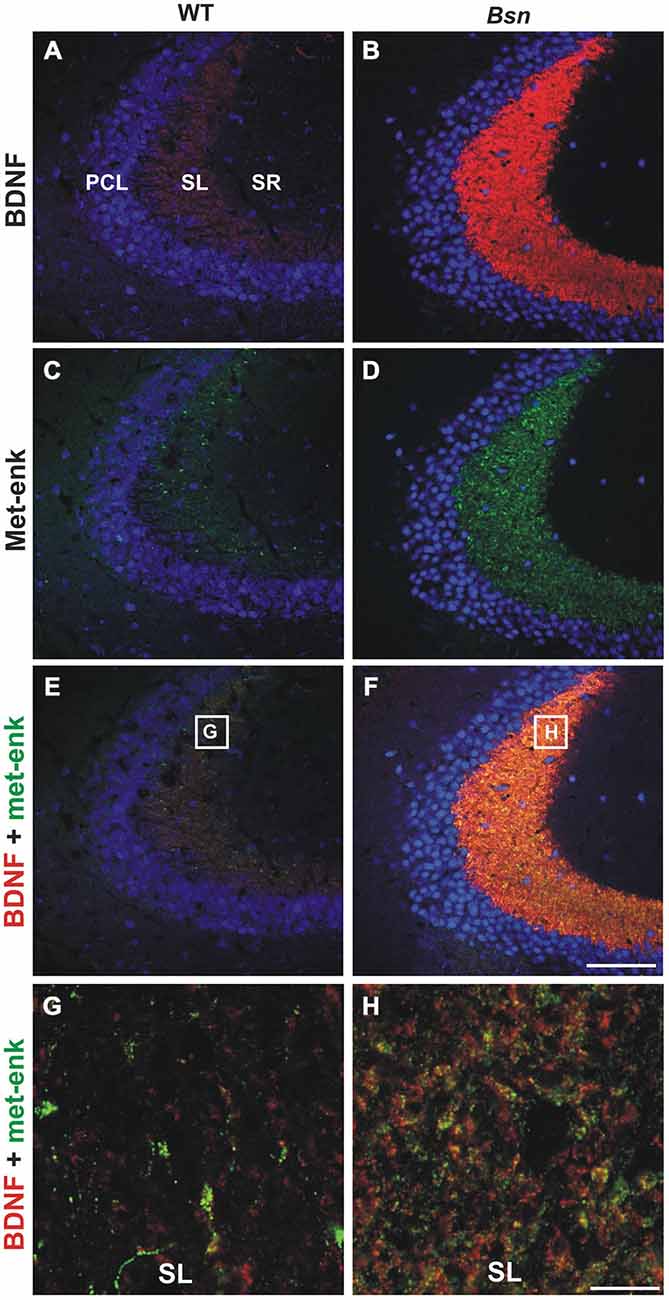
Figure 1. Met-enkephalin-IR and brain-derived neurotrophic factor (BDNF) are upregulated in parallel in the hippocampus of Bassoon mutants. BDNF (red)/met-enk (green) co-labeling in coronal hippocampal sections (CA3) from adult wild-type (WT) mice (A,C,E) and Bsn-mutants (B,D,F). Note the concurrent upregulation of (B) BDNF and (D) Met-enk in SL of Bsn-mutants compared to WT (A,C). High resolution view of SL reveals an increased proportion of BDNF- and Met-enk-double-labeled MFBs in (H) Bsn-mutant compared to (G) WT mice. Nuclei are labeled with DAPI (blue). Scale bars: A–F: 100 μm; G,H: 10 μm. Abbreviations: PCL, pyramidal cell layer of CA3; SL, stratum lucidum; SR, stratum radiatum.
Confocal scanning was next performed on hippocampal sections labeled with antibodies against cholecystokinin (CCK), a hormone peptide that is not only expressed in hippocampal interneurons but also transported along the MF pathway of the ventral hippocampus in mice (Gall et al., 1986). CCK is localized to a subset of MFB profiles (Figure 2B) but is not co-expressed with BDNF protein (Figures 2A,C; see also Dieni et al., 2012). In contrast to BDNF (Figure 2D) and Met-enk (Figure 1D), a clear selective loss of CCK-IR was observed in the hilus (Figures 2E,F, upper images) and SL (Figures 2E,F, lower images) of Bsn-mutants compared to control mice (Figures 2B,C). Quantification of SI in MFs confirmed the downregulation of CCK-IR in Bsn-mutants (proportion of white pixels in WT: 65.5 ± 4.0% vs. Bsn: 4.2 ± 1.7%; 2-sided t-test: p < 0.0001). Therefore, CCK appears to be depleted from Bsn MFBs, despite the elevated levels of BDNF and Met-enk.
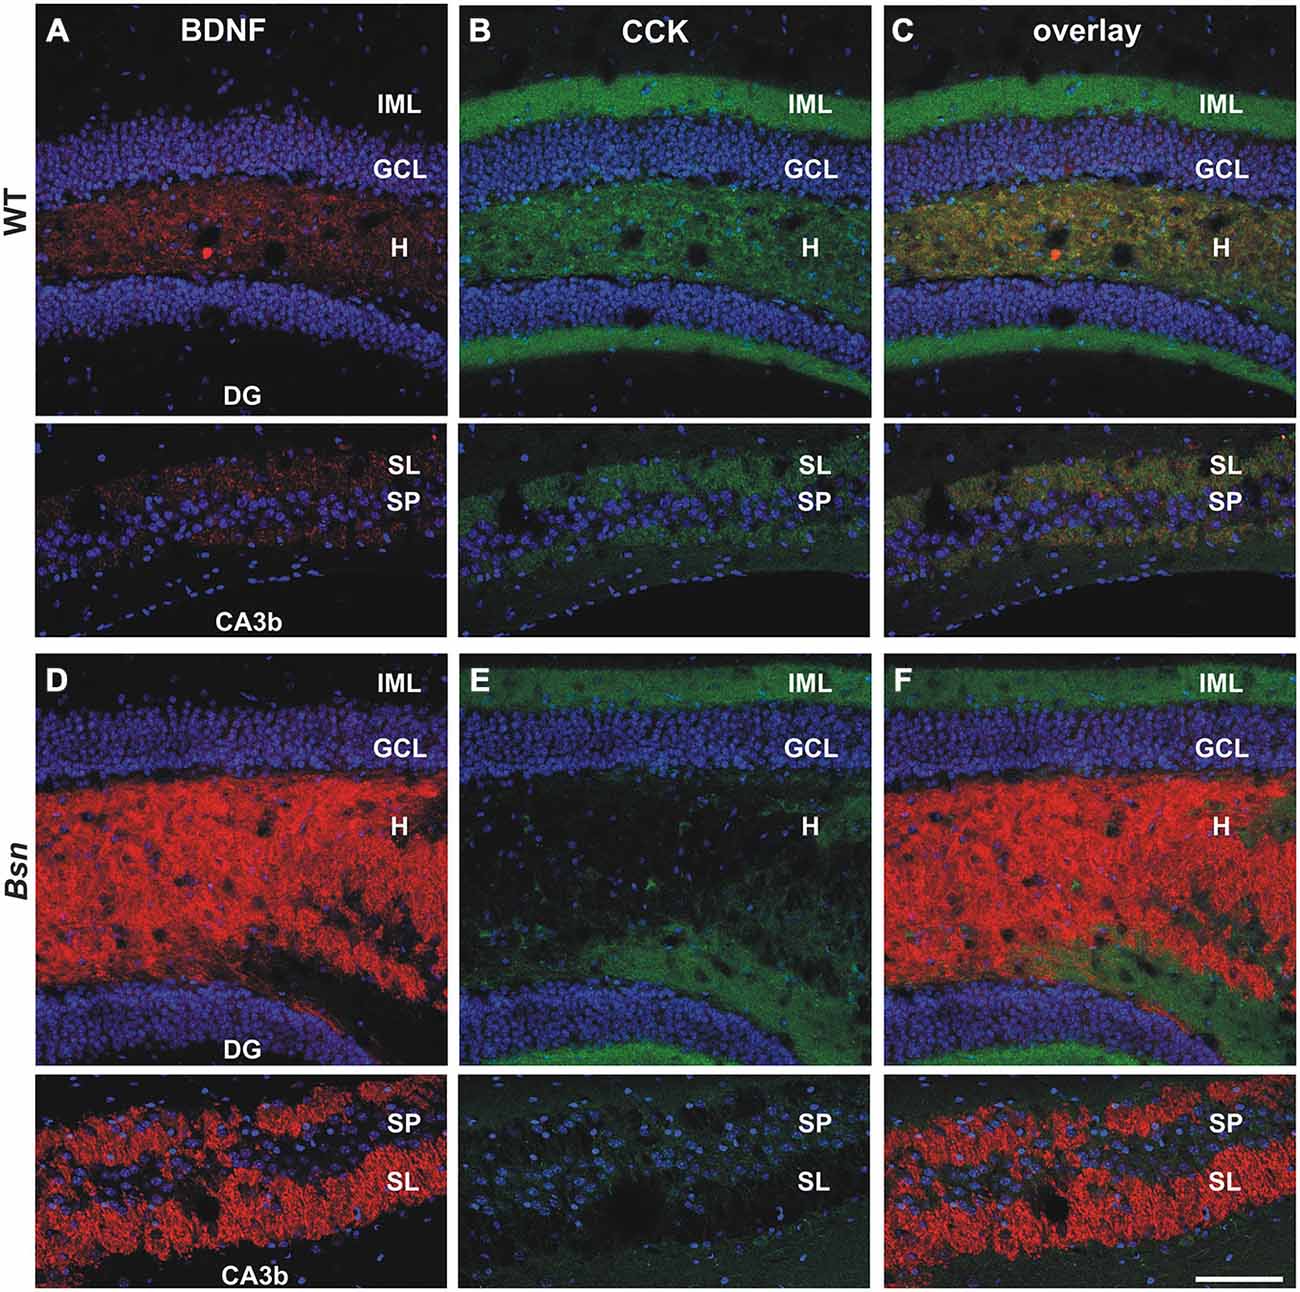
Figure 2. Selective loss of CCK-IR in the mossy fiber (MF) projection pathway of Bassoon mutants. Co-labeling with antibodies against BDNF (red) and CCK (green) revealed a selective loss of CCK-IR in the MF projection pathway of Bsn-mutants. (A) BDNF and (B) CCK-IR in the dentate gyrus (DG) (upper images) and CA3b (lower images) regions of an adult WT mouse. (C) Merged image of BDNF/CCK-IR reveals segregation of the two neuropeptide signals throughout the DG and CA3. Whereas the intensity of (D) BDNF-IR is elevated in the Bsn-mutant hilus and SL, there is a dramatic loss of (E) CCK-IR in granule cell axon terminals (i.e., MFBs) in the hilus and SL. (F) Merged image of BDNF/CCK-IR emphasizes upregulation of BDNF-IR, and corresponding down-regulation of CCK-IR in the hilus and SL of Bsn-mutants. Nuclei are labeled with DAPI (blue). Scale bar: 100 μm. Abbreviations: IML, inner molecular layer; GCL, granule cell layer; H, hilus; DG, dentate gyrus; SL, Stratum Lucidum; SP, Stratum Pyramidale.
The neuropeptide staining data therefore suggest that not all small neuropeptides are governed by the same regulation mechanisms, and that the normal relative proportions of neuropeptides are perturbed in Bsn-mutants.
Calbindin Expression is Reduced in the Hippocampus of Bsn-Mutants
CB is a calcium-binding protein expressed in subsets of neurons including dentate granule cells, and serves as a useful marker of cell viability (Celio, 1990). Moreover, increased neuronal activity in Bsn-mutant mice is likely to be accompanied by increased NMDA-mediated calcium influxes (Fujikawa, 2005). Therefore, we compared CB-IR between WT animals and Bsn-mutants. Bsn-mutant mice (Figure 3B) displayed a marked reduction in granule cell CB-IR compared to WT animals (Figure 3A), particularly in the outer- and innermost bands of the layer (Figures 3C,D). This was accompanied by lower CB-IR within the MF projection pathway (proportion of white pixels in WT: 70.2 ± 6.9% vs. Bsn: 10.3 ± 3.6%; 2-sided t-test: p < 0.0001; Figures 3E,F). The marked loss of CB-IR in the DG of Bsn-mutants therefore points to a potential compromise in granule cell calcium homeostasis and ultimately cell function.
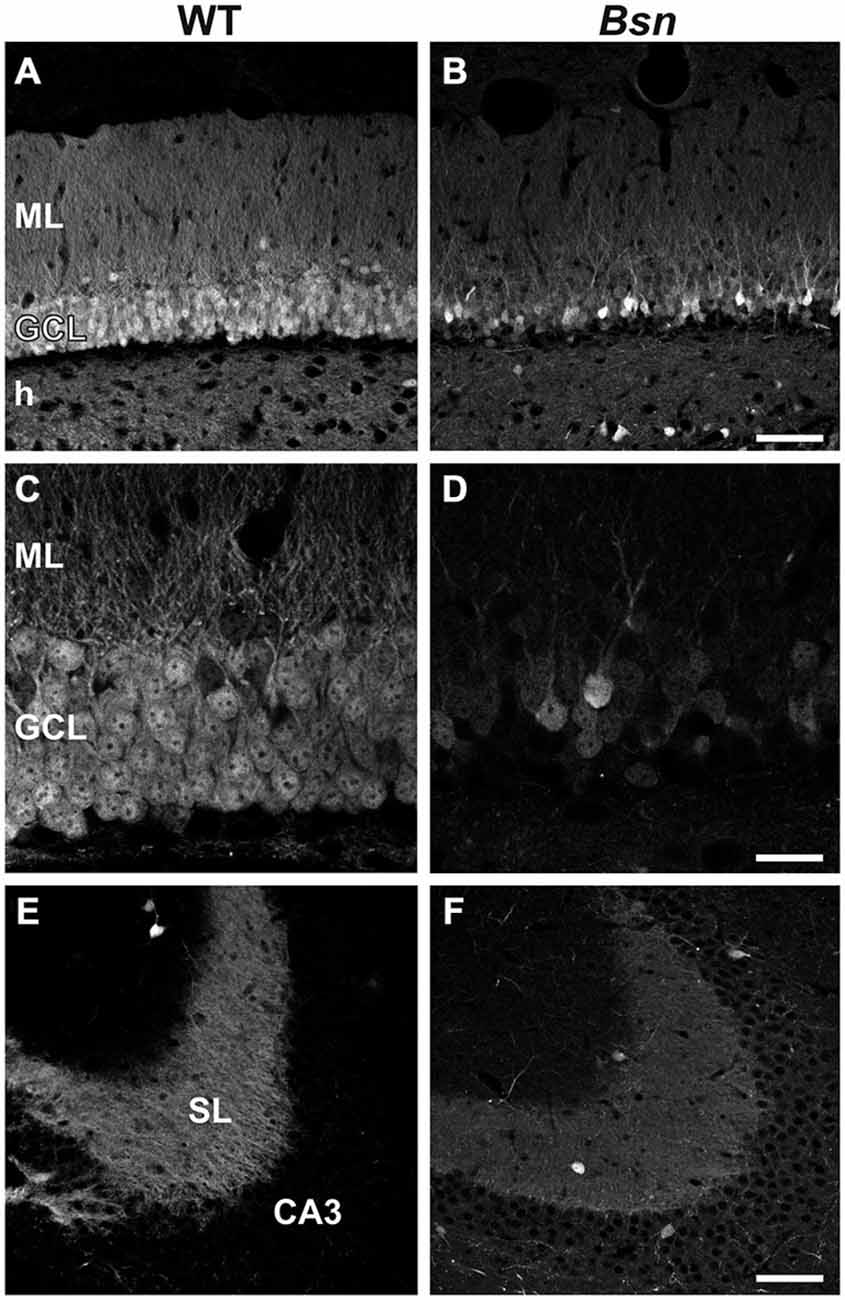
Figure 3. Loss of Calbindin immunoreactivity in Bsn-mutant dentate granule cells. (A) Normal distribution of CB-IR in the WT DG. Note uniform distribution of immunoreactivity throughout the granule cell bodies and their associated dendrites and MFs in the ML and hilus, respectively. (B) Loss of CB-IR in granule cells, dendrites and MFs in the Bsn-mutant DG. Note that the outer GCL is particularly affected by this loss. (C,D) Higher magnification view of the GCL and ML in WT vs. Bsn-mutants. (E) Strong, uniform CB-IR in MFs contained within SL of hippocampal area CA3. Comparison with CB-IR in the (F) Bsn-mutant reveals a downregulation in staining intensity (SI), indicating reduced CB protein content in MFs. Scale bars: A,B,E,F = 100 μm; C,D = 20 μm. Abbreviations: ML, molecular layer; GCL, granule cell layer; h, hilus; SL, stratum lucidum.
Alterations in the Expression Patterns of Synaptic Activation Markers
It is well established that BDNF transcription is activity-dependent and through its predominant presynaptic localization (Andreska et al., 2014), ultimately promotes synaptic plasticity (reviewed in Park and Poo, 2013). Given that BDNF levels are increased in the Bsn-mutants, it was important to determine whether this was associated with an upregulation of other markers normally influenced by elevated synaptic activity. Therefore, we first examined sections labeled with antibodies against Arc/Arg3.1, an immediate early gene (IEG) whose expression is increased in parallel with synaptic activity, whereby the mRNA product is locally translated into protein both in somata and dendrites (Lyford et al., 1995). In the DG of WT animals, Arc protein was distributed in a subset of granule cells, where the immunoreactivity extended from the cell body to the most distal parts of the dendrites (Figure 4A). Despite the dramatic increase in BDNF protein in Bsn-mutants, Arc expression was surprisingly sparse, with only scattered granule cells showing weak somal staining and minimal dendritic labeling (Figure 4B). Quantification of Arc+ cell density confirmed this reduction in staining in Bsn-mutants compared to WT animals (Bsn-mutant 0.68 ± 0.16 vs. WT: 3.83 ± 0.81 cells per 100 μm, p = 0.001; two-sided Student’s t-test; Figure 4C).
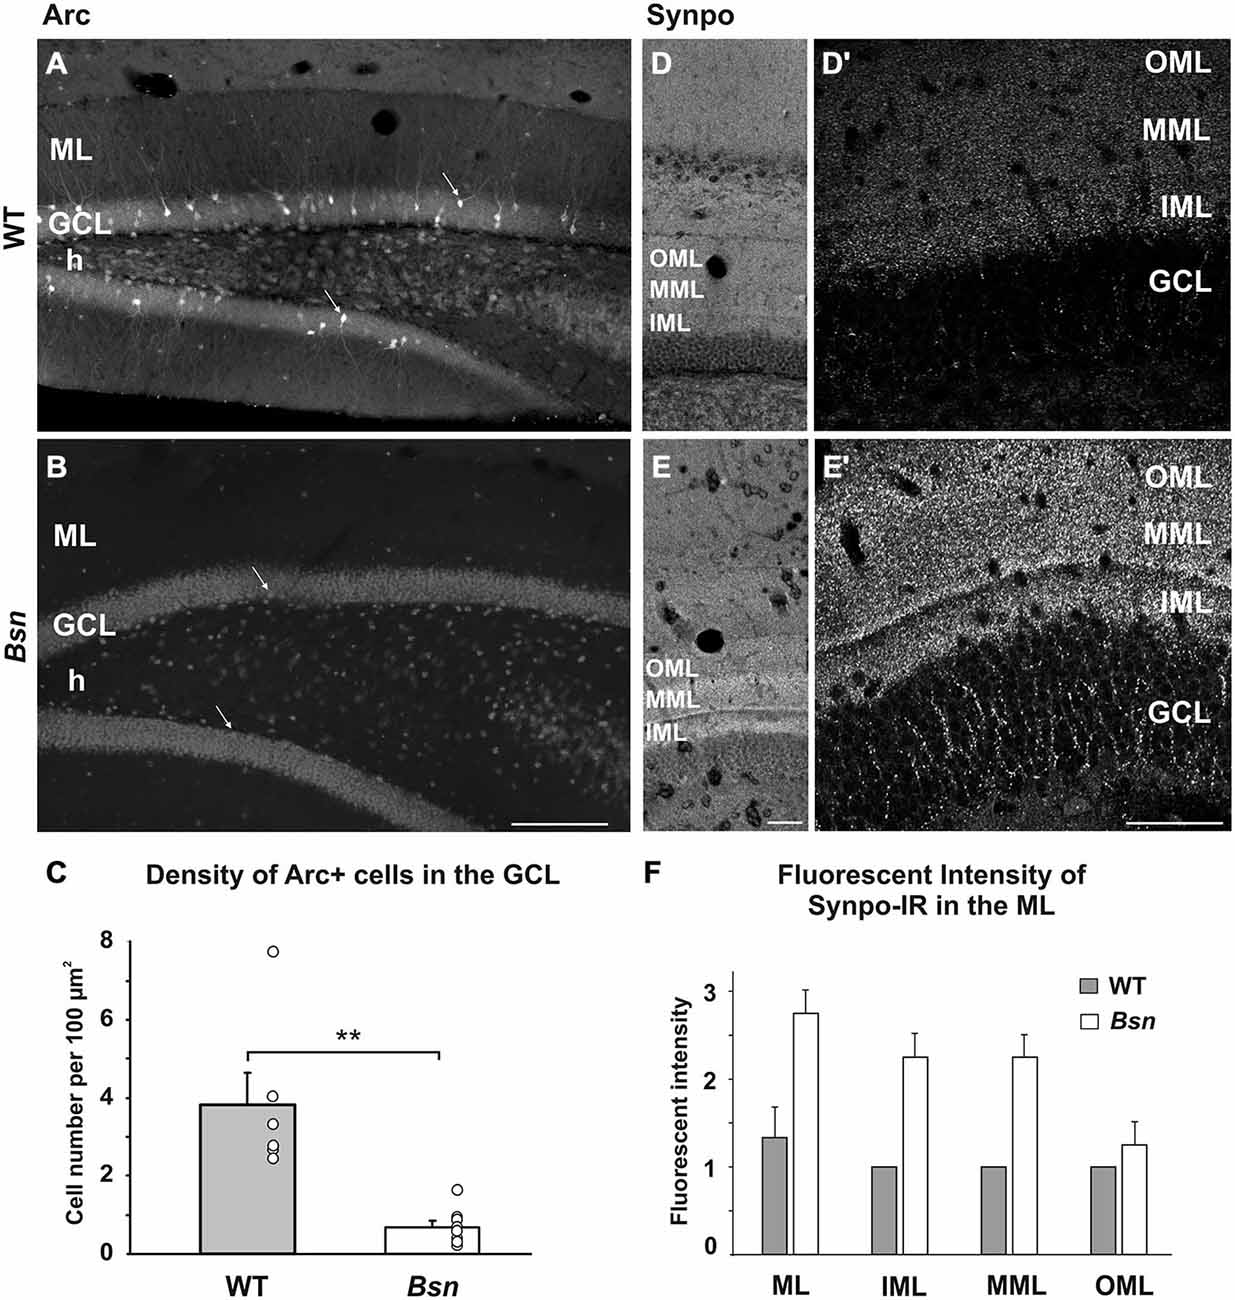
Figure 4. Differential effects of neuronal network hyperexcitability on markers of synaptic plasticity. (A–C) Density of Arc+ cells in the DG. (A) Varying degrees of Arc-staining intensity were found in a subset of granule cells (arrows) in the WT DG. (B) Only a few Arc+ granule cells were observed in the Bsn-mutant. (C) Quantification of Arc+ cells in the DG revealed a significant reduction in Bsn-mutants compared to WT mice. (D–F) SI of Synpo-IR in the DG. (D) Uniform distribution of Synpo+ puncta across the sublayers of the ML. (D′) Delineation between the IML and MML can be observed at higher magnification in WT mice. (E) Increased Synpo-IR intensity of the MML and IML in the Bsn-mutant DG. Note the even stronger delineation between the IML and MML in (E′). Synpo staining in the GCL is also increased. (F) Grading of Synpo-IR intensity confirms a relative increase in fluorescence intensity in the inner two thirds of the ML in Bsn, while no change was observed between genotypes in the OML (Intensity scale: 0, no signal; 1, weak; 2, moderate; 3, strong signal). Data are shown as mean ± SEM. **p < 0.01. Scale bars: A,B = 200 μm; D,D′,E,E′: 100 μm. Abbreviations: ML, molecular layer; GCL, granule cell layer; h, hilus, Synpo, Synaptopodin; OML, outer molecular layer; MML, middle molecular layer; IML, inner molecular layer.
Synaptopodin is an actin-associated protein that is localized to the spine apparatus in excitatory neurons (reviewed in Deller et al., 2007) and distributed in a laminar pattern within the hippocampus (Bas Orth et al., 2005). In the DG of WT sections labeled with synaptopodin antibodies, immunoreactive puncta corresponding to labeled spines on granule cell dendrites were distributed throughout the entire ML, with a staining gradient ranging from stronger to weaker across the three sublayers of the ML (Figure 4D). A clear delineation between the inner (IML) and middle molecular layers (MML) was also observed (Figure 4D′; Bas Orth et al., 2005). In the Bsn-mutant DG, synaptopodin SI was markedly increased in comparison to WT sections (Figure 4E), with larger fluorescent puncta and an even stronger delineation between the IML and MML (Figure 4E′). Qualitative assessment of synaptopodin SI within the ML confirmed that synaptopodin-IR is markedly increased in this region of the Bsn-mutant hippocampus (Figure 4F). These data suggest that the chronic imbalance in neuronal activity in these mutants leads to the upregulation of a post-synaptic actin-associated protein, which might correspond to an increase in spine size or number in this region.
Reelin Protein Distribution is Unchanged in the DG of Bsn-Mutants
Reelin is an extracellular matrix protein well-characterized for its essential role in cortical lamination (Frotscher, 2010). In the mature brain, Reelin is synthesized by a subpopulation of GABAergic interneurons (Drakew et al., 1998; Pesold et al., 1998). Reelin continues to play a role beyond development and has been implicated in the modulation of neurotransmission (Hellwig et al., 2011), NMDA receptor activity (Chen et al., 2005) and neurogenesis (Sibbe et al., 2015), and may underlie the granule cell dispersion (GCD) that characterizes the DG in temporal lobe epilepsy (TLE; Haas et al., 2002). To determine whether Reelin expression by inhibitory GABAergic interneurons was affected in the present model of neuronal hyperactivity, the DGs of Reelin-labeled hippocampi were examined. In WT hippocampal sections, Reelin-IR was distributed across the bands of neuropil flanking the hippocampal fissure and was also strongly expressed by hilar GABAergic interneurons (Figure 5A). No qualitative differences in Reelin-IR in these neuropil layers were observed between WT and Bsn-mutant sections. To determine whether the distribution of Reelin+ hilar interneurons was affected in Bsn-mutants (Figure 5B), the number of labeled cells in the hilus was quantified and compared between WT and mutants. Here it was found that the density of Reelin+ cells remained unchanged in the Bsn-mutant (Figure 5C).
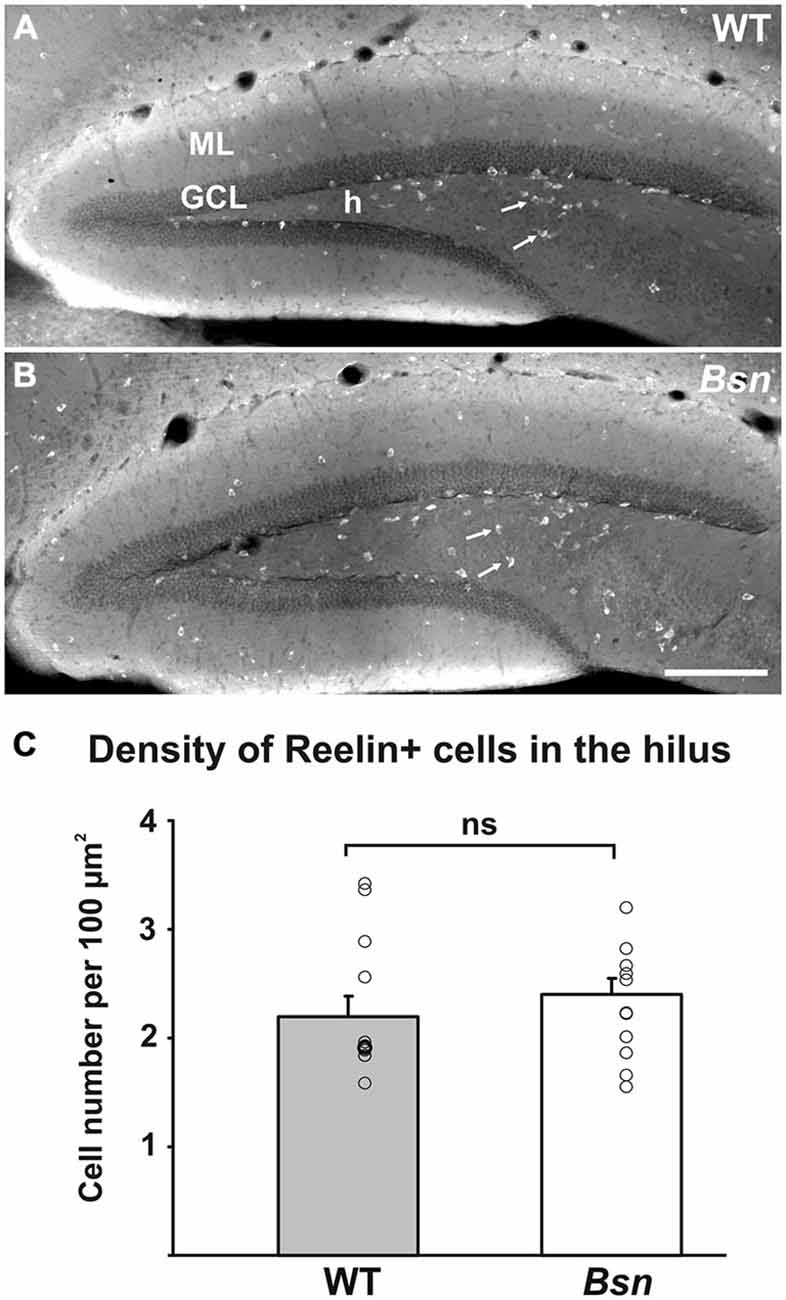
Figure 5. Distribution of Reelin immunoreactivity in the DG is comparable between WT and Bsn-mutant mice. Distribution of Reelin+ neurons (arrows) in the (A) WT and (B) Bsn-mutant DG. (C) Measurement of Reelin+ neuron density in the hilus revealed a lack of significant difference between genotypes. Data are shown as mean ± SEM. Circles represent single data points. Scale bar = 200 μm. Abbreviations: ML, molecular layer; GCL, granule cell layer; h, hilus; ns, not significant.
Loss of Bassoon is Associated with Altered Microglial Morphology in the DG
Increasing evidence suggests that microglial cells are critically involved in the regulation of neuronal plasticity, both during development (Paolicelli et al., 2011) and in the mature brain (Jones and Lynch, 2015). Since these cells are also emerging as important contributors to the pathophysiology underlying epileptic seizure activity (e.g., Eyo et al., 2014), WT and Bsn-mutant hippocampal sections were labeled with the microglia-specific antibody Iba-1 to determine whether neuronal hyperactivity influences microglial morphology in the DG. In the WT DG, microglia exhibited a typical ramified morphology (reviewed in Olah et al., 2011) and were evenly distributed across neuropil and cellular layers (Figure 6A). In the mutant DG, the microglia showed a similar distribution to the WT DG, but the individual cells showed stronger Iba-1-IR and appeared to have thicker processes (Figure 6B). To further analyze the potential morphological changes in mutant microglia, individual Iba1+ cells in the hilus underwent 3D reconstruction using NeuronStudio software (Wearne et al., 2005). The length, volume and surface area of microglial processes, as well as the number of branch points, were then determined using an automated Sholl analysis. In reconstructed microglia from WT animals, processes were ramified and radially distributed around the cell soma (Figure 6C), whereas microglia from Bsn-mutants showed enlarged cell bodies and thicker processes close to the soma. (Figure 6D).
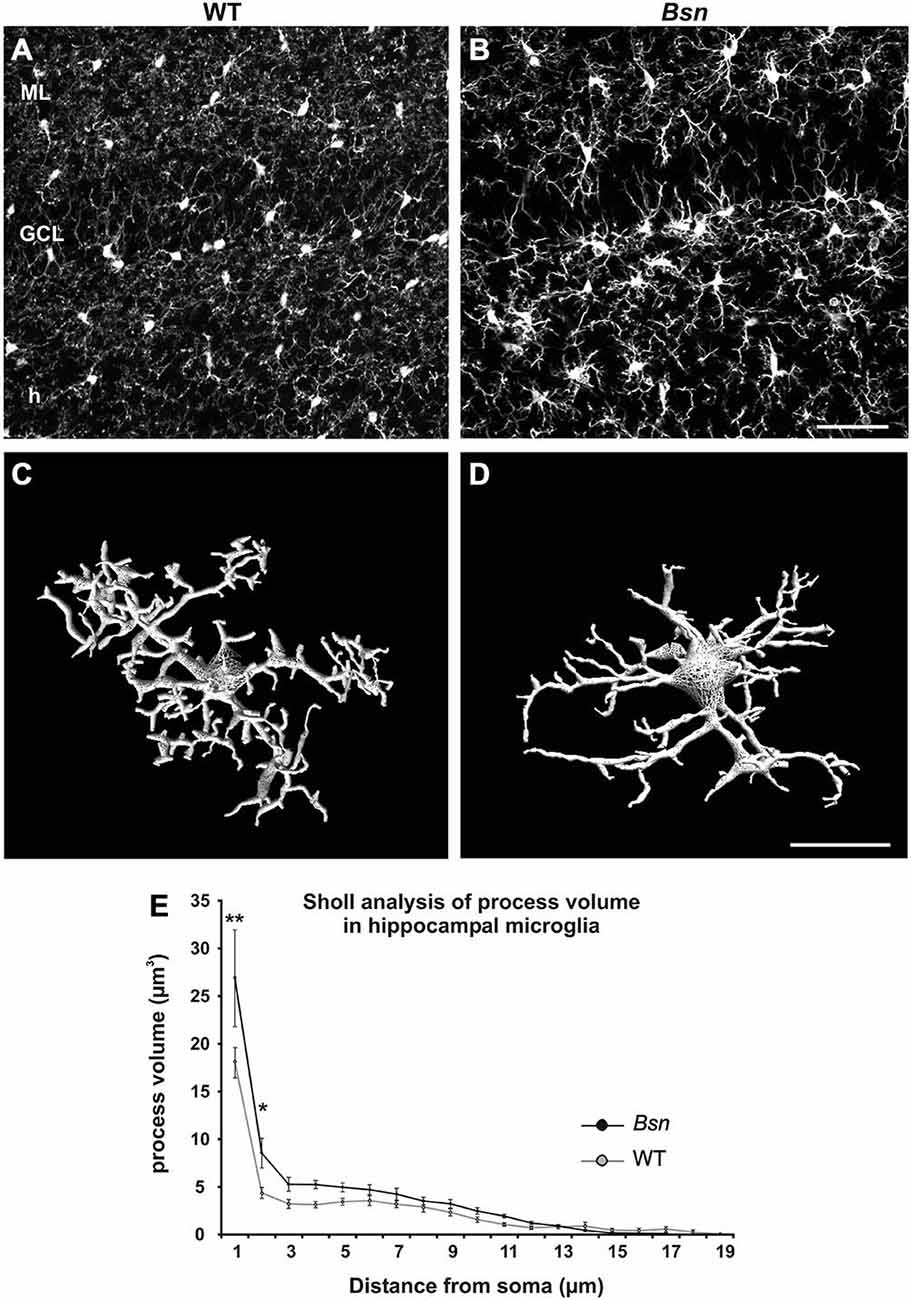
Figure 6. Hippocampal microglia from Bsn-mutant mice show altered morphology. Comparative Iba1 staining in hippocampi from WT and Bsn-mutant (A) In WT mice, microglia are evenly distributed throughout the layers of the DG and are characterized by a relatively small, round soma with thin, finely-branched processes. (B) A similar distribution was observed in the Bsn DG, however, microglia exhibited larger somata and thicker processes. (C,D) 3D-reconstruction of Iba-1-labeled microglia in the hilus depicts characteristic morphological changes at the cellular level. (C) Microglia from WT animals displayed ramified processes that were radially distributed around the cell soma. (D) Microglia from Bsn-mutants showed enlarged cell bodies and thicker processes close to the soma. (E) Sholl analysis confirmed the latter finding. Data are expressed as mean ± SEM. *p < 0.05; **p < 0.01. Scale bars: A,B = 50 μm; C,D = 2 μm. Abbreviations: ML, molecular layer; GCL, granule cell layer; h, hilus.
Using a 2-way ANOVA to compare Sholl data between WT and Bsn-mutants, it was found that the Bassoon mutant genotype had a main significant effect on process volume (F(1,328) = 8.882; p = 0.003), which was increased in comparison to WT microglia. There was also a significant interaction between “genotype” and “process distance from soma” (F(16,328) = 1.695; p = 0.046). The strongest effects were evident on processes most proximal to the cell body (WT: 18.14 ± 5.07 μm2 vs. Bsn: 26.87 ± 1.59 μm2, p < 0.001; Figure 6E). The surface area of processes also differed significantly between genotypes (F(1,328) = 7.414; p = 0.007); however, there was no significant interaction between “genotype” and “process distance from soma” (F(16,328) = 0.672; p = 0.821). The Bassoon mutant genotype did not have any significant effects on microglial process length or the number of branch points. The results of the Sholl analysis therefore indicate that the Bassoon mutation leads to a selective but significant change in microglial morphology, suggesting that these cells are reactive and in turn, may have functional effects on the local neuronal environment.
Mossy Fiber-CA3 Synapses Show Changes at the Ultrastructural Level
The findings described thus far point to changes in synaptic plasticity regulation at the cellular level; therefore, the next step was to identify potential alterations at the ultrastructural level which could serve as a structural substrate for the observed changes. Since the MF-CA3 synapse has previously been shown to undergo morphological changes in response to chemically-induced synaptic activity (Zhao et al., 2012), we wanted to determine whether similar synaptic changes in MFB ultrastructure were observed in the Bsn-mutant, which is also characterized by increased network activity. Using ultrathin sections, the respective areas of MFB profiles and their post-synaptic partners (CA3 complex spines) were quantified and compared between genotypes. MFB profiles in the SL of WT hippocampi exhibited typical structural characteristics such as a large surface area, multiple contacts with CA3 complex spines and a high number of synaptic vesicles (Figure 7A). In comparison, qualitative assessment of Bsn-mutant MFBs showed a similar morphology, but appeared larger than their WT counterparts (Figure 7B). This observation was confirmed by quantitative analysis, where the mean profile area of Bsn MFBs was significantly higher than that of WT MFBs (WT: 2.6 ± 0.15 μm2 vs. Bsn: 3.4 ± 0.22 μm2, p < 0.05; Figure 7C). Accordingly, Bsn MFB profiles also had a significantly higher perimeter than WT MFBs (WT: 11.4 ± 0.33 μm vs. Bsn: 14.4 ± 0.59 μm, p < 0.005; Figure 7D). To determine whether Bsn MFBs harbored a more convoluted structure than WT MFBs, MFB area was divided by MFB perimeter to determine the so-called folding index (Zhao et al., 2012). Here, no significant differences were observed between genotypes (Figure 7E), suggesting that Bsn MFBs do not acquire a more complex structure in the face of chronic changes to neuronal activity. Regarding mean spine area and number per MFB, no differences between genotypes were detected in either case; however, when mean total spine area was divided by mean total MFB area, WT animals showed a significantly higher ratio (WT: 0.250 ± 0.003; Bsn: 0.203 ± 0.010, p < 0.05; Figure 7F). In summary, these data suggest that while Bsn MFBs are enlarged compared to WT MFBs, they do not take on a more complex structure or increase the number of their post-synaptic elements. Alternatively, this structural change might represent the development of compensatory mechanisms such as enhanced endocytosis, which remains to be addressed in additional studies.
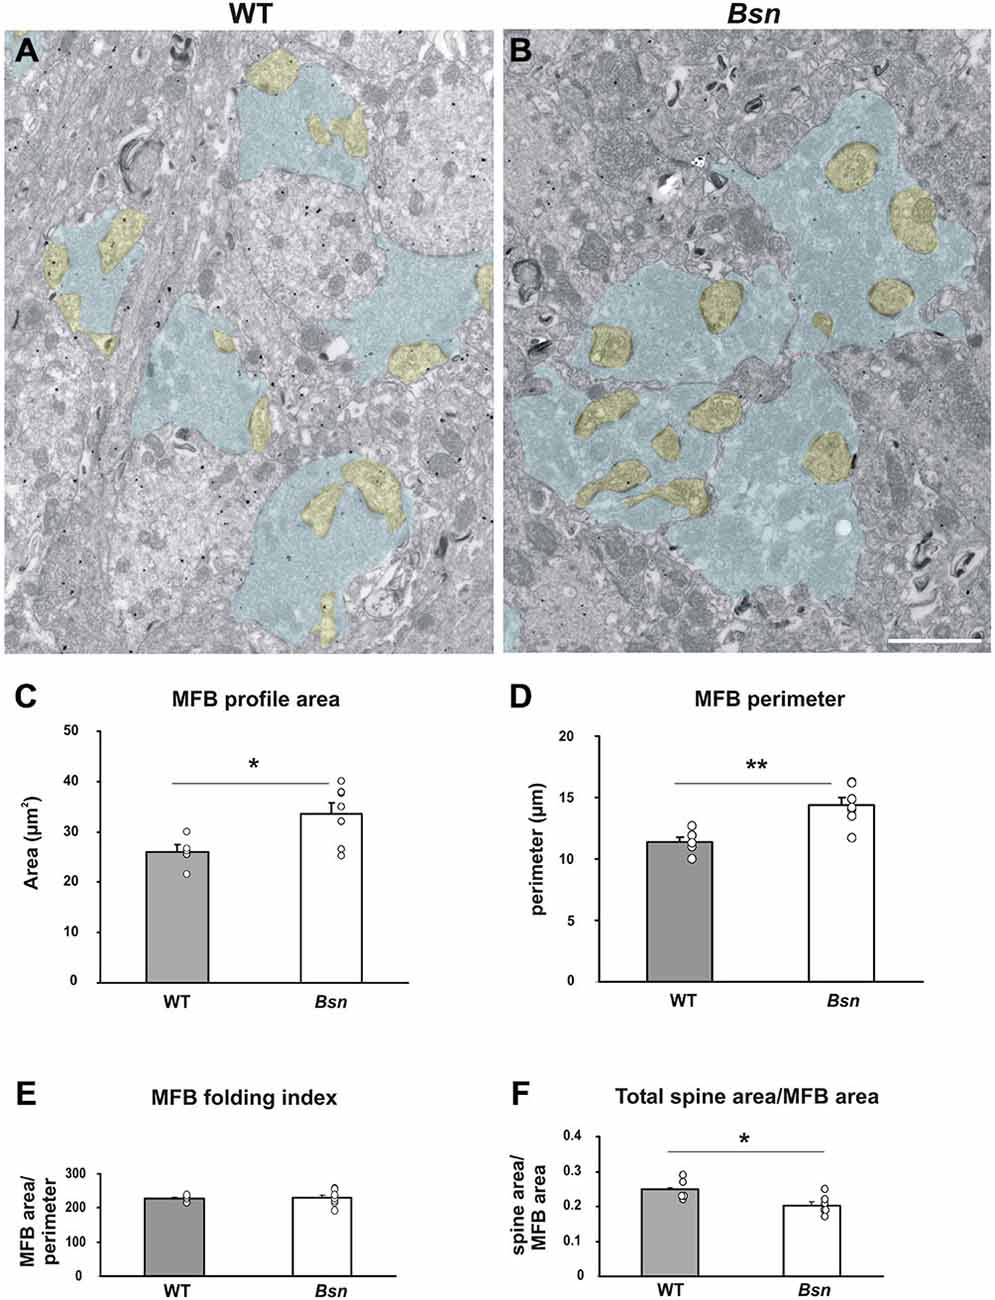
Figure 7. Mossy fiber boutons from Bassoon mutants are enlarged compared to those from WT animals. Representative electron micrographs of stratum lucidum in (A) WT mice vs. (B) Bsn-mutants. Selected MFB profiles are shaded in blue, while the corresponding spine profiles are shaded yellow. Note the larger MFB profiles in B (compared to A). Morphometric analysis of MFB profiles confirmed a significant increase in the area (C) and perimeter (D) of Bsn-mutant MFBs compared to WT mice, while the folding index (area/perimeter) remain unchanged (E). (F) Graph showing that the increase in MFB area is not accompanied by an increase in the area of the complex spines contacting the corresponding bouton. Bar graphs represent mean values ± SEM (error bars), circles show individual mean values for each animal analyzed. *p < 0.05, **p < 0.005 (Student’s t-test). Scale bar: (A,B): 2 μm. Abbreviations: MFB, mossy fiber bouton.
BDNF-Containing Dense Core Vesicles Accumulate at the Presynaptic Membrane of Mossy Fiber Synapses
The finding that Bsn-mutants MFBs have larger surface areas and perimeters also suggests that they have an increased storage capacity for synaptic vesicles. We previously reported that Bsn-mutant MFBs have a ~two-fold increase in density of BDNF+ DCVs, as determined by immunogold labeling (Dieni et al., 2012). Whether this corresponds to increased release of BDNF has not yet been determined. To begin to address this question, the degree of accumulation of BDNF+ DCVs at the synaptic membrane of the MFB was quantified. By measuring the most direct distance of individual BDNF-labeled DCVs from the synaptic membrane, it was found that BDNF+ vesicles in WT MFBs had a mean distance of 240 ± 29 nm from the synaptic membrane (Figures 8A,C), but were situated closer to the membrane in Bsn MFBs, with a mean distance of 140 ± 13 nm (Figures 8B,C; p < 0.05). These results therefore suggest that there is at least an increased accumulation of BDNF+ DCVs near release sites in Bsn-mutant MFBs.
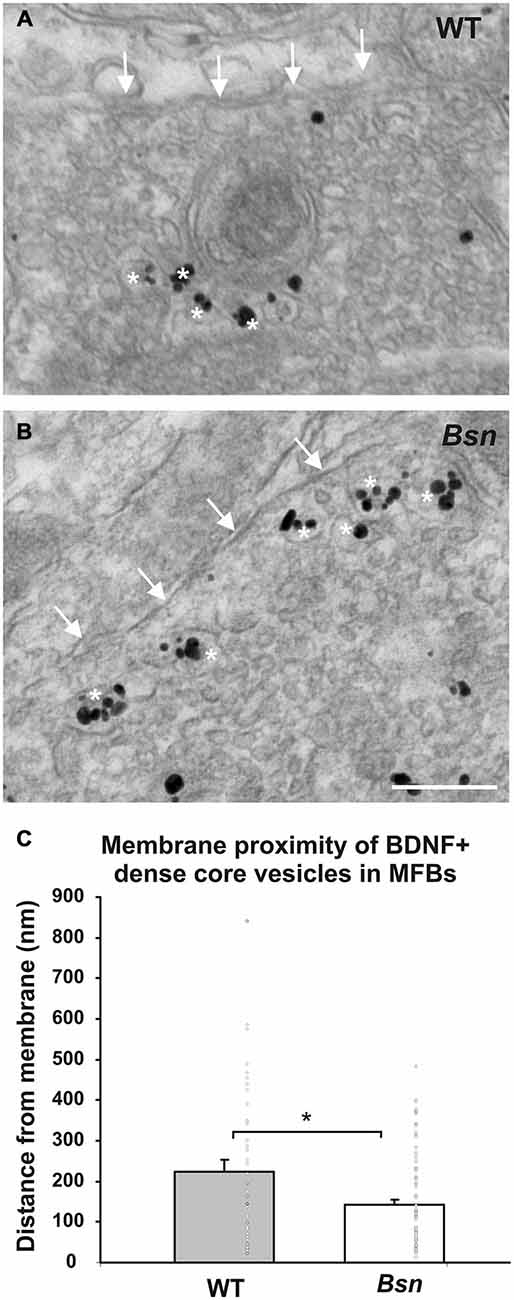
Figure 8. BDNF-positive DCVs accumulate at the synaptic membrane in MFBs from Bsn-mutant mice. Immunogold-labeled MFB showing the relative position of BDNF+ DCVs (white asterisks) and the MFB terminal membrane (arrows) in (A) WT mice and (B) Bsn-mutants. (C) Quantification of vesicle distance from the membrane revealed that BDNF+ DCVs accumulate closer to the synaptic membrane in Bsn-mutants compared to WT mice. Data are shown as mean ± SEM, circles represent single data points. *p < 0.05. Scale bar = 200 nm. Abbreviations: MFB, mossy fiber bouton.
Discussion
The present study was undertaken to evaluate whether the altered synaptic activity in the Bsn-mutant affects the ultrastructure of a defined synapse type (MF synapses in the hippocampus), as well as various molecules directly or indirectly involved in synaptic transmission. Our detailed structural and immunohistochemical analyses revealed that the increased BDNF levels characterizing the Bsn-mutant hippocampus are associated with: (i) modified neuropeptide distribution; (ii) perturbed expression of selected markers of synaptic activation or plasticity; (iii) subtle changes to microglial structure; and (iv) morphological alterations at the MF-CA3 synapse.
Altered Neuropeptide Distribution Accompanies Increased Neurotransmission Within the MF Pathway of the Bsn-Mutant
As previously discussed (Dieni et al., 2012), the observed increase in BDNF levels in the Bsn-mutant is in line with earlier studies in the rat, in which chemically-induced seizure activity led to an increase in presynaptic BDNF staining (Vezzani et al., 1999; Scharfman et al., 2002; Danzer and McNamara, 2004). The present study now extends these data by demonstrating that increased neuronal activity in the Bsn-mutant is also associated with changes in the immunohistochemical distribution of the neuropeptides Met-enk and CCK. These findings are corroborated by earlier limbic seizure studies in rodents, which reported a dramatic upregulation of Enkephalin-IR (Gall et al., 1988; Gall, 1988), and a selective downregulation of CCK-IR (Gall, 1988; Arabadzisz et al., 2005) in MFs.
The similar pattern of upregulation observed for both BDNF and met-enk in the Bsn-mutant points to an increased number of MFBs that contain both peptides. Moreover, since Met-enk-positive granule cells invariably co-express BDNF (Dieni et al., 2012), it is likely that both peptides are trafficked to the same MF terminals. However, whether this suggests that BDNF and Met-enk respond to the same stimuli required for transcription and release remains to be tested. The functional consequences of elevated Met-enk synthesis and (presumably) release might pertain to overall excitability in the Bsn hippocampus, since enkephalin was previously shown to hyperpolarize hippocampal interneurons, which in turn led to disinhibition of both pyramidal cells and inhibitory interneurons (Madison and Nicoll, 1988).
There is little evidence to suggest that BDNF and CCK are governed by similar regulatory mechanisms in the hippocampus, since CCK is down-regulated regardless of whether BDNF is endogenously overexpressed, or genetically ablated. The latter is supported by the observation that CCK-IR was almost completely down-regulated in forebrain-specific CaMK-BDNFKO mutants (Vigers et al., 2012). However, the mechanisms leading to downregulation of CCK remain obscure. In any case, the selective loss of CCK could have implications for hippocampal plasticity (Li et al., 2014), particularly since CCK has been shown to rescue morphine-induced LTP deficits in the hippocampus (Wen et al., 2014).
Therefore, despite the fact that BDNF, met-enk and CCK are all small neuropeptides derived from a larger precursor, it is likely that they are governed by different regulatory mechanisms, and that the normal relative proportions of neuropeptides are perturbed in Bsn-mutants. Furthermore, the observed change in neuropeptide distribution with the MF system may contribute to ongoing changes in seizure susceptibility, as previously hypothesized (Gall, 1988).
Marked Loss of Calbindin-Immunoreactivity in the Bsn-Mutant Hippocampus
Under normal conditions, Calbindin-D28K is ubiquitously expressed in dentate granule cells, where it acts as a calcium buffer and serves to maintain calcium homeostasis (Mattson et al., 1991). In line with the present observation of CB loss in Bsn-mutant granule cell bodies, dendrites and axons, previous work in animal models of chemically-induced epilepsy (Bouilleret et al., 2000; Gary et al., 2000) as well as in human TLE (Maglóczky et al., 1997; Nägerl et al., 2000; Selke et al., 2006), also demonstrated a loss of CB-IR in this cell population. While several reports suggest that Calbindin does not necessarily protect granule cells from kainate-induced excitotoxicity (Gary et al., 2000), the loss of CB-IR in human dentate granule cells has been hypothesized to result in hyperexcitability of the DG (Maglóczky et al., 1997). Moreover, given that hippocampal calcium homeostasis is known to be disrupted in acquired forms of epilepsy (Delorenzo et al., 2005), and intracellular calcium signaling is critical to the maintenance of neuronal function (Mattson et al., 2000), one likely outcome of CB loss in Bsn-mutant dentate granule cells is an overall negative effect on neuronal viability and synaptic plasticity. In support of this, lower CB-IR was found to correspond to poorer memory performance in aged mice (Soontornniyomkij et al., 2012), while an absence of CB in the hippocampus led to a disruption of LTP maintenance in both the DG and CA1 (Westerink et al., 2012). Taken together, the loss of CB-IR in the Bsn-mutant DG is likely to have a detrimental effect not only on cytosolic calcium homeostasis per se, but also on calcium-related events occurring at the pre- and post-synaptic levels of the granule cell.
Differential Changes in Synaptic Activation Markers
Given that presynaptic BDNF levels are increased in the Bsn-mutants, it was important to determine whether this was associated with an upregulation of other proteins normally influenced by elevated synaptic activity. We found opposing changes in the markers Arc and synaptopodin, which may have implications for overall synaptic function.
The chronic changes in neuronal excitability in the Bsn hippocampus were associated with a dramatic downregulation of Arc protein expression in the GCL, with little evidence of dendritic staining and only scattered Arc-labeled nuclei. Studies investigating the acute effects of chemical- or lesion-induced seizure on Arc expression have essentially demonstrated an upregulation of the mRNA or protein. For example, hippocampal Arc mRNA was upregulated in acute response to KA-induced seizure (Plath et al., 2006), while Arc protein expression during kindling was observed in the DG (Szyndler et al., 2013). Less information is available about the long-term effects of seizures on Arc expression; however, in support of our findings, one study investigating the long-term neuronal adaptations to electroconvulsive seizures found after more than 24 h post-seizure reduced expression levels of IEGs including Arc (Calais et al., 2013).
The reasons underlying the observed Arc downregulation in Bsn-mutant granule cells are not clear; however, the functional implications for the loss of local Arc protein synthesis are likely to relate to multiple forms of synaptic plasticity, since, for example, LTP in the rat DG was shown to correspond to Arc protein expression in spines and dendrites (Rodriguez et al., 2005), and a loss of Arc expression led to increased AMPAR function and abolished homeostatic scaling of AMPA receptors (Shepherd et al., 2006). Indeed, LTP is impaired at CA1 synapses (Sgobio et al., 2010) and striatal spiny neurons (Ghiglieri et al., 2009) in Bsn-mutant mice.
Previous studies have shown that synaptopodin expression is altered in response to kainic acid injection (Roth et al., 2001), and is upregulated in parallel with other cytoskeletal proteins following induction of LTP in vivo (Fukazawa et al., 2003). Thus, synpo-IR can serve as a useful marker of potential changes in post-synaptic activity status. Despite the dramatic reduction in Arc expression, synpo-IR was markedly increased in the Bsn-mutant DG, with stronger fluorescence intensity and qualitatively larger puncta. These unexpected findings indicate that the altered neuronal activity in the Bsn hippocampus promotes an increase in synpo expression, which may lead to spine enlargement (Okubo-Suzuki et al., 2008). This effect could also be related to increased presynaptic stimulation of dendritic spines in the MML and OML by entorhinal afferents. It should be noted, however, that no changes in spine number or size were observed at the MF/CA3 synapse at the ultrastructural level.
Morphological Changes to Microglia in Chronic Neuronal Hyperactivity
Microglial cells are fine sensors of altered neuronal activity (Béchade et al., 2013). Indeed, a typical feature of microglia activation in response to increased neuronal activity is an up-regulation of Iba1 (Avignone et al., 2008; Shapiro et al., 2008; Wirenfeldt et al., 2009; Cepeda et al., 2015). Furthermore, detailed morphological analyses revealed that microglia exhibit larger somata and thicker proximal processes in response to general convulsion activity (Avignone et al., 2008). In line with these findings, we also detected an increase in the volume of the most proximal microglial processes in the current model of chronic neuronal hyperactivity. Thus, the altered neuronal activity resulting from the Bsn protein mutation leads to a selective but significant change in microglial morphology. Given the increasing evidence that changes in microglial structure closely correspond to functional changes, our observations suggest that microglia functionally adapt to the network changes that characterize the Bsn-mutant.
Contribution of Reelin to Network Excitability
Reelin has been shown to modulate NMDA receptor activity (Chen et al., 2005) and regulate neurotransmitter release in the hippocampus (Hellwig et al., 2011). Moreover, Reelin secreted by GABAergic interneurons reportedly modulates NMDA receptor homeostasis (Campo et al., 2009). Although the GABAergic phenotype of hippocampal interneurons is in part modulated by BDNF (Subburaju and Benes, 2012), the dramatic increase in presynaptic BDNF protein levels in Bsn-mutant mice did not appear to influence the Reelin-positive subpopulation of GABAergic interneurons in this setting.
Reelin has been linked to the pathophysiology underlying TLE, which represents a state of hyperexcitability in temporal lobe structures (Haas et al., 2002). Kainate-induced GCD, a hallmark of TLE (Houser, 1990), is associated with fewer Reelin+ interneurons in the hilus (Chai et al., 2014). The lack of change in Reelin+ hilar interneurons in Bsn-mutant mice thus corresponds to the normal GCL architecture, as previously reported in these mutants (Heyden et al., 2011).
Altered Synaptic Morphology following Chronic Changes to Neuronal Activity
Ultrastructural analysis of SL revealed that Bsn-mutant MFBs are enlarged compared to WT MFBs, which could partially contribute to the overall increase in hippocampal volume in these mutants (Heyden et al., 2011). However, since this was neither associated with a more complex membrane structure, nor an increase in the number of post-synaptic elements, it could be surmised that similar structural plasticity as described recently after the induction of chemical LTP (see Zhao et al., 2012) is not occurring at the MF-CA3 synapse in Bsn-mutants. An electrophysiological study performed during postnatal development demonstrated that functional maturation of MF–CA3 synapses in Bsn-mutant mice is an impaired process which, however, normalizes by P21 (Lanore et al., 2010). A potential structural correlate for this was an increase in the number of active zones at P7 (but not at later postnatal time points). Whether this perturbed developmental process accounts for the altered MFB structure in adult Bsn-mutants remains to be determined.
We previously observed an increase in the number and density of BDNF+ DCVs in Bsn-mutant MFBs (Dieni et al., 2012), where qualitative observations were suggestive of an accumulation of labeled DCVs in proximity to the synaptic membrane. Measurement of vesicle-to-membrane distance in the present study confirmed this, with a significantly higher number of BDNF+ DCVs located closer to the MFB membrane in Bsn vs. WT mice. This finding suggests that either more BDNF is poised for release from Bsn MFBs, or that the release mechanisms for DCVs are impaired in the absence of functional Bsn protein, leading to an accumulation of BDNF-containing vesicles.
Conclusion
In summary, this study has used the Bsn-mutant mouse line to show that a chronic imbalance in neuronal network activity is associated with neurochemical and ultrastructural changes that are likely to directly or indirectly affect synaptic function. In addition, despite the dramatic increase in BDNF levels in Bsn-mutants, our immunohistochemical and ultrastructural data instead point towards an accumulation of the neurotrophin in MFBs, which might result from the lack of a proper release stimulus due to the altered physiological environment in Bsn-mutants. Whether the findings reported here are a direct result of the Bsn mutation and in particular, whether Bsn affects the release mechanism of BDNF-containing DCVs, should be the focus of future studies.
Author Contributions
Designed the study: SD, SH; Performed the experiments: SD, SN; Analyzed the data: SD, SN, MS, SH; Interpreted the results: SD, SN, MF, SH; Edited the manuscript: MS, MF; Wrote the manuscript: SD, SH.
Funding
This study was supported by the Hertie Foundation (MF), GE Healthcare Buchler GmbH & Co. KG (SH) and the Medical Faculty of the University of Freiburg (SH).
Conflict of Interest Statement
The authors declare that the research was conducted in the absence of any commercial or financial relationships that could be construed as a potential conflict of interest.
Acknowledgments
The authors are grateful to Yves-Alain Barde, Eckart Gundelfinger and Knut Biber for providing valuable feedback on the manuscript. MF is a Senior Research Professor for Neuroscience of the Hertie Foundation and is supported by the DFG (FR 620/14-1). SH received research funding from GE Healthcare Buchler GmbH and Co. KG and the Medical Faculty of the University of Freiburg.
Footnotes
References
Altrock, W. D., tom Dieck, S., Sokolov, M., Meyer, A. C., Sigler, A., Brakebusch, C., et al. (2003). Functional inactivation of a fraction of excitatory synapses in mice deficient for the active zone protein bassoon. Neuron 37, 787–800. doi: 10.1016/s0896-6273(03)00088-6
Andreska, T., Aufmkolk, S., Sauer, M., and Blum, R. (2014). High abundance of BDNF within glutamatergic presynapses of cultured hippocampal neurons. Front. Cell. Neurosci. 8:107. doi: 10.3389/fncel.2014.00107
Angenstein, F., Hilfert, L., Zuschratter, W., Altrock, W. D., Niessen, H. G., and Gundelfinger, E. D. (2008). Morphological and metabolic changes in the cortex of mice lacking the functional presynaptic active zone protein bassoon: a combined 1H-NMR spectroscopy and histochemical study. Cereb. Cortex 18, 890–897. doi: 10.1093/cercor/bhm122
Angenstein, F., Niessen, H. G., Goldschmidt, J., Lison, H., Altrock, W. D., Gundelfinger, E. D., et al. (2007). Manganese-enhanced MRI reveals structural and functional changes in the cortex of Bassoon mutant mice. Cereb. Cortex 17, 28–36. doi: 10.1093/cercor/bhj121
Arabadzisz, D., Antal, K., Parpan, F., Emri, Z., and Fritschy, J. M. (2005). Epileptogenesis and chronic seizures in a mouse model of temporal lobe epilepsy are associated with distinct EEG patterns and selective neurochemical alterations in the contralateral hippocampus. Exp. Neurol. 194, 76–90. doi: 10.1016/j.expneurol.2005.01.029
Avignone, E., Ulmann, L., Levavasseur, F., Rassendren, F., and Audinat, E. (2008). Status epilepticus induces a particular microglial activation state characterized by enhanced purinergic signaling. J. Neurosci. 28, 9133–9144. doi: 10.1523/jneurosci.1820-08.2008
Bas Orth, C., Vlachos, A., Del Turco, D., Burbach, G. J., Haas, C. A., Mundel, P., et al. (2005). Lamina-specific distribution of Synaptopodin, an actin-associated molecule essential for the spine apparatus, in identified principal cell dendrites of the mouse hippocampus. J. Comp. Neurol. 487, 227–239. doi: 10.1002/cne.20539
Béchade, C., Cantaut-Belarif, Y., and Bessis, A. (2013). Microglial control of neuronal activity. Front. Cell. Neurosci. 7:32. doi: 10.3389/fncel.2013.00032
Bouilleret, V., Schwaller, B., Schurmans, S., Celio, M. R., and Fritschy, J. M. (2000). Neurodegenerative and morphogenic changes in a mouse model of temporal lobe epilepsy do not depend on the expression of the calcium-binding proteins parvalbumin, calbindin, or calretinin. Neuroscience 97, 47–58. doi: 10.1016/s0306-4522(00)00017-8
Calais, J. B., Valvassori, S. S., Resende, W. R., Feier, G., Athié, M. C., Ribeiro, S., et al. (2013). Long-term decrease in immediate early gene expression after electroconvulsive seizures. J. Neural Transm. 120, 259–266. doi: 10.1007/s00702-012-0861-4
Campo, C. G., Sinagra, M., Verrier, D., Manzoni, O. J., and Chavis, P. (2009). Reelin secreted by GABAergic neurons regulates glutamate receptor homeostasis. PLoS One 4:e5505. doi: 10.1371/journal.pone.0005505
Celio, M. R. (1990). Calbindin D-28k and parvalbumin in the rat nervous system. Neuroscience 35, 375–475. doi: 10.1016/0306-4522(90)90091-h
Cepeda, C., Chang, J. W., Owens, G. C., Huynh, M. N., Chen, J. Y., Tran, C., et al. (2015). In Rasmussen encephalitis, hemichannels associated with microglial activation are linked to cortical pyramidal neuron coupling: a possible mechanism for cellular hyperexcitability. CNS Neurosci. Ther. 21, 152–163. doi: 10.1111/cns.12352
Chai, X., Münzner, G., Zhao, S., Tinnes, S., Kowalski, J., Häussler, U., et al. (2014). Epilepsy-induced motility of differentiated neurons. Cereb. Cortex 24, 2130–2140. doi: 10.1093/cercor/bht067
Chen, Y., Beffert, U., Ertunc, M., Tang, T. S., Kavalali, E. T., Bezprozvanny, I., et al. (2005). Reelin modulates NMDA receptor activity in cortical neurons. J. Neurosci. 25, 8209–8216. doi: 10.1523/jneurosci.1951-05.2005
Cheng, P. Y., Svingos, A. L., Wang, H., Clarke, C. L., Jenab, S., Beczkowska, I. W., et al. (1995). Ultrastructural immunolabeling shows prominent presynaptic vesicular localization of delta-opioid receptor within both enkephalin- and nonenkephalin-containing axon terminals in the superficial layers of the rat cervical spinal cord. J. Neurosci. 15, 5976–5988.
Danzer, S. C., and McNamara, J. O. (2004). Localization of brain-derived neurotrophic factor to distinct terminals of mossy fiber axons implies regulation of both excitation and feedforward inhibition of CA3 pyramidal cells. J. Neurosci. 24, 11346–11355. doi: 10.1523/jneurosci.3846-04.2004
Deller, T., Bas Orth, C., Del Turco, D., Vlachos, A., Burbach, G. J., Drakew, A., et al. (2007). A role for synaptopodin and the spine apparatus in hippocampal synaptic plasticity. Ann. Anat. 189, 5–16. doi: 10.1016/j.aanat.2006.06.013
Delorenzo, R. J., Sun, D. A., and Deshpande, L. S. (2005). Cellular mechanisms underlying acquired epilepsy: the calcium hypothesis of the induction and maintainance of epilepsy. Pharmacol. Ther. 105, 229–266. doi: 10.1016/j.pharmthera.2004.10.004
Dieni, S., Matsumoto, T., Dekkers, M., Rauskolb, S., Ionescu, M. S., Deogracias, R., et al. (2012). BDNF and its pro-peptide are stored in presynaptic dense core vesicles in brain neurons. J. Cell Biol. 196, 775–788. doi: 10.1083/jcb.201201038
Drakew, A., Frotscher, M., Deller, T., Ogawa, M., and Heimrich, B. (1998). Developmental distribution of a reeler gene-related antigen in the rat hippocampal formation visualized by CR-50 immunocytochemistry. Neuroscience 82, 1079–1086. doi: 10.1016/s0306-4522(97)00326-6
Evstratova, A., and Tóth, K. (2014). Information processing and synaptic plasticity at hippocampal mossy fiber terminals. Front. Cell. Neurosci. 8:28. doi: 10.3389/fncel.2014.00028
Eyo, U. B., Peng, J., Swiatkowski, P., Mukherjee, A., Bispo, A., and Wu, L. J. (2014). Neuronal hyperactivity recruits microglial processes via neuronal NMDA receptors and microglial P2Y12 receptors after status epilepticus. J. Neurosci. 34, 10528–10540. doi: 10.1523/jneurosci.0416-14.2014
Frotscher, M. (2010). Role for Reelin in stabilizing cortical architecture. Trends Neurosci. 33, 407–414. doi: 10.1016/j.tins.2010.06.001
Fujikawa, D. G. (2005). Prolonged seizures and cellular injury: understanding the connection. Epilepsy Behav. 7(Suppl. 3), S3–S11. doi: 10.1016/j.yebeh.2005.08.003
Fukazawa, Y., Saitoh, Y., Ozawa, F., Ohta, Y., Mizuno, K., and Inokuchi, K. (2003). Hippocampal LTP is accompanied by enhanced F-actin content within the dendritic spine that is essential for late LTP maintenance in vivo. Neuron 38, 447–460. doi: 10.1016/s0896-6273(03)00206-x
Gall, C. (1988). Seizures induce dramatic and distinctly different changes in enkephalin, dynorphin and CCK immunoreactivities in mouse hippocampal mossy fibers. J. Neurosci. 8, 1852–1862.
Gall, C., Berry, L. M., and Hodgson, L. A. (1986). Cholecystokinin in the mouse hippocampus: localization in the mossy fiber and dentate commissural systems. Exp. Brain Res. 62, 431–437. doi: 10.1007/bf00238862
Gall, C. M., Pico, R. M., and Lauterborn, J. C. (1988). Focal hippocampal lesions induce seizures and long-lasting changes in mossy fiber enkephalin and CCK immunoreactivity. Peptides 9(Suppl. 1), 79–84. doi: 10.1016/0196-9781(88)90228-8
Gary, D. S., Sooy, K., Chan, S. L., Christakos, S., and Mattson, M. P. (2000). Concentration- and cell type-specific effects of calbindin D28k on vulnerability of hippocampal neurons to seizure-induced injury. Brain Res. Mol. Brain Res. 75, 89–95. doi: 10.1016/s0169-328x(99)00299-5
Ghiglieri, V., Picconi, B., Sgobio, C., Bagetta, V., Barone, I., Paille, V., et al. (2009). Epilepsy-induced abnormal striatal plasticity in Bassoon mutant mice. Eur. J. Neurosci. 29, 1979–1993. doi: 10.1111/j.1460-9568.2009.06733.x
Haas, C. A., Dudeck, O., Kirsch, M., Huszka, C., Kann, G., Pollak, S., et al. (2002). Role for reelin in the development of granule cell dispersion in temporal lobe epilepsy. J. Neurosci. 22, 5797–5802.
Hellwig, S., Hack, I., Kowalski, J., Brunne, B., Jarowyj, J., Unger, A., et al. (2011). Role for Reelin in neurotransmitter release. J. Neurosci. 31, 2352–2360. doi: 10.1523/jneurosci.3984-10.2011
Heyden, A., Ionescu, M. C., Romorini, S., Kracht, B., Ghiglieri, V., Calabresi, P., et al. (2011). Hippocampal enlargement in Bassoon-mutant mice is associated with enhanced neurogenesis, reduced apoptosis and abnormal BDNF levels. Cell Tissue Res. 346, 11–26. doi: 10.1007/s00441-011-1233-3
Houser, C. R. (1990). Granule cell dispersion in the dentate gyrus of humans with temporal lobe epilepsy. Brain Res. 535, 195–204. doi: 10.1016/0006-8993(90)91601-c
Jiao, Y., Sun, Z., Lee, T., Fusco, F. R., Kimble, T. D., Meade, C. A., et al. (1999). A simple and sensitive antigen retrieval method for free-floating and slide-mounted tissue sections. J. Neurosci. Methods 93, 149–162. doi: 10.1016/s0165-0270(99)00142-9
Jones, R. S., and Lynch, M. A. (2015). How dependent is synaptic plasticity on microglial phenotype? Neuropharmacology 96, 3–10. doi: 10.1016/j.neuropharm.2014.08.012
Kolbeck, R., Bartke, I., Eberle, W., and Barde, Y. A. (1999). Brain-derived neurotrophic factor levels in the nervous system of wild-type and neurotrophin gene mutant mice. J. Neurochem. 72, 1930–1938. doi: 10.1046/j.1471-4159.1999.0721930.x
Lanore, F., Blanchet, C., Fejtova, A., Pinheiro, P., Richter, K., Balschun, D., et al. (2010). Impaired development of hippocampal mossy fibre synapses in mouse mutants for the presynaptic scaffold protein Bassoon. J. Physiol. 588, 2133–2145. doi: 10.1113/jphysiol.2009.184929
Li, X., Yu, K., Zhang, Z., Sun, W., Yang, Z., Feng, J., et al. (2014). Cholecystokinin from the entorhinal cortex enables neural plasticity in the auditory cortex. Cell Res. 24, 307–330. doi: 10.1038/cr.2013.164
Lyford, G. L., Yamagata, K., Kaufmann, W. E., Barnes, C. A., Sanders, L. K., Copeland, N. G., et al. (1995). Arc, a growth factor and activity-regulated gene, encodes a novel cytoskeleton-associated protein that is enriched in neuronal dendrites. Neuron 14, 433–445. doi: 10.1016/0896-6273(95)90299-6
Madison, D. V., and Nicoll, R. A. (1988). Enkephalin hyperpolarizes interneurones in the rat hippocampus. J. Physiol. 398, 123–130. doi: 10.1113/jphysiol.1988.sp017033
Maglóczky, Z., Halász, P., Vajda, J., Czirják, S., and Freund, T. F. (1997). Loss of Calbindin-D28K immunoreactivity from dentate granule cells in human temporal lobe epilepsy. Neuroscience 76, 377–385. doi: 10.1016/s0306-4522(96)00440-x
Mattson, M. P., Laferla, F. M., Chan, S. L., Leissring, M. A., Shepel, P. N., and Geiger, J. D. (2000). Calcium signaling in the ER: its role in neuronal plasticity and neurodegenerative disorders. Trends Neurosci. 23, 222–229. doi: 10.1016/s0166-2236(00)01548-4
Mattson, M. P., Rychlik, B., Chu, C., and Christakos, S. (1991). Evidence for calcium-reducing and excito-protective roles for the calcium-binding protein calbindin-D28k in cultured hippocampal neurons. Neuron 6, 41–51. doi: 10.1016/0896-6273(91)90120-o
Nägerl, U. V., Mody, I., Jeub, M., Lie, A. A., Elger, C. E., and Beck, H. (2000). Surviving granule cells of the sclerotic human hippocampus have reduced Ca(2+) influx because of a loss of calbindin-D(28k) in temporal lobe epilepsy. J. Neurosci. 20, 1831–1836.
Okubo-Suzuki, R., Okada, D., Sekiguchi, M., and Inokuchi, K. (2008). Synaptopodin maintains the neural activity-dependent enlargement of dendritic spines in hippocampal neurons. Mol. Cell. Neurosci. 38, 266–276. doi: 10.1016/j.mcn.2008.03.001
Olah, M., Biber, K., Vinet, J., and Boddeke, H. W. (2011). Microglia phenotype diversity. CNS Neurol. Disord. Drug Targets 10, 108–118. doi: 10.2174/187152711794488575
Paolicelli, R. C., Bolasco, G., Pagani, F., Maggi, L., Scianni, M., Panzanelli, P., et al. (2011). Synaptic pruning by microglia is necessary for normal brain development. Science 333, 1456–1458. doi: 10.1126/science.1202529
Park, H., and Poo, M. M. (2013). Neurotrophin regulation of neural circuit development and function. Nat. Rev. Neurosci. 14, 7–23. doi: 10.1038/nrn3379
Pesold, C., Impagnatiello, F., Pisu, M. G., Uzunov, D. P., Costa, E., Guidotti, A., et al. (1998). Reelin is preferentially expressed in neurons synthesizing gamma-aminobutyric acid in cortex and hippocampus of adult rats. Proc. Natl. Acad. Sci. U S A 95, 3221–3226. doi: 10.1073/pnas.95.6.3221
Plath, N., Ohana, O., Dammermann, B., Errington, M. L., Schmitz, D., Gross, C., et al. (2006). Arc/Arg3.1 is essential for the consolidation of synaptic plasticity and memories. Neuron 52, 437–444. doi: 10.1016/j.neuron.2006.08.024
Rodriguez, J. J., Davies, H. A., Silva, A. T., De Souza, I. E., Peddie, C. J., Colyer, F. M., et al. (2005). Long-term potentiation in the rat dentate gyrus is associated with enhanced Arc/Arg3.1 protein expression in spines, dendrites and glia. Eur. J. Neurosci. 21, 2384–2396. doi: 10.1111/j.1460-9568.2005.04068.x
Roth, S. U., Sommer, C., Mundel, P., and Kiessling, M. (2001). Expression of synaptopodin, an actin-associated protein, in the rat hippocampus after limbic epilepsy. Brain Pathol. 11, 169–181. doi: 10.1111/j.1750-3639.2001.tb00389.x
Scharfman, H. E., Sollas, A. L., Smith, K. L., Jackson, M. B., and Goodman, J. H. (2002). Structural and functional asymmetry in the normal and epileptic rat dentate gyrus. J. Comp. Neurol. 454, 424–439. doi: 10.1002/cne.10449
Selke, K., Müller, A., Kukley, M., Schramm, J., and Dietrich, D. (2006). Firing pattern and calbindin-D28k content of human epileptic granule cells. Brain Res. 1120, 191–201. doi: 10.1016/j.brainres.2006.08.072
Sgobio, C., Ghiglieri, V., Costa, C., Bagetta, V., Siliquini, S., Barone, I., et al. (2010). Hippocampal synaptic plasticity, memory and epilepsy: effects of long-term valproic acid treatment. Biol. Psychiatry 67, 567–574. doi: 10.1016/j.biopsych.2009.11.008
Shapiro, L. A., Wang, L., and Ribak, C. E. (2008). Rapid astrocyte and microglial activation following pilocarpine-induced seizures in rats. Epilepsia 49(Suppl. 2), 33–41. doi: 10.1111/j.1528-1167.2008.01491.x
Shepherd, J. D., Rumbaugh, G., Wu, J., Chowdhury, S., Plath, N., Kuhl, D., et al. (2006). Arc/Arg3.1 mediates homeostatic synaptic scaling of AMPA receptors. Neuron 52, 475–484. doi: 10.1016/j.neuron.2006.08.034
Sibbe, M., Kuner, E., Althof, D., and Frotscher, M. (2015). Stem- and progenitor cell proliferation in the dentate gyrus of the reeler mouse. PLoS One 10:e0119643. doi: 10.1371/journal.pone.0119643
Soontornniyomkij, V., Risbrough, V. B., Young, J. W., Soontornniyomkij, B., Jeste, D. V., and Achim, C. L. (2012). Hippocampal calbindin-1 immunoreactivity correlate of recognition memory performance in aged mice. Neurosci. Lett. 516, 161–165. doi: 10.1016/j.neulet.2012.03.092
Subburaju, S., and Benes, F. M. (2012). Induction of the GABA cell phenotype: an in vitro model for studying neurodevelopmental disorders. PLoS One 7:e33352. doi: 10.1371/journal.pone.0033352
Szyndler, J., Maciejak, P., Wisłowska-Stanek, A., Lehner, M., and Płaźnik, A. (2013). Changes in the Egr1 and Arc expression in brain structures of pentylenetetrazole-kindled rats. Pharmacol. Rep. 65, 368–378. doi: 10.1016/s1734-1140(13)71012-0
Vezzani, A., Ravizza, T., Moneta, D., Conti, M., Borroni, A., Rizzi, M., et al. (1999). Brain-derived neurotrophic factor immunoreactivity in the limbic system of rats after acute seizures and during spontaneous convulsions: temporal evolution of changes as compared to neuropeptide Y. Neuroscience 90, 1445–1461. doi: 10.1016/s0306-4522(98)00553-3
Vigers, A. J., Amin, D. S., Talley-Farnham, T., Gorski, J. A., Xu, B., and Jones, K. R. (2012). Sustained expression of brain-derived neurotrophic factor is required for maintenance of dendritic spines and normal behavior. Neuroscience 212, 1–18. doi: 10.1016/j.neuroscience.2012.03.031
Wearne, S. L., Rodriguez, A., Ehlenberger, D. B., Rocher, A. B., Henderson, S. C., and Hof, P. R. (2005). New techniques for imaging, digitization and analysis of three-dimensional neural morphology on multiple scales. Neuroscience 136, 661–680. doi: 10.1016/j.neuroscience.2005.05.053
Wen, D., Zang, G., Sun, D., Yu, F., Mei, D., Ma, C., et al. (2014). Cholecystokinin-octapeptide restored morphine-induced hippocampal long-term potentiation impairment in rats. Neurosci. Lett. 559, 76–81. doi: 10.1016/j.neulet.2013.11.043
Westerink, R. H., Beekwilder, J. P., and Wadman, W. J. (2012). Differential alterations of synaptic plasticity in dentate gyrus and CA1 hippocampal area of Calbindin-D28K knockout mice. Brain Res. 1450, 1–10. doi: 10.1016/j.brainres.2012.02.036
Wirenfeldt, M., Clare, R., Tung, S., Bottini, A., Mathern, G. W., and Vinters, H. V. (2009). Increased activation of Iba1+ microglia in pediatric epilepsy patients with Rasmussen’s encephalitis compared with cortical dysplasia and tuberous sclerosis complex. Neurobiol. Dis. 34, 432–440. doi: 10.1016/j.nbd.2009.02.015
Keywords: synaptic plasticity, hippocampal ultrastructure, mossy fiber bouton, dense-core vesicle, microglia
Citation: Dieni S, Nestel S, Sibbe M, Frotscher M and Hellwig S (2015) Distinct synaptic and neurochemical changes to the granule cell-CA3 projection in Bassoon mutant mice. Front. Synaptic Neurosci. 7:18. doi: 10.3389/fnsyn.2015.00018
Received: 31 August 2015; Accepted: 05 October 2015;
Published: 23 October 2015.
Edited by:
Robert B. Renden, University of Nevada Medical School, USAReviewed by:
Ayse Dosemeci, National Institute of Health, USABo Zhang, Stanford University/HHMI, USA
Copyright © 2015 Dieni, Nestel, Sibbe, Frotscher and Hellwig. This is an open-access article distributed under the terms of the Creative Commons Attribution License (CC BY). The use, distribution and reproduction in other forums is permitted, provided the original author(s) or licensor are credited and that the original publication in this journal is cited, in accordance with accepted academic practice. No use, distribution or reproduction is permitted which does not comply with these terms.
*Correspondence: Sandra Dieni, sandra.dieni@uniklinik-freiburg.de
†Present address: Sabine Hellwig, Center for Geriatrics and Gerontology, Psychiatry und Psychotherapy Clinic, University Hospital Freiburg, Freiburg, Germany