Identifying basal ganglia divisions in individuals using resting-state functional connectivity MRI
- 1 Department of Neurology, Washington University School of Medicine, St. Louis, MO, USA
- 2 Department of Radiology, Washington University School of Medicine, St. Louis, MO, USA
- 3 Department of Psychology, Washington University School of Medicine, St. Louis, MO, USA
- 4 Department of Anatomy and Neurobiology, Washington University School of Medicine, St. Louis, MO, USA
- 5 Department of Pediatrics, Washington University School of Medicine, St. Louis, MO, USA
Studies in non-human primates and humans reveal that discrete regions (henceforth, “divisions”) in the basal ganglia are intricately interconnected with regions in the cerebral cortex. However, divisions within basal ganglia nuclei (e.g., within the caudate) are difficult to identify using structural MRI. Resting-state functional connectivity MRI (rs-fcMRI) can be used to identify putative cerebral cortical functional areas in humans (Cohen et al., 2008). Here, we determine whether rs-fcMRI can be used to identify divisions in individual human adult basal ganglia. Putative basal ganglia divisions were generated by assigning basal ganglia voxels to groups based on the similarity of whole-brain functional connectivity correlation maps using modularity optimization, a network analysis tool. We assessed the validity of this approach by examining the spatial contiguity and location of putative divisions and whether divisions’ correlation maps were consistent with previously reported patterns of anatomical and functional connectivity. Spatially constrained divisions consistent with the dorsal caudate, ventral striatum, and dorsal caudal putamen could be identified in each subject. Further, correlation maps associated with putative divisions were consistent with their presumed connectivity. These findings suggest that, as in the cerebral cortex, subcortical divisions can be identified in individuals using rs-fcMRI. Developing and validating these methods should improve the study of brain structure and function, both typical and atypical, by allowing for more precise comparison across individuals.
Introduction
The basal ganglia are subcortical brain structures important for motor, cognitive, and emotional processing (Mink, 1996 ). The consequences of basal ganglia pathology can be devastating, exemplified by the symptoms of degenerative basal ganglia disorders such as Parkinson’s and Huntington’s disease. Understanding the location and functional connectivity patterns of basal ganglia divisions would improve cognitive neuroscience investigations. Indeed, methods that could identify putative basal ganglia divisions are needed to test hypotheses about cortical-basal ganglia circuitry in typical development (Rubia et al., 2006 ), healthy aging (Hedden and Gabrieli, 2004 ), and disorders (e.g., Parkinson’s disease, Huntington’s disease, Tourette’s syndrome) and are critical for region identification needed to develop more precise models of whole-brain connectivity (Butts, 2009 ).
There are multiple levels of organization in the basal ganglia. Anatomically, the basal ganglia comprise five gray matter nuclei: the caudate, putamen, globus pallidus, substantia nigra, and subthalamic nucleus. The majority of projections from the cerebral cortex to the basal ganglia terminate in the caudate and putamen, collectively referred to as the striatum. Discrete cerebral cortical regions project to discrete striatal regions that then project, via the thalamus, back to those cortical regions (Alexander et al., 1986 ). Within the striatum are compartments, termed patches and matrices, that have distinct neurochemical markers and receive projections from different cortical layers (Gerfen, 1989 ; Graybiel, 1990 ). Beyond basal ganglia nuclei that can be seen on structural MRI scans, more fine-grained divisions in human basal ganglia, though presumed to exist based on non-human primate and rodent studies, are difficult to identify with current neuroimaging methods.
While historically considered to be a motor structure, the basal ganglia receive cortical projections from all lobes of the cerebral cortex and contribute to both motor and non-motor processing (Mink, 1996 ). Anatomical tracer studies in non-human primates (Alexander et al., 1986 ; Middleton and Strick, 2000 ; Haber, 2003 ) have documented anatomical connections between the basal ganglia and many regions in the cerebral cortex, including lateral prefrontal, orbitofrontal, anterior cingulate, lateral parietal, motor, premotor, oculomotor, somatosensory, auditory association (superior temporal gyrus), and visual association (inferior temporal gyrus) cortex.
Resting-state functional connectivity MRI (rs-fcMRI) and diffusion tensor imaging (DTI) provide a means to assess functional and anatomical connectivity non-invasively in humans. It is important to note at the outset that these methods yield distinct information about brain connectivity. rs-fcMRI measures correlations in low-frequency (i.e., <0.1 Hz) spontaneous blood oxygenation level-dependent (BOLD) signal fluctuations (Fox et al., 2005 ) and may reflect a history of co-activation between regions (Fair et al., 2007 ; Dosenbach et al., 2008 ). DTI measures the diffusion of water molecules, which is constrained by the presence of axons, particularly myelinated axons, and provides indices of white matter coherence used to create visualizations of white matter tracts. While there can be overlap in connectivity patterns identified using rs-fcMRI and DTI, functional connectivity has been documented in the absence of anatomical connectivity. For example, seeds placed in voxels corresponding to left and right retinotopic eccentric representations in primary visual cortex exhibit strong functional connectivity with rs-fcMRI, but are not anatomically connected (Vincent et al., 2007 ). This observation suggests that functional connectivity should not be treated as a measure simply homologous to anatomical connectivity.
Despite fundamental differences in the types of information about brain connectivity that can be gleaned from rs-fcMRI and DTI, these methods converge with evidence from anatomical tracer studies examining cortical-basal ganglia connectivity, revealing significant connectivity between basal ganglia regions and frontal, parietal, and temporal regions. Using rs-fcMRI, dorsal and ventral caudate and putamen regions of interest (ROIs) were shown to have different patterns of functional connectivity with the cerebral cortex (Di Martino et al., 2008 ; Harrison et al., 2009 ). Similarly, large-scale cortical ROIs (e.g., prefrontal cortex, parieto–occipital cortex) were shown to have different patterns of partial correlations with the basal ganglia (Zhang et al., 2008 ). DTI investigations have revealed different anatomical connectivity between basal ganglia divisions and large-scale frontal ROIs (e.g., prefrontal cortex, orbitomedial frontal cortex) (Lehericy et al., 2004 ; Leh et al., 2007 ; Draganski et al., 2008 ). Across these methods, convergent findings regarding patterns of cortical-basal ganglia connectivity have emerged. For example, both rs-fcMRI and DTI respectively reveal functional and anatomical connectivity between dorsal caudate and lateral prefrontal cortex, ventral striatum and orbitofrontal cortex, and dorsal caudal putamen and motor and premotor cortex (Lehericy et al., 2004 ; Leh et al., 2007 ; Di Martino et al., 2008 ; Draganski et al., 2008 ; Harrison et al., 2009 ).
Basal ganglia divisions have two properties that would facilitate identification with noninvasive neuroimaging methods: they have different patterns of connectivity with the cerebral cortex and they are spatially constrained (i.e., discrete) entities (Alexander et al., 1986 ). Thus, it may be possible to identify basal ganglia divisions smaller than nuclei on the basis of their unique patterns of cortical-basal ganglia functional connectivity using rs-fcMRI and community detection algorithms, which are used to identify groupings in networks. rs-fcMRI is sensitive to changes in patterns of functional connectivity across adjacent, proximal (i.e., ∼2 cm apart) cortical regions. For example, rs-fcMRI data contained abrupt transitions, consistent with boundaries between putative cortical areas, in the measured similarity of functional connectivity maps generated from seeds placed along a line between supramarginal and angular gyrus regions (Cohen et al., 2008 ). Rather than simply measure along a single line, rs-fcMRI methods can also be used to sample from a larger structure (e.g., the basal ganglia). By calculating the similarity in whole-brain rs-fcMRI maps generated from each voxel in a structure, we can obtain a matrix of the pairwise similarity relationships between voxels. Similarity matrices can be used to bring recent developments in graph theory, the mathematical description of networks, to bear on our question of identifying divisions in the basal ganglia.
In graph theory parlance, a graph is composed of two elements: nodes, which represent the units of observation in a graph, and edges, which represent the pairwise relationships between nodes. We can thus view our similarity matrix as a network, with voxels as nodes and eta2 values, a measure of similarity, as edges. Community detection algorithms (e.g., modularity optimization [Newman, 2006 ] used here) can be applied to cluster the nodes into highly interconnected communities, with relatively few edges between communities. In other words, these algorithms can be viewed as grouping voxels with similar correlation maps. Returning to our question of interest, these groupings can be examined to determine whether they reflect expected divisions within the basal ganglia. If (1) the anatomical loci of modularity optimization groupings is consistent with basal ganglia divisions identified from anatomical studies in non-human primates and rodents and (2) functional connectivity maps generated from the modularity optimization groupings are consistent with presumed patterns of cortical-basal ganglia connectivity, then we will consider these groupings to be putative basal ganglia divisions.
In this paper, we demonstrate that a novel approach to functional mapping that combines rs-fcMRI and modularity optimization analyses can reveal putative basal ganglia divisions in individuals. Our approach identifies putative basal ganglia divisions with reliable patterns of functional connectivity with an amount of data that can be acquired in a single, brief MRI session (i.e., one ∼8-min structural scan and three ∼5-min scans of relaxed fixation). Remarkably, these results appear to be robust at the individual subject-level.
Materials and Methods
Subjects
Two cohorts of healthy young adult subjects were recruited from the Washington University community. Subjects were screened with a self-report questionnaire to ensure that they had no current or previous history of neurological or psychiatric diagnosis. Informed consent was obtained from all subjects, and the study was approved by the Washington University Human Studies Committee. Cohort One consisted of 15 subjects (four males, ages 21–29 years, mean age = 25 years). Cohort Two consisted of 11 subjects (five males, ages 21–27 years, mean age = 25 years). The purpose of examining two cohorts was to test independently the reliability of the results (see Ihnen et al., 2009 ).
Data Acquisition
Data were acquired on a Siemens 3 Tesla MAGNETOM Trio system (Erlangen, Germany) with a Siemens 12 channel Head Matrix Coil. To help stabilize head position, each subject was fitted with a thermoplastic mask fastened to holders on the head coil. Structural images were obtained using a sagittal magnetization-prepared rapid gradient echo (MP-RAGE) three-dimensional T1-weighted sequence (TE = 3.08 ms, TR (partition) = 2.4 s, TI = 1000 ms, flip angle = 8°, 176 slices with 1 × 1 × 1 mm voxels). Functional images were obtained using a BOLD contrast sensitive gradient echo echo-planar sequence (TE = 27 ms, volume TR = 2.5 s, flip angle = 90°, in-plane resolution 4 × 4 mm). Whole-brain coverage was obtained with 32 contiguous interleaved 4-mm axial slices. Three runs of either 133 (Cohort One) or 132 (Cohort Two) BOLD volumes per run were acquired. Steady state magnetization was assumed after four frames (i.e., 10 s). An auto align pulse sequence protocol provided in the Siemens software was used to align the acquisition slices of the functional scans parallel to the anterior and posterior commissure (AC–PC) plane and centered on the brain. A T2 weighted turbo spin echo structural image (TE = 84 ms, TR = 6.8 s, 32 slices with 1 × 1 × 4 mm voxels) in the same anatomical plane as the BOLD images was also obtained to improve alignment to the atlas.
During functional scans, subjects viewed a centrally presented crosshair that subtended <1 visual degree and were instructed to relax and maintain fixation on the crosshair. The fixation cross was either white on a black background (Cohort One) or black on a white background (Cohort Two).
Data Pre-Processing
The analysis stream from the present study is depicted in Figure 1 A. Functional images were first processed to reduce artifacts (Miezin et al., 2000 ). These steps included: (i) removal of a central spike caused by MR signal offset, (ii) correction of odd versus even slice intensity differences attributable to interleaved acquisition without gaps, (iii) correction for head movement within and across runs, and (iv) intensity normalization to a whole-brain mode value of 1000 for each run. Atlas transformation of the functional data was computed for each individual via the MP-RAGE and T2 weighted scans. Each run was then resampled in atlas space on an isotropic 2-mm grid combining movement correction and atlas transformation (12 parameter affine co-registration) in one interpolation (Lancaster et al., 1995 ; Snyder, 1996 ). All subsequent operations were performed on the atlas-transformed volumetric time series.
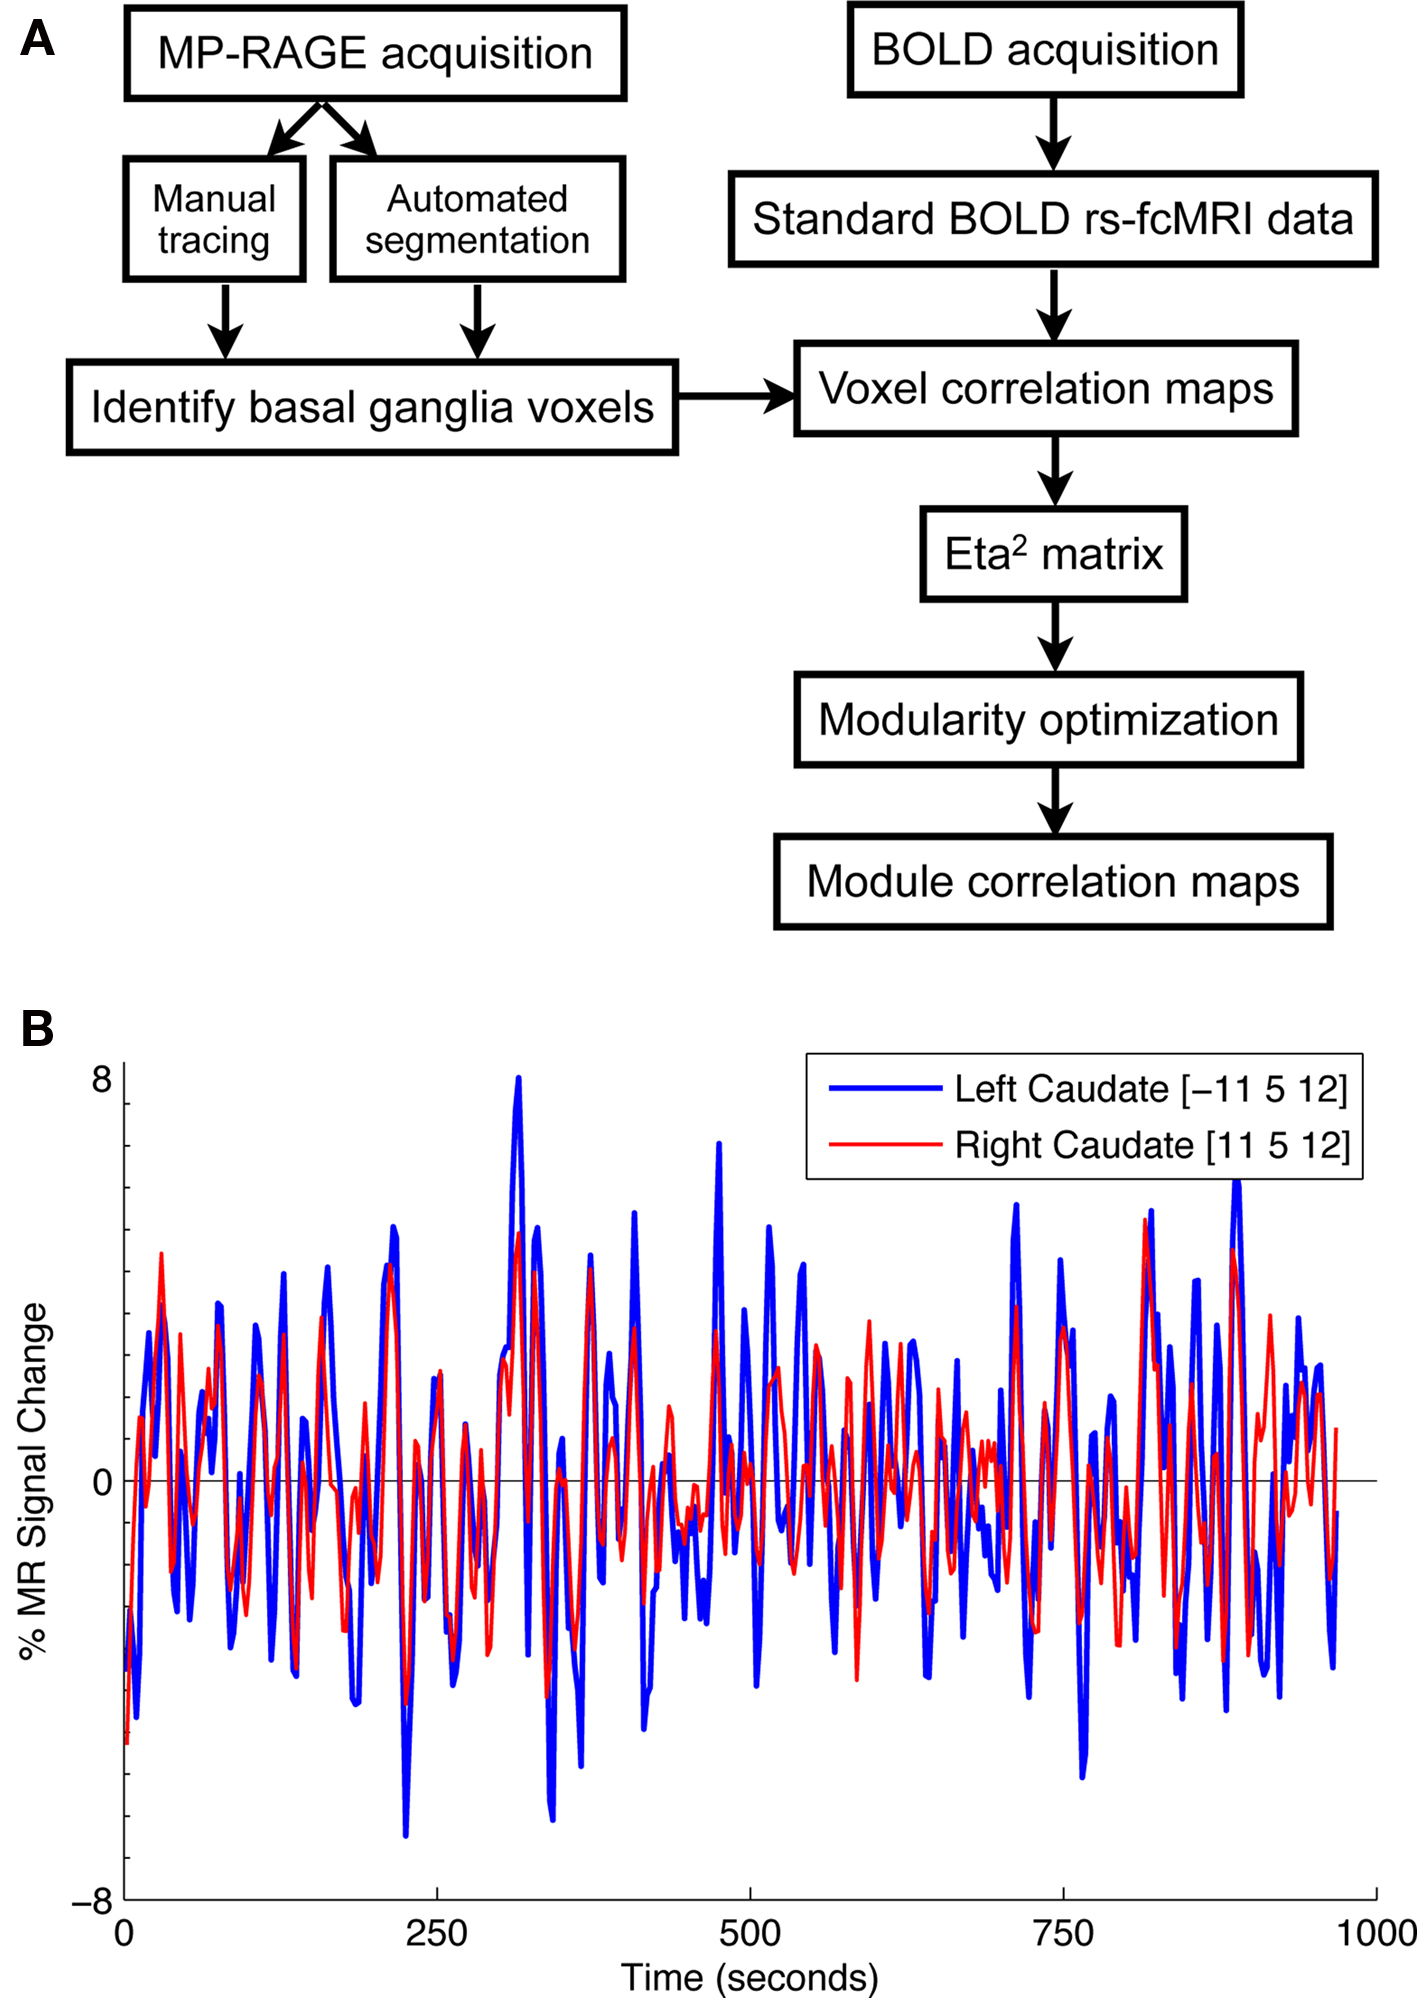
Figure 1. (A) Flowchart of analysis stream. (B) Time courses extracted from two basal ganglia voxels ([−11 5 12] and [11 5 12]) are highly correlated (r = 0.70). Time courses such as these were used to generate whole-brain correlation maps for each basal ganglia voxel.
Several additional pre-processing steps were used to reduce spurious variance (e.g., heart rate and respiration) unlikely to reflect neuronal activation. These steps included: (i) temporal bandpass filtering (0.009 Hz < f < 0.08 Hz) and spatial smoothing (4 mm full width at half maximum), (ii) regression of six parameters obtained by rigid body head motion correction, (iii) regression of the whole-brain signal averaged over the whole brain, (iv) regression of ventricular signal averaged from ventricular ROIs, and (v) regression of white matter signal averaged from white matter ROIs. [Ventricular and white matter ROIs were defined using masks described in Fox et al. (2005) and depicted in Supplemental Figure 1 of Fox et al. (2009) ]. Regression of first order derivative terms for the whole brain, ventricular, and white matter signals and any trend term from the movement regressors was also included in the pre-processing.
Identifying the Basal Ganglia
Two methods were used to identify basal ganglia voxels in individual subjects. For Cohort One, the caudate, putamen, and pallidum were manually traced from each subject’s MP-RAGE scan. For Cohort Two, the caudate, putamen, and pallidum were identified from each subject’s MP-RAGE using FreeSurfer 1 , an automated segmentation algorithm (Fischl et al., 2002 , 2004 ). Automated segmentation results for each subject were reviewed as a quality control step. From this point forward, the methods applied to the two cohorts were identical. The purpose of examining two cohorts separately, rather than collapsing cohorts into a single group, was to test independently the reliability of the results.
rs-fcMRI and Modularity Optimization Analysis
For each basal ganglia voxel, whole-brain rs-fcMRI correlation maps were generated by correlating each basal ganglia voxel’s timecourse with all other voxels in the brain (see Figure 1 B for example basal ganglia time courses). To quantify the similarity of the whole-brain rs-fcMRI correlation maps, a measure of similarity, eta2, was computed between each pair of correlation maps for each hemisphere in each subject (see Cohen et al., 2008 ). Thus, for each hemisphere in each subject, we generated a similarity matrix that could be examined to identify basal ganglia voxels with similar patterns of functional connectivity.
Modularity optimization (Newman, 2006 ), a network analysis tool, was used to identify basal ganglia voxels with similar patterns of functional connectivity and then to assign voxels, based on their similar patterns of connectivity, to groups termed modules. In graph theory terms, each voxel in each subject’s basal ganglia was treated as a node and the similarity (i.e., eta2) between each pair of nodes was treated as an edge. Networks with N nodes were mathematically represented as a N × N matrix of relationships where cell ij contained the measure of the similarity between node i and node j. Similarity matrices were thresholded such that all cells with values below a certain threshold were set to zero, effectively removing the edges between the nodes. We therefore explored a range of thresholds in our analyses to ensure that our results were not specific to a particular threshold. Modules, our unit of analysis to test for putative divisions within the basal ganglia, were detected with modularity optimization algorithms adopted from Newman (2006) and described in Fair et al. (2009) . The modularity (Q) of a given set of module assignments for a graph is a measure of the number of connections found within the assigned modules versus the number predicted in a random graph with equivalent degree distribution. A positive Q indicates that the number of intra-module connections exceeds those predicted statistically. A wide range of Q may be found for a graph, depending on how nodes are assigned to modules. Thus modularity optimization returns the set of node assignments that returns the highest Q, that is, the optimal modular description of the data.
Results
Cohort One
Modularity optimization groupings were examined to determine whether they were consistent with putative divisions in the basal ganglia. An eta2 threshold of 0.85 was selected for the analyses reported below because at this threshold the network was sparse (i.e., edge density < 0.1) but fully connected (i.e., graph connectedness ∼1.0) and there was strong community structure (i.e., Q > 0.3) in the network (see Figure S1 in Supplementary Material).
Modularity optimization generated discrete, contiguous groupings of basal ganglia voxels in locations consistent with presumed basal ganglia divisions (see Figure 2 , rows 1–3). The number of modules identified for the left (M = 6.60, SD = 2.19, range = 3–11) and right (M = 6.73, SD = 2.76, range = 3–13) hemispheres did not differ, p = 0.87. We focused on identifying and characterizing three modules because at least three modules were generated across subjects in Cohort One.
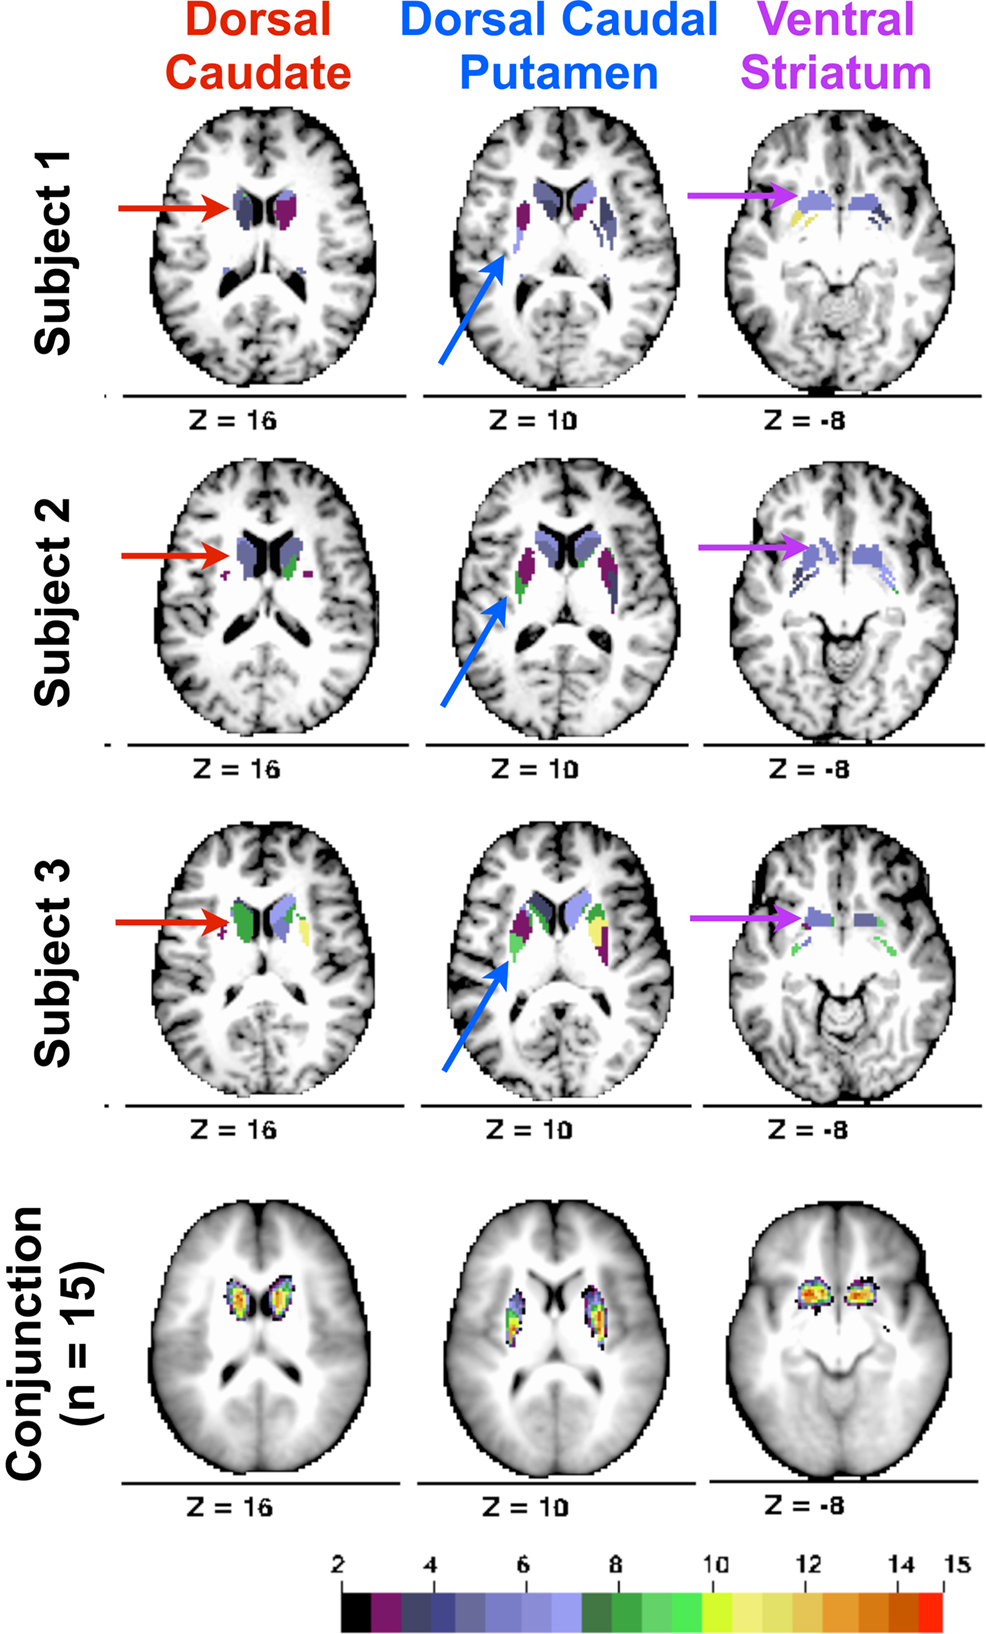
Figure 2. Rows 1–3. From Cohort One, three subjects’ basal ganglia voxels colored with respect to modularity optimization groupings (shown on each subject’s MP-RAGE; coloring for each hemisphere and each subject is arbitrary). Arrows indicate modules labeled as dorsal caudate (red arrows, z = 16), dorsal caudal putamen (blue arrows, z = 10), and ventral striatum (purple arrows, z = −8). Row 4. Conjunction of modules ascribed the same label across Cohort One subjects. Color bar depicts number of subjects with a module assignment at each voxel.
In each hemisphere for each subject, we identified groupings of basal ganglia voxels that were consistent with the location of the dorsal caudate, the ventral striatum, and the dorsal caudal putamen. Labels were assigned on the basis of stereotactic coordinates reported in prior functional connectivity (Di Martino et al., 2008 ; Harrison et al., 2009 ) and functional MRI co-activation (Postuma and Dagher, 2006 ) studies. The dorsal/ventral distinction for the caudate and putamen was z = 2 (i.e., dorsal = z ≥ 2; ventral = z ≤ 2). The rostral/caudal distinction for the putamen was y = 0. When more than one module met these criterion, the module closest to the coordinates reported in Di Martino et al. (2008) was assigned the particular label (i.e., dorsal caudate, ventral striatum, dorsal caudal putamen). As the spatial extent of each module was not fixed across subjects and hemispheres (it was determined by the number of voxels assigned to a particular grouping using modularity optimization), we sought to determine whether these stereotactic guidelines identified modules in similar locations across subjects. Accordingly, we conducted a conjunction analysis for each label by creating a masked image of that putative division and summing each subject’s masked image. This analysis revealed that the spatial location of each putative basal ganglia division overlapped across subjects in anatomical locations consistent with the stereotactic guidelines described above (see Figure 2 , row 4).
To assess the validity of the modularity optimization results, we examined functional connectivity maps derived from modularity optimization assignments. For each of the three basal ganglia divisions (i.e., the voxels labeled as the putative dorsal caudate, dorsal caudal putamen, and ventral striatum) we generated six whole-brain correlation maps for each subject (three putative divisions × two hemispheres). Each subject’s z-transformed whole-brain correlation map was used in a second level random-effects analysis involving one-sample t-tests (z > 3.00, k = 21, corresponding to p < 0.05, Monte Carlo corrected). The random-effects maps for the left hemisphere (Figure 3 , row 1) revealed qualitatively distinct patterns of functional connectivity for the putative dorsal caudate, dorsal caudal putamen, and ventral striatum (see Figure S3 in Supplementary Material, Row 1 for random-effects analyses for putative right basal ganglia divisions.)
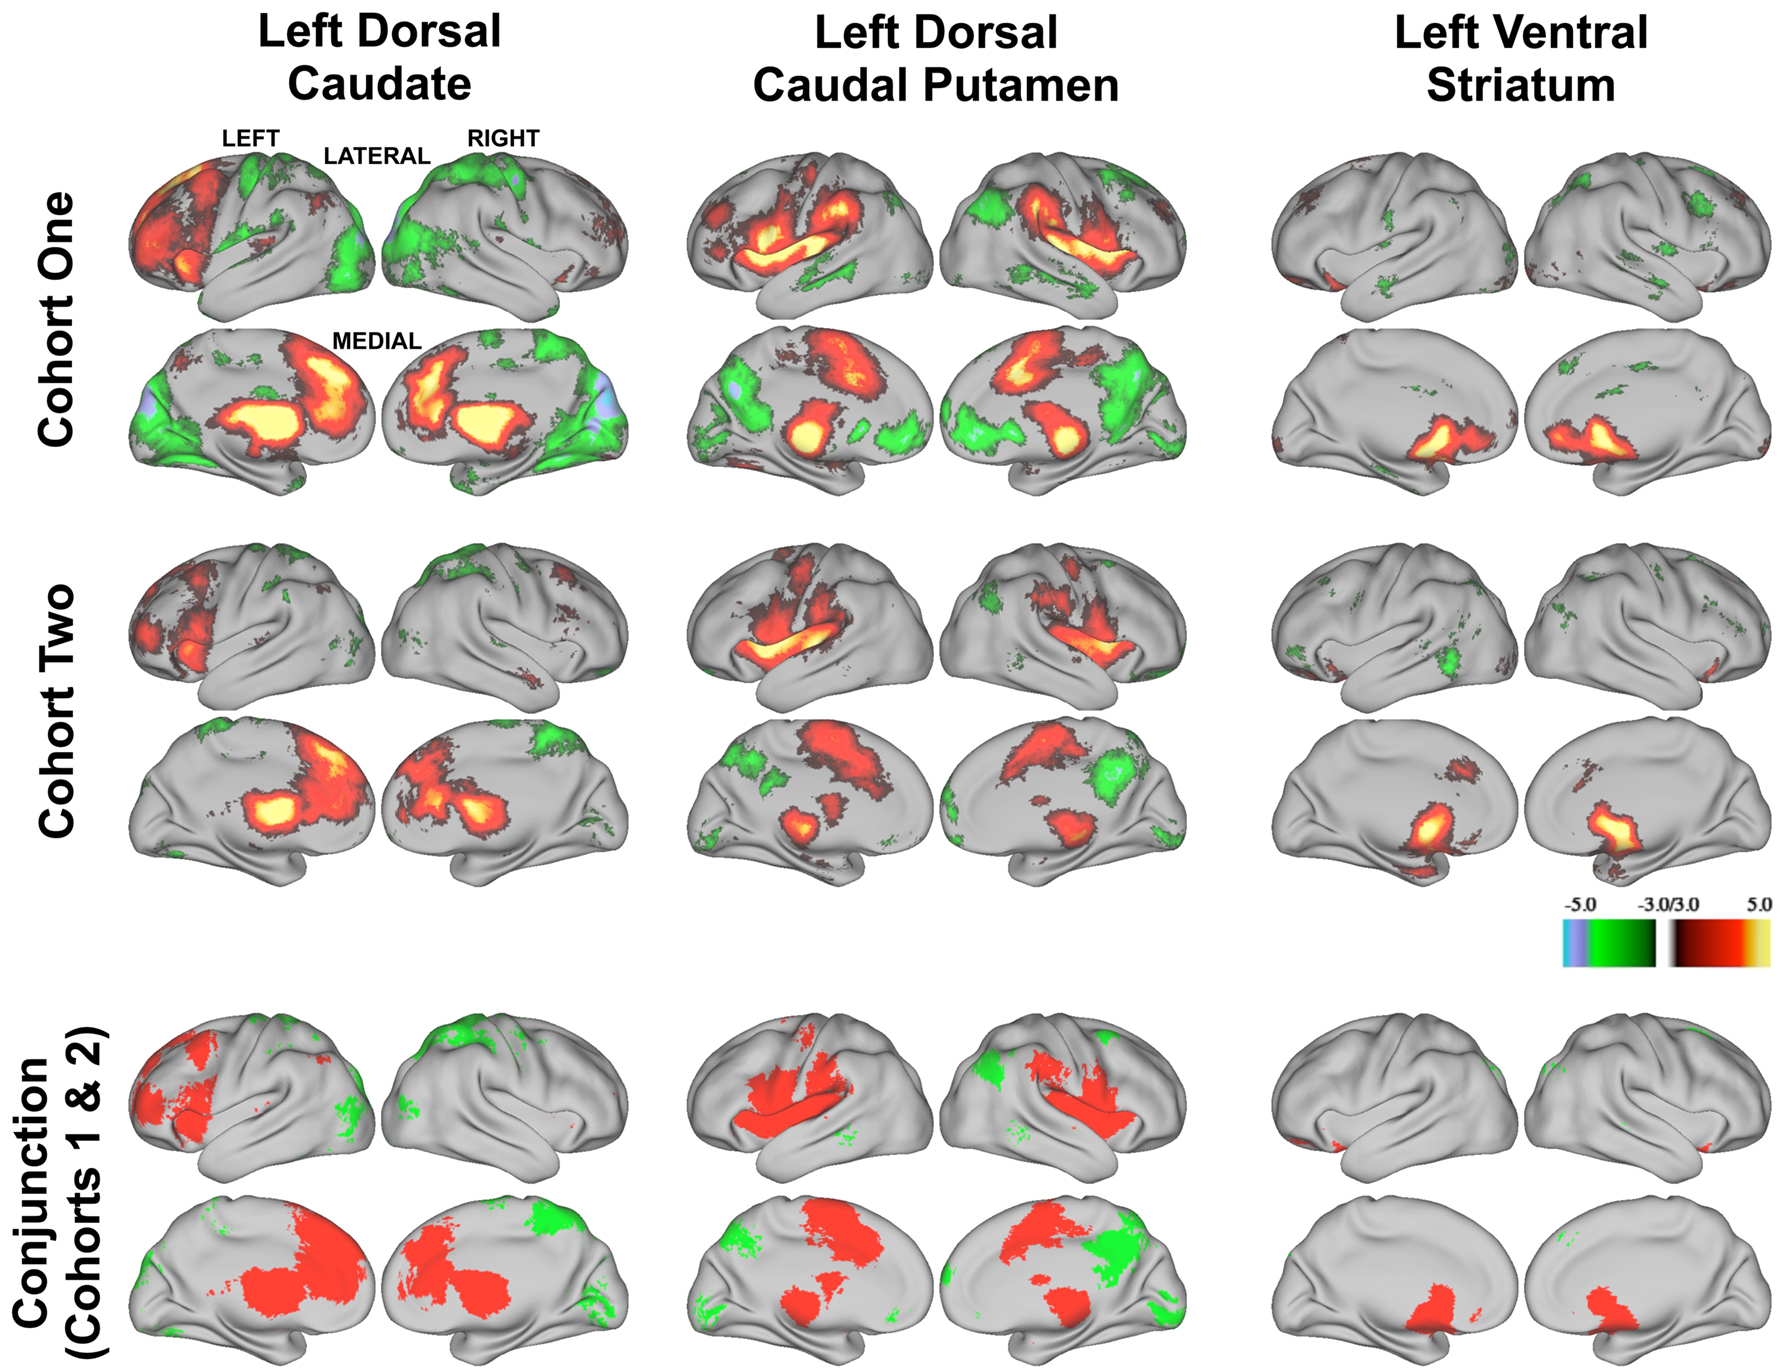
Figure 3. Z-transformed rs-fcMRI maps from modularity assignments are statistically reliable within each cohort for the left hemisphere divisions (first and second rows, z > 3.00, k = 21, corresponding to p < 0.05, Monte Carlo corrected) and yield common regions of correlation across cohorts (conjunction analysis, third row). Positive correlations are depicted in warm colors (first two rows) and their overlap is depicted in red in the conjunction analysis (third row). Negative correlations are depicted in cool colors (first two rows) and their overlap is depicted in green in the conjunction analysis (third row).
Functional connectivity maps from modularity optimization assignments revealed patterns of functional connectivity similar to the previously reported patterns of anatomical and functional connectivity of the dorsal caudate, dorsal caudal putamen, and ventral striatum (see Figure 3 , row 1; Table 1 ). For example, the dorsal caudate was functionally connected to regions in lateral prefrontal cortex, the dorsal caudal putamen was functionally connected to regions in premotor and motor cortex, and the ventral striatum was functionally connected to regions in orbitofrontal and ventromedial prefrontal cortex.
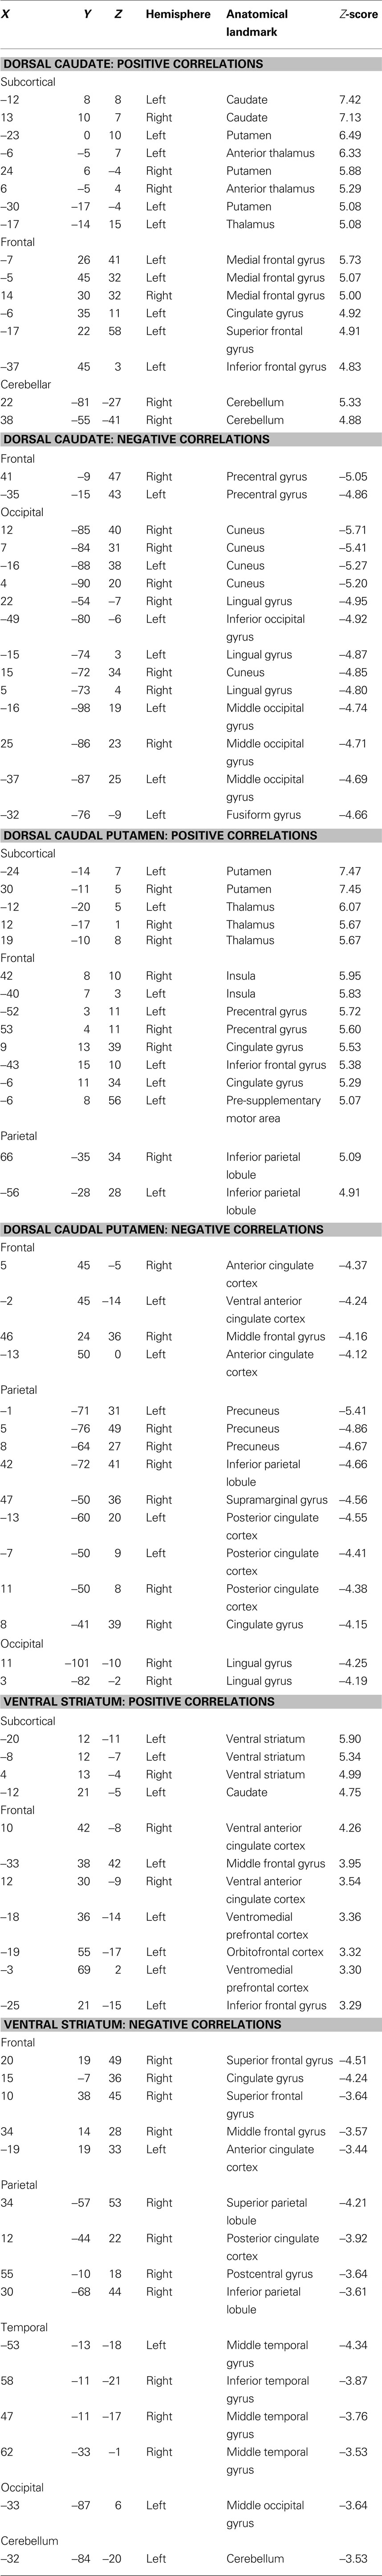
Table 1. Brain regions showing significant functional connectivity with putative basal ganglia divisions identified using random-effects one-sample t-tests (z > 3.00, k = 21, corresponding to p < 0.05, Monte Carlo corrected).
The three putative basal ganglia divisions had distinct patterns of functional connectivity that were qualitatively reliable across individuals. We generated thresholded (z > 2.00), binarized images of individuals’ z-transformed correlation maps for the putative left dorsal caudate, left dorsal caudal putamen, and left ventral striatum and summed them to determine whether robust functional connectivity in the random-effects analyses were driven by a handful of the subjects or whether overlapping patterns of functional connectivity could be seen in a majority of subjects. Conjunction analyses for each putative basal ganglia division across all Cohort One subjects revealed that regions of functional connectivity identified in the random-effects analyses seen in individual subjects (see Figure 4 , rows 1–3) were present in a majority of subjects (see Figure 4 , row 4). These findings suggest that putative basal ganglia divisions yield patterns of functional connectivity that are reliable at the individual subject-level.
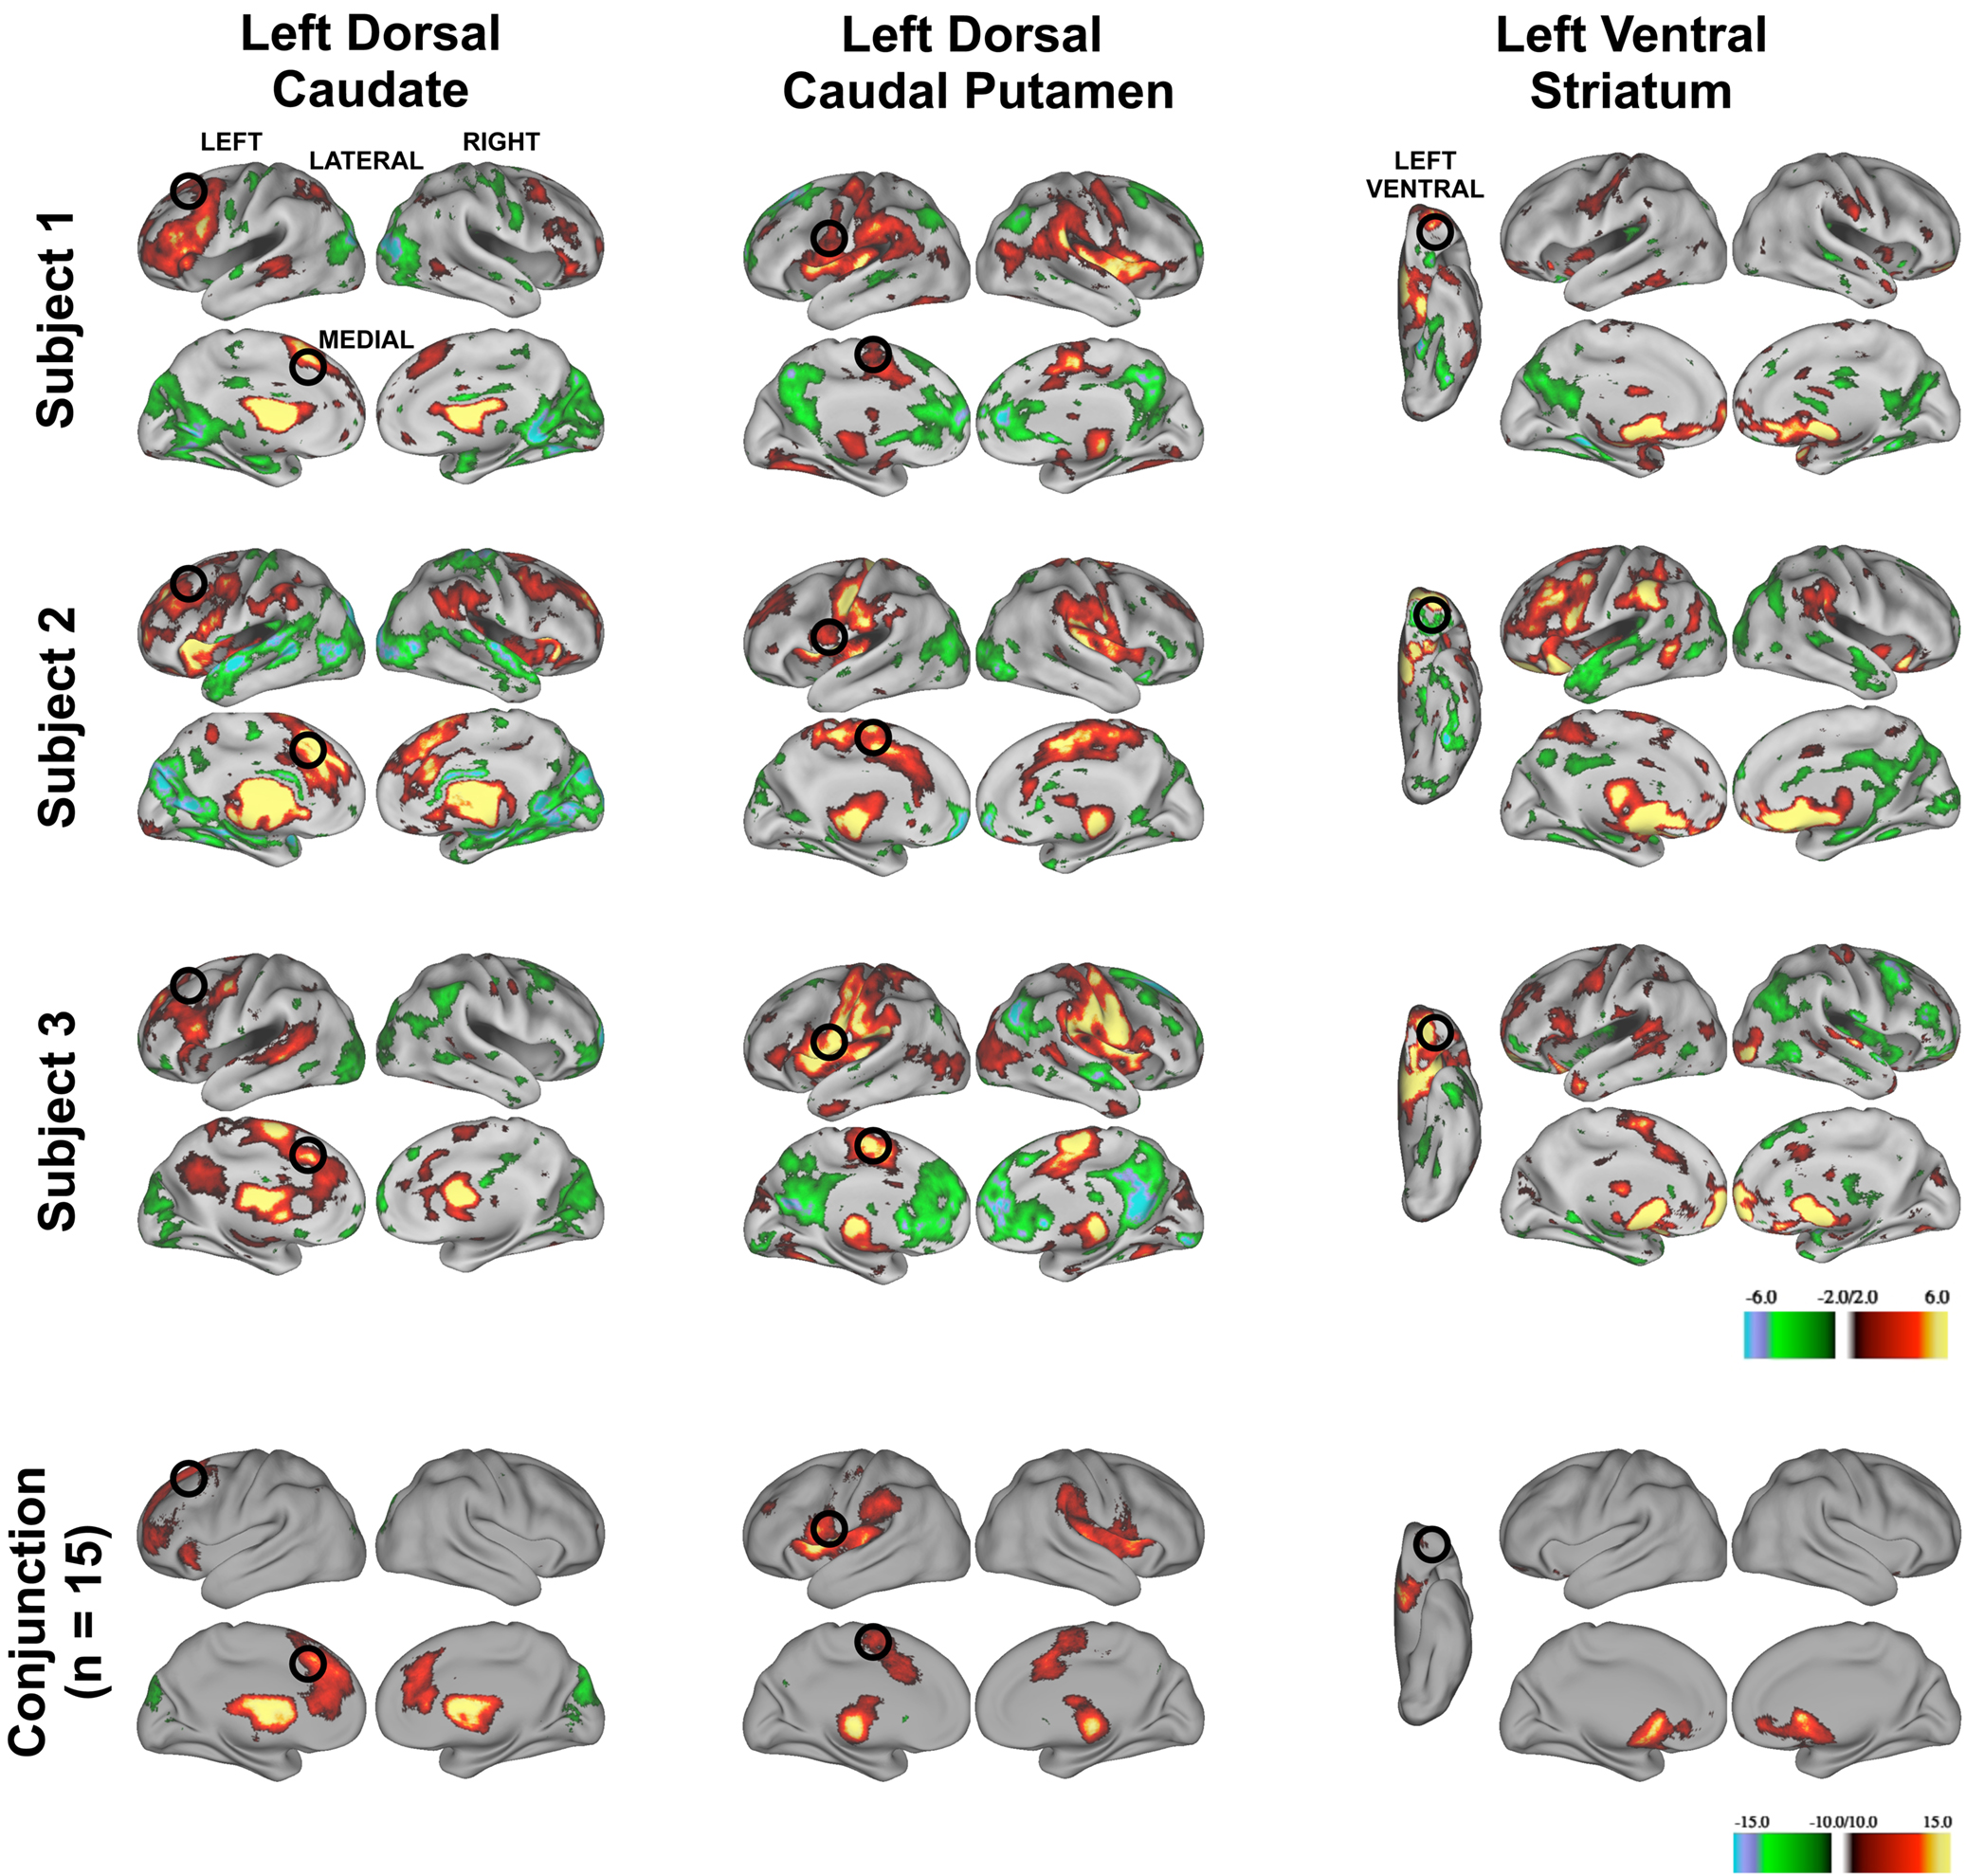
Figure 4. Z-transformed rs-fcMRI maps from three representative subject’s modularity optimization assignments for the left hemisphere (putative dorsal caudate, left column, putative dorsal caudal putamen, middle column, and putative ventral striatum, right column, z > 2.00) are similar. Black circles depict regions identified from the random-effects analysis (superior frontal gyrus: lateral rendering, first column; anterior cingulate cortex, medial rendering, first column; ventral premotor cortex: lateral rendering, second column; pre-supplementary motor cortex: medial rendering second column; orbitofrontal cortex: ventral rendering, third column). Row 4. Conjunction image of all subjects rs-fcMRI maps (z > 2.00).
Cohort Two
We examined a second cohort to assess independently the reliability of our results. First, we examined Cohort Two to test whether we would find similar groupings. As with Cohort One, the number of groupings identified for the left (M = 6.82, SD = 2.04, range = 3–10) and right (M = 9.09, SD = 5.87, range = 4–21) hemispheres did not differ, p = 0.25. Further, the number of groupings identified for each hemisphere did not differ across cohorts (left hemisphere: p = 0.80, right hemisphere: p = 0.18). Visual inspection of the groupings’ locations revealed that modularity optimization generated discrete, contiguous groups of basal ganglia voxels in locations consistent with presumed basal ganglia divisions (see Figure S2 in Supplementary Material for representative Cohort Two subjects and conjunction analysis for Cohort Two). Again, we could identify groupings of basal ganglia voxels consistent with the location of the dorsal caudate, the dorsal caudal putamen, and the ventral striatum in each hemisphere and subject.
Next, we examined whether functional connectivity maps derived from modularity optimization assignments were consistent across cohorts. As described above, for each of the three basal ganglia divisions (i.e., the putative dorsal caudate, dorsal caudal putamen, and ventral striatum) we generated six whole-brain correlation maps for each subject (three putative divisions × 2 hemispheres). Each subject’s z-transformed whole-brain correlation map was used in a second level random-effects analysis involving one-sample t-tests (z > 3.00, k = 21, p < 0.05, Monte Carlo corrected). The random-effects maps for the left hemisphere for Cohort Two (Figure 3 , row 2) revealed qualitatively distinct patterns of functional connectivity for the putative dorsal caudate, dorsal caudal putamen, and ventral striatum. (More spatially extensive regions of above threshold correlations in Cohort One than Cohort Two likely results from Cohort One’s larger sample size.) Conjunction analyses (conducted by thresholding the one-sample t-test images for each group at z > 3.00, k = 21, p < 0.05, Monte Carlo corrected (see Forman et al., 1995 ), binarizing the thresholded images, and then searching for overlap) across Cohort One and Cohort Two’s random-effects analyses revealed largely overlapping patterns of functional connectivity across cohorts for each putative basal ganglia division (Figure 3 , bottom row). (See Figure S3 in Supplementary Material for random-effects analyses for the right hemisphere for Cohort Two and conjunction analyses across cohorts.) These data indicate that putative basal ganglia divisions generated for two independent cohorts yield replicable patterns of functional connectivity. Accordingly, this independent replication increases our confidence in using rs-fcMRI to identify putative basal ganglia divisions.
Discussion
The present study demonstrates that a combination of rs-fcMRI and graph theoretic analyses (i.e., modularity optimization) can be used to reliably identify divisions in the basal ganglia of individual subjects. For each subject, multiple divisions were identified and these divisions were similarly located across subjects. Furthermore, the correlation maps generated from modularity optimization groupings were similar across subjects. The putative basal ganglia divisions identified using modularity optimization have strong face validity since the locations of significant cortical-basal ganglia functional connectivity was consistent with the presumed connectivity of basal ganglia divisions.
Our approach to non-invasively parcellating the basal ganglia extends prior methods in ways that facilitate examination of individual subjects. We conducted voxel-wise whole-brain correlations, which allowed us to examine cortical-basal ganglia functional connectivity with a higher resolution than studies that apply large-scale cortical ROIs (Lehericy et al., 2004 ; Leh et al., 2007 ; Zhang et al., 2008 ), which encompassed very large swaths of cortex (e.g., prefrontal cortex) up to multiple lobes (e.g., parietal and occipital cortex). Additionally, by generating divisions for each subject rather than applying ROIs to fixed stereotactic locations (e.g., Di Martino et al., 2008 ; Harrison et al., 2009 ) we can better accommodate individual variation in subcortical volume, either total basal ganglia volumes or volumes of particular basal ganglia divisions. Accommodation of individual differences in regional brain volume is particularly important when examining individuals with disorders where basal ganglia volumes are thought to be reduced, such as Tourette’s syndrome (see Albin and Mink, 2006 ) and attention deficit hyperactivity disorder (see Valera et al., 2007 ). For instance, it is unclear whether volumetric reductions in the caudate in individuals with Tourette’s syndrome stem from a volumetric reduction of a particular basal ganglia division or from a more generalized shrinking. Following further validation, future studies could use these methods to identify putative basal ganglia divisions in individual subjects prior to spatial normalization and could help delineate between these alternatives because regional brain volumes and spatial extent characteristics would be retained.
While this method appears to provide a substantial advance in the ability to parcellate the basal ganglia in individual subjects, it is not clear whether this method would successfully parcellate very small subcortical structures, for instance smaller basal ganglia nuclei such as the subthalamic nucleus and substantia nigra. First, it is difficult to distinguish these smaller basal ganglia nuclei from neighboring structures in BOLD scans (e.g., substantia nigra and the nearby ventral tegmental area, Aron et al., 2007 ). Second, small structures will necessarily yield a smaller number of voxels for analysis than will large structures. Modularity optimization algorithms ought to be more successful with larger networks (c. >100 nodes) because groupings in large networks are less influenced by the placement of individual edges. Therefore, the graph theory methods used in the present study may not be appropriate for the smaller networks generated from smaller structures. However, it is likely that the present methods would be appropriate for parcellating other larger, subcortical structures (e.g., the thalamus) on a subject-wise basis.
In this manuscript we have only focused on characterizing three putative basal ganglia divisions. This focused look at putative basal ganglia divisions was predicated on the minimum number of groupings identified across subjects using modularity optimization. However, on average, modularity optimization identified 6–7 groupings. Using rs-fcMRI, Di Martino et al. (2008) reported different patterns of cortical-basal ganglia functional connectivity for six ROIs placed in the caudate and the putamen. Thus, the average number of groupings identified with modularity optimization converges with prior investigations of basal ganglia divisions in humans. Further work is needed to understand the sources of variability in the number of groupings identified across subjects. For instance, it is possible that tailoring the modularity threshold investigated based on individual rather than group-level network metrics (e.g., edge density, graph connectedness) would reduce the variability in the number of groupings identified with modularity optimization. Additionally, generating objective ways to identify similar modules across subjects on the basis of their anatomical location and functional connectivity patterns (e.g., using assignment algorithms such as the Hungarian algorithm, Kuhn, 1955 ) is an important direction for future research. The current assignment method (i.e., labeling on the basis of stereotactic coordinates reported in past research) is subjective, as it requires an investigator to make a decision for each module and subject. Nonetheless, it is important to note that qualitatively reliable patterns of cortical-basal ganglia functional connectivity were found for the three putative basal ganglia divisions that were the focus of this manuscript.
Future work is needed to validate the divisions generated with rs-fcMRI and modularity optimization methods. One open question is the extent to which basal ganglia parcellations based on rs-fcMRI data overlap with parcellations based on DTI data. Recent work examining the thalamus suggests that there is partial but not total overlap between rs-fcMRI and DTI-based parcellations (Zhang et al., 2010 ). It remains to be seen whether this observation is also true for the basal ganglia. It is unlikely that there will be total overlap between functional and anatomical measures of connectivity based on both the findings of Zhang et al. (2008 , 2010) and other research that has noted differences between anatomical and functional connectivity, as described in the introduction. Another means for validating putative basal ganglia divisions would involve testing for different task-evoked responses across putative divisions using functional MRI (fMRI). Work from our laboratory has demonstrated that putative cortical areas in left lateral parietal cortex identified using rs-fcMRI had distinct task-evoked fMRI time courses during memory retrieval in a meta-analysis conducted on independent data (Nelson et al., 2010 ). Again, it remains to be seen whether putative basal ganglia divisions have different task-evoked responses.
There are many interesting questions about cortical-basal ganglia functional connectivity that can be leveraged with a method to parcellate subcortical structures in individual subjects. For example, having a means to identify putative basal ganglia divisions on a subject-wise basis would provide a way to test hypotheses regarding cortical-basal ganglia connectivity in populations known to have reduced basal ganglia volumes. By identifying putative basal ganglia divisions in each subject and using these divisions as shape-preserved ROIs, researchers can ensure that each individual’s ROIs are optimally located for each subject, reducing the likelihood that differences in functional connectivity between groups are the result of suboptimal seed placement in one group. For instance, shape-preserved ROIs could be used in lieu of standard spherical ROIs in graph theoretical analyses of functional network organization or between-group comparisons of functional connectivity strength. These methods would improve our understanding of the contributions of cortical-basal ganglia functional connectivity to the development of cognitive control (Liston et al., 2006 ; Rubia et al., 2006 ) and would help neuroscientists better understand the neural underpinnings of the many disorders that are characterized by structural and functional basal ganglia dysfunction (e.g., Tourette’s Syndrome, attention deficit hyperactivity disorder, Huntington’s disease, Parkinson’s disease).
Conflict of Interest Statement
The authors declare that the research was conducted in the absence of any commercial or financial relationships that could be construed as a potential conflict of interest.
Acknowledgments
The authors thank Kelly McVey and Rebecca Coalson for their help with data collection. This work was supported by the National Institutes of Health NS 007205-28 (Kelly Anne Barnes), NS 061144 (Steven E. Petersen), NS 053425 (Bradley L. Schlaggar) and NS 062489 (Alexander L. Cohen).
Supplementary Material
The Supplementary Material for this article can be found online at http://www.frontiersin.org/neuroscience/systemsneuroscience/paper/10.3389/fnsys.2010.00018/
Footnote
References
Albin, R. L., and Mink, J. W. (2006). Recent advances in Tourette syndrome research. Trends Neurosci. 29, 175–182.
Alexander, G. E., Delong, M. R., and Strick, P. L. (1986). Parallel organization of functionally segregated circuits linking basal ganglia and cortex. Annu. Rev. Neurosci. 9, 357–381.
Aron, A. R., Behrens, T. E., Smith, S., Frank, M. J., and Poldrack, R. A. (2007). Triangulating a cognitive control network using diffusion-weighted magnetic resonance imaging (MRI) and functional MRI. J. Neurosci. 27, 3743–3752.
Cohen, A. L., Fair, D. A., Dosenbach, N. U., Miezin, F. M., Dierker, D., Van Essen, D. C., Schlaggar, B. L., and Petersen, S. E. (2008). Defining functional areas in individual human brains using resting functional connectivity MRI. Neuroimage 41, 45–57.
Di Martino, A., Scheres, A., Margulies, D. S., Kelly, A. M., Uddin, L. Q., Shehzad, Z., Biswal, B., Walters, J. R., Castellanos, F. X., and Milham, M. P. (2008). Functional connectivity of human striatum: a resting state FMRI study. Cereb. Cortex 18, 2735–2747.
Dosenbach, N. U., Fair, D. A., Cohen, A. L., Schlaggar, B. L., and Petersen, S. E. (2008). A dual-networks architecture of top-down control. TICS. 12, 99-105.
Draganski, B., Kherif, F., Kloppel, S., Cook, P. A., Alexander, D. C., Parker, G. J., Deichmann, R., Ashburner, J., and Frackowiak, R. S. (2008). Evidence for segregated and integrative connectivity patterns in the human Basal Ganglia. J. Neurosci. 28, 7143–7152.
Fair, D. A., Cohen, A. L., Power, J. D., Dosenbach, N. U. F., Church, J. A., Miezin, F. M., Schlaggar, B. L., and Petersen, S. E. (2009). Functional brain networks develop from a “local to distributed” organization. PLoS Comput. Biol. 5 doi:10.1371/journal.pcbi.1000381.
Fair, D. A., Dosenbach, N. U. F., Church, J. A., Cohen, A. L., Brahmbhatt, S., Miezin, F. M., Barch, D. M., Raichle, M. E., Petersen, S. E., and Schlaggar, B. L. (2007). Development of distinct control networks through segregation and integration. Proc. Natl. Acad. Sci. USA 104, 13507–13512.
Fischl, B., Salat, D. H., Busa, E., Albert, M., Dieterich, M., Haselgrove, C., van der Kouwe, A., Killiany, R., Kennedy, D., Klaveness, S., Montillo, A., Makris, N., Rosen, B., and Dale, A. M. (2002). Whole brain segmentation: automated labeling of neuroanatomical structures in the human brain. Neuron 33, 341–355.
Fischl, B., Salat, D. H., van der Kouwe, A. J., Makris, N., Segonne, F., Quinn, B. T., and Dale, A. M. (2004). Sequence-independent segmentation of magnetic resonance images. Neuroimage 23(Suppl. 1), S69–S84.
Forman, S. D., Cohen, J. D., Fitzgerald, M., Eddy, W. F., Mintun, M. A., and Noll, D. C. (1995). Improved assessment of significant activation in functional magnetic resonance imaging (fMRI): use of a cluster-size threshold. Magn. Reson. Med. 33, 636–647.
Fox, M. D., Snyder, A. Z., Vincent, J. L., Corbetta, M., Van Essen, D. C., and Raichle, M. E. (2005). The human brain is intrinsically organized into dynamic, anticorrelated functional networks. Proc. Natl. Acad. Sci. USA 102, 9673–9678.
Fox, M. D., Zhang, D., Snyder, A. Z., and Raichle, M. E. (2009). The global signal and observed anticorrelated resting state brain networks. J. Neurophysiol. 101, 3270–3283.
Gerfen, C. R. (1989). The neostriatal mosaic: striatal patch-matrix organization is related to cortical lamination. Science 246, 385–388.
Graybiel, A. M. (1990). Neurotransmitters and neuromodulators in the basal ganglia. Trends Neurosci. 13, 244–254.
Haber, S. N. (2003). The primate basal ganglia: parallel and integrative networks. J. Chem. Neuroanat. 26, 317–330.
Harrison, B. J., Soriano-Mas, C., Pujol, J., Ortiz, H., Lopez-Sola, M., Hernandez-Ribas, R., Deus, J., Alonso, P., Yucel, M., Pantelis, C., Menchon, J. M., and Cardoner, N. (2009). Altered corticostriatal functional connectivity in obsessive-compulsive disorder. Arch. Gen. Psychiatry 66, 1189–1200.
Hedden, T., and Gabrieli, J. D. (2004). Insights into the ageing mind: a view from cognitive neuroscience. Nat. Rev. Neurosci. 5, 87–96.
Ihnen, S. K., Church, J. A., Petersen, S. E., and Schlaggar, B. L. (2009). Lack of generalizability of sex differences in the fMRI BOLD activity associated with language processing in adults. Neuroimage 45, 1020–1032.
Lancaster, J. L., Glass, T. G., Lankipalli, B. R., Downs, H., Mayberg, H., and Fox, P. T. (1995). A modality-independent approach to spatial normalization of tomographic images of the human brain. Hum. Brain Mapp. 3, 209–223.
Leh, S. E., Ptito, A., Chakravarty, M. M., and Strafella, A. P. (2007). Fronto-striatal connections in the human brain: a probabilistic diffusion tractography study. Neurosci. Lett. 419, 113–118.
Lehericy, S., Ducros, M., Krainik, A., Francois, C., Van de Moortele, P. F., Ugurbil, K., and Kim, D. S. (2004). 3-D diffusion tensor axonal tracking shows distinct SMA and pre-SMA projections to the human striatum. Cereb. Cortex 14, 1302–1309.
Liston, C., Watts, R., Tottenham, N., Davidson, M. C., Niogi, S., Ulug, A. M., and Casey, B. J. (2006). Frontostriatal microstructure modulates efficient recruitment of cognitive control. Cereb. Cortex 16, 553–560.
Middleton, F. A., and Strick, P. L. (2000). Basal ganglia output and cognition: evidence from anatomical, behavioral, and clinical studies. Brain Cogn. 42, 183–200.
Miezin, F. M., Maccotta, L., Ollinger, J. M., Petersen, S. E., and Buckner, R. L. (2000). Characterizing the hemodynamic response: effects of presentation rate, sampling procedure, and the possibility of ordering brain activity based on relative timing. Neuroimage 11, 735–759.
Mink, J. W. (1996). The basal ganglia: focused selection and inhibition of competing motor programs. Prog. Neurobiol. 50, 381–425.
Nelson, S. M., Cohen, A. L., Power, J. D., Wig, G. S., Miezin, F. M., Wheeler, M. E., Velanova, K., Donaldson, D. I., Phillips, J. S., Schlaggar, B. L., and Petersen, S. E. (2010). A parcellation scheme for human left lateral parietal cortex. Neuron (in press).
Newman, M. E. (2006). Modularity and community structure in networks. Proc. Natl. Acad. Sci. USA 103, 8577–8582.
Postuma, R. B., and Dagher, A. (2006). Basal ganglia functional connectivity based on a meta-analysis of 126 positron emission tomography and functional magnetic resonance imaging publications. Cereb. Cortex 16, 1508–1521.
Rubia, K., Smith, A. B., Woolley, J., Nosarti, C., Heyman, I., Taylor, E., and Brammer, M. (2006). Progressive increase of frontostriatal brain activation from childhood to adulthood during event-related tasks of cognitive control. Hum. Brain Mapp. 27, 973–993.
Snyder, A. Z. (1996). “Difference image vs. ratio image error function forms in PET-PET realignment,” in Quantification of Brain Function Using PET, eds R. Myer, V. J. Cunningham, D. L. Bailey, and T. Jones (San Diego, CA: Academic Press), 131–137.
Valera, E. M., Faraone, S. V., Murray, K. E., and Seidman, L. J. (2007). Meta-analysis of structural imaging findings in attention-deficit/hyperactivity disorder. Biol. Psychiatry 61, 1361–1369.
Vincent, J. L., Patel, G. H., Fox, M. D., Snyder, A. Z., Baker, J. T., Van Essen, D. C., Zempel, J. M., Snyder, L. H., Corbetta, M., and Raichle, M. E. (2007). Intrinsic functional architecture in the anesthetized monkey brain. Nature 447, 46–47.
Zhang, D., Snyder, A. Z., Fox, M. D., Sansbury, M. W., Shimony, J. S., and Raichle, M. E. (2008). Intrinsic functional relations between human cerebral cortex and thalamus. J. Neurophysiol. 100, 1740–1748.
Keywords: striatum, functional connectivity, graph theory, cortico-basal ganglia loops, connectome
Citation: Barnes KA, Cohen AL, Power JD, Nelson SM, Dosenbach YBL, Miezin FM, Petersen SE and Schlaggar BL (2010) Identifying basal ganglia divisions in individuals using resting-state functional connectivity MRI. Front. Syst. Neurosci. 4:18. doi: 10.3389/fnsys.2010.00018
Received: 19 February 2010;
Paper pending published: 23 March 2010;
Accepted: 11 May 2010;
Published online: 10 June 2010
Edited by:
Lucina Q. Uddin, Stanford University, USAReviewed by:
Adriana Di Martino, New York University Langone Medical Center, USABogdan Draganski, University College London, UK
Copyright: © 2010 Barnes, Cohen, Power, Nelson, Dosenbach, Miezin, Petersen and Schlaggar. This is an open-access article subject to an exclusive license agreement between the authors and the Frontiers Research Foundation, which permits unrestricted use, distribution, and reproduction in any medium, provided the original authors and source are credited.
*Correspondence: Kelly Anne Barnes, Department of Neurology, Washington University School of Medicine, 4525 Scott Avenue, Room 2220, St. Louis, MO 63110, USA. e-mail: barnesk@npg.wustl.edu