Corticomuscular coherence between motor cortex, somatosensory areas and forearm muscles in the monkey
- Institute of Neuroscience, Newcastle University, Newcastle upon Tyne, Tyne and Wear, UK
Corticomuscular coherence has previously been reported between primary motor cortex (M1) and contralateral muscles. We examined whether such coherence could also be seen from somatosensory areas. Local field potentials (LFPs) were recorded from primary somatosensory cortex (S1; areas 3a and 2) and posterior parietal cortex (PPC; area 5) simultaneously with M1 LFP and forearm EMG activity in two monkeys during an index finger flexion task. Significant beta-band (∼20 Hz) corticomuscular coherence was found in all areas investigated. Directed coherence (Granger causality) analysis was used to investigate the direction of effects. Surprisingly, the strongest beta-band directed coherence was in the direction from S1/PPC to muscle; it was much weaker in the ascending direction. Examination of the phase of directed coherence provided estimates of the time delay from cortex to muscle. Delays were longer from M1 (∼62 ms for the first dorsal interosseous muscle) than from S1/PPC (∼36 ms). We then looked at coherence and directed coherence between M1 and S1 for clues to this discrepancy. Directed coherence showed large beta-band effects from S1/PPC to M1, with smaller directed coherence in the reverse direction. The directed coherence phase suggested a delay of ∼40 ms from M1 to S1. Corticomuscular coherence from S1/PPC could involve multiple pathways; the most important is probably common input from M1 to S1/PPC and muscles. If correct, this implies that somatosensory cortex receives oscillatory efference copy information from M1 about the motor command. This could allow sensory inflow to be interpreted in the light of its motor context.
Introduction
Oscillations in the beta band (15−30 Hz) are found throughout the motor system and behave in a task-dependent manner, but their function is as yet unknown. These oscillations appear as rhythmical fluctuations in both EEG and field potential recordings, as well as synchronous cell activity at the same frequency. They occur in sensorimotor cortex of both monkeys and humans (Tiihonen et al., 1989; Murthy and Fetz, 1992; Salmelin and Hari, 1994). Beta-band oscillations have been shown to be altered in various diseases including Parkinson’s Disease and dystonia (Hutchison et al., 2004).
Coherence is the standard technique for measuring the strength of correlations between two signals in the frequency domain (Rosenberg et al., 1989). It provides amplitude and phase information about the relationship between two signals at a particular frequency. The phase lag between two signals, and its dependence on frequency, can also be used to infer a conduction delay if the relationship is purely feedforward (Rosenberg et al., 1989). More recently Granger causality has been used (Brovelli et al., 2004). This attempts to predict oscillations in one area from the past history of oscillations in another, and can help determine the direction in which oscillations are propagated.
Oscillations in primary motor cortex (M1) are coherent with EMG and cerebellar activity (Conway et al., 1995; Baker et al., 1997; Salenius et al., 1997; Halliday et al., 1998; Courtemanche and Lamarre, 2005; Soteropoulos and Baker, 2006). Early monkey studies by Murthy and Fetz (1992) showed that oscillations are also present in primary somatosensory cortex (S1), and that there is beta-band coherence between M1 and S1. Electrocorticogram (ECOG) recordings in humans with intractable epilepsy reveal coherence between M1 and S1 (Ohara et al., 2001). In fact, S1 oscillations in monkeys actually have a larger amplitude than those in M1 (Witham and Baker, 2007). Using Granger causality analysis, Brovelli et al. (2004) and Tsujimoto et al. (2009) demonstrated causal influences from S1 to M1 and also from S1 to area 5 of PPC in the beta band in monkeys.
Coherence between cortical activity and contralateral muscles may be mediated by both motor and somatosensory pathways. Riddle and Baker (2005) used cooling of the forearm to increase peripheral conduction times in human subjects; the changes in corticomuscular coherence phase suggested that afferent feedback pathways, as well as descending motor output, contributed to corticomuscular coherence. Baker and Baker (2003) investigated the effects on corticomuscular coherence of benzodiazepine administration in humans, and concluded that the results were incompatible with simple transmission of oscillations from cortex to muscle by descending pathways. Finally, muscle spindle afferents in monkeys show coherence with EMG (Baker et al., 2006), providing direct evidence for ascending transmission of oscillatory information.
The evidence above suggests that the somatosensory system is important in generating corticomuscular coherence, but this remains controversial. Ohara et al. (2000) found coherence between ECOG recordings over S1 and EMG in humans suffering from intractable epilepsy. The slopes of the phase–frequency relationship for this coherence suggested that S1 led the EMG with a short delay. However this does not rule out an afferent contribution to corticomuscular coherence. Gerloff et al. (2006) studied patients suffering from congenital hemiparesis in whom M1 had relocated to the hemisphere ipsilateral to the paretic hand, whilst S1 remained on the contralateral side. In these subjects it was possible to separate signals from M1 and S1 in MEG recordings; corticomuscular coherence was seen from M1 but not S1. However, these patients have undergone substantial reorganization of their nervous system and it is unclear how much they reflect the relative contributions of M1 and S1 in normal humans.
Tsujimoto et al. (2009) used field potential recordings in monkey to investigate corticomuscular coupling using the directed transfer function (DTF). They showed coherence between both pre- and post-central sites and EMG; the DTF suggested that the major causal influence was from cortex to muscle in all cases. However, this study was not able to separate the different somatosensory recordings by cortical area. Baker et al. (2006) reported that coherence between EMG and afferent discharge was considerably smaller for putative cutaneous fibers than those likely to be muscle spindle afferents. S1 areas 3b and 1 receive mainly cutaneous information, compared to the predominantly deep receptive fields of areas 3a and 2. An afferent contribution to corticomuscular coherence would therefore be most likely therefore in areas 3a and 2.
In this paper we use field potential recordings from identified motor, somatosensory and posterior parietal areas of the monkey cortex together with EMG to probe the contributions to corticomuscular coherence of the different sensorimotor areas. We apply both standard coherence analysis, and directed coherence (Granger causality). By targeting our recordings on cortical areas known to receive proprioceptive information, and by estimating the delays in the causal interactions between sites, we are able to address specific hypotheses on the pathways which might underlie the observed effects. Our results support the idea that beta-band oscillations are important in sensorimotor integration between motor and somatosensory/parietal areas.
Materials and Methods
Behavioral Task
Two female rhesus macaques (M. mulatta) were trained to perform a finger flexion task for food reward. The index finger was inserted into a narrow tube, which splinted the finger and constrained movement to the metacarpophalangeal (MCP) joint. The tube was mounted on a lever which rotated on an axis aligned to the MCP joint. Lever movement was sensed by an optical encoder, and a motor exerted torque in a direction to oppose flexion. This was programmed to act like a spring (initial torque 48 mNm). The task required movement into target (6°, 12°, 18° or 24° flexion) and holding for 2 s (torque required at target either 64 mNm or 128 mNm). The four positions and two torques gave eight task conditions. The different conditions were presented in a pseudorandom order. Motor torque then rose, and the animal released the lever to obtain its reward (food rewards were given randomly every one to five trials). Visual feedback of target and lever position was provided via a computer screen. The analysis reported here focuses on the hold period of this task, as periods of steady holding have previously been shown to contain the strongest beta-band activity (Gastaut et al., 1952; Baker et al., 1997, 2001; Witham and Baker, 2007).
Surgical Preparation
Following behavioral training, each monkey was implanted with EMG patch electrodes over 10 forearm and hand muscles, using the technique developed by Miller and Houk (1995). Wires from the EMG electrodes were tunneled subcutaneously to a connector on the back. Only recordings from first dorsal interosseous (1DI) and flexor digitorum profundus (FDP) are reported here, as these muscles displayed consistent activity during the task in both animals. We chose to include an intrinsic hand muscle as well as a forearm muscle as these should have different conduction delays from the cortex. The flexor digitorum superficialis (FDS) electrode gave a poor recording in monkey M. In monkey L the results for FDS (not shown) were similar to those for FDP. Cross-talk between these two EMGs was assessed to be negligible (magnitude of correlation between third-order differentiated unrectified EMG less than 0.02; Kilner et al., 2002). In a subsequent surgery the monkey received a stainless-steel headpiece (to allow head fixation) and a recording chamber placed over the central sulcus (Lemon, 1984; Baker et al., 2001). Surgeries were carried out under aseptic conditions, and general anesthesia (3.0–5.0% sevoflurane inhalation in 100% O2 supplemented with a continuous intravenous infusion of alfentanil, 0.025 mg/kg/h). A full program of post-operative analgesia (10 μg/kg buprenorphine; Vetergesic; Reckitt and Colman Products, 5 mg/kg carprofen; Rimadyl; Pfizer) and antibiotic care (10 mg/kg cefalexin; Ceporex; Schering-Plough Animal Health or 15 mg/kg amoxycillin; Clamoxyl LA; Pfizer) followed surgery. All procedures were carried out under the authority of licenses issued by the UK Home Office under the Animals (Scientific Procedures) Act 1986, and were approved by Newcastle University’s Local Ethical Review Panel.
Recording
In daily experiments, a 16 channel microdrive (Eckhorn and Thomas, 1993), loaded with glass-insulated platinum electrodes (M1) or tetrodes (area 3a, area 2, and area 5), was used to record LFPs, together with single unit activity as part of a related study. After completion of recording in M1, three microwires electrodes (50-μm diameter stainless steel wire insulated with Teflon, AM790500) were implanted transdurally and fixed in place to permit recording of M1 LFP simultaneously with other areas. LFPs (bandpass 1–100 Hz) were sampled continuously at 500 Hz, and saved to hard disk together with lever position, EMGs (bandpass 30 Hz–2 kHz, sampling rate 5000 Hz) and task behavioral markers. LFPs were recorded with negativity upward (inverting amplifier) and referenced to the stainless-steel headpiece. This large isopotential annulus probably yields a derivation similar to the linked-ear reference of human EEG. Similar results to those reported here were obtained using a bipolar derivation produced by differencing LFPs from the same area.
The different cortical areas were identified by electrode location, by a clinical examination of unit receptive fields and by noting the motor responses to intra-cortical microstimulation (ICMS). Cells in M1 showed clear ICMS (13–18 biphasic pulses, 300 Hz, 0.2 ms per pulse, currents up to 60 μA) effects at low threshold (<20 μA), usually digit or wrist movement. Cells in area 3a typically responded to single digit movement or wrist movement in one direction. ICMS effects were rarely observed in this area even at higher intensities (up to 60 μA, Widener and Cheney, 1997). Area 2 cells were located caudal to area 1 (cutaneous receptive fields) and tended to respond to single or multiple digit extension/flexion or wrist movement. The border between area 2 and area 5 was the most difficult to define. Most area 5 cells were located in the rostral bank of the intraparietal sulcus whereas area 2 cells were mainly on the post-central gyrus (Lewis et al., 1999). The area 5 cells had less well-defined proprioceptive receptive fields that were more often related to proximal joints (especially elbow) than cells in the other areas. Other more complex responses were seen in accordance with Mountcastle et al. (1975). Many area 5 cells were quiescent, unlike S1 cells, and only fired when the monkey began the task. Although we believe that most sites were correctly assigned, it is possible that the area 3a recordings included a few recordings from area 3b and the area 2 recordings included a small number of area 1 recordings.
Analysis
Coherence and directed coherence analysis techniques were used to examine functional linkages between cortical LFPs and EMGs and also between M1 and S1/area 5 LFPs. Whilst coherence is a measure of synchronization between two areas at a given frequency, directed coherence assesses the ability of the past history of one signal to predict another. Significant directed coherence may indicate a causal influence of one signal on another.
In all cases, only data from the 2 s hold phase of the task were used. LFP recordings from all available electrodes (between 2 and 12) in each recording session were averaged to yield a single, low-noise estimate of oscillatory activity in that area (see Baker et al., 2003). EMGs were full-wave rectified before further processing. Coherence and directed coherence were calculated by combining together all available recordings within a given monkey and area and treating them as one long recording. Before combination, LFP and rectified EMG from the different sessions were normalized by dividing them by their standard deviation. This procedure is similar to the “pooled coherence” method of Amjad et al. (1997) but avoids possible artifactually significant results if signal amplitudes covary across recording sessions (Baker, 2000). Data from all the different task conditions were used, as in a separate analysis no consistent differences were found between the coherence spectra for the different task conditions.
Coherence
To calculate LFP–EMG coherence, LFP was first up-sampled to 5 kHz to match the sampling rate of the EMG, and two non- overlapping 4096 point long sections were used from each hold period for the Fourier analysis (for details of coherence calculation see Baker et al., 1997). For LFP–LFP coherence, the original waveforms sampled at 500 Hz were used, with a 256 point Fast Fourier Transform and four non-overlapping sections per hold period. This gave a frequency resolution of 1.22 Hz for LFP–EMG coherence and 1.95 Hz for LFP–LFP coherence. Coherence was considered significant (P < 0.05) if it was greater than Z where

and L is the total number of non-overlapping sections (Rosenberg et al., 1989). Several bins would be expected to be above the significance limit by chance, due to the multiple comparisons implicit in examining a coherence spectrum with many frequency bins. The number of points above the significance level defined by Eq. 1 which would be expected by chance at the 95% level was estimated using the binomial distribution. The coherence spectrum (between 0 and 45 Hz) was only considered significant if the total number of points above the significance line was greater than this value (>4 points for LFP–LFP coherence and >5 points for LFP–EMG coherence). A similar approach to significance assessment was used in our previous work (Witham et al., 2007). Phase was calculated by taking the argument of the cross-spectrum. Confidence limits on the phase were calculated as (Rosenberg et al., 1989):
Directed coherence
Directed coherence was calculated using the method outlined in Baker et al. (2006), adjusted to use only data from the hold phase of the task. Rectified EMG and LFP recordings were down-sampled to a 200 Hz sampling rate. An autoregressive (AR) model of order 100 (see paragraph below for details on choice of model order) was fitted to the 400 points from each hold period of the task (using a publicly available program ArFit, Schneider and Neumaier, 2001). The AR model coefficients were then averaged together and used to calculate directed coherence and phase as in Baker et al. (2006). Although coherence can also be estimated from the AR model, we found this gave more variable estimates than the approach described above, which we used to match previous work in the field.
In this paper, we used the normalization of directed coherence suggested by Geweke (1982).
where Hij is the directional transfer function representing the causal influence of signal j on signal i, Hii is the directional transfer function representing the causal influence of signal i on itself, Cii or Cjj are the covariances of the noise innovations of each signal in the AR model, and complex conjugation is denoted by?. This is similar to the approach we have used previously (Baker et al., 2006), but is more generally applicable to signals with non-white power spectra. Using this normalization, the directed coherence can be interpreted as the proportion of the variance in signal i which is explained by the past history of signal j (a coefficient of determination, Pierce, 1982). This contrasts to the alternative normalization used in the DTF, where the magnitude of a causal effect is expressed as a fraction of all causal effects on that signal (Tsujimoto et al., 2009).
In the mathematical literature on AR models, much is made of the choice of model order. Several methods exist which seek to maximize the model’s fit to the available data, whilst avoiding excessive numbers of free parameters and consequent overfitting to a limited dataset. If such overfitting occurs, the model parameters begin to represent noise fluctuations in the data, rather than the genuine spatio-temporal relationships between the variables which are sought. This is important if the goal is to use the model to extrapolate from the recorded data to make predictions of future values (e.g., when attempting to predict financial time series). In this case, overfitting will lead to spurious predictions which extrapolate noise into the future. By contrast, in this work we use the model parameters to assess the strength of inter-relationships between the recorded signals. We therefore begin by choosing an arbitrarily high model order. We then carry out statistical tests on the resulting directed coherence spectra to assess which features are likely to result purely from noise, and which reflect genuine effects. This approach is comparable to the use of standard coherence spectra, in which we measure coherence at many frequencies, and then test which frequency bins have coherence significantly different from zero.
The choice of model order is important mainly in so far as it alters the frequency resolution of the directed coherence. Using a model order of 100 for data sampled at 200 Hz will result in a frequency resolution of 2 Hz. Although apparently smoother spectra can be obtained using interpolation methods and lower model orders (Ding et al., 2000), the number of free parameters defining the spectrum remains equal to the model order. We chose an order of 100, because it provided sufficient frequency resolution to examine how the phase of the directed coherence varies with frequency. In cases where phase was linearly related to frequency, measurement of the slope of this relationship allowed estimation of the time delay, a key parameter in constraining hypotheses of what pathways might underlie the effects.
Importantly, the analysis reported here used very large datasets: between 2668 and 27460 trials of the task for each cortical area (mean 12319). AR models were thus fitted to between 1 and 11 million sample points, depending on the cortical area. In such circumstances, overfitting of the data is not a concern. A similar approach to model order was taken by Baker et al. (2006).
Baker et al. (2006) found that the analytical significance limits normally applied to coherence were also appropriate for directed coherence. In the present work, we found that this was not the case, probably due to the use of data from discrete trials rather than a continuous recording. This was tested by simulating two uncorrelated white noise signals and fitting the AR models to small sections of the signals (400 points), corresponding to single “trials”. We found that the analytical significance levels were too low and gave an excessive number of false positives (>5%). Significance limits were therefore estimated by numerical Monte Carlo simulation. Two signals were generated as independent Gaussian random vectors with the same number of trials as the original data, and the directed coherence calculated. This was repeated 50 times with different random numbers. Directed coherence estimates at all frequencies and for all simulations were rank ordered, and the 95th percentile used as an approximate P < 0.05 significance level when using that number of trials. Additionally a permutation test (not shown) was used to calculate significance; this estimated the significance limits by shuffling the original data, and produced similar results. As with the standard coherence spectra, the binomial distribution was used to determine the number of significant frequency bins required to accept the spectrum as showing a significant effect (in this case, more than four bins in the 0–45 Hz range).
Phase delays
For both coherence and directed coherence phase delays were calculated by fitting a line to the phase – frequency plot using linear regression and calculating the slope; the slope divided by 2π gave the delay in seconds. Since phase–frequency relationships do not in general have zero intercept (Mima et al., 2000), both slope and intercept were unconstrained in the regression. Delays are presented as the maximum likelihood value returned by the regression fit, and the 95% confidence interval. All analysis routines were implemented in the MATLAB package (The MathWorks Inc, Natick, MA, USA).
Example of analysis
Figure 1 illustrates application of coherence and directed coherence to simulated data, with the aim of demonstrating the relative abilities of the two methods. In Figure 1A, two signals have been simulated as Gaussian white noise. Signal B receives a delayed input from signal A, with a delay of 20 ms. The coherence spectrum is flat in this situation (Figure 1Aa), correctly identifying the lack of any frequency specificity in the coupling. The coherence phase (Figure 1Ab) shows a linear phase–frequency dependence; the negative slope indicates that A leads B. The value of the slope implies a delay of 19.9 ms, close to the 20 ms delay used to simulate the data.
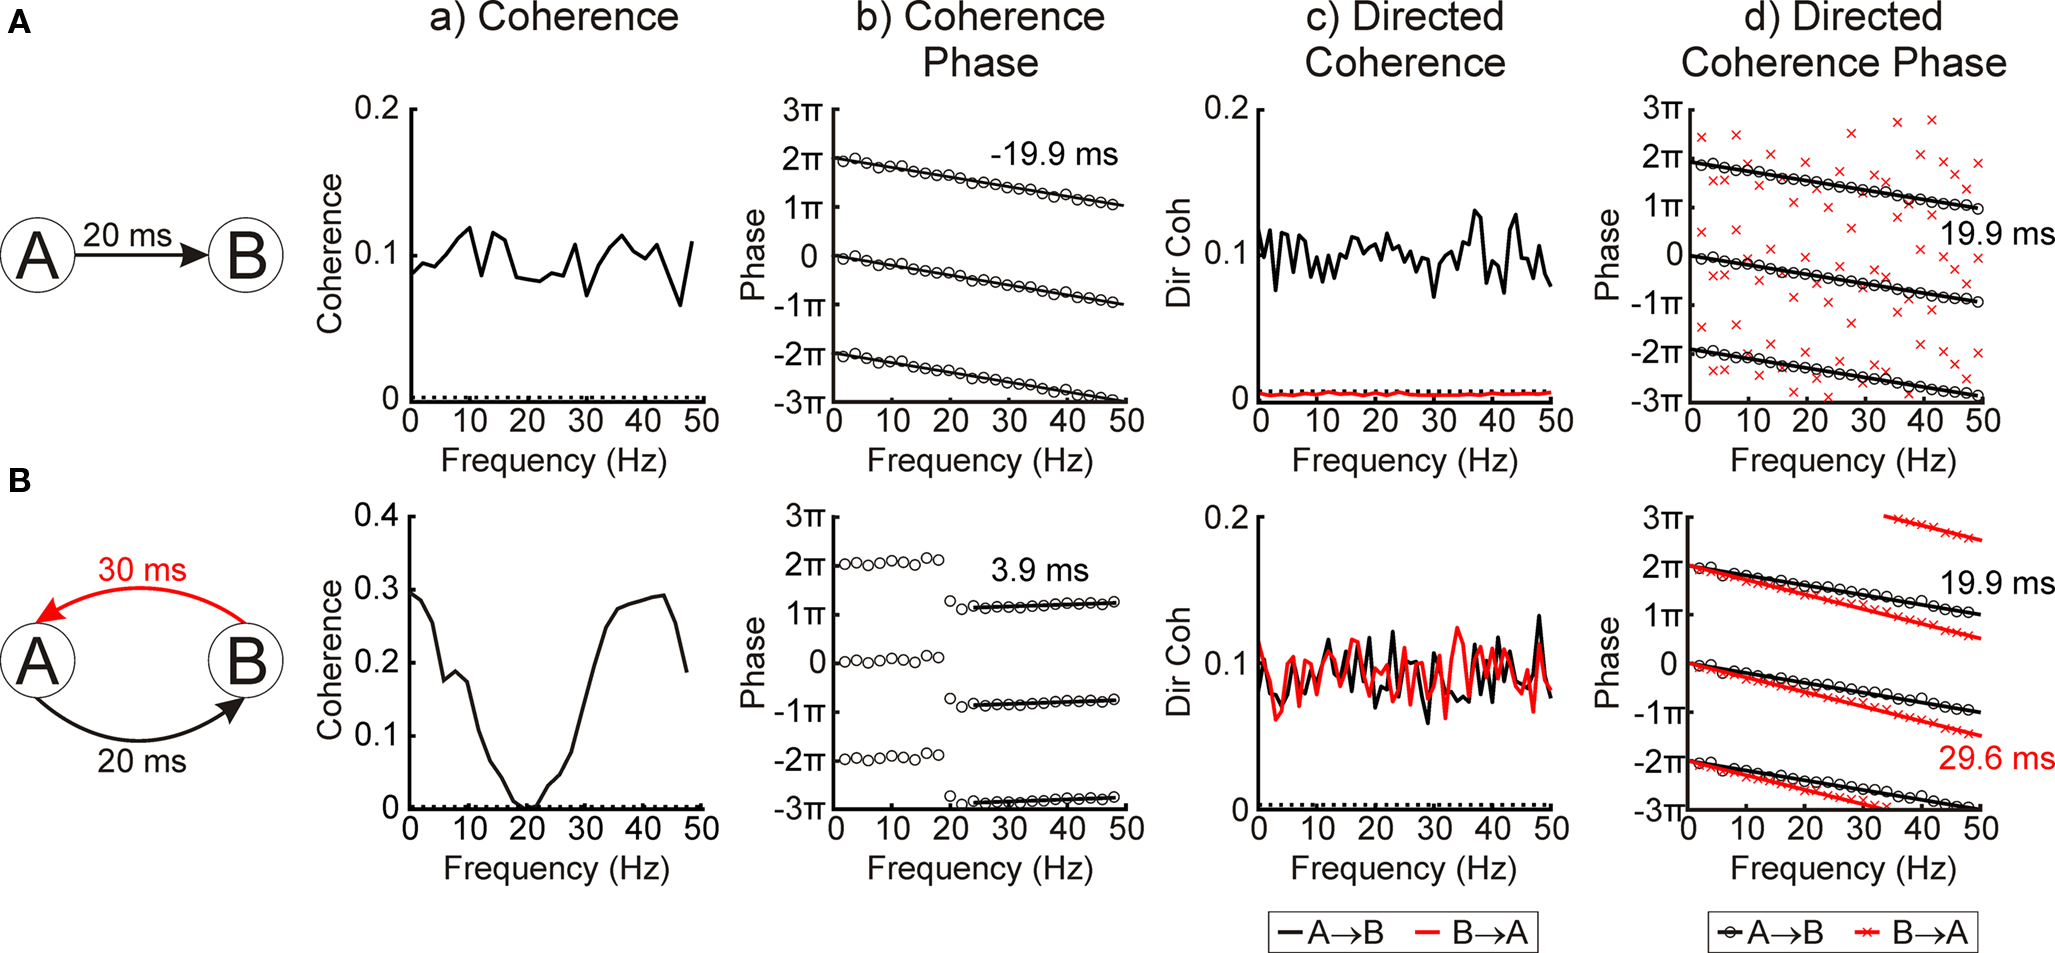
Figure 1. Using directed coherence to determine bi-directional coupling and delays. (A) coherence and directed coherence analysis of two simulated white band signals with uni-directional coupling (A → B with a 20-ms delay). (B) coherence and directed coherence analysis of two simulated white band signals with bi-directional coupling (A → B with a 20-ms delay and B → A with a 30-ms delay). (a) coherence spectra. Dotted lines show 95% significance level. (b) coherence phase spectra. Phase plotted three times to avoid wrap-around effects. Black lines show best fit with text indicating the phase delay. (c) directed coherence spectra. Dotted lines show 95% significance level. (d) directed coherence phase spectra. Phase plotted three times to avoid wrap-around effects. Black lines show best fit with text indicating the phase delay.
The directed coherence for this situation has a magnitude similar to coherence for the A → B direction, but is below the significance limit for the B → A direction (Figure 1Ac). The phase of the A → B directed coherence is similar to that for coherence, and linear regression reveals a delay of 19.9 ms from the slope of the phase–frequency relationship. For this simple situation, therefore, directed coherence adds little over-and-above that which can be learnt from coherence analysis.
Figure 1B illustrates a more complex situation, where each of the two simulated signals has inputs to the other, but with different delays. This kind of reciprocally connected loop is often encountered in neural circuits. The coherence spectrum (Figure 1Ba) now shows oscillatory features, as the white noise inputs to the simulation interact with the feedback loop delay. Although the coherence phase (Figure 1Bb) still shows a linear relationship with frequency, the slope of this relationship does not relate in any simple way to the delays used to simulate the data.
By contrast, the directed coherence spectra (Figure 1Bc) are both flat, correctly identifying the lack of frequency specificity in the coupling between signals A and B. Both A → B and B → A directed coherence are above significance, corresponding to the reciprocal nature of the interaction. Finally, the slopes of the directed coherence phase–frequency relationships (Figure 1Bd) estimate delays of 19.9 ms and 29.6 ms, in close agreement to the known interaction delays. For reciprocally coupled systems, therefore, directed coherence appears to yield results which are easier to interpret than standard coherence analysis.
Histology
At the end of experiments, monkeys were deeply anesthetized (pentobarbitone, 60 mg/kg IP) and perfused through the heart with phosphate buffered saline (pH 7.2) followed by 4% formal saline fixative. For both monkeys 50 μm parasagital sections of the sensorimotor cortex were cut and stained with Cresyl Violet. These were used to confirm the location of the different cortical areas, and together with details of penetration sites and electrode depths to reconstruct the approximate locations of the recording sites. The electrodes rarely left visible tracks because of their small diameter (80 μm; see Mountcastle et al., 1991). Figure 2A shows estimated locations of the recording sites together with the estimated area boundaries for a parasagittal slice taken from monkey L (at ∼18 mm lateral to midline).
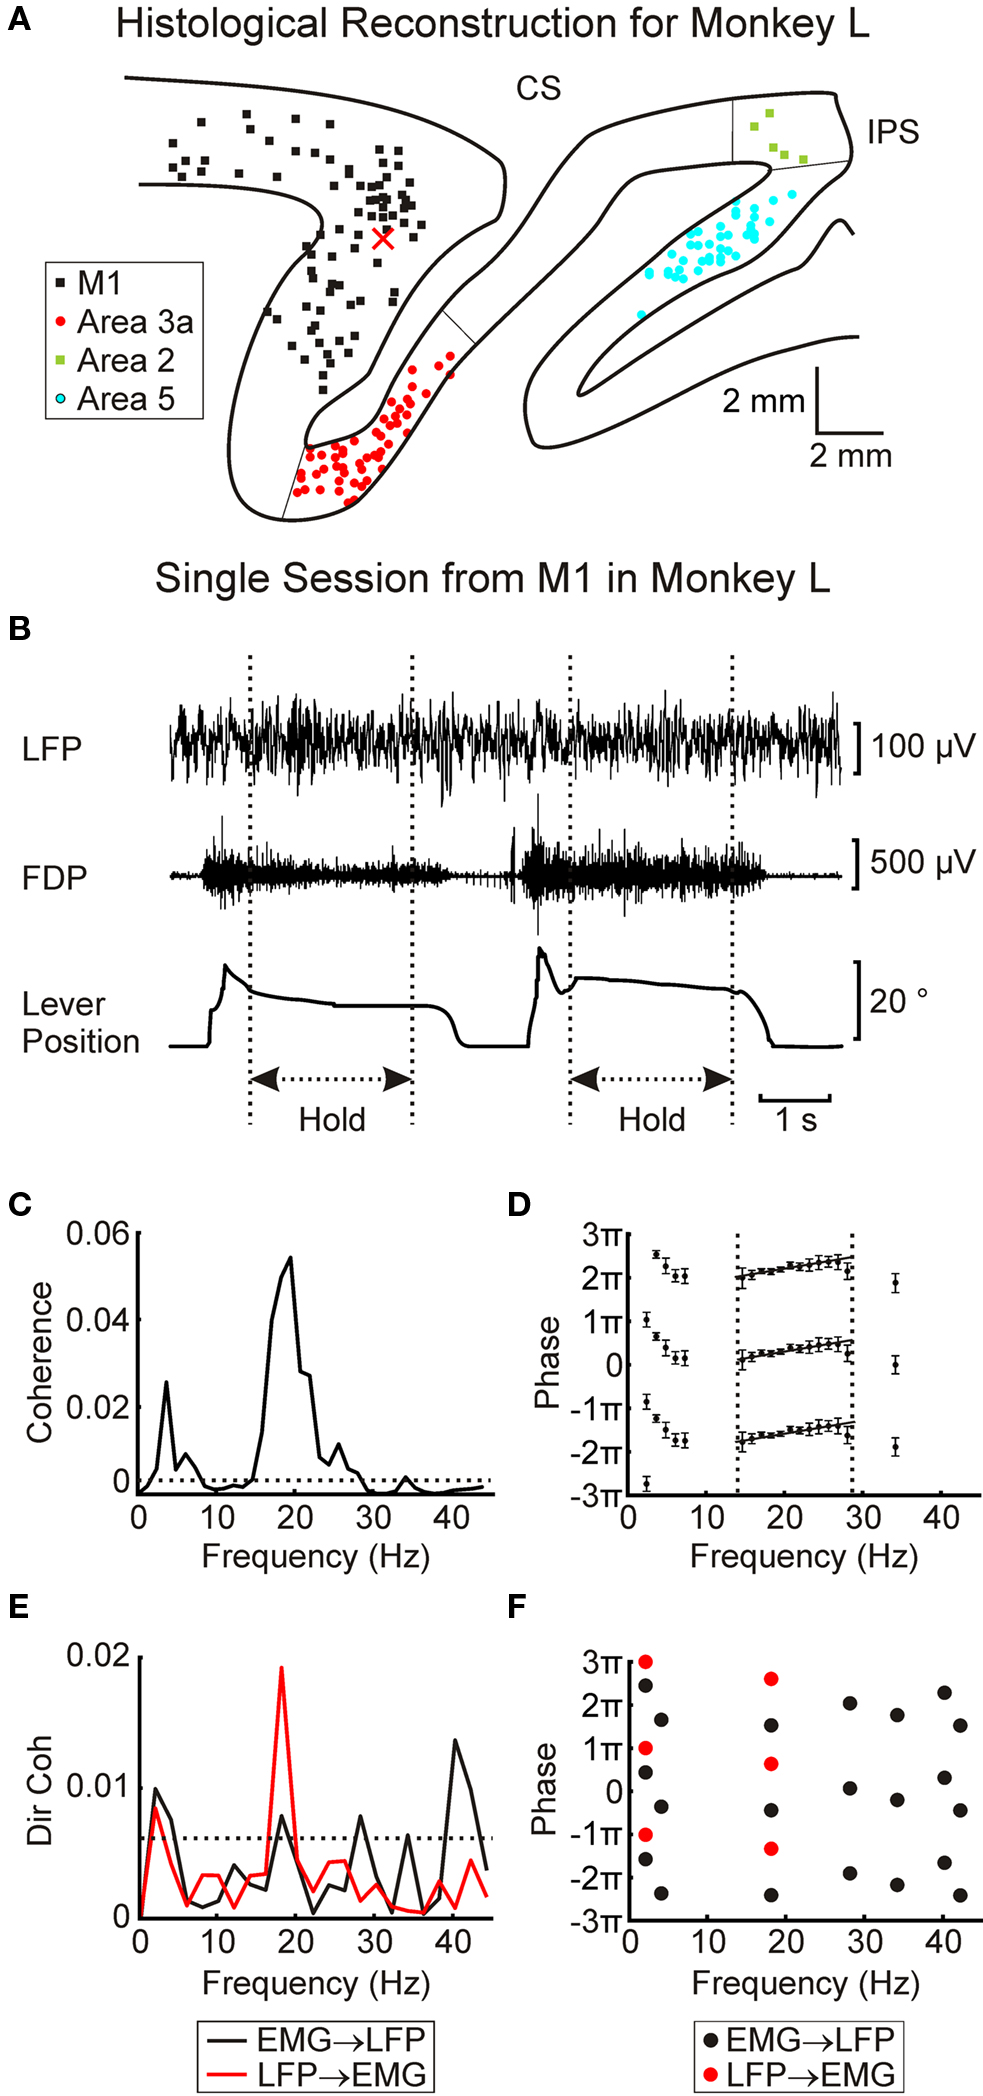
Figure 2. Data from a single session recording in M1 in monkey L. (A) histological reconstruction of approximate recording sites for monkey L. X marks approximate position of electrode used to record LFP in (B). (B) raw traces showing LFP, EMG and lever position for two consecutive trials. Dotted lines indicate the hold periods used for analysis. (C) LFP–FDP coherence spectrum. Dotted line indicates P < 0.05 significance level. (D) phase spectrum for LFP–FDP coherence. Error bars show 95% confidence limits. Dotted lines show region used to fit regression analysis, solid lines show best fit. (E) LFP → EMG and EMG → LFP directed coherence spectra. Dotted line represents P < 0.05 significance limit. (F), phase for frequencies with significant directed coherence. In (D) and (F), each phase point has been plotted three times separated by 2π to avoid wrap-around effects when fitting regression lines.
Results
Recordings were made from a total of 28 sites in M1 (12 in monkey M and 16 in monkey L), 34 sites in area 3a (18 in M and 16 in L), 12 sites in area 2 (11 in M and 1 in L) and 19 sites in area 5 (6 in M and 13 in L). All recordings were within the hand representation, as assessed by the responses to ICMS (M1) or by single unit receptive fields (S1/area 5).
Figure 2B shows example recordings of LFP, EMG (from the FDP muscle) and task lever position during a penetration into M1 in monkey L. The coherence between LFP and rectified EMG is shown in Figure 2C, with the corresponding phase–frequency relationship in Figure 2D. There was a clear 20 Hz peak in the coherence spectrum, which rose above the theoretical significance limit (dotted line, P < 0.05). In order to investigate the pathways underlying this coherence in more detail, directed coherence was also calculated (Figure 2E). This showed a significant peak in the LFP → EMG direction at 18 Hz, whilst for the EMG → LFP direction it was very close to the significance limit, although there was a small peak at 40 Hz.
In a linear system which incorporates a delay, phase should be linearly related to frequency. The slope of this relationship provides an estimate of the delay (Rosenberg et al., 1989). A regression line was fitted to the points of Figure 2D over the frequency band 14.6–28.1 Hz. The slopes implied a delay of 15.1 ± 3 ms (regression slope ±95% confidence limits) with cortex leading muscle. In these data from a single penetration, there were not enough significant directed coherence points (for either direction) to use in a regression analysis (Figure 2F).
LFP–EMG Coherence
Before combining together different recordings from one cortical area, it was important to check that they gave consistent results when analyzed individually. Figure 3A accordingly overlays coherence phase–frequency plots taken from single recording sites in monkey M. There was clearly a high level of consistency between sessions. Single site phase–frequency plots for monkey L showed similar internal consistency. The remainder of the analysis therefore combined all recordings from one monkey and cortical area, treating the available data as one continuous long recording. The very high signal-to-noise ratio which this produced allowed detailed analysis of both the magnitude and phase of the coherence and directed coherence.
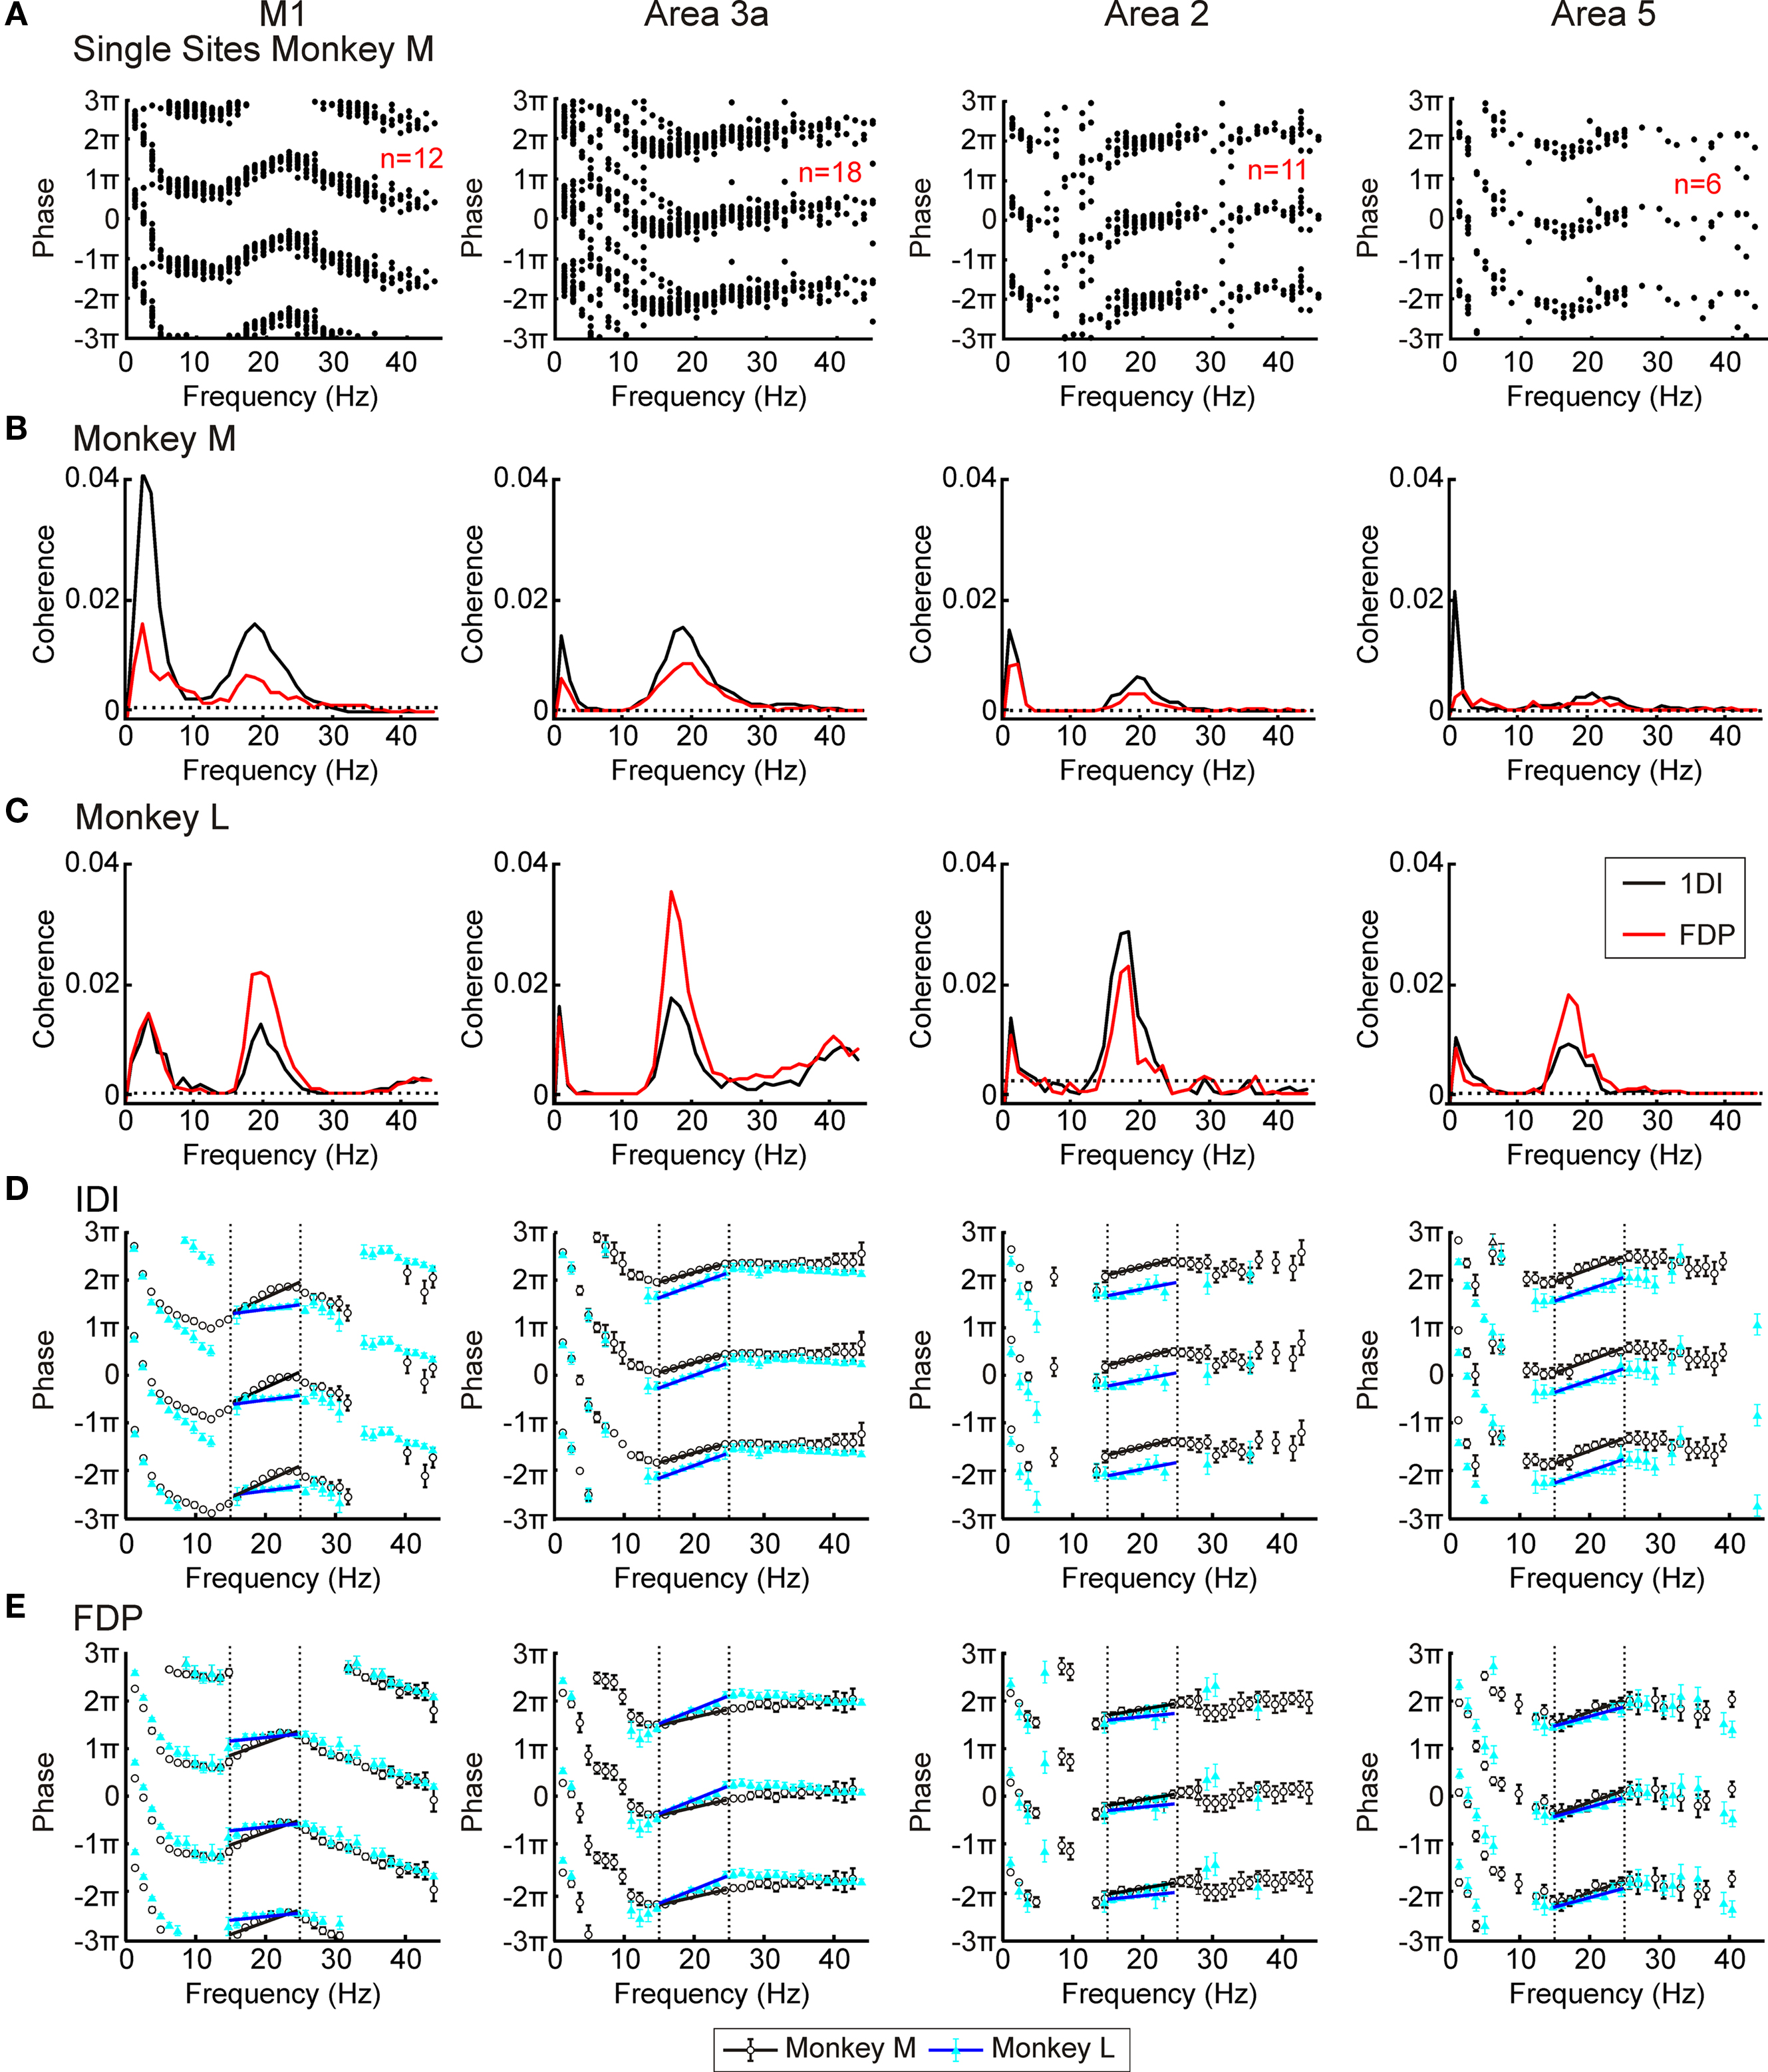
Figure 3. LFP–EMG coherence. (A) overlaid phase – frequency plots from individual recording sites for LFP–1DI coherence from each area in monkey M. (B,C) LFP–1DI and LFP–FDP coherence combined across all available sessions in monkeys M and L respectively. Dotted lines represent P < 0.05 significance levels. (D,E) phase spectra for corticomuscular coherence with the two monkeys shown by different symbols for muscle 1DI (D) and muscle FDP (E). Error bars represent 95% confidence limits on phase (some error bars cannot be seen since they are smaller than the plot markers). Dotted lines in (D,E) show regions used for regression analysis and black lines represent best fit.
Figures 3B,C show the coherence spectra between the four cortical areas and two EMGs (FDP and 1DI) for monkeys M and L respectively. All plots have a clear peak at ∼20 Hz, indicating that not just M1, but also S1 and area 5 activity are coherent with EMG activity in the beta range. In monkey L both M1 and area 3a had small peaks at ∼40 Hz. The source of this coherence is unclear although corticomuscular coherence in the gamma range has previously been reported for a different type of movement (Omlor et al., 2007). Given its presence in only one of the monkeys, this peak was not investigated further.
In addition to the ∼20 Hz peaks, coherence was often significant at low frequencies (0–5 Hz). This coherence probably resulted from small residual movements present during the hold period, which would be represented both in the EMG and in the LFP (movement related potentials). Such movements tend to occur more often at the start of the task hold period than the end; in a separate analysis (not shown), we calculated coherence separately for the first and second halves of the hold phase. Significant coherence at low frequencies was largely confined to the first part of the hold phase, supporting the interpretation that this is the consequence of small movements immediately after entering the target zone.
Figures 3D,E present the phase–frequency relationships for the corticomuscular coherence, in different muscles and areas (only frequency points where there was significant coherence were plotted). The results from the two monkeys have been overlaid. In these plots a positive slope indicates that cortex leads EMG whilst a negative slope indicates that EMG leads cortex. The plots from areas 3a, 2 and 5 showed consistency with a positive slope in the beta band. By contrast, the coherence phase for M1 exhibited a more complex relationship; there was a negative slope for points outside the beta band, but a steep positive slope in the 13–25 Hz range which encompassed the peaks in the coherence spectra. These general traits were consistent across monkeys and for the two muscles studied. Regression lines were fitted to the phase–frequency plots to estimate the delays which these linear relationships imply (solid lines Figures 3D,E). The delays for the beta range (15–24 Hz; dotted lines in Figures 3D,E) are shown in Table 1. All slopes were significantly different from zero except for those for area 2 in monkey L.
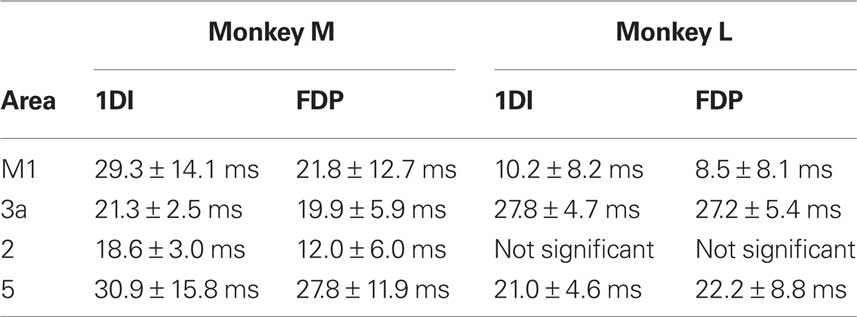
Table 1. Phase delays for corticomuscular coherence.
Although coherence phase can provide useful information, its interpretation is complex in situations of reciprocal connectivity (Riddle and Baker, 2005; Baker et al., 2006). We therefore also calculated directed coherence to provide further insight into the mechanisms underlying corticomuscular coherence.
LFP–EMG Directed Coherence
The results of the directed coherence analysis for the 1DI and FDP muscles are shown in Figure 4. In all areas investigated, both monkeys showed a peak close to 20 Hz for the LFP → EMG direction (Figure 4A for monkey M and Figure 4B for monkey L; plots for 1DI and FDP are overlain). Spectra for the EMG → LFP direction by contrast showed no consistent peak, although values were significant across a broad frequency range (Figures 4C,D). These results suggest that the beta oscillations in the cortex cause those in EMG; feedback influences from EMG to the cortex cover a much broader frequency range with no clear peak in the beta frequency band.
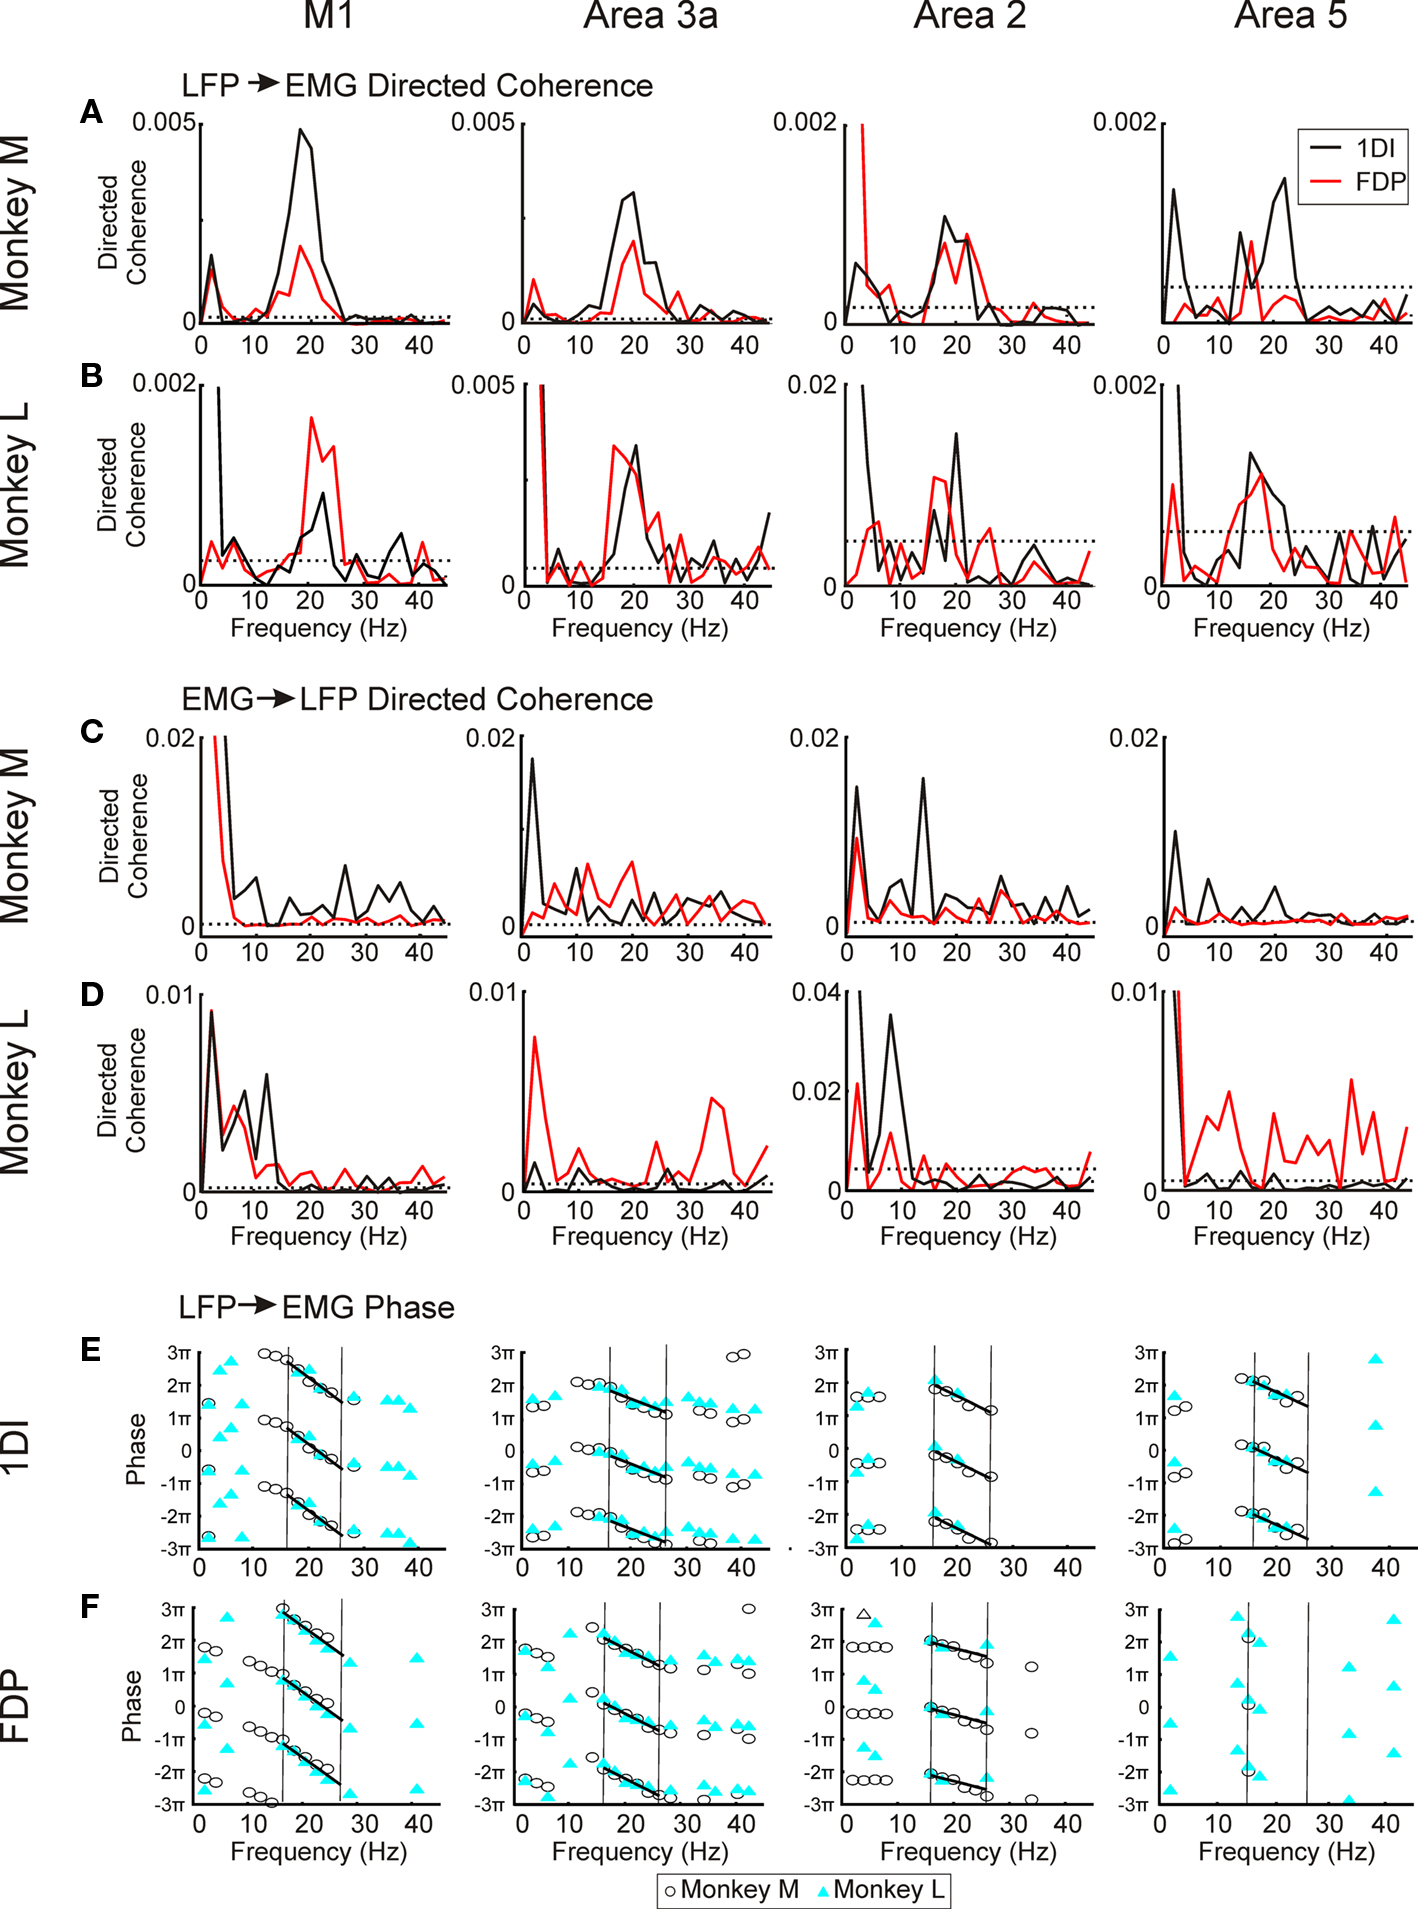
Figure 4. LFP–EMG directed coherence. (A,B) LFP → EMG directed coherence for the four cortical areas in monkey M and L respectively. (C,D) EMG → LFP directed coherence for the four cortical areas in monkey M and L respectively. Dotted lines in (A–D) represent P < 0.05 significance levels. (E), phase spectra for LFP → EMG directed coherence with data from monkey M and L overlaid, for the 1DI muscle. (F) as (E) for the FDP muscle. Dotted lines in (E,F) show regions used for regression analysis and black lines represent best fit.
The phase–frequency plots for LFP → EMG directed coherence are shown in Figures 4E,F. There appears to be a linear relationship over the beta range for all areas, and results were consistent between the two monkeys. Linear regressions were fitted to points between 16 and 26 Hz, combining data from the two monkeys. For most area-muscle combinations the slopes were significantly different from zero (P < 0.05). The only exception was the area 5 – FDP combination where there were not enough points for the regression analysis (Figure 4F). The estimated delays for motor cortex to 1DI and FDP were 62.7 ± 21.8 ms and 62.1 ± 16.0 ms respectively. The most obvious route for somatosensory corticomuscular coherence is via connections to M1; this should give longer delays for somatosensory compared with motor corticomuscular coherence. Surprisingly, the phase delays for the somatosensory areas were actually shorter than M1 for both 1DI (area 3a: 33.0 ± 14.2 ms; area 2: 41.1 ± 16.5 ms; area 5: 38.1 ± 18.9 ms) and FDP (area 3a: 43.4 ± 8.5 ms; area 2: 21.6 ± 17.5 ms). The phase–frequency plots showed no consistent trends for EMG → LFP directed coherence (not shown).
Coherence Between S1/Area 5 and M1
Figure 5 shows the coherence spectra between S1/area 5 and M1. As with the LFP–EMG coherence, all recording sessions within a given area and monkey were combined and treated as one long recording before coherence calculation. All areas in monkey L showed a ∼20 Hz peak in their spectra (Figure 5B). In monkey M there were no clear peaks (Figure 5A) although the coherence spectra around 20 Hz were above significance for all three areas. The lack of well defined peaks and lower coherence in general may be due to a lower signal:noise ratio in the microwire recordings from this animal. This has been discussed in a previous paper using data from the same monkeys (Witham et al., 2007). In both monkeys, there was no linear relationship between phase and frequency (Figure 5C, regression slopes not significantly different from zero, P > 0.05), and phases clustered around zero. This zero phase synchronization probably reflects the strong reciprocal connectivity between M1 and S1/area 5 areas; there may also be a contribution from electrical cross-talk between the recordings from these closely-situated regions. This is a problem for coherence analysis, however directed coherence ignores correlations at zero lag including those generated by electrical cross-talk.
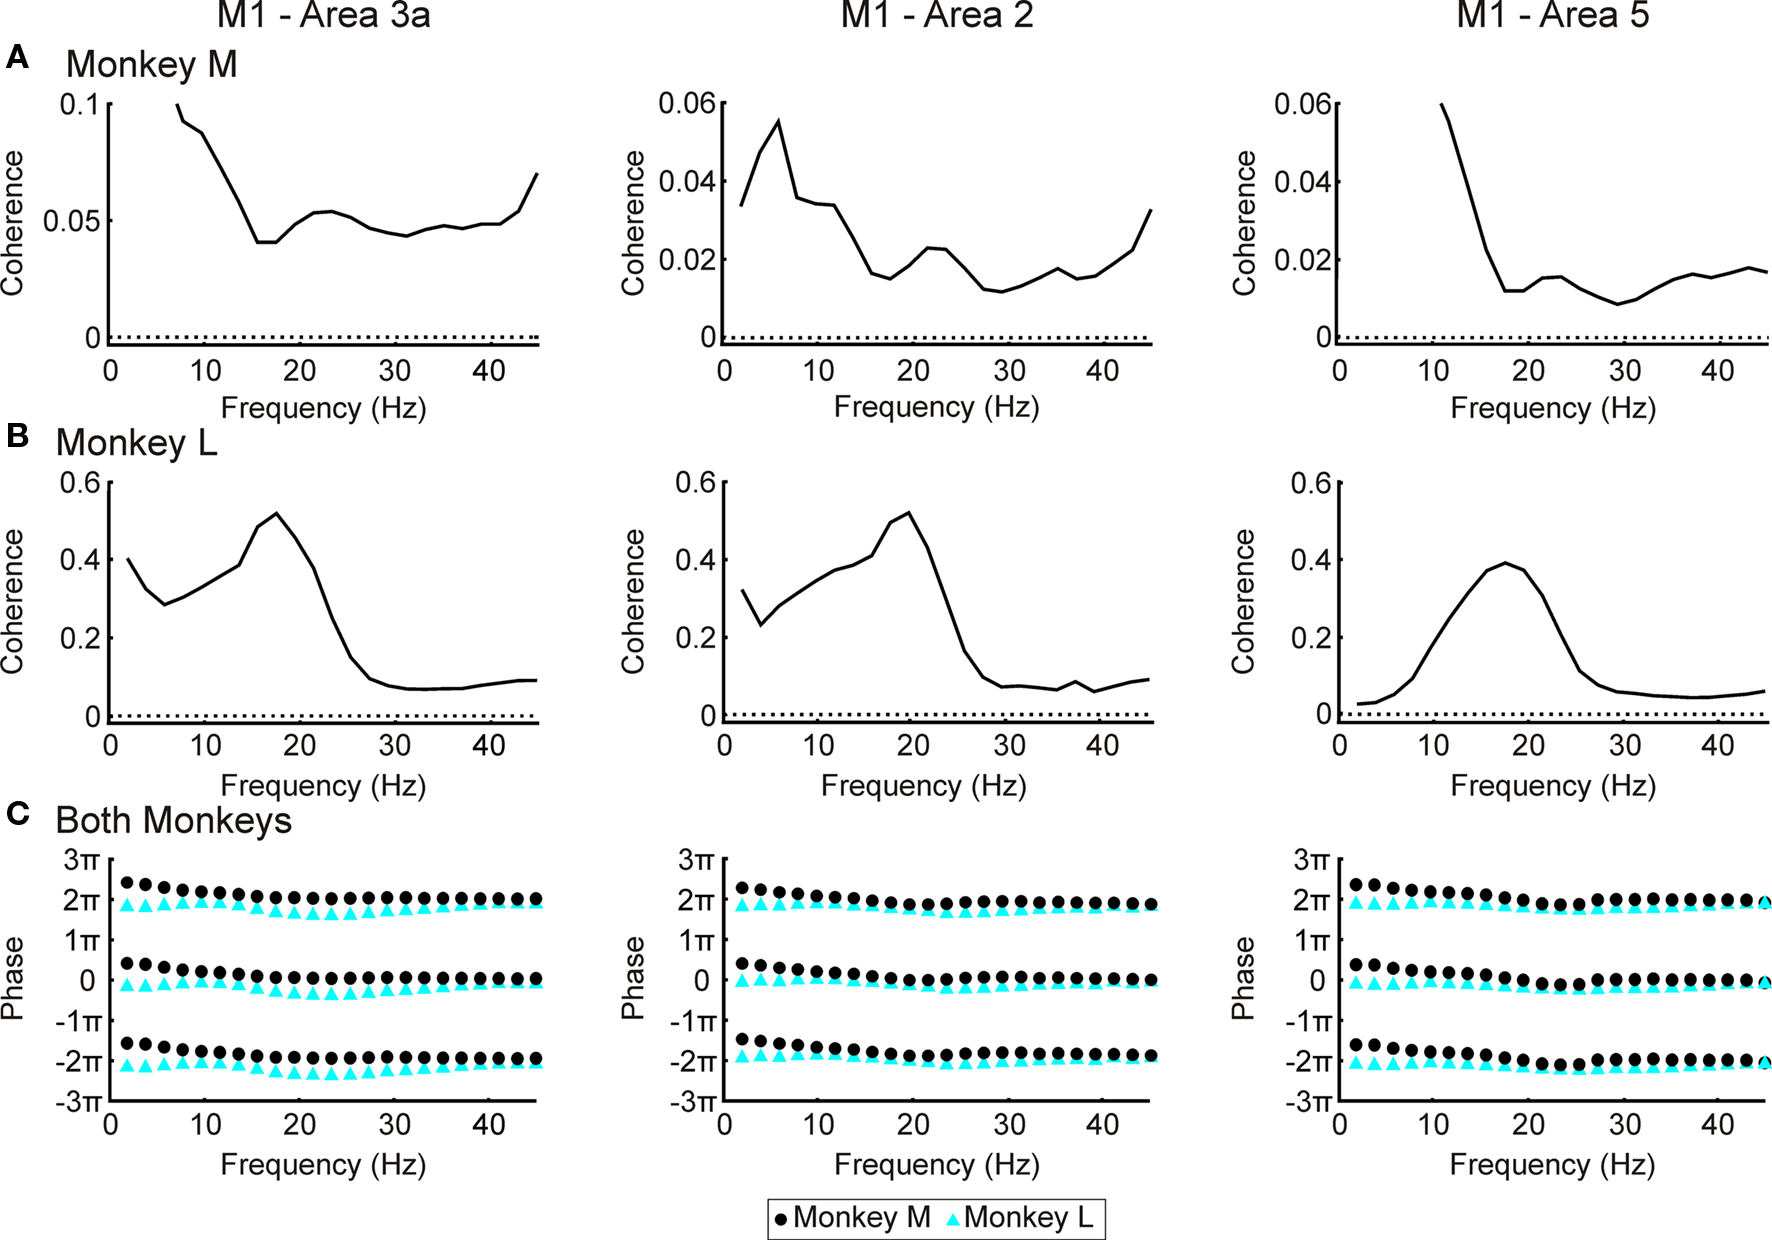
Figure 5. LFP–M1 LFP coherence. (A) coherence spectra between LFP in areas 3a, 2 and 5 and M1 for monkey M. (B) as (A) but for monkey L. Dotted lines represent P < 0.05 significance levels. (C) Phase spectra with results from monkeys M and L overlain. Maximum 95% confidence limits 0.02 for area 3a, 0.10 for area 2 and 0.08 for area 5 (not shown since smaller than size of symbols).
Directed Coherence Between S1/Area 5 and M1
In agreement with a previous study (Brovelli et al., 2004), we found that the S1 and area 5 have a clear Granger-causal relationship in the beta band to activity in M1 (Figures 6A,E). In the reverse direction the results were less consistent (Figures 6B,F). In monkey M there were clear peaks for all three areas (Figure 6B); however these were at a lower frequency (∼15 Hz) than the peaks in the coherence spectra. In monkey L M1 had a clear causal relationship to area 2 at 20 Hz (Figure 6F; red line), whilst the causal influences from M1 to areas 3a and 5 were smaller and at a higher frequency (20–30 Hz). The phase relationships were consistent across the three parietal areas (Figures 6,C,D,G,H), but varied slightly between the two monkeys, with longer delays for monkey L than monkey M in both directions. Lines were fitted to the data between 16 and 30 Hz for monkey M and 12 and 26 Hz for monkey L. For M1 to parietal cortex directed coherence in monkey L there was a phase shift between 16 and 18 Hz (Figure 6H), the cause of which is unknown. For this plot the line was fitted between 18 to 26 Hz. The phase delays are given in Table 2.
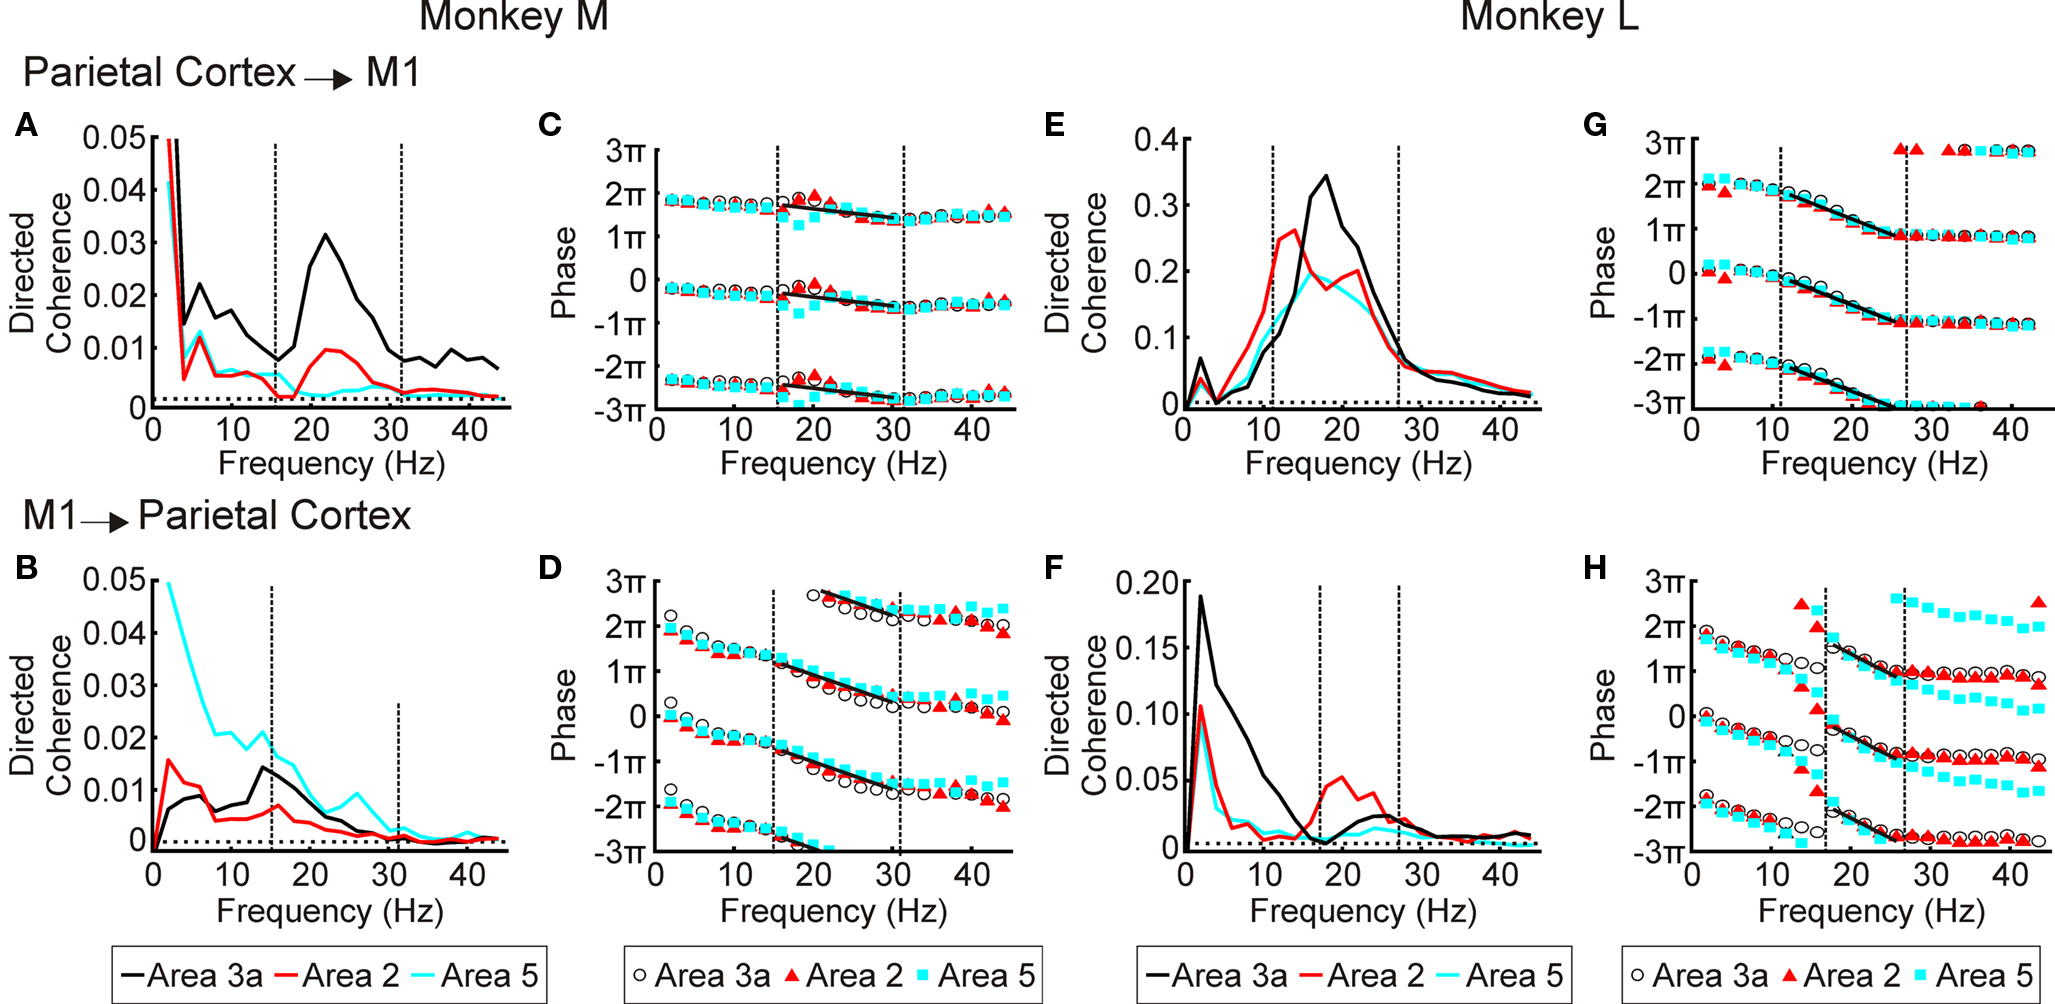
Figure 6. LFP–M1 LFP directed coherence. (A) directed coherence spectra for monkey M for 3a/2/5 → M1 direction. (B) as (A), but for M1 → 3a/2/5 direction. The highest significance level out of area 3a, area 2 and area 5 is shown but the difference in 95% significance levels between the different areas is small compared to the size of the directed coherence. (C,D) as (A,B) for monkey L. (E,G) phase spectra for areas 3a/2/5 → M1 directed coherence for monkeys M and L respectively. (F,H) phase spectra for M1→areas 3a/2/5 directed coherence for monkeys M and L respectively. For (E–H) regression analysis was used to fit phases at frequencies between dotted lines; black line represents best fit.
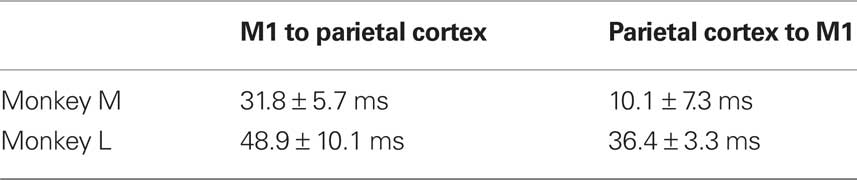
Table 2. Phase delays for directed coherence between M1 and parietal cortex.
Discussion
In this paper, we have shown that there is significant coherence between somatosensory/parietal areas and contralateral muscles. It has recently been demonstrated that beta-band oscillations in monkeys are actually larger in somatosensory/parietal areas than in M1 (Witham and Baker, 2007). Since there is coherence between muscles and the muscle spindle afferents (Baker et al., 2006), somatosensory/parietal corticomuscular coherence might be expected as a simple consequence of oscillatory feedback from the periphery. However, surprisingly, directed coherence analysis indicated that oscillatory signals in somatosensory/parietal regions flowed mainly from cortex to the periphery rather than vise versa – the same direction as that observed for M1. These results agree with the findings of Ohara et al. (2000), who found that there was coherence between S1 (ECoG recordings) and EMG, and that the slope of the phase–frequency relationship indicated that S1 led EMG. They also agree with the work of Tsujimoto et al. (2009), who showed that causal influences from both S1 and M1 to muscle were primarily in the descending direction.
Estimated Conduction Delays
A powerful feature of coherence analysis is the ability to extract the time delay associated with communication between two areas, by examining the slope of the phase–frequency relationship. However, there is controversy in the literature over the delays indicated by corticomuscular coherence from M1. Some authors report delays broadly consistent with conduction over fast corticospinal pathways (Brown et al., 1998; Gross et al., 2000; Mima et al., 2000), although the actual values are often slightly smaller than expected. Others report flat phase–frequency relationships (Halliday et al., 1998). In addition, even if linear relationships are observed, the phase intercept is often non-zero, implying the existence of a constant phase offset as well as a constant delay (Mima et al., 2000). A phase intercept of –π/2 might be expected based on the known relationship of LFP to spiking activity (Baker et al., 2003). Riddle and Baker (2005) observed sloped phase–frequency relationships with implied delays of ∼10 ms in some human subjects (compared with corticomuscular conduction delays estimated using transcranial magnetic brain stimulation, TMS, of ∼22 ms), whilst others had flat phase–frequency plots. In this work, data from one monkey yielded M1 corticomuscular delays from coherence analysis of 8–11 ms, which is consistent with the known conduction times between M1 and hand/forearm muscles (Palmer and Fetz, 1985; Lemon et al., 1987). For the second monkey the delays were longer than expected (20–30 ms).
Riddle and Baker (2005) attributed the different phase delays across their pool of human subjects as reflecting different, subject-specific contributions from feedforward and feedback pathways. Similar factors may explain the difference between coherence phase delays measured from the two monkeys used here. This could be a genuine difference in the neural circuitry of the two animals, or alternatively could reflect differences in the way the monkeys performed the behavioral task. For example, our task required the monkeys to place the index finger in a tube. Detailed differences in hand posture could markedly alter the afferent feedback during the task, and change the balance between feedback and feedforward pathways.
In contrast to the delays estimated from coherence, those found from directed coherence analysis in M1 were substantially longer (∼60 ms) than direct estimates of conduction delays in the macaque from stimulation. They were also highly consistent between the two animals (Figures 4E,F). Using computational modeling Williams and Baker (2009) showed that several factors can lead to increased delay estimates from coherence measures, including the time course of unitary EPSPs in motoneurons, and the width of the motor unit action potentials recorded in EMG. It is possible that these considerations are partly responsible for the long delays found from M1 using directed coherence analysis in the present work. However, not all factors influencing coherence lead to longer delays. For example, motoneuron firing properties can introduce a phase advance, which shortens the estimated delay (Williams and Baker, 2009). In all, no satisfactory explanation for the long measured delays can be found at the present time.
Coherence analysis between M1 and S1/area 5 revealed zero-phase synchronization of oscillatory activity. This is a common finding in studies of distant brain regions, and has been reported previously between both visual and motor areas across hemispheres (Engel et al., 1990; Murthy and Fetz, 1996; Roelfsema et al., 1997), as well as between M1 and cerebellum (Soteropoulos and Baker, 2006). Studies using computational models have shown that reciprocally connected areas can synchronize at zero lag so long as part of the coupling is inhibitory (Van Vreeswijk et al., 1994; Ernst et al., 1995; Gerstner et al., 1996; Sturm and Konig, 2001). Rajagovindan and Ding (2008) examined empirically the factors which could produce synchrony at zero-lag, concluding that it can result from positively correlated common input, reciprocal interaction or a combination of these two mechanisms. However, it is possible that electrical cross-talk between M1 and S1/area 5 recordings could have produced zero-phase synchronization artifactually. This is unlikely: available evidence suggests that LFP signals spread no more than a few millimeters (Steriade et al., 1996; Kreiman et al., 2006). It may represent even more localized activity: a recent report suggests that LFP in primary visual cortex represents the activity of cells within just 250 μm of the recording site (Xing et al., 2009). Because it does not depend on analysis of simultaneous sample points (the past history of one signal is used to predict the present value of another), electrical cross-talk cannot affect directed coherence.
Directed coherence in the M1 → S1/area 5 direction yielded delay estimates which varied between the two animals (31.8 ms and 48.9 ms), as did the estimates for the opposite direction (10.1 ms compared with 36.4 ms). A delay of up to 49 ms for conduction between M1 and the very close somatosensory areas investigated appears excessively long. Following stimulation of somatosensory cortex in the awake rabbit, units in M1 respond with latencies as short as 1 ms (Swadlow, 1994). However, although the fastest cortico-cortical axons may conduct at velocities of ∼10 m/s, they are greatly outnumbered by fibers with lower conduction velocity (Swadlow, 1994, 1991, 1990); the mean conduction velocity for axons projecting from M1 to S1 has been estimated as 0.9 m/s. The actual mean conduction velocity is likely to be lower due to preferential sampling of large cells both for stimulation and recording (see Swadlow, 1998). Although the fastest fibers are responsible for the onset latency of stimulation effects, measures of oscillatory coupling are more likely to be sensitive to the mean conduction time across the whole population of fibers. Additionally, just as for corticomuscular coherence, the time course of the post-synaptic EPSP is also likely to add extra delays (Williams and Baker, 2009). The measured delays up to 49 ms may therefore not be an unreasonable estimate of the time for oscillatory propagation from one area to another.
Finally, it should be noted that both coherence and directed coherence are linear analysis methods. Neural systems are known to contain non-linear elements (e.g., the spiking threshold), and the numerical magnitude of coherence can be substantially affected by these non-linearities (Baker et al., 2003; Soteropoulos and Baker, 2006). It is possible that non-linearities could also affect estimates of delay. However, in most cases we found significant linear relationships between phase and frequency. This indicates that a major part of the transformation from one signal to another can be modeled as a simple delay; any residuals from a straight-line relationship may result from non-linearities.
Possible Pathways
Several pathways could provide the substrate for descending corticomuscular coherence from S1. Figure 7 shows four schematics of possible pathways using the main known connections between M1, S1 and the periphery. One possibility is that M1 and S1 activity is synchronized by common input from another region (Figure 7, Pathway 1); this is a reasonable option, as – for example – both SMA (Darian-Smith et al., 1993) and SII (Jones, 1986) are known to provide input to primary motor and somatosensory cortices. However, given the close spatial proximity of the pre- and post-central regions which we investigated, we would expect that conduction delays from the distant area to each would be similar. If synchronization with muscle was then mediated via fast corticospinal axons from M1, this would lead to similar delay estimates from all of the studied cortical areas to muscle. In fact, the delays differed between parietal and motor cortex.
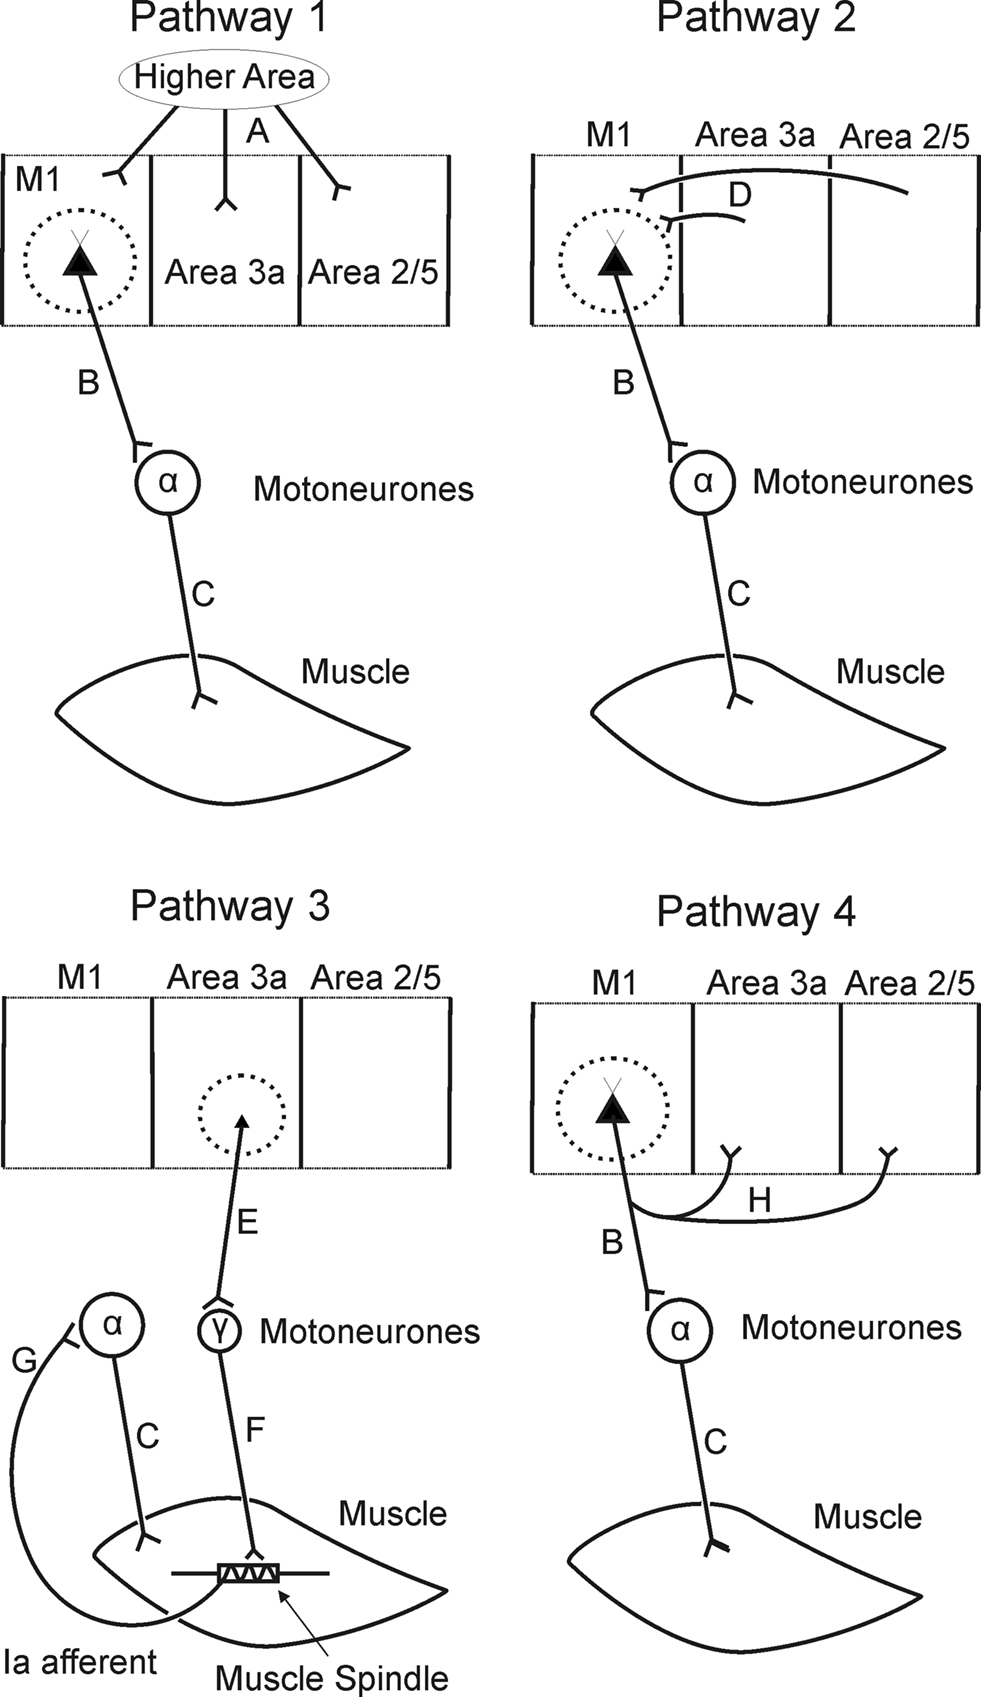
Figure 7. Schematic showing possible pathways underlying coherence between S1/area 5 and EMG. Lettered labels are referred to in text.
Alternatively, oscillations from S1 could propagate to M1, and thence to the periphery (Figure 7, Pathway 2). There are strong bi-directional anatomical links between the somatosensory areas and M1 (Jones et al., 1978), and directed coherence shows strong influences from S1 to M1 (presentBrovelli et al., 2004; Figures 6A,C). However, if this pathway is correct, the delay from S1 to muscle should be longer than from M1. In fact, corticomuscular delays estimated from directed coherence were shorter for parietal regions than for M1.
The corticospinal tract does not originate solely in motor cortex; around 40% of fibers come from S1/area 5 (Philips and Porter, 1977). These axons mainly terminate in the dorsal horn, where they are assumed to influence spinal sensory relays (Galea and Darian-Smith, 1994; Seki et al., 2003). An exception is some connections from area 3a, which have recently been shown to make direct monosynaptic connections to motoneurons (Rathelot and Strick, 2006). Because microstimulation of area 3a does not usually produce overt movements (Widener and Cheney, 1997), Rathelot and Strick (2006) suggested that area 3a corticomotoneuronal cells may target gamma motoneurons. In that case, it is conceivable that oscillations could pass from area 3a to gamma motoneurons (connections E + F, Figure 7, Pathway 3). Muscle spindle nuclear chain fibers exhibit brief twitch times (Bessou et al., 1968), such that beta-band activity in static gamma motoneurone discharge should be passed reasonably faithfully to the discharge of spindle afferents. Group Ia spindle afferents have monosynaptic connections to alpha motoneurons, and are capable of passing beta-band activity to EMG (Baker et al., 2006). A route involving area 3a, gamma motoneurons and muscle spindle afferents could therefore conceivably generate coherence between parietal areas and muscle (Figure 7, Pathway 3).
Several pieces of evidence argue that corticomotoneuronal connections from area 3a are not the primary pathway underlying our observations. Firstly, using both coherence and directed coherence measures, results for area 3a were very similar to those from areas 2 and 5 (Figures 4 and 5). However, only area 3a has corticomotoneuronal axons. Secondly, the passage around the peripheral stretch reflex loop would introduce substantial additional time delays, compared with the pathway from M1 involving a direct corticomotoneuronal connection to alpha motoneurones. Yet the estimated delays from parietal areas to EMG were actually shorter than from M1.
Whilst it is tempting to interpret significant directed coherence as indicating a causal influence, other network topologies may produce this result. We have demonstrated that there is directed coherence in the S1/area 5 → M1 direction (connection D, Pathway 2), however, it is also present in the other direction (connection G, Pathway 4), although rather weaker (Figures 6B,D). Somatosensory/parietal areas and the motoneurons therefore receive common input from M1, which could lead to the observed corticomuscular coherence. Because the delay from M1 to S1/area 5 (connection H, mean delay ≈ 40 ms across two animals; Figures 6F,H) is shorter than from M1 to EMG (connections B + C, delay ≈ 61 ms for 1DI; Figure 4E), directed coherence would detect an influence in the S1/area 5 → EMG direction. The observed delay from S1/area 5 to EMG based on the directed coherence phase is broadly consistent with that expected if this interpretation is correct (connection G ≈ 21 ms versus observed delay of 35 ± 13 ms for 1DI). It is possible that the measured delay between S1/area 5 and EMG reflects a mixture of two pathways, the first a causal influence via the motor cortex (Pathway 2, Figure 7), and the second common input from motor cortex to S1/area 5 areas and EMG (Pathway 4, Figure 7). This might explain why the measured delay is larger than that expected for the common input pathway alone.
Support for this explanation of parieto–muscular coherence comes from the recent study of corticomuscular coherence in hemiparetic patients by Gerloff et al. (2006). These patients have an abnormal separation across the midline of M1 and S1 relating to one hand. If this resulted in reduced strength of interaction between somatosensory and motor areas in these patients, M1 would provide reduced common input to S1 and muscle, and corticomuscular coherence from S1 would be reduced.
In this paper, we have chosen to use bivariate methods (coherence and directed coherence). Further extensions to both coherence and directed coherence are possible, in which multivariate analysis is used to reveal the underlying network (Rosenberg et al., 1998; Blinowska et al., 2004; Barrett et al., 2010). However, we are concerned that such methods may prove especially sensitive to the non-linearities of neural data. We already know that the magnitude of coherence can be markedly altered by these non-linearities (Baker et al., 2003; Soteropoulos and Baker, 2006). However, if coherence remains above significance, our conclusion that there is an interaction between two signals is unaffected. Consider by contrast one important multivariate method, namely partial coherence. This seeks effectively to predict coherence between two signals B–C, based on the measured coherence A–B and A–C. The measured coherence B–C is then compared with the prediction, to discover whether there is any additional B–C interaction other than that expected due to the interaction of B and C with A. In this case, the impact of non-linearities on coherence magnitude estimation will severely distort the calculation, and may lead to erroneous inferences. It is likely that other multivariate methods will suffer from similar problems. Until the impact of this has been fully assessed, we feel that our bivariate analyses are at the limit of what may currently be considered reliable.
Functional Significance
As discussed above, interpretation of directed coherence as indicating causal connections is difficult. However, significant directed coherence does unambiguously show that activity in one area predicts that in another. Directed corticomuscular coherence from S1 was often as large or larger than that from M1, meaning that somatosensory activity could accurately predict the peripheral motor output. Common input to S1 and muscle from M1 could thus be viewed as the supply to S1 of efference copy information. This would place S1 in a good position to predict not just the evolving motor output, but also its sensory consequences. Interpretation of sensory input critically depends on placing that input into the context of the movements that elicited it (Blakemore et al., 1998; Bays et al., 2005, 2006). The present observations may therefore further support previous suggestions that beta-band oscillations have a role in sensorimotor integration (MacKay, 1997; Brovelli et al., 2004; Riddle and Baker, 2005; Baker et al., 2006).
Conflict of Interest Statement
The authors declare that this research was conducted in the absence of any commercial or financial relationships that could be construed as a potential conflict of interest.
Acknowledgments
The authors would like to thank Karen Fisher, Terri Jackson and Norman Charlton for technical assistance. This work was funded by The Wellcome Trust.
References
Amjad, A. M., Halliday, D. M., Rosenberg, J. R., and Conway, B. A. (1997). An extended difference of coherence test for comparing and combining several independent coherence estimates: theory and application to the study of motor units and physiological tremor. J. Neurosci. Methods 73, 69–79.
Baker, M. R., and Baker, S. N. (2003). The effect of diazepam on motor cortical oscillations and corticomuscular coherence studied in man. J. Physiol. 546, 931–942.
Baker, S. N. (2000). ‘Pooled coherence’ can overestimate the significance of coupling in the presence of inter-experiment variability. J. Neurosci. Methods 96, 171–172.
Baker, S. N., Chiu, M., and Fetz, E. E. (2006). Afferent encoding of central oscillations in the monkey arm. J. Neurophysiol. 95, 3904–3910.
Baker, S. N., Olivier, E., and Lemon, R. N. (1997). Coherent oscillations in monkey motor cortex and hand muscle EMG show task-dependent modulation. J. Physiol. 501(Pt 1), 225–241.
Baker, S. N., Pinches, E. M., and Lemon, R. N. (2003). Synchronization in monkey motor cortex during a precision grip task. II. effect of oscillatory activity on corticospinal output. J. Neurophysiol. 89, 1941–1953.
Baker, S. N., Spinks, R., Jackson, A., and Lemon, R. N. (2001). Synchronization in monkey motor cortex during a precision grip task. I. Task-dependent modulation in single-unit synchrony. J. Neurophysiol. 85, 869–885.
Barrett, A. B., Barnett, L., and Seth, A. K. (2010). Multivariate Granger causality and generalized variance. Phys. Rev. E. Stat. Nonlin. Soft Matter Phys. 81, 041907.
Bays, P. M., Flanagan, J. R., and Wolpert, D. M. (2006). Attenuation of self- generated tactile sensations is predictive, not postdictive. PLoS Biol. 4:e28. doi: 10.1371/journal.pbio.0040028.
Bays, P. M., Wolpert, D. M., and Flanagan, J. R. (2005). Perception of the consequences of self-action is temporally tuned and event driven. Curr. Biol. 15, 1125–1128.
Bessou, P., Laporte, Y., and Pages, B. (1968). Frequencygrams of spindle primary endings elicited by stimulation of static and dynamic fusimotor fibres. J. Physiol. 196, 47–63.
Blakemore, S. J., Goodbody, S. J., and Wolpert, D. M. (1998). Predicting the Consequences of Our Own Actions: The Role of Sensorimotor Context Estimation. J. Neurosci. 18, 7511–7518.
Blinowska, K. J., Kus, R., and Kaminski, M. (2004). Granger causality and information flow in multivariate processes. Phys. Rev. E. Stat. Nonlin. Soft Matter Phys. 70, 050902.
Brovelli, A., Ding, M., Ledberg, A., Chen, Y., Nakamura, R., and Bressler, S. L. (2004). Beta oscillations in a large-scale sensorimotor cortical network: directional influences revealed by Granger causality. Proc. Natl. Acad. Sci. U.S.A. 101, 9849–9854.
Brown, P., Salenius, S., Rothwell, J. C., and Hari, R. (1998). Cortical correlate of the Piper rhythm in humans. J. Neurophysiol. 80, 2911–2917.
Conway, B. A., Halliday, D. M., Farmer, S. F., Shahani, U., Maas, P., Weir, A. I., and Rosenberg, J. R. (1995). Synchronization between motor cortex and spinal motoneuronal pool during the performance of a maintained motor task in man. J. Physiol. 489, 917–924.
Courtemanche, R., and Lamarre, Y. (2005). Local field potential oscillations in primate cerebellar cortex: synchronization with cerebral cortex during active and passive expectancy. J. Neurophysiol. 93, 2039–2052.
Darian-Smith, C., Darian-Smith, I., Burman, K., and Ratcliffe, N. (1993). Ipsilateral cortical projections to areas 3a, 3b, and 4 in the macaque monkey. J. Comp. Neurol. 335, 200–213.
Ding, M., Bressler, S. L., Yang, W., and Liang, H. (2000). Short-window spectral analysis of cortical event-related potentials by adaptive multivariate autoregressive modeling: data preprocessing, model validation, and variability assessment. Biol. Cybern. 83, 35–45.
Eckhorn, R., and Thomas, U. (1993). A new method for the insertion of multiple microprobes into neural and muscular tissue, including fiber electrodes, fine wires, needles and microsensors. J. Neurosci. Methods 49, 175–179.
Engel, A. K., Konig, P., Gray, C. M., and Singer, W. (1990). Stimulus-dependent neuronal oscillations in cat visual cortex: inter-columnar interaction as determined by cross-correlation analysis. Eur. J. Neurosci. 2, 588–606.
Ernst, U., Pawelzik, K., and Geisel, T. (1995). Synchronization induced by temporal delays in pulse- coupled oscillators. Phys. Rev. Lett. 74, 1570–1573.
Galea, M. P., and Darian-Smith, I. (1994). Multiple corticospinal neuron populations in the macaque monkey are specified by their unique cortical origins, spinal terminations, and connections. Cereb. Cortex 4, 166–194.
Gastaut, H., Terzian, H., and Gastaut, Y. (1952). Étude d’une activitÉ ÉlectroencÉphalographique mÉconnue: « Le rythme rolandique en arceau ». Mars. Med. 89, 296–310.
Gerloff, C., Braun, C., Staudt, M., Hegner, Y. L., Dichgans, J., and Krageloh-Mann, I. (2006). Coherent corticomuscular oscillations originate from primary motor cortex: Evidence from patients with early brain lesions. Hum. Brain Mapp. 27, 789–798.
Gerstner, W., van Hemmen, J. L., and Cowan, J. D. (1996). What matters in neuronal locking? Neural. Comput. 8, 1653–1676.
Geweke, J. (1982). Measurement of linear dependence and feedback between multiple time series. J. Am. Stat. Assoc. 77, 304–313.
Gross, J., Tass, P. A., Salenius, S., Hari, R., Freund, H. J., and Schnitzler, A. (2000). Cortico-muscular synchronization during isometric muscle contraction in humans as revealed by magnetoencephalography. J. Physiol. 527(Pt 3), 623–631.
Halliday, D. M., Conway, B. A., Farmer, S. F., and Rosenberg, J. R. (1998). Using electroencephalography to study functional coupling between cortical activity and electromyograms during voluntary contractions in humans. Neurosci. Lett. 241, 5–8.
Hutchison, W. D., Dostrovsky, J. O., Walters, J. R., Courtemanche, R., Boraud, T., Goldberg, J., and Brown, P. (2004). Neuronal oscillations in the basal ganglia and movement disorders: evidence from whole animal and human recordings. J. Neurosci. 24, 9240–9243.
Jones, E. G. (1986). “Connectivity of the primate sensory-motor cortex,” in Cerebral Cortex. Sensory-Motor Areas and Aspects of Cortical Connectivity, eds E. G. Jones and A. Peters (New York: Plenum Press), 113–183.
Jones, E. G., Coulter, J. D., and Hendry, S. H. (1978). Intracortical connectivity of architectonic fields in the somatic sensory, motor and parietal cortex of monkeys. J. Comp. Neurol. 181, 291–347.
Kilner, J. M., Baker, S. N., and Lemon, R. N. (2002). A novel algorithm to remove electrical cross-talk between surface EMG recordings and its application to the measurement of short-term synchronisation in humans. J. Physiol. 538, 919–930.
Kreiman, G., Hung, C. P., Kraskov, A., Quiroga, R. Q., Poggio, T., and DiCarlo, J. J. (2006). Object selectivity of local field potentials and spikes in the macaque inferior temporal cortex. Neuron 49, 433–445.
Lemon, R. N. (1984). “Methods for neuronal recording in conscious animals,” in IBRO Handbook Series: Methods in Neurosciences, ed. A. D. Smith (London: Wiley), 1–162.
Lemon, R. N., Muir, R. B., and Mantel, G. W. (1987). The effects upon the activity of hand and forearm muscles of intracortical stimulation in the vicinity of corticomotor neurones in the conscious monkey. Exp. Brain Res. 66, 621–637.
Lewis, J. W., Burton, H., and Van Ess, D. C. (1999). Anatomical evidence for the posterior boundary of area 2 in the macaque monkey. Somatosens. Mot. Res. 16, 382–390.
MacKay, W. A. (1997). Synchronized neuronal oscillations and their role in motor processes. Trends Cogn. Sci. 1, 176–183.
Miller, L. E., and Houk, J. C. (1995). Motor co-ordinates in primate red nucleus: preferential relation to muscle activation versus kinematic variables. J. Physiol. 488(Pt 2):533–548.
Mima, T., Steger, J., Schulman, A. E., Gerloff, C., and Hallett, M. (2000). Electroencephalographic measurement of motor cortex control of muscle activity in humans. Clin. Neurophysiol. 111, 326–337.
Mountcastle, V. B., Lynch, J. C., Georgopoulos, A., Sakata, H., and Acuna, C. (1975). Posterior parietal association cortex of the monkey: command functions for operations within extrapersonal space. J. Neurophysiol. 38, 871–908.
Mountcastle, V. B., Reitboeck, H. J., Poggio, G. F., and Steinmetz, M. A. (1991). Adaptation of the Reitboeck method of multiple microelectrode recording to the neocortex of the waking monkey. J. Neurosci. Methods 36, 77–84.
Murthy, V. N., and Fetz, E. E. (1992). Coherent 25- to 35-Hz oscillations in the sensorimotor cortex of awake behaving monkeys. Proc. Natl. Acad. Sci. U.S.A. 89, 5670–5674.
Murthy, V. N., and Fetz, E. E. (1996). Oscillatory activity in sensorimotor cortex of awake monkeys: synchronization of local field potentials and relation to behavior. J. Neurophysiol. 76, 3949–3967.
Ohara, S., Mima, T., Baba, K., Ikeda, A., Kunieda, T., Matsumoto, R., Yamamoto, J., Matsuhashi, M., Nagamine, T., Hirasawa, K., Hori, T., Mihara, T., Hashimoto, N., Salenius, S., and Shibasaki, H. (2001). Increased synchronization of cortical oscillatory activities between human supplementary motor and primary sensorimotor areas during voluntary movements. J. Neurosci. 21, 9377–9386.
Ohara, S., Nagamine, T., Ikeda, A., Kunieda, T., Matsumoto, R., Taki, W., Hashimoto, N., Baba, K., Mihara, T., Salenius, S., and Shibasaki, H. (2000). Electrocorticogram-electromyogram coherence during isometric contraction of hand muscle in human. Clin. Neurophysiol. 111, 2014–2024.
Omlor, W., Patino, L., Hepp-Reymond, M. -. C., and Kristeva, R. (2007). Gamma-range corticomuscular coherence during dynamic force output. Neuroimage 34, 1191–1198.
Palmer, S. S., and Fetz, E. E. (1985). Effects of single intracortical microstimuli in motor cortex on activity of identified forearm motor units in behaving monkeys. J. Neurophysiol. 54, 1194–1212.
Philips, C. G., and Porter, R. (1977). Corticospinal Neurones: Their Role in Movment. London: Academic Press.
Pierce, D. A. (1982). Measurement of Linear Dependence and Feedback Between Multiple Time Series: Comment. J. Am. Stat. Assoc. 77, 315–316.
Rajagovindan, R., and Ding, M. (2008). Decomposing neural synchrony: toward an explanation for near-zero phase-lag in cortical oscillatory networks. PLoS ONE 3, e3649. doi:10.1371/journal.pone.0003649.
Rathelot, J. -. A., and Strick, P. L. (2006). Muscle representation in the macaque motor cortex: an anatomical perspective. Proc. Natl. Acad. Sci. U.S.A. 103, 8257–8262.
Riddle, C. N., and Baker, S. N. (2005). Manipulation of peripheral neural feedback loops alters human corticomuscular coherence. J. Physiol. 566, 625–639.
Roelfsema, P. R., Engel, A. K., Konig, P., and Singer, W. (1997). Visuomotor integration is associated with zero time-lag synchronization among cortical areas. Nature 385, 157–161.
Rosenberg, J. R., Amjad, A. M., Breeze, P., Brillinger, D. R., and Halliday, D. M. (1989). The Fourier approach to the identification of functional coupling between neuronal spike trains. Prog. Biophys. Mol. Biol. 53, 1–31.
Rosenberg, J. R., Halliday, D. M., Breeze, P., and Conway, B. A. (1998). Identification of patterns of neuronal connectivity--partial spectra, partial coherence, and neuronal interactions. J. Neurosci. Methods 83, 57–72.
Salenius, S., Portin, K., Kajola, M., Salmelin, R., and Hari, R. (1997). Cortical Control of Human Motoneuron Firing During Isometric Contraction. J. Neurophysiol. 77, 3401–3405.
Salmelin, R., and Hari, R. (1994). Spatiotemporal characteristics of sensorimotor neuromagnetic rhythms related to thumb movement. Neuroscience 60, 537–550.
Schneider, T., and Neumaier, A. (2001). Algorithm 808: ARfit - A Matlab package for the estimation of parameters and eigenmodes of multivariate autoregressive models. ACM Trans. Math. Softw. 27, 58–65.
Seki, K., Perlmutter, S. I., and Fetz, E. E. (2003). Sensory input to primate spinal cord is presynaptically inhibited during voluntary movement. Nat. Neurosci. 6, 1309–1316.
Soteropoulos, D. S., and Baker, S. N. (2006). Cortico-cerebellar coherence during a precision grip task in the monkey. J. Neurophysiol. 95, 1194–1206.
Steriade, M., Amzica, F., and Contreras, D. (1996). Synchronization of fast (30-40 Hz) spontaneous cortical rhythms during brain activation. J. Neurosci. 16, 392–417.
Sturm, A. K., and Konig, P. (2001). Mechanisms to synchronize neuronal activity. Biol. Cybern. 84, 153–172.
Swadlow, H. A. (1990). Efferent neurons and suspected interneurons in S-1 forelimb representation of the awake rabbit: receptive fields and axonal properties. J. Neurophysiol. 63, 1477–1498.
Swadlow, H. A. (1991). Efferent neurons and suspected interneurons in second somatosensory cortex of the awake rabbit: receptive fields and axonal properties. J. Neurophysiol. 66, 1392–1409.
Swadlow, H. A. (1994). Efferent neurons and suspected interneurons in motor cortex of the awake rabbit: axonal properties, sensory receptive fields, and subthreshold synaptic inputs. J. Neurophysiol. 71, 437–453.
Swadlow, H. A. (1998). Neocortical efferent neurons with very slowly conducting axons: strategies for reliable antidromic identification. J. Neurosci. Methods 79, 131–141.
Tsujimoto, T., Mima, T., Shimazu, H., and Isomura, Y. (2009). Directional organization of sensorimotor oscillatory activity related to the electromyogram in the monkey. Clin. Neurophysiol. 120, 1168–1173.
Van Vreeswijk, C., Abbott, L. F., and Ermentrout, G. B. (1994). When inhibition not excitation synchronizes neural firing. J. Comput. Neurosci. 1, 313–321.
Widener, G. L., and Cheney, P. D. (1997). Effects on muscle activity from microstimuli applied to somatosensory and motor cortex during voluntary movement in the monkey. J. Neurophysiol. 77, 2446–2465.
Williams, E. R., and Baker, S. N. (2009). Circuits generating corticomuscular coherence investigated using a biophysically based computational model. I. Descending systems. J. Neurophysiol. 101, 31–41.
Witham, C. L., and Baker, S. N. (2007). Network oscillations and intrinsic spiking rhythmicity do not covary in monkey sensorimotor areas. J. Physiol. (Lond.) 580 801–814.
Witham, C. L., Wang, M., and Baker, S. N. (2007). Cells in somatosensory areas show synchrony with beta oscillations in monkey motor cortex. Eur. J. Neurosci. 26, 2677–2686.
Keywords: oscillations, sensorimotor
Citation: Witham CL, Wang M and Baker SN (2010) Corticomuscular coherence between motor cortex, somatosensory areas and forearm muscles in the monkey. Front. Syst. Neurosci. 4:38. doi: 10.3389/fnsys.2010.00038
Received: 29 March 2010;
Paper pending published: 28 April 2010;
Accepted: 08 July 2010;
Published online: 30 July 2010
Edited by:
Neeraj Jain, National Brain Research Centre, IndiaReviewed by:
Mingzhou Ding, University of Florida, USARandall J. Nelson, The University of Tennessee Health Science Center, USA
Copyright: © 2010 Witham, Wang and Baker. This is an open-access article subject to an exclusive license agreement between the authors and the Frontiers Research Foundation, which permits unrestricted use, distribution, and reproduction in any medium, provided the original authors and source are credited.
*Correspondence: Stuart N. Baker, Institute of Neuroscience, Newcastle University, Medical School, Framlington Place, Newcastle upon Tyne, UK. e-mail: stuart.baker@ncl.ac.uk