Octopaminergic modulation of temporal frequency coding in an identified optic flow-processing interneuron
- Department of Bioengineering, Imperial College London, London, UK
Flying generates predictably different patterns of optic flow compared with other locomotor states. A sensorimotor system tuned to rapid responses and a high bandwidth of optic flow would help the animal to avoid wasting energy through imprecise motor action. However, neural processing that covers a higher input bandwidth itself comes at higher energetic costs which would be a poor investment when the animal was not flying. How does the blowfly adjust the dynamic range of its optic flow-processing neurons to the locomotor state? Octopamine (OA) is a biogenic amine central to the initiation and maintenance of flight in insects. We used an OA agonist chlordimeform (CDM) to simulate the widespread OA release during flight and recorded the effects on the temporal frequency coding of the H2 cell. This cell is a visual interneuron known to be involved in flight stabilization reflexes. The application of CDM resulted in (i) an increase in the cell’s spontaneous activity, expanding the inhibitory signaling range (ii) an initial response gain to moving gratings (20–60 ms post-stimulus) that depended on the temporal frequency of the grating and (iii) a reduction in the rate and magnitude of motion adaptation that was also temporal frequency-dependent. To our knowledge, this is the first demonstration that the application of a neuromodulator can induce velocity-dependent alterations in the gain of a wide-field optic flow-processing neuron. The observed changes in the cell’s response properties resulted in a 33% increase of the cell’s information rate when encoding random changes in temporal frequency of the stimulus. The increased signaling range and more rapid, longer lasting responses employed more spikes to encode each bit, and so consumed a greater amount of energy. It appears that for the fly investing more energy in sensory processing during flight is more efficient than wasting energy on under-performing motor control.
Introduction
There are many examples of reflexes in which the animal’s locomotor state alters the activity of the peripheral sensory interneurons supporting the response (Clarac et al., 2000; Hultborn, 2001). Recent work now indicates that the locomotor state can also alter the gain of neural responses of central visual neurons involved in diverse behavioral tasks (mouse: Niell and Stryker, 2010; rat: Agrochão et al., 2010; fruit fly: Chiappe et al., 2010; Maimon et al., 2010). These boosted responses must provide the animals with substantial energetic benefits because the increased neural signaling will add a significant energetic cost during states when muscle tissue metabolism can be extremely high (Laughlin, 2001; Niven and Laughlin, 2008).
The faster an animal moves, the greater the optic flow it experiences, and the more rapidly it must respond to visual stimuli. For many animals, wide-field optic flow is an important cue for estimating their self-motion trajectory (Britten, 2008; Krapp and Wicklein, 2008). Neurons selective for wide-field optic flow and supporting self-motion estimation have been identified and well-studied in a number of animals (revs: primates: Andersen et al., 2000; pigeons: Frost and Wylie, 2000; locusts: Gabbiani et al., 2004; blowflies: Hausen, 1993). Because a moving animal will experience a different range of velocities of optic flow, compared to when stationary, the velocity tuning of wide-field optic flow processing neurons may be altered. Indeed, Chiappe et al. (2010) have recently shown that locomotion can alter the velocity tuning of optic flow-processing interneurons in the blowfly.
To identify neural mechanisms that may be involved in the locomotor state modulation of velocity coding of optic flow–processing interneurons, we have investigated how a pharmacologically induced state change affects the velocity coding of an identified visual interneuron of the blowfly, the H2 cell. We chose the blowfly as a model system because its eye movements and optic flow-processing neurons, the lobula plate tangential cells (LPTCs), have been exceptionally well characterized (revs: Hausen, 1993; Krapp and Wicklein, 2008). A characteristic behavior of moving flies is to perform rapid yaw turns, whose velocity is twice as high during flight as during walking (Hateren and Schilstra, 1999; Blaj and van Hateren, 2004). We chose the H2 cell because it supports optomotor responses to yaw rotations, as part of a recurrent network of cells tuned to horizontal motion (Hausen, 1982a,b; Haag and Borst, 2001; Krapp et al., 2001).
We induced the state change in the blowfly using the octopamine agonist chlordimeform (CDM). Octopamine is a biogenic amine that plays a significant role in fight-or-flight responses in insects (Roeder, 2005). It is released in high quantities throughout the body during flight (Goosey and Candy, 1980; David et al., 1985; Adamo et al., 1995), affecting the metabolism (Wegener, 1996), feeding behavior (Long and Murdock, 1983; Stoffolano et al., 2007), muscle tone (Evans and Siegler, 1982), and state-dependent reflexes (Büschges et al., 1993; Skorupski, 1996). In particular, octopamine can alter the processing of visual information both in the periphery (horseshoe crab: Kaupp et al., 1982; Kass and Barlow, 1984; fruit fly: Chyb et al., 1999) and in wide-field optic flow processing interneurons (locust: Bacon et al., 1995; honeybee: Kloppenburg and Erber, 1995; blowfly: Longden and Krapp, 2009). Octopamine agonists including CDM induce flight motor activity in hawk moths and locusts (Kinnamon et al., 1984; Sombati and Hoyle, 1984), and fruit flies lacking octopamine are impaired in flight initiation and maintenance (Brembs et al., 2007).
Previously, we have shown that CDM modulates the responses to directional stimuli of identified blowfly LPTCs that respond to vertical motion (Longden and Krapp, 2009). This octopaminergic modulation matched well the changes between flying and resting in the responses of cells sensitive to vertical motion recorded in Drosophila (Maimon et al., 2010). However, we did not test how these results were dependent on the velocity of the stimulus. Here, we used visual motion stimuli to characterize the effects of octopaminergic signaling on the coding of horizontal velocities by the H2 cell in combination with an information theoretic analysis to quantitatively estimate the functional impact of these effects (Borst and Theunissen, 1999). Blowfly LPTCs are tuned to the temporal frequencies of gratings, rather than their absolute velocities (Hausen, 1993), so we characterize the velocity of our stimuli by their temporal frequencies.
Materials and Methods
Animal Preparation
Experiments were performed on 2–11 day old female blowflies, Calliphora vicina, taken from our lab culture stock. The flies were briefly immobilized using ice before their legs, wings, and mouthparts were removed to prevent body movements from affecting recording stability, and the wounds covered with beeswax to prevent desiccation. The antennae were left intact. The head and body were held in position on a custom holder using beeswax. The orientation of the head was aligned with the stimulus apparatus using the deep pseudopupil (Franceschini, 1975). Portions of the cuticle covering the rear head capsule were cut away and then the fatty tissue and air sacs removed to expose the lobula plate on both sides of the head. The tissue was kept moist using fly Ringer solution, using the recipe published by Karmeier et al. (2001).
Electrophysiology
We performed extracellular recordings of the H2 LPTC in the right-hand lobula plate using 3 MΩ tungsten electrodes (FHC Inc., Bowdoin, ME, USA). We also recorded the H1 LPTC to verify the identification of the H2 cells. The indifferent electrode was a tungsten electrode placed in the hemolymph through a small hole in the left head capsule. The signal was bandpass filtered (0.5–10 kHz), amplified using an EXT 10-2F amplifier (NPI Electronic GmbH, Tamm, Germany), and sampled at 20 kHz using a NI USB-6009 data acquisition card (National Instruments Corporation, Austin, TX, USA). Data acquisition was controlled by custom interface software written in MATLAB (The MathWorks Inc., Natick, MA, USA) using the MATLAB Data Acquisition Toolbox. We used custom-written MATLAB software to sort spikes by peak-to-trough amplitude and shape. The spikes of individual units were well isolated and the signal-to-noise ratio was always sufficiently large so that the cell’s spikes could be unambiguously identified. For the different stimulus conditions, the temperature ranges were: velocity stimulus 21.9–23.3°C, positive velocity stimulus 21.4–22.7°C, velocity tuning stimulus 21.7–24.3°C, motion adaptation stimulus 20.8–23.2°C. So across all the recordings, the temperature ranged between 20.8 and 24.3°C, but for the information rate calculations, the temperature varied by at most 1.4°C per set of experiments.
The H2 and H1 cells have similar motion receptive fields, in that both cells prefer horizontal back-to-front motion in the ipsilateral visual field (Hausen, 1984). The H2 cell has a characteristically low spontaneous spiking activity, and we hypothesized that its spiking activity may be recruited by active locomotor states. To identify the ipsilateral H2 cell, and disambiguate it from the ipsilateral H1 cell, we used local responses to motion stimuli. The H2 cell does not project to the contralateral lobula plate, so the contralateral H1 cell can be reliably identified by its horizontal front-to-back motion preferences in the contralateral visual field. The mean spike rate of the H2 cell’s response to a local motion stimulus is much lower than that of the H1 cell (Figure 1A; Hausen, 1984). In addition, whilst both cells are sensitive to a local motion stimulus at azimuth 30°, elevation 0°, the H2 cell has little sensitivity at azimuth 90°, elevation 0°, a location where the H1 sensitivity remains strong (Figure 1A; Krapp et al., 2001).
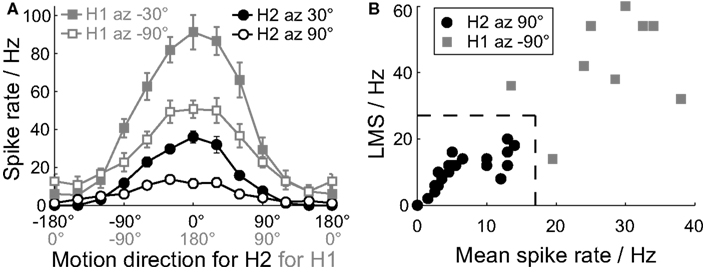
Figure 1. Identification of H2 cells from extracellular recordings. (A) Local motion direction tuning curves for the H2 cells (black) and the contralateral H1 cells (gray). We recorded the H2 cells with the dot stimulus centered at elevation 0° azimuth 30° (filled circles) and azimuth 90° (open circles), and the H1 cells at elevation 0° azimuth −30° (filled squares) and azimuth −90° (open squares). The contralateral H1 tuning curve is phase shifted by 180° and reversed in direction to aid comparison with the tuning curve of the ipsilateral H2 cell. The stimulus direction axis is correspondingly labeled for the H2 cells (black) and the H1 cells (gray). Mean ± SE values shown (H2 N = 21, H1 N = 9). (B) To disambiguate putative H2 (black dots) cells from H1 cells (gray squares), we compared the local motion sensitivity (LMS) and mean spike rates of the responses to the dot stimulus at azimuth +90° and azimuth −90° respectively. The dotted line indicates the classification boundary: cells inside this boundary were classified as H2 cells, and those outside as H1 cells.
For every putative H2 cell we recorded the response to a moving dot stimulus at azimuth 30°, elevation 0°, and at azimuth 90°, elevation 0°, and calculated the local motion sensitivities and mean response rate at each location (stimulus and analysis are described below). These values were then compared to those recorded for contralateral H1 cells at azimuth −30°, elevation 0°, and azimuth −90°, elevation 0° (Figures 1A,B). The putative H2 cells could be reliably disambiguated from H1 recordings by having a mean spike rate <17 Hz, and a local motion sensitivity (LMS) <28 Hz at azimuth 90°, elevation 0°, under our experimental conditions (Figure 1B).
Application of CDM
To simulate the sustained local release of octopamine throughout the animal, we used the octopamine agonist chlordimeform–HCl (CDM; Sigma–Aldrich, Dorset, UK). CDM is tissue-permeable and has a lasting effect in the quantities used here of ≥1 h (Figure 2D). CDM was dissolved in fly Ringer solution at 2.5 μM and stored at 4–8°C. CDM solution was applied to the right-hand lobula plate in a 10 μl drop using a micropipette. We have previously identified this concentration and amount of CDM as physiologically relevant (Longden and Krapp, 2009). Briefly, the amount of CDM per gram wet weight used is 1.4 × 10⁻⁹ mol/g calculated for the head alone and 2.4 × 10⁻¹⁰ mol/g calculated for the body. In behavioral studies 10−9 to 10−7 mol/g has been used in the hawk moth Manduca sexta, the cricket Gryllus bimaculatus, and the cockroach Periplaneta americanas (Kinnamon et al., 1984; Stevenson et al., 2005; Rosenberg et al., 2007). In electrophysiology studies bath solutions of 10–100 μM CDM have been used in the locust Schistocerca gregaria and in M. sexta (Duch and Pflüger, 1999; Vierk et al., 2009). Thus, 2.5 μM is at the lower end of the range of concentrations used.
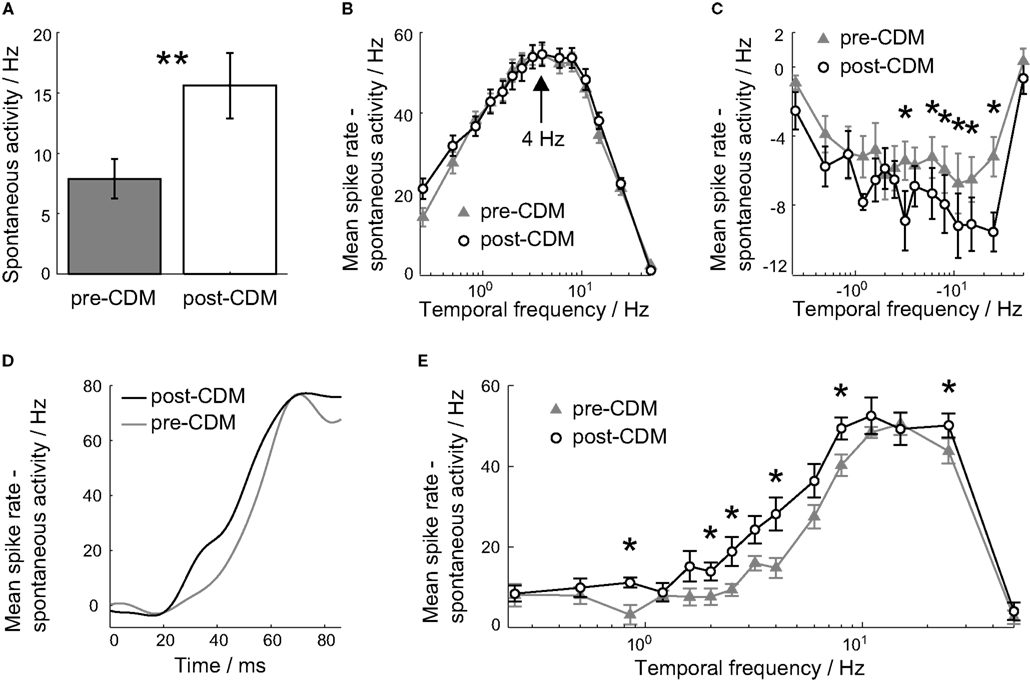
Figure 2. Chlordimeform (CDM) altered velocity tuning. (A) The application of CDM increased the spontaneous activity of all cells. In all panels, error bars denote SE and asterisks denote the significance of the changes: **P < 0.01, *P < 0.05, N = 7. (B,C) The mean spike rate over the 0.5 s of the stimulus duration as a function of positive (B) and negative (C) stimulus velocities, before the application of CDM (gray triangles) and afterward (black circles). The spontaneous activity has been subtracted to aid comparisons between the two tuning curves. The peak preferred temporal frequency is unchanged at 4 Hz [arrow in (B)]. (D) The mean responses to the 4 Hz stimulus, smoothed with a Gaussian filter with σ = 6 ms, before (gray) and after (black) the application of CDM. The stimulus onset is at 0 ms. (E) The mean spike rate over the 20–60 ms period after the stimulus onset, for positive temporal frequencies.
Visual Stimulation
Equipment
The dot stimulus was displayed on a phosphor cathode ray tube (CRT) display (Tektronix, Berkshire, UK), with a refresh rate of 182 Hz. A piece of black cardboard with a circular 20° diameter hole was placed directly in front of the CRT, which was mounted on a meridian frame that could be moved to different azimuth positions relative to the fly. The CRT images were generated using a Picasso Image Synthesizer (Innisfree, Crozet, VA, USA) and custom electronics (Department of Zoology, University of Cambridge, Cambridge, UK).
All the stimuli after the dot stimulus were presented on an Iiyama Vision Master Pro 454 monitor (Iiyama, Tokyo, Japan). Frames were shown with a 200 Hz refresh rate that was achieved using the PowerStrip software (EnTech, Taipei, Taiwan) in and an NVIDIA Quadro NVS 290 graphics card (NVIDIA, Santa Clara, CA, USA). A piece of black cardboard with a circular 24° diameter hole was placed directly in front of the monitor, and the monitor was positioned at azimuth 30°, elevation 0°. The stimuli were generated and displayed using the Psychophysics Toolbox (Brainard, 1997) in MATLAB.
Dot stimulus
A moving dot stimulus was used to determine the local motion sensitivities and local motion direction tuning curves of the H1 and H2 cells (Krapp and Hengstenberg, 1997). A 7.6° diameter dark dot moved clockwise on a bright background (Michelson contrast of 60%) for 3 s on a 10.4° diameter circular path at a speed of two cycles per second. The background alone was then presented for 2 s, before the dot moved counter clockwise for another 3 s. The stimulus was displayed first at azimuth 30°, elevation 0°, and then at azimuth 90°, elevation 0° for recordings of ipsilateral H2 cells, and at azimuth −30°, elevation 0°, and then at azimuth −90°, elevation 0° for recordings of contralateral H1 cells.
Velocity tuning stimulus
A square-wave grating of a spatial wavelength of 11.4° was displayed on the monitor with a Michelson contrast of 95%. In every trial, the grating moved for 0.5 s at one of 31 constant temporal frequencies between −25 and +25 Hz. A gray isoluminant screen was displayed for 0.5 s immediately before and after every grating display. The temporal frequencies were randomly ordered in every set of 31 trials. There were 25 sets of 31 trials, lasting 19.4 min in total.
Motion adaptation stimulus
The same grating as for the velocity tuning stimulus was displayed. In every trial, the grating moved for 4 s at a temporal frequency of either 5.5, 7.5, or 12.5 Hz. A gray isoluminant screen was displayed for 2 s immediately before and after every grating display. The temporal frequencies were randomly ordered in every set of 3 trials. There were 100 sets of 3 trials, lasting 40 min in total.
Velocity stimulus
A square-wave grating with a spatial wavelength of 11.4° was displayed on the monitor with a Michelson contrast of 95%. The position of the grating was updated every 5 ms such that the grating appeared to move with a temporal frequency between −25 Hz and +25 Hz. The values of temporal frequency were drawn from a uniform distribution in every 5 ms time step. The stimulus was presented for 30 s in the first trial, and then the sequence of frames was repeated in 99 further trials, with the trials running without interruption. Before and after the 100 trials, a gray screen was shown of an equal mean luminance to the grating. For every cell, a new frame sequence was chosen. Completing a set of 100 trials took 50 min in total.
Positive velocity stimulus
The stimulus was identical to that described for the velocity stimulus, except that the apparent temporal frequency in every 5 ms time step was drawn from a uniform distribution between 0 and 25 Hz.
Data Analysis
Local motion direction tuning curves and motion sensitivity
We characterized the cell’s local motion direction tuning curve and LMS from the motion tuning curves obtained with the dot stimuli using the method described by Krapp and Hengstenberg (1997). We calculated the local preferred direction (LPD) as the stimulus direction of the circular mean of the tuning curve. The LMS was then calculated as the difference between the mean response over the intervals LPD ±45° and LPD +180 ± 45°.
Stimulus response latency
To calculate the latency of the responses to the velocity tuning stimulus, we applied the method described by Warzecha and Egelhaaf (2000). First, we calculated the mean across all trials for a stimulus, for every cell, and smoothed the mean response with a Gaussian filter with a 3 ms standard deviation (SD). Next, we calculated a threshold value equal to the mean plus twice the SD of the spontaneous spike rate in the time interval 375 ms period prior to stimulus onset. The latency was defined as the time after stimulus onset when the smoothed mean spike rate exceeded the threshold value for 6 ms.
Information calculations
We calculated the mutual information rate between the stimulus and the neural response using the method described by Strong et al. (1998). In general, calculating the mutual information precisely quantifies how informative the neural response is about the stimulus, taking into account the reliability and temporal precision of the code (rev.: Borst and Theunissen, 1999). The particular advantage of the method of Strong et al. (1998) is that it makes minimal assumptions about the nature of the neural code, and thus the results do not depend critically on the choice of the neural code used to interpret the neural responses. Because the method does not assume that information is encoded on a specific time scale, the information estimates are calculated as information rates: the information transmitted in a given period is then the product of the information rate and the period duration (Cover and Thomas, 1991). The consequences for the behavior of the animal then depend on the duration of the behavior.
We briefly summarize the method as follows, giving all equations to enable replication of the method, but see Strong et al. (1998) for more details. The mutual information, I, is given by I = S − N, where S is the total entropy of the responses over all trials, a measure of the signal, and N is the mean entropy of the responses across trials, a measure of the noise, or variability in the responses.
To calculate the entropies involved, we needed to calculate the occurrences of different spike responses. To do this, the spike train was binned in time bins of size Δτ, and examined in windows of duration T > Δτ. The values of the T/Δτ time bins per time window determined the response in that time window. Every time window response was labeled with the binary word of its time bin values. We calculated the normalized frequency of every word, from which we calculated the entropy of the spike train. The entropies were calculated using the method of Nemenman et al. (2004) to minimize the bias in our entropy estimates due to the limited sampling of the entropy distributions. The MATLAB code for implementing the Nemenman et al. (2004) method is freely available from the Sourceforge software repository: http://sourceforge.net/projects/nsb-entropy/files/nsb-entropy-oct/.
This process was performed for a pair of values of Δτ and T for the 100 trials to calculate the signal entropy, S(Δτ,T). Then the entropy in every time window across trials was calculated, to quantify N(Δτ,T), and averaged over all time windows, <N(Δτ, T)>.
When short values of T were used, the estimates were reliable but only a limited range of different responses were possible. At long values of T, the full ranges of responses were available but reliably estimating the entropies was difficult. We followed the method proposed by Strong et al. (1998) to calculate the expected entropies for an infinite T, by calculating S(Δτ,T)/T and <N(Δτ,T)>/T for time windows over the range 4Δτ < T < 12Δτ, and extrapolated the values for 1/T = 0, to give the entropy rates S(Δτ) and <N(Δτ)>, respectively.
For every extrapolation, the entropy data points were always above the entropy lower bound, HLower. To calculate the lower bound, we counted the number of coincidences of spike patterns, for spike patterns with a fixed spike count, and calculated the following entropy (Strong et al., 1998):
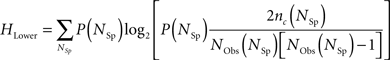
where P(NSp) is the proportion of words with NSp spikes, nc (NSp) is the number of coincidences of response words with NSp spikes, and NObs(NSp) is their frequency of occurrence.
The extrapolated entropy rate estimates, S(Δτ), were also always below the upper bound, SUpper, determined by differentiating the entropy (Strong et al., 1998):

where S(T, Δτ) is the entropy estimate for a given value of T and Δτ.
Finally, the information rate, I(Δτ), was then I(Δτ) = S(Δτ) − <N(Δτ)>.
The information per spike ISpike was calculated as the information rate normalized by the mean spike rate.
Statistics
Data are presented as mean ± standard error (SE), and paired t-tests are used for all significance tests, unless otherwise stated.
Results
Velocity Tuning
We first looked at the effect of CDM on the velocity tuning of the H2 cell. To this end we presented gratings moving at different, constant velocities for 0.5 s and calculated the velocity tuning curves from the responses over the stimulus duration. The application of CDM did not affect the peak preferred velocity, which remained unchanged at 4 Hz (Figure 2B). CDM increased the mean spontaneous spike rate from 7.9 ± 1.7 Hz to 15.6 ± 2.7 Hz (Figure 2A; P = 0.003, N = 7), a change of 97%. To allow for comparisons between the velocity tuning before and after the application of CDM, we subtracted the spontaneous spike rate from the velocity tuning curves. Although the sensitivity to temporal frequencies greater than 4 Hz was increased, this trend was not significant (Figure 2B; P ≥ 0.07, N = 7). As would be expected from the increase in the spontaneous spike rate, the responses to negative velocities were consistently reduced, and significantly so for velocities between −25 and −6 Hz (Figure 2C; P < 0.043, N = 7). The H2 cell can encode more information about stimuli in the anti-preferred direction through the CDM-induced increased sensitivity.
When the velocity tuning was calculated for the initial transient responses to the stimuli, 20–60 ms after the stimulus onset, there was a consistent increase in the mean response over the range of temporal frequencies from 0.85 to 8 Hz, with significant increases at 0.85, 2.0, 2.5, 4.0, and 8 Hz (Figure 2E; P < 0.047, N = 7). The mean gain over this interval was 126%.
The increase in the 20–60 ms response to constant velocity stimuli was due to a faster rise to the peak rate response. This is illustrated by the mean responses to the 4 Hz stimulus, shown in Figure 2D. After the application of CDM, the mean rate response increased earlier than the post-stimulus response, and remained greater than the pre-CDM response over the entire 20–60 ms period (Figure 2D). This faster rise can be interpreted as the response latency: the point at which the stimulus-induced response rate significantly deviated and sustained a different value from the mean spontaneous activity (Warzecha and Egelhaaf, 2000).
For stimuli between 0.85 and 8 Hz, the trend is for the response latency to be reduced by CDM (Figure 3B). When the responses to these stimuli are grouped together, the response latency is reduced by 9% from 44.8 ± 1.3 ms to 40.9 ± 1.5 ms (Figure 3A; P = 0.04, N = 7), but the latency of the peak response was not significantly changed (Figure 2D). The reduction in response latency does not mean the entire response occurred earlier, as a reduction in the latency might be taken to imply.
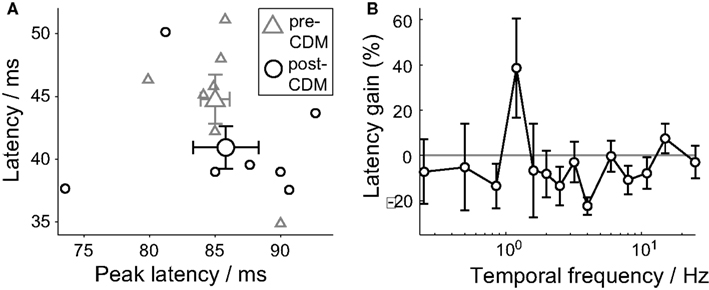
Figure 3. Chlordimeform (CDM) reduced response latencies. (A) The latency of the first significant and sustained change in the response spike rate after stimulus onset (latency, see Methods) versus the latency of the peak responses to temporal frequencies between 0.85 and 8 Hz. The larger symbols show the mean ± SE values (N = 7). (B) The multiplicative gain of the latency of responses to positive temporal frequencies. Mean ± SE values shown (N = 7).
Motion Adaptation
A characteristic property of LPTCs is that the cells’ responses significantly adapt to prolonged motion stimuli (Maddess and Laughlin, 1985). We next assessed the effects of the application of CDM on motion adaptation in the H2 cell (Figure 4), using gratings of different but fixed temporal frequencies because the parameters of motion adaptation depend on the stimulus (Harris et al., 2000; Fairhall et al., 2001; Reisenman et al., 2003).
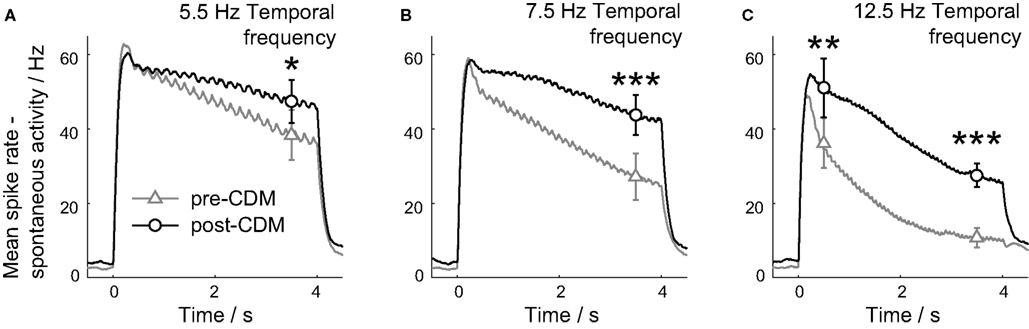
Figure 4. Chlordimeform (CDM) reduced motion adaptation. The smoothed, mean responses are shown for the three temporal frequencies used: 5.5 Hz (A), 7.5 Hz (B) and 12.5 Hz (C). The spontaneous activity has been subtracted to aid comparisons between the two conditions. The responses were binned in 10 ms time bins, and smoothed with a causal filter of a 14 point half-Gaussian to avoid responses appearing before the stimulus onset at 0 ms. The mean ± SE values between 3.25 and 3.75 s after the stimulus onset are shown in all panels, and the mean ± SE values between 0.25 and 0.75 s after the stimulus onset are also shown in C. Asterisks denote significance of the changes: ***P < 0.005, **P < 0.01, *P < 0.05, N = 5.
The application of CDM reduced the motion adaptation of the H2 cell response for all three stimulus velocities used (Figure 4). The mean response rate was greater 3.5 s after the stimulus onset for all the temporal frequencies (Figure 4; 5.5 Hz P = 0.02, 7.5 Hz P = 0.002, 12.5 Hz P = 0.001, N = 6). For the responses to gratings moving at 5.5 and 7.5 Hz, the smoothed mean responses between 0.5 and 3.5 s after stimulus onset were well described by linear fits. The slope of these fits was reduced at both temporal frequencies by CDM (5.5 Hz: P = 0.01, mean R2 = 0.94 pre-CDM, = 0.77 post-CDM; 7.5 Hz: P = 0.03, mean R2 = 0.98 pre-CDM, = 0.84 post-CDM; N = 6). At the higher temporal frequency of 12.5 Hz, the application of CDM introduced a significantly greater response 0.5 s after the stimulus onset (Figure 4C; P = 0.005, N = 6), and the adapting response had a complex shape not well fitted by linear or exponential terms, indicating the augmentation of a specific, stimulus-dependent mechanism operating 0.5–1.5 s post-stimulus.
Velocity Information
To quantify the impact of the changes in velocity coding caused by the application of CDM, we calculated the information rate of the H2 spike response to a grating moving with a random temporal frequency. The temporal frequency was updated every frame with a value chosen from a uniform distribution between −25 Hz and +25 Hz. This measure quantifies the information potentially available to the animal to make a decision in the face of dynamically changing stimuli. In our case, the time taken for the H2 cell to express one bit of information is the minimum time available for the fly to decide between two behavioral options, such as turn to the left or right, were the decision to be based on the H2 cell activity alone.
The method used to calculate the information rate did not require us to make any strong assumptions about the neural code used by the cell, except that we needed to specify the time resolution, Δτ, over which the distributions of spike patterns were calculated (see Methods; Strong et al., 1998). The raster plot of the responses of the H2 cell to the repeated stimulus in Figure 5A shows that the cell’s activity was consistent across trials, with a spike timing precision approaching the millisecond time scale, in agreement with previous studies of spiking LPTCs (Strong et al., 1998; Fairhall et al., 2001).
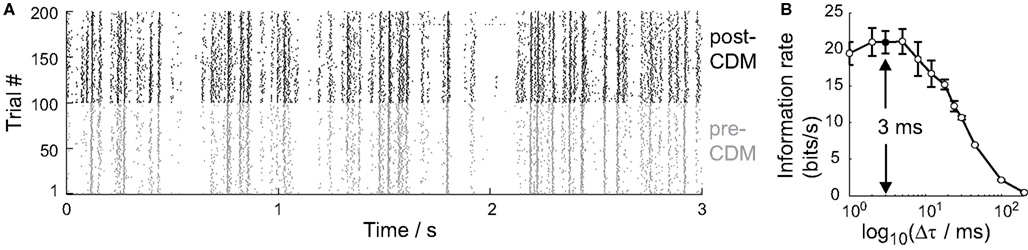
Figure 5. Temporal resolution of information encoded by the H2 cell. (A) Raster plot of spike responses of one cell to the stimulus over 100 trials before the application of CDM (gray, pre-CDM) and 100 trials afterward (black, post-CDM). Only the first 3 s of each 30 s trial is shown. (B) The information rate as a function of the time intervals, Δτ, that the spike trains were binned into. The information peaks around 3 ms (arrow). Mean ± SE values shown (N = 6).
We calculated the information rate over a range of time interval resolutions, 200 ms > Δτ > 1 ms, to identify the relevant time resolution. The information rate increases with decreasing Δτ until around 3 ms (Figure 5B). At finer time resolutions, the variability in spike timing is too great to take advantage of the larger set of spike pattern responses that is potentially available. We therefore used Δτ = 3 ms in all our subsequent analysis of information rates.
Before the application of CDM, the information rate was 20.9 ± 1.5 bits/s (Figure 6A). At this mean bit rate, the cell communicates on average one bit of information every 48 ms. The application of CDM increased the information rate by 33% to 27.7 ± 0.9 bit/s (Figure 6A; P = 0.003, N = 6). This is equivalent to reducing the mean time to encode one bit to 36 ms. The change in information rate was achieved not by boosting the signal or reducing the noise, but by amplifying both approximately equally. Both the total entropy rate and the noise entropy rate of the H2 spike response experienced gains of 35 ± 4 and 36 ± 4%, respectively (Figure 6B).
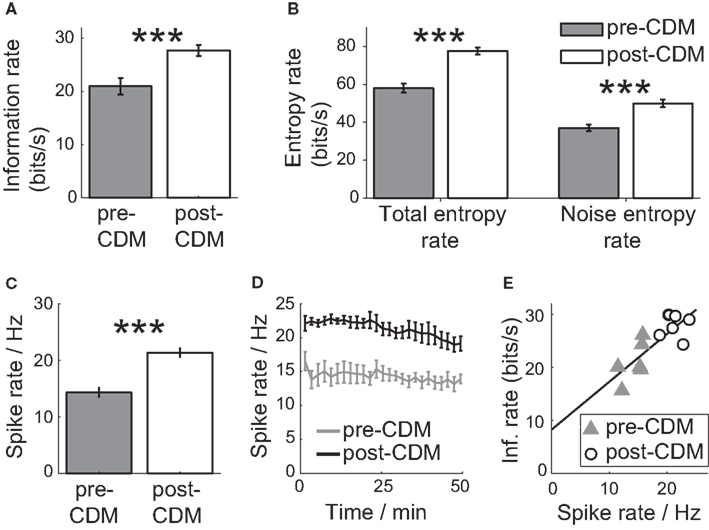
Figure 6. Chlordimeform (CDM) increased the information of the responses to the velocity stimulus. (A) The information rate before and after the application of CDM. In all panels, error bars denote SE and asterisks denote the significance of the changes: ***P < 0.005, N = 6. (B) The total and noise entropy rates are both increased by the application of CDM. (C) The mean spike rate over 100 trials is increased by CDM. (D) The change in the mean spike rate is sustained over the duration of the 100 trials (50 min). (E) Information rate as a function of the mean spike rate, before and after the application of CDM. The black line shows the linear regression fit (regression slope = 0.90, R2 = 0.65).
The increase in information rate after the application of CDM could be partly explained by the greater inhibitory signaling range due to an elevated mean spike rate (Borst and Haag, 2001; Spavieri et al., 2010). The application of CDM increased the mean spike rate per trial by 49%, from 14.3 ± 0.8 to 21.3 ± 0.7 Hz (Figure 6C; P = 0.001, N = 6), and the increase in the mean spike rate was maintained over the duration of the 100 trials we recorded (Figure 6D). The mean spike rate correlates well with the mean information rate, with a Pearson correlation coefficient of 0.81 (Figure 3E; P = 0.002, N = 12; regression slope = 0.90, R2 = 0.65). The H2 cells could have exploited the increased negative signaling range to signal more information about stimuli in the anti-preferred direction by reducing the spike rate from the elevated mean rate.
Velocity Information in the Positive Signaling Range
To test the dependence of the information increase after the application of CDM on the changes in the responses to positive velocities, we stimulated the H2 cells with gratings moving with positive velocities which ranged between 0 and 25 Hz. The information rate of the H2 response to this stimulus was 12.7 ± 1.7 bits/s (Figure 7A). This mean rate is equivalent to communicating one bit every 79 ms, potentially enough information to distinguish between two states, such as a slow right turn and a fast right turn. The application of CDM increased the information rate by 24% to 15.8 ± 1.6 bits/s (Figure 7A; P = 0.009, N = 5), reducing the mean time to communicate one bit to 63 ms. The information rate was elevated through increases in the total and noise entropy rates. The total entropy rate experienced a gain of 74 ± 16%, and the noise entropy rate increased by 88 ± 19% (Figure 7B). These changes indicate that the repertoire of spike responses used by the cell to encode positive velocities increased, but the temporal precision was reduced.
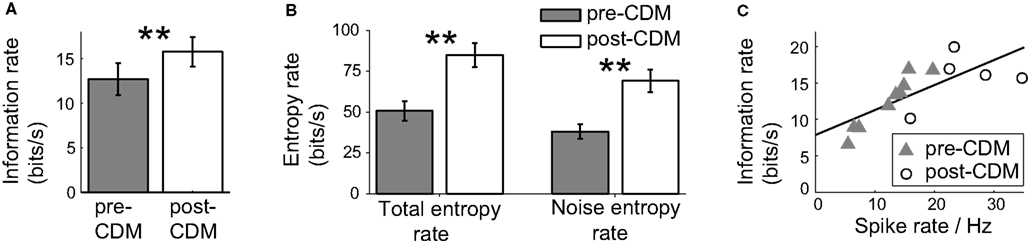
Figure 7. Chlordimeform (CDM) increased the information of the responses to the positive velocity stimulus. (A) The information rate before and after the application of CDM. In all panels, error bars denote SE and asterisks denote the significance of the changes: **P < 0.01, N = 5. (B) The total and noise entropy rates are both increased by the application of CDM. (C) Information rate as a function of the mean spike rate, before and after the application of CDM (pre-CDM N = 9, post-CDM N = 5). The black line shows the linear regression fit (regression slope = 0.34, R2 = 0.56).
The application of CDM also significantly increased the mean rate by 103% from 12.3 ± 1.8 to 25.0 ± 3.2 Hz (P = 0.004, pre-CDM N = 9 post-CDM N = 5). The correlation between the mean spike rate and the information rate remained strong, with a Pearson correlation coefficient of 0.75 (P = 0.002, N = 14). However, the slope of this correlation was much reduced at a value of 0.34 (Figure 7C; R2 = 0.56), compared to a slope of 0.9 for the velocity stimulus ranging over ±25 Hz temporal frequency.
To understand how the mean spike rate and information rates were connected, we analyzed the distribution of spike patterns. We calculated the frequencies of all the spike patterns of the responses to the positive velocity stimulus. The spike patterns were identified by splitting the recordings into time windows of 33 ms, and labeling spikes with a precision of 3 ms. This is a time window duration sufficiently short to reliably estimate the entropy rates and long enough to be behaviorally relevant (Land and Collett, 1974). The main effect of CDM is to increase by a factor of ∼2.5 the frequency of words with ≥2 spikes that occurred in the pre-CDM trials (Figures 8A,B), consistent with an increased sensitivity of the H2 cell to specific velocities in the stimulus. The application of CDM also resulted in the expression of a slightly different set of spike words, consistent with a small change in the neural coding or more noise in the responses. There were 406 words of ≥2 spikes that occurred 35,625 times before the application of CDM. Afterward 143 novel words with ≥2 spikes occurred 264 times and 49 words that had occurred 60 times were no longer observed. This analysis indicated that changes in the H2 cell’s sensitivity to specific velocities in stimulus may explain the increases in the information rates, in addition to the increased coding bandwidth provided by the elevated spike rate.
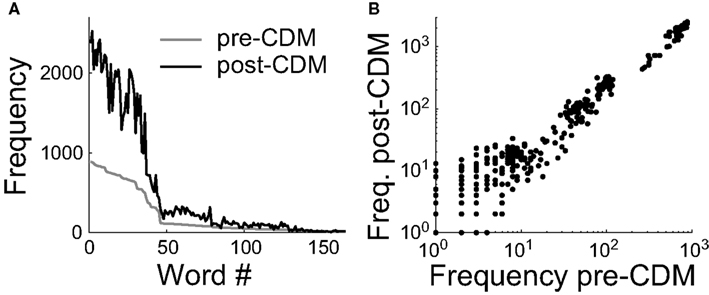
Figure 8. Chlordimeform (CDM) altered spike word frequencies in the responses to the positive velocity stimulus. (A) Words containing ≥2 spikes in the pre-CDM responses were ranked and numbered (Word #) according to their frequency of occurrence (gray line). CDM increased the frequency of all but two of the words with an initial frequency ≥33 (black line). (B) The increase in word frequency after the application of CDM. The change is well described by a linear fit (regression slope = 2.5, R2 = 0.98).
Spike Efficiency
Because the generation of action potentials is a significant term in the energy budget of neural signaling (Laughlin, 2001), we calculated the spike efficiency - the number of bits of information per spike – to assess the energetic costs of the changes induced by the application of CDM. Although CDM increased the information rates, the changes in the mean spike rate were greater, and thus the spike efficiency was reduced (Figure 9). For the velocity stimulus, the spike efficiency was initially 1.45 ± 0.1 bits/spike, equivalent to, on average, each spike communicating 21.45 = 2.7 velocity states. CDM reduced the spike efficiency by 10% to 1.3 ± 0.1 bits/spike (Figures 9A,B; P = 0.03, N = 6), equivalent to a reducing by 0.3 the number of velocity states being communicated per spike.
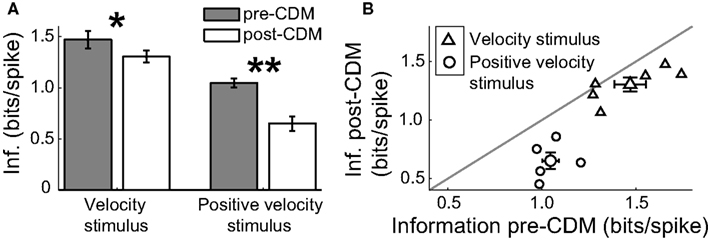
Figure 9.Chlordimeform (CDM) reduced the spike efficiency. (A) The application of CDM reduced the information per spike of the responses to the velocity stimulus and the positive velocity stimulus. Asterisks denote significance of the changes: *P < 0.05 N = 6, **P < 0.01, N = 5. (B) The spike efficiency of all but one cell was reduced by the application of CDM. Larger symbols and error bars denote mean ± SE values.
The CDM-mediated reduction in the spike efficiency was greater for the positive velocity stimulus at 38%, from 1.05 ± 0.04 bits/spike to 0.65 ± 0.07 bits/spike (Figures 9A,B; P = 0.006, N = 5). This is consistent with the proportionally larger increase in the noise entropy after the application of CDM for this stimulus: more spikes are being used less effectively.
Discussion
Octopamine plays a key role in modulating physiological parameters during insect flight, a state in which, for instance, a blowfly has to respond quickly to changes in high velocity optic flow without wasting a limited energy resource on inefficient neural coding. We found that the octopamine agonist CDM altered the velocity tuning of the initial (20–60 ms post-stimulus) response of the H2 cell to constant velocity stimuli (Figure 2E), increased the dynamic range of responses to stimuli in the anti-preferred direction (Figure 2C), and reduced the rate and magnitude of motion adaptation (Figure 4). These changes contributed to an increase of 33% in the information rate of the H2 cell about a random velocity visual stimulus (Figure 6). The resultant information rate was sufficient to potentially discriminate between left and rightwards movement in 36 ms, a timescale consistent with the flight steering response times (Land and Collett, 1974). However, the effects of CDM on the mean spike rate were greater than on the information rate, such that each bit of information required more energy, in the form of spikes, to be transmitted (Figure 9). To our knowledge, our findings are the first to demonstrate that the application of a neuromodulator can induce a velocity-dependent change in the gain of a wide-field optic flow-processing neuron.
Octopamine is linked to many behavioral processes other than flight, including wakefulness (Crocker and Sehgal, 2008), aggression (Hoyer et al., 2008; Zhou et al., 2008), and stress (Adamo et al., 1995). It is likely that individual flies would be in different behavioral states before and during our experiments and have different levels of hemolymph octopamine. We performed pairwise comparisons, which demonstrated robust increases in spike rate, velocity information and velocity sensitivity, despite differences in initial values. The results presented here could be further supported by future experiments on additional manipulations of the octopaminergic signaling pathways. For instance, epinastine is a potent and specific octopamine antagonist (Roeder et al., 1998), that we predict would block the effects of CDM on LPTCs. Alternatively, the levels of octopamine in the hemolymph can now be recorded during electrophysiological recordings using cyclic voltammetry (Cooper and Venton, 2009), so that neural activity and octopamine levels can be correlated in real time.
Comparison with Other Studies
In a pioneering study, Heide (1983) recorded from the H1 LPTC extracellularly during flight and non-flight, and found no difference in the responses to wide-field visual stimulation. However, the stimulus used drove the cell to maintain a response spike rate of 300 Hz for seconds, so it is likely that any effects of the flight state on the activity of the H1 LPTC were masked by saturated responses.
The first subsequent recordings from flying flies were recently published: patch-clamp recordings of LPTCs in Drosophila during tethered flight (Maimon et al., 2010). In the graded potential vertical system (VS) LPTCs, flight depolarized the membrane potential and increased the gain of the responses to directional stimuli, compared to non-flight. These features are consistent with our previous findings of the effect of CDM on the spiking V1 and V2 LPTCs in the blowfly (Longden and Krapp, 2009). The activity of the V1 cell directly reflects the activity of the VS1–3 neurons, to which it is connected by electrical synapses (Haag and Borst, 2008). The application of CDM increased the spontaneous spike rate and gain of the response to directional stimuli of the V1 cell, indicating that octopaminergic signaling during flight may modulate VS cells in Drosophila. These results are also consistent with recordings of LPTCs when haltere activity was used to indicate intended movements in stationary blowflies (Rosner et al., 2010). Haltere activity correlated with increases in both the spontaneous spike rate of spiking LPTCs, and the gain of the responses to various stimuli. Our results suggest that blocking octopamine signaling using an octopamine antagonist would abolish haltere-correlated changes in the activity of spiking LPTCs.
The H2 cell synapses with the contralateral horizontal system (HS) LPTCs (Hausen, 1993; Haag and Borst, 2001). It has recently been found in Drosophila that walking increases the gain of the graded potential HS cell response to motion in the preferred direction, compared to the stationary state, as measured using two-photon calcium imaging (Chiappe et al., 2010). Our results suggest that octopamine signaling is a candidate mechanism for the gain increase of the HS cells (Figures 3 and 5). Walking also increased the preferred temporal frequency from 1 Hz to 2 Hz (Chiappe et al., 2010). The cells were stimulated with gratings lasting longer than 10 s, which will have significantly adapted the HS cell responses. We found that an octopamine agonist reduces adaptation in H2, and the magnitude of this effect increased with temporal frequency (Figure 5). Thus, it is also possible that octopamine plays a role in modulations of the temporal frequency tuning of LPTCs, when measured over long timescales.
The effects of CDM on the dynamics of the H2 cell responses to motion stimuli differed in detail from those reported for the V1 and V2 LPTCs (Longden and Krapp, 2009). Where the responses of H2 cell were only increased over the initial (∼50 ms, Figure 3) and long (∼4 s, Figure 5) timescales, the responses of the V1 and V2 cells to comparable stimuli were significantly increased over the entire duration of the response (500 ms). Previous studies on the effects of octopamine on multiple visual neuron types in the honeybee have found a range of response modulations (Kloppenburg and Erber, 1995), and recordings from populations of visual interneurons during flight in crickets have likewise shown a variety of response alterations (Tomioka and Yamaguchi, 1984). Octopamine receptors are G-protein coupled, activating cAMP pathways (Roeder, 2005). Thus there is considerable scope for visual interneurons to be affected in distinct ways by octopamine, to suit the functional roles during different locomotive states.
It is likely that the effects of CDM on the LPTCs are the result of octopamine receptor activity throughout the visual system. Octopamine receptors are found on cells within all visual lobes of the fly, including the photoreceptors (Sinakevitch and Strausfeld, 2006). The octopaminergic modulation of photoreceptor activity in the fly has only been demonstrated through bath activation of octopamine at high concentration (Chyb et al., 1999). In other systems, however, notably the horseshoe crab, Limulus polyphemus, octopamine plays a well-established role in the circadian regulation of photoreceptor activity (revs: Barlow, 2001; Battelle, 2002). This system also indicates how efferent, octopaminergic projections from the central brain encoding state-dependent information can modulate the peripheral visual processing. Octopamine modulates some neurons in the central brain of Limulus (Walker and Roberts, 1982), but its effect on directionally selective optic flow-processing neurons has yet to be determined.
The descending contralateral movement detector (DCMD) of the locust is a visual interneuron modulated by octopamine that is involved in collision avoidance during flight and escape behavior (Gabbiani et al., 2004; Rind et al., 2008). The DCMD is specifically tuned to detect looming stimuli (Rowell, 1971a) which supports a different functional role than that of the H2 cell. Responses of the DCMD habituate to repeated visual looming stimuli. Both flight and octopamine restore the cell’s sensitivity (Rowell, 1971b; Bacon et al., 1995) but do not increase the gain of the first response or the spontaneous spike rate. The DCMD cell needs to encode a binary decision variable, whether to evade a collision or not, so an increase in response gain or spontaneous activity would not necessarily increase the performance of the cell in a behaviorally relevant way.
In the mouse, locomotion increases the gain of neurons in the primary visual cortex, doubling the spiking responses to stimuli, without altering the spontaneous activity or stimulus selectivity (Niell and Stryker, 2010). For the mouse, as for the fly, moving efficiently and being able to respond quickly to visual stimuli appears to be sufficiently important for the animal to invest energy in increasing the neural signaling range of its visual interneurons. Investigating the functional consequences of state-dependent changes in the simpler visual system of the fly may help to reveal general principles of locomotor-induced modulation in sensory processing across phyla as different as invertebrates and vertebrates.
Functional Implications and Conclusion
The presumed function of the H2 cell is to provide information about horizontal motion in the contralateral visual field to the HS cells, that disambiguates between rotation and translation-induced optic flow (Hausen, 1982a,b; Hausen and Wehrhahn, 1990; Haag and Borst, 2001; Krapp et al., 2001; Kern et al., 2005). Flight increases the velocity of yaw rotations experienced by the fly, compared to walking (Blaj and van Hateren, 2004), so the H2 cell could have been expected to increase the magnitude of adaptation to match the dynamic range of the response to the greater stimulus range (Brenner et al., 2000). However, the response range only needs to be decreased to a level that avoids output saturation. The H2 cell has a low spontaneous activity and its response rates rarely exceeding 70 Hz in our experiments. While a given response range should be matched to the dynamics of the stimulus, the cell’s response range itself may increase when downstream neurons require greater or faster inputs, and the energetic cost is warranted by behavioral fitness (Niven and Laughlin, 2008).
A recently suggested function of motion adaptation in the fly LPTCs is to match the dynamic range of the response to that of the stimulus, on a timescale that matches the timescale of changes in the input (Fairhall et al., 2001). In the light of these findings, we would predict that the H2 cell should adapt more slowly when the stimulus statistics change less frequently. In experiments with freely walking and flying flies, the frequency of saccades dropped from ∼10 Hz during walking to 5–10 Hz in flight, while the mean body saccades lasted the same duration (Blaj and van Hateren, 2004). Apparently, flying reduces the frequency of yaw turns and with it any changes in the statistics of the optic flow the fly experiences.
The H2 cell synapses close to the output terminal of the HS equatorial (HSE) cell, and its spikes induce large depolarizations lasting a few milliseconds (Horstmann et al., 2000). As a result, the H2 cell is particularly efficient in communicating the onset and changes of yaw rates to the HSE cell, but has a relatively small effect on the average membrane potential when the stimulation is sustained (Horstmann et al., 2000). Thus, the H2 cell may be involved in rapid stabilizing reflexes in response to yaw rotations. The fact that CDM increased the gain of the velocity response over ∼50 ms would be consistent with such a putative function. Whether or not octopamine modulates yaw optomotor responses could be tested experimentally in future studies by applying octopamine agonists or antagonists to the exposed optic lobes of blowflies during tethered flight (Hausen and Wehrhahn, 1983). Our results suggest that the blowfly uses octopamine to increase the response gain of optic flow processing interneurons that depends on the animal’s locomotor state. The increase in gain requires the fly to invest more metabolic energy which, overall, may pay off due to more efficient visuo-motor control.
Conflict of Interest Statement
The authors declare that the research was conducted in the absence of any commercial or financial relationships that could be construed as a potential conflict of interest.
Acknowledgments
We thank: M. Wicklein, D. A. Schwyn, A. B. Saleem, M. M. Parsons and two anonymous reviewers for helpful discussions and comments on the manuscript; S. S. Schultz for helpful discussions and for advice on information calculations; A. D. Straw and M. H. Dickinson for the loan of a Picasso Image Synthesizer; and A. B. Bonds for the gift of a Tektronix CRT. Research funded by AFRL award FA8655-09-1-3022 to Holger G. Krapp.
References
Adamo, S., Linn, C., and Hoy, R. (1995). The role of neurohormonal octopamine during fight or flight behavior in the field cricket Gryllus bimaculatus. J. Exp. Biol. 198, 1691–1700.
Agrochão, M., Szuts, T., Fadeyev, V., Dabrowski, W., Litke, A., and Meister, M. (2010). Visual cortex unplugged: Neural recordings from rats in the wild. (Salt Lake City, Utah, USA). Conference Abstract: CoSyNe 2010. doi: 10.3389/conf.fnins.2010.03.00335.
Andersen, R. A., Shenoy, K. V., Crowell, J. A., and Bradley, D. C. (2000). Neural mechanisms for self-motion perception in area MST. Int. Rev. Neurobiol. 44, 219–233.
Bacon, J. P., Thompson, K. S., and Stern, M. (1995). Identified octopaminergic neurons provide an arousal mechanism in the locust brain. J. Neurophysiol. 74, 2739–2743.
Barlow, R. (2001). Circadian and efferent modulation of visual sensitivity. Prog. Brain Res. 131, 487–503.
Battelle, B. A. (2002). Circadian efferent input to Limulus eyes: anatomy, circuitry, and impact. Microsc. Res. Tech. 58, 345–355.
Blaj, G., and van Hateren, J. (2004). Saccadic head and thorax movements in freely walking blowflies. J. Comp. Physiol. A 190, 861–868.
Borst, A., and Haag, J. (2001). Effects of mean firing on neural information rate. J. Comput. Neurosci. 10, 213–221.
Borst, A., and Theunissen, F. E. (1999). Information theory and neural coding. Nat. Neurosci. 2, 947–957.
Brembs, B., Christiansen, F., Pflüger, H. J., and Duch, C. (2007). Flight initiation and maintenance deficits in flies with genetically altered biogenic amine levels. J. Neurosci. 27, 11122–11131.
Brenner, N., Bialek, W., and de Ruyter van Steveninck, R. (2000). Adaptive rescaling maximizes information transmission. Neuron 26, 695–702.
Büschges, A., Kittmann, R., and Ramirez, J. M. (1993). Octopamine effects mimick state-dependent changes in a proprioceptive feedback system. J. Neurobiol. 24, 598–610.
Chiappe, E. M., Seelig, J. D., Reiser, M. B., and Jayaraman, V. (2010). Walking modulates speed sensitivity in Drosophila motion vision. Curr. Biol. 20, 1470–1475.
Chyb, S., Hevers, W., Forte, M., Wolfgang, W. J., Selinger, Z., and Hardie, R. C. (1999). Modulation of the light response by cAMP in Drosophila photoreceptors. J. Neurosci. 19, 8799–8807.
Clarac, F., Cattaert, D., and Le Ray, D. (2000). Central control components of a “simple” stretch reflex. Trends Neurosci. 23, 199–208.
Cooper, S. E., and Venton, B. J. (2009). Fast-scan cyclic voltammetry for the detection of tyramine and octopamine. Anal. Bioanal. Chem. 394, 329–336.
Crocker, A., and Sehgal, A. (2008). Octopamine regulates sleep in Drosophila through protein kinase A-dependent mechanisms. J. Neurosci. 28, 9377–9385.
David, J. C., Coulon, J. F., and Lafon-Cazal, M. (1985). Octopamine changes in nervous and non-nervous tissues of the locust, Locusta migratoria L., after different flight conditions. Comp. Biochem. Physiol. C 82, 427–432.
Duch, C., and Pflüger, H. J. (1999). DUM neurons in locust flight: a model system for amine-mediated peripheral adjustments to the requirements of a central motor program. J. Comp. Physiol. A 184, 489–499.
Evans, P. D., and Siegler, M. V. (1982). Octopamine mediated relaxation of maintained and catch tension in locust skeletal muscle. J. Physiol. 324, 93–112.
Fairhall, A. L., Lewen, G. D., Bialek, W., and de Ruyter Van Steveninck, R. R. (2001). Efficiency and ambiguity in an adaptive neural code. Nature 412, 787–792.
Franceschini, N. (1975). “Sampling of the visual environment by the compound eye of the fly: fundamentals and applications,” in Photoreceptor Optics, eds A. W. Snyder, and R. Menzel (Berlin, Germany: Springer), 98–125.
Frost, B. J., and Wylie, D. R. (2000). A common frame of reference for the analysis of optic flow and vestibular information. Int. Rev. Neurobiol. 44, 121–140.
Gabbiani, F., Krapp, H. G., Hatsopoulos, N., Mo, C. H., Koch, C., and Laurent, G. (2004). Multiplication and stimulus invariance in a looming-sensitive neuron. J. Physiol. Paris 98, 19–34.
Goosey, M., and Candy, D. (1980). The D-octopamine content of the hemolymph of the locust, Schistocera americana gregaria and its elevation during flight. Insect Biochem. 10, 393–397.
Haag, J., and Borst, A. (2001). Recurrent network interactions underlying flow-field selectivity of visual interneurons. J. Neurosci. 21, 5685–5692.
Haag, J., and Borst, A. (2008). Electrical coupling of lobula plate tangential cells to a heterolateral motion-sensitive neuron in the fly. J. Neurosci. 28, 14435–14442.
Harris, R. A., O’Carroll, D. C., and Laughlin, S. B. (2000). Contrast gain reduction in fly motion adaptation. Neuron 28, 595–606.
Hateren, J., and Schilstra, C. (1999). Blowfly flight and optic flow II. Head movements during flight. J. Exp. Biol. 202, 1491–1500.
Hausen, K. (1982a). Motion sensitive interneurons in the optomotor system of the fly. I. The horizontal cells: structure and signals. Biol. Cybern. 45, 143–156.
Hausen, K. (1982b). Motion sensitive interneurons in the optomotor system of the fly. II. The horizontal cells: receptive field organization and response characteristics. Biol. Cybern. 46, 67–79.
Hausen, K. (1984). “The lobular complex of the fly: structure, function and significance in visual behaviour,” in Photoreception and Vision in Invertebrates, ed. M. Ali (New York: Plenum), 523–59.
Hausen, K. (1993). “The decoding of retinal image flow in insects,” in Visual Motion and Its Role in the Stabilization of Gaze, eds F. A. Miles, and J. Wallman (Amsterdam: Elsevier), 203–235.
Hausen, K., and Wehrhahn, C. (1983). Microsurgical lesion of horizontal cells changes optomotor yaw responses in the blowfly Calliphora erythrocephala. Proc. R. Soc. Lond. B 219, 211–216.
Hausen, K., and Wehrhahn, C. (1990). Neural circuits mediating visual control in flies. II. Separation of two control systems by microsurgical lesions. J. Neurosci. 10, 351–360.
Heide, G. (1983). “Neural mechanisms of flight control in Diptera” in BIONA Report-2 ed. W. Nachtigall. (Mainz, Stuttgart, New York: Akademie der Wissenschaften und der Literatur zu Mainz and Gustav Fischer Verlag), 35–52.
Horstmann, W., Egelhaaf, M., and Warzecha, A. K. (2000). Synaptic interactions increase optic flow specificity. Eur. J. Neurosci. 12, 2157–2165.
Hoyer, S. C., Eckart, A., Herrel, A., Zars, T., Fischer, S. A., Hardie, S. L., and Heisenberg, M. (2008). Octopamine in male aggression of Drosophila. Curr. Biol. 18, 159–167.
Karmeier, K., Tabor, R., Egelhaaf, M., and Krapp, H. (2001). Early visual experience and the receptive-field organization of optic flow processing interneurons in the fly motion pathway. Vis. Neurosci. 18, 1–8.
Kass, L., and Barlow, R. B. Jr. (1984). Efferent neurotransmission of circadian rhythms in Limulus lateral eye. I. Octopamine-induced increases in retinal sensitivity. J. Neurosci. 4, 908–917.
Kaupp, U. B., Malbon, C. C., Battelle, B. A., and Brown, J. E. (1982). Octopamine stimulated rise of cAMP in Limulus ventral photoreceptors. Vision Res. 22, 1503–1506.
Kern, R., van Hateren, J. H., Michaelis, C., Lindemann, J. P., and Egelhaaf, M. (2005). Function of a fly motion-sensitive neuron matches eye movements during free flight. PLoS Biol. 3, e171. doi: 10.1371/journal.pbio.0030171.
Kinnamon, S. C., Klaassen, L. W., Kammer, A. E., and Claassen, D. (1984). Octopamine and Chlordimeform enhance sensory responsiveness and production of the flight motor pattern in developing and adult moths. J. Neurobiol. 15, 283–293.
Kloppenburg, P., and Erber, J. (1995). The modulatory effects of serotonin and octopamine in the visual system of the honey bee (Apis mellifera L.) II. Electrophysiological analysis of motion sensitive neurons in the lobula. J. Comp. Physiol. A 176, 119–129.
Krapp, H. G., and Hengstenberg, R. (1997). A fast stimulus procedure to determine local receptive field properties of motion-sensitive visual interneurons. Vision Res. 37, 225–234.
Krapp, H. G., Hengstenberg, R., and Egelhaaf, M. (2001). Binocular contributions to optic flow processing in the fly visual system. J. Neurophysiol. 85, 724–734.
Krapp, H. G., and Wicklein, M. (2008). “Central processing of visual information in insects,” in The Senses: A Comprehensive Reference, eds A. I. Basbaum, A. Kaneko, G. M. Shepherd, and G. Westheimer (San Diego: Academic Press), 131–204.
Land, M. F., and Collett, T. S. (1974). Chasing behaviour of houseflies (Fannia canicularis). J. Comp. Physiol. A 89, 331–357.
Laughlin, S. B. (2001). Energy as a constraint on the coding and processing of sensory information. Curr. Opin. Neurobiol. 11, 475–480.
Long, T. F., and Murdock, L. L. (1983). Stimulation of blowfly feeding behavior by octopaminergic drugs. Proc. Natl. Acad. Sci. U.S.A. 80, 4159–4163.
Longden, K. D., and Krapp, H. G. (2009). State-dependent performance of optic flow-processing interneurons. J. Neurophysiol. 102, 3606–3618.
Maddess, T., and Laughlin, S. B. (1985). Adaptation of the motion-sensitive neuron H1 is generated locally and governed by contrast frequency. Proc. R. Soc. Lond. B 225, 251–275.
Maimon, G., Straw, A. D., and Dickinson, M. H. (2010). Active flight increases the gain of visual motion processing in Drosophila. Nat. Neurosci. 13, 393–399.
Nemenman, I., Bialek, W., and de Ruyter van Steveninck, R. (2004). Entropy and information in neural spike trains: progress on the sampling problem. Phys. Rev. E 69, 056111.
Niell, C. M., and Stryker, M. P. (2010). Modulation of visual responses by behavioral state in mouse visual cortex. Neuron 65, 472–479.
Niven, J. E., and Laughlin, S. B. (2008). Energy limitation as a selective pressure on the evolution of sensory systems. J. Exp. Biol. 211, 1792–1804.
Reisenman, C., Haag, J., and Borst, A. (2003). Adaptation of response transients in fly motion vision. I: experiments. Vision Res. 43, 1291–1307.
Rind, F. C., Santer, R. D., and Wright, G. A. (2008). Arousal facilitates collision avoidance mediated by a looming sensitive visual neuron in a flying locust. J. Neurophysiol. 100, 670–680.
Roeder, T. (2005). Tyramine and octopamine: ruling behavior and metabolism. Annu. Rev. Entomol. 50, 447–477.
Roeder, T., Degen, J., and Gewecke, M. (1998). Epinastine, a highly specific antagonist of insect neuronal octopamine receptors. Eur. J. Pharmacol. 349, 171–177.
Rosenberg, L. A., Glusman, J. G., and Libersat, F. (2007). Octopamine partially restores walking in hypokinetic cockroaches stung by the parasitoid wasp Ampulex compressa. J. Exp. Biol. 210, 4411–4417.
Rosner, R., Egelhaaf, M., and Warzecha, A. K. (2010). Behavioural state affects motion-sensitive neurones in the fly visual system. J. Exp. Biol. 213, 331–338.
Rowell, C. H. F. (1971a). The Orthopteran descending movement detector (DMD) neurones: a characterisation and review. Z. vgl. Physiol. 73, 167–194.
Rowell, C. H. F. (1971b). Variable responsiveness of a visual interneurone in the free-moving locust and its relation to behaviour and arousal. J. Exp. Biol. 55, 727–747.
Sinakevitch, I., and Strausfeld, N. J. (2006). Comparison of octopamine-like immunoreactivity in the brains of the fruit fly and blow fly. J. Comp. Neurol. 494, 460–475.
Skorupski, P. (1996). Octopamine induces steady-state reflex reversal in crayfish thoracic ganglia. J. Neurophysiol. 76, 93–108.
Sombati, S., and Hoyle, G. (1984). Generation of specific behaviors in a locust by local release into neuropil of the natural neuromodulator octopamine. J. Neurobiol. 15, 481–506.
Spavieri, D. L. Jr., Eichner, H., and Borst, A. (2010). Coding efficiency of fly motion processing is set by firing rate, not firing precision. PLoS Comput. Biol. 6, e1000860. doi: 10.1371/journal.pcbi.1000860.
Stevenson, P. A., Dyakonova, V., Rillich, J., and Schildberger, K. (2005). Octopamine and experience-dependent modulation of aggression in crickets. J. Neurosci. 25, 1431–1441.
Stoffolano, J. G., Lim, M. A., and Downer, K. E. (2007). Clonidine, octopaminergic receptor agonist, reduces protein feeding in the blow fly, Phormia regina (Meigen). J. Insect Physiol. 53, 1293–1299.
Strong, S. P., Koberle, R., de Ruyter van Steveninck, R. R., and Bialek, W. (1998). Entropy and information in neural spike trains. Phys. Rev. Lett. 80, 197–200.
Tomioka, K., and Yamaguchi, T. (1984). Response modification of cricket sensory interneurons during flight. Zool. Sci. 1, 169–186.
Vierk, R., Pflüger, H. J., and Duch, C. (2009). Differential effects of octopamine and tyramine on the central pattern generator for Manduca flight. J. Comp. Physiol. A 195, 265–277.
Walker, R. J., and Roberts, C. J. (1982). The pharmacology of Limulus central neurons. Comp. Biochem. Physiol. C 72, 391–401.
Warzecha, A., and Egelhaaf, M. (2000). Response latency of a motion-sensitive neuron in the fly visual system: dependence on stimulus parameters and physiological conditions. Vision Res. 40, 2973–2983.
Keywords: state-dependence, optic flow, vision, octopamine, blowfly, information theory
Citation: Longden KD and Krapp HG (2010) Octopaminergic modulation of temporal frequency coding in an identified optic flow-processing interneuron. Front. Syst. Neurosci. 4:153. doi: 10.3389/fnsys.2010.00153
Received: 01 September 2010;
Accepted: 23 October 2010;
Published online: 23 November 2010.
Edited by:
Raphael Pinaud, University of Oklahoma Health Sciences Center, USAReviewed by:
Michael Stern, Stiftung Tierärztliche Hochschule Hannover, GermanyGerald S. Wasserman, Purdue University, USA
Copyright: © 2010 Longden and Krapp. This is an open-access article subject to an exclusive license agreement between the authors and the Frontiers Research Foundation, which permits unrestricted use, distribution, and reproduction in any medium, provided the original authors and source are credited.
*Correspondence: Kit D. Longden, Department of Bioengineering, Imperial College London, London SW7 2AZ, UK. e-mail: kit@imperial.ac.uk