Insulin modulation of magnetoencephalographic resting state dynamics in lean and obese subjects
- 1 MEG Center, University of Tübingen, Tübingen, Germany
- 2 Graduate School of Neural and Behavioural Sciences, International Max Planck Research School, University of Tübingen, Tübingen, Germany
- 3 Institute of Medical Psychology and Behavioral Neurobiology, University of Tübingen, Tübingen, Germany
- 4 Division of Endocrinology, Diabetology, Angiology, Nephrology and Clinical Chemistry, Department of Internal Medicine, Eberhard Karls University Tübingen, Tübingen, Germany
- 5 Department of Obstetrics and Gynecology, University of Arkansas for Medical Sciences, Little Rock, AR, USA
Lean and obese subjects can exhibit differences in neuronal activity during resting state and tasks. Changes in hormonal status and their action related to increased body weight may be the determining factor for these differences. One prime candidate is insulin, which until recently was mainly related to its metabolic function for the transport and regulation of glucose in the periphery. However insulin also acts as an anorexic signal in the central nervous system contributing to the termination of food intake in the postprandial state. In our study, we examined with whole-head magnetoencephalography the effect of intranasal insulin on the dynamics of the resting state network in a placebo controlled study. Weighted clustering coefficient C, which describes local interconnectedness, and weighted path length L, a measure of global interconnectedness, were computed. These parameters showed high intraindividual reliability. However, no difference for the network dynamics was found between lean and obese subjects in the basal state. The application of insulin led to subject specific changes and we found a statistically significant positive correlation between the insulin induced change in path length in the theta band (4–8 Hz) and body mass index. The change in pathway length after insulin administration indicates a strong insulin modulation on global communication efficiency, which is probably related to the signaling between different regions involved in satiation and homeostatic control.
Introduction
According to the World Health Organization, there are currently 1.6 billion overweight (body mass index, BMI >25 kg/m2) and at least 400 million obese adults (BMI >30 kg/m2) worldwide. Human eating behavior is controlled by homeostatic and hedonic mechanisms (Berthoud, 2006; Finlayson et al., 2007). Brain processes related to these two mechanisms constitute a reciprocally connected network (Erlanson-Albertsson, 2005), which exerts influence on the neuro-regulatory control of feeding. Upto now, several studies have investigated the specific role of different brain regions related to eating behavior (Gautier et al., 2000, 2001; Del Parigi et al., 2002, 2005; Stoeckel et al., 2008; Guthoff et al., 2010). However, to further increase the understanding of this complex behavior, the interactions of the components involved in the network have to be investigated. Recently, several approaches were developed to quantify the global behavior of the whole brain network. From a theoretical point of view, whole brain dynamic is determined by several factors: (1) the local dynamics of certain brain areas, (2) the static interactions of these brain areas, (3) dynamic modulation of the interaction between brain areas, and (4) input to the system. With respect to point 2 and 3, it is useful to clearly separate the concept of anatomical and functional connectivity (Aertsen and Preissl, 1991). We are mainly interested in functional connectivity, describing the dynamical interactions of the system. Taken together, points 1–3 determine the dynamics at rest, which lead under normal circumstances to a stable dynamics of the system. In the brain, spontaneous activity at rest is characterized by activity in certain frequency ranges generated in specific brain areas and networks, e.g., alpha activity in thalamic-cortical loops. Any input to the system has to be regarded as a disturbance of a stable dynamical state. The input could be generated by simple and complex stimuli or by modulation of intrinsic constituents, e.g., neuropeptide level, inactivation, or activation of certain brain areas. It has to be noted that the investigation of global dynamical properties can only be a first step for further investigations of specific changes in the network.
Functionally, two of the most important features of any neural network are oscillations (repetitive variation of some part of network) and synchronization (temporally precise interaction of neuronal activities over short and long distances). Spontaneous brain activity is characterized by the presence of more or less regular oscillations in various frequency bands (delta 1–4 Hz, theta 4–8 Hz, alpha 8–12 Hz, beta 12–30 HZ, gamma >30 Hz). Power and/or phase synchronization is the main process for information exchange between spatially separated areas (Schnitzler and Gross, 2005), which seems to be altered in different neurological disorders, like Alzheimer disease or schizophrenia (Uhlhaas et al., 2008; Stam et al., 2009) and even in type 1 diabetes (van Duinkerken et al., 2009) and obesity (Olde Dubbelink et al., 2008).
Synchronization between different brain areas can be measured by correlation, coherence, or similar measures like synchronization likelihood (SL), which is a measure of functional connectivity estimating both linear and non-linear interdependencies (Stam et al., 2002). By means of SL, a loss of functional interaction between brain regions was shown in Alzheimer patients (Stam et al., 2009). However, these measures are not well suited to characterize large scale systems because they are determined for two data points, independent of whether the activity is at a sensor or voxel level. For instance, the recording of 100 sensors leads to a synchronization matrix of 100 × 100. To overcome this problem of high dimensionality, concepts from graph theory can be applied to reduce the dimensionality of the measurement space (Stam, 2004; Bassett and Bullmore, 2006; Stam and Reijneveld, 2007; Stam et al., 2009).
Brain-imaging techniques (MEG, EEG, fMRI, NIRS, and so on) allow the measurement of synchronization processes at different spatial and temporal scales. Magnetoencephalography (MEG) detects the magnetic fields generated by electrical activity in the brain at a high temporal resolution allowing recordings with millisecond resolution. For synchronization analysis, the main advantage of MEG is the reference independent measurement. In contrast, EEG always requires a reference level, which can introduce spurious synchronization (Guevara et al., 2005).
So far several studies demonstrated a correlation between the resting state network dynamics and obesity. Ochner et al. (2009) reported an increased left-sided alpha activation in the prefrontal cortex in obese subjects. Olde Dubbelink et al. (2008) found an increased resting state functional connectivity in severe obese adolescents. These results indicate that obesity may have a major impact on human brain function. The observed differences can be explained by changes in motivational pathways (Gautier et al., 2000, 2001), increase in white matter volume in obese subjects (Haltia et al., 2007) or altered metabolic processes like hyperinsulinemia (Tschritter et al., 2006, 2009a,b).
As mentioned above, modulation of the input is an important step for understanding network dynamics. Insulin is one such prime candidate, as it acutely responds to food intake with a profound and transient increase, down regulating appetite, and terminating food intake (Unger et al., 1991). Additionally, insulin receptors are widely expressed in the brain, especially in the hypothalamus, olfactory bulb, cerebellum, and cortex (Unger et al., 1991). Intranasally administrated insulin raises insulin concentration in the cerebrospinal fluid without relevant absorption to the systemic blood circulation by entering the brain via the olfactory nerve (Illum, 2000; Born et al., 2002). At the behavioral level, it was shown that intranasally administered insulin results in a reduction of body fat selectively in lean men (Hallschmid et al., 2004). In recent studies, we were able to show that obese subjects exhibit central insulin resistance, which leads to specific neuronal changes (Tschritter et al., 2006, 2009a,b; Guthoff et al., 2010). Therefore, we decided to mimic a hormonal food-related signal to the central nervous system, without further sensory input, by administering intranasal insulin.
In this study, we applied whole-head MEG to determine the reliability of resting state dynamical parameters, compare these parameters in lean and obese subjects and assess the effect of intranasally applied insulin on the resting state network in lean and obese subjects. We hypothesized that functional connectivity would be modulated by insulin in a BMI dependent manner.
Research Design and Methods
Study Population
Ten lean (BMI 21 ± 0.4 kg/m2, range 18–24) and 10 overweight and obese (BMI 29 ± 0.6 kg/m2, range 26–32) subjects were recruited for the study. The overweight and obese subjects collectively will be referred to as ‘‘obese.” Subjects did not suffer from any metabolic or neurological diseases. Volunteers with diabetes mellitus or with a family history of diabetes were excluded at screening, as well as those who were treated for a chronic disease or taking any kind of medication. A routine blood analysis was determined to detect any so far unknown metabolic or organic diseases. All subjects were normal sighted or had corrected-to-normal vision. The protocol was approved by the local Ethics Committee and informed written consent was obtained from all subjects. The anthropometric characteristics of the subjects are shown in Table 1.
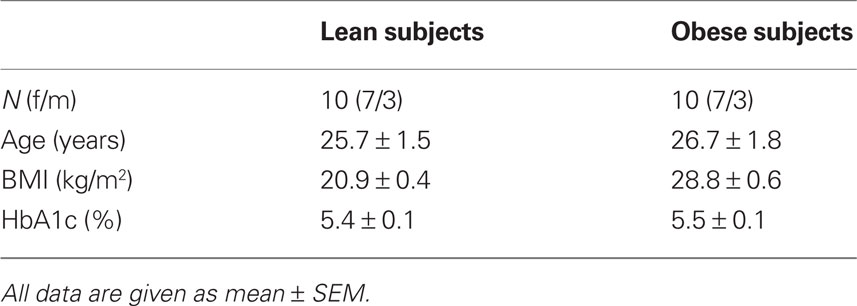
Table 1. Subject characteristics.
Study Protocol
All subjects participated in two conditions, insulin and placebo, on two different days in randomized order with a time-lag of 5–9 days. The subjects were blinded to the order of the conditions. After an overnight fast of 12 h, the experiment started at 8:00 am with basal blood sampling and basal MEG measurements. Then, insulin or placebo was administered intranasally as described below. After 30 min (when the concentrations in the cerebrospinal fluid reaches it peak level (Born et al., 2002), the second MEG measurement was performed. Blood samples were taken every 30 min to control for plasma glucose, insulin, and C-peptide levels.
Nasal Spray Administration
The insulin and placebo were delivered in nasal sprays, as previously described (Benedict et al., 2004). Each puff consisted of 0.1 ml solution containing 40 IU insulin (400 IU/ml; Insulin Actrapid; Novo Nordisk. Mainz, Germany) or 0.1 ml vehicle (HOE 31 dilution buffer for H-Insulin; Aventis Pharma, Bad Soden, Germany). Each subject received four doses of 0.1 ml insulin or placebo spray within 5 min. Two doses were applied in the left and two in the right nostril resulting in a total insulin dose of 160 IU on the insulin condition day.
Blood Sampling and Analysis
Plasma glucose levels were determined using the glucose-oxidase method (YSI, Yellow Springs Instruments, Yellow Springs, OH, USA). Plasma insulin levels were measured by a microparticle enzyme immunoassay (Abbott Laboratories, Tokyo, Japan).
MEG Data Acquisition and Processing
Magnetoencephalography recordings were obtained using a whole-head MEG system (VSM, Medtech, Vancouver, Canada, 275 primary channels) for 3 min during a resting state condition. Subjects were instructed not to focus their thoughts on anything in particular and to keep their eyes closed. We conducted a detailed functional connectivity analysis by using SL combined with graph theory. First, the data was down sampled from 585 to the 292 Hz and then four artifact free epochs (eye movement, muscular activity) of 13 s each (4,096 samples) were carefully selected by visual inspection. Epochs were band-pass filtered for the commonly used frequency bands: delta (0.5–4 Hz), theta (4–8 Hz), alpha (8–12 Hz), beta (12–30 Hz), and gamma (30–45 Hz). All further analyses were performed for these bands separately. SL was used as a measure of statistical interdependence between the MEG time series and was calculated for each combination of the 254 MEG channels. The original set of 275 channels was reduced to 254, which is the maximum number of channels which could be processed by the program, by excluding 21 channels located at the edge of the temporal and frontal cortex. First, we decided to exclude border channels to keep the homogeneous sensor spacing. Second, channels that were excluded are usually most affected by increased noise due to muscular artifacts. Third, due to the shape of the helmet of the MEG system the frontal and temporal areas are still completely covered by the remaining channels. SL is based on the concept of general synchronization and was computed with DIGEEGXP software developed at the Department of Neurophysiology of the VU University Medical Center, Amsterdam. The matrices, including all interdependencies between channels, were converted to weighted graphs. In weighted graph analysis the connection between two vertices is characterized by a weight describing the importance or strength of this connection. The corresponding weights are the SL values between the signals recorded at different sites. This matrix is further analyzed and key characteristics describing the overall network organization are computed using all connection. The used parameters are clustering coefficient C and characteristic path length L (Watts and Strogatz, 1998). The clustering coefficient C is given by the ratio between the number of connections between the direct neighbors of a node and the total number of possible connections between these neighbors. This parameter describes local interconnectedness within a network. The path length L of a network gives the average number of connections to connect from one network node to another. Generally this parameter describes global interconnectedness and provides information about the level of global communication efficiency of a network. By definition, both values of C and L depend on the weights and the network structure but also on the size of the network. In order to obtain measures independent of network size, both of these values are normalized. The normalization is performed by calculation of mean C and L for 50 surrogate networks, generated by random shuffling of the weights in the network. The path length and cluster coefficient are then defined as ratio between path length and cluster coefficient from original and surrogate network. Recent work of Deuker et al. (2009) indicated a low reliability of the results from graph analysis on resting state networks. As our subjects were recorded four times, including two baseline measurements, we were able to evaluate reliability of the calculated parameters in our study by comparing the baseline measurements of the two measuring days. For our study we only report results of graph analytic measures with statistically significant reliability.
Statistical Analysis
All values are given as unadjusted mean ± SEM. Non-normally distributed metabolic parameters were log transformed to approximate normal distribution prior to statistical analysis. MANOVA analysis was used to test for significant differences in metabolic parameters between insulin and placebo experiments with the software package JMP 7.0 (SAS Institute, Cary, NC, USA). The reliability of the graph analysis results was quantified by intra class correlation between the two different baseline measurements (insulin 1 and placebo 1) with SPSS 18 (SPSS Inc., IL; USA). Group differences were tested for the baseline measurements by a two-tailed t-test. For exploratory analysis we regarded p < 0.05 as significant and did not take into account correction for multiple comparisons for the different frequency bands. Regression analysis was used to assess the correlation between the insulin effect and BMI. The insulin effect was determined by the difference between either clustering or path length coefficient after insulin application and basal measurement corrected for the placebo measurement [(insulin 2 − insulin 1) − (placebo 2 − placebo 1)]. Extreme outlier (more than 3* interquartile range from the rest of the scores) were removed from further analysis (Barnett and Lewis, 1994).
Results
None of the systemic metabolic parameters showed statistical significant change after insulin administration in comparison to the placebo administration (Table 2).
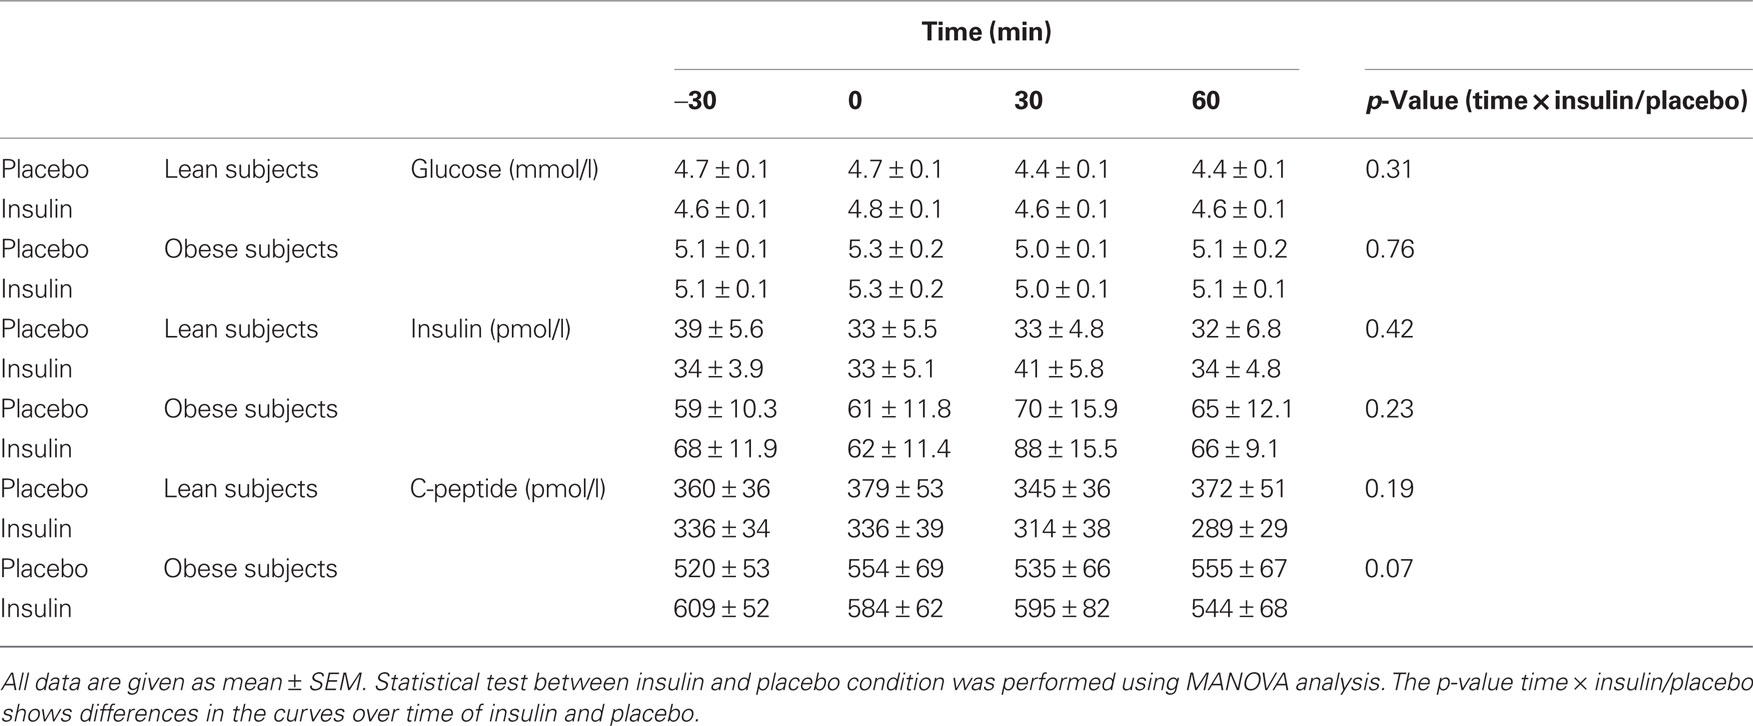
Table 2. Metabolic parameters during MEG experiment (insulin or placebo spray was given at time = 0 min).
Reliability Analysis
The intra class correlation for cluster coefficient and path length reached significance for all frequency bands with the exception of the delta band (Figure 1). Based on this result, we excluded the delta band from the following analysis.
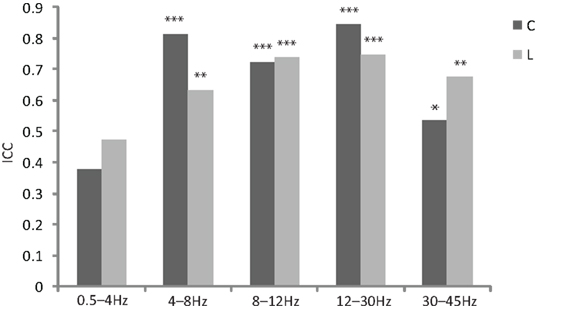
Figure 1. Bar plot of reliability measurements by inter intra class correlation (ICC, calculated for mixed model, type consistency and averaged measures) for different frequency ranges for normalized cluster coefficient (C) and normalized path length (L, *p < 0. 05, **p < 0.01, ***p < 0.001).
Graph Analysis for Baseline Measurement
There was no significant difference between lean and obese subjects in any dynamical parameter for all frequency bands (Figure 2).
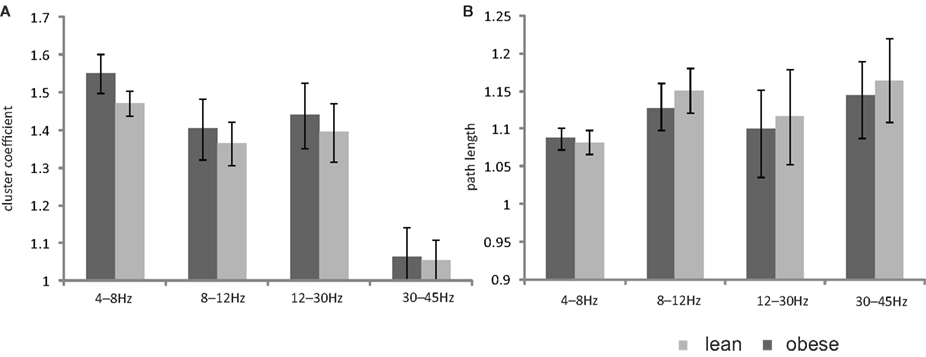
Figure 2. Bar plot showing the mean values of (A) cluster coefficient (B) path length of the two baseline measurements for the lean and obese group. All data are given as mean ± SEM, *p < 0.05.
Insulin Induced Modulation
The insulin induced change of path length in the theta band (4–8 Hz) was statistically different between the lean and obese group (p = 0.05; Figure 3) and showed a significant positive linear correlation with BMI (p = 0.005, r2 = 0.35; Figure 4). One of the obese subjects was identified as an extreme outlier and was therefore removed from this analysis. We did not find statistically significant differences between groups or correlation between insulin induced modulation of path length and BMI for other frequency bands. The insulin induced modulation of cluster coefficient also did not show a significant difference between groups or correlation with BMI for any frequency band.
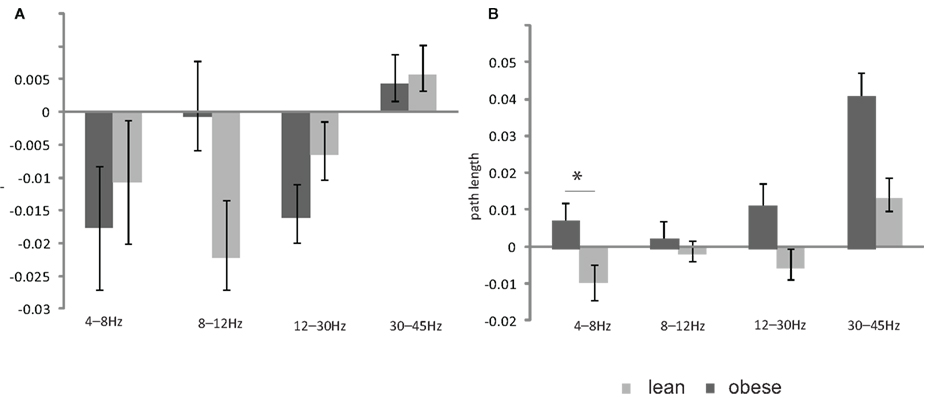
Figure 3. Bar plot showing the (A) insulin induced change in the cluster coefficient in the lean and obese group (B) insulin induced change in the path length in the lean and obese group. All data are given as mean ± SEM, *p < 0.05.
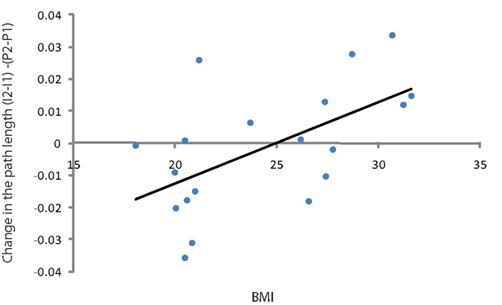
Figure 4. Scatter plot showing the correlation between BMI and difference between the coefficient of path length in theta band (difference between basal measurement and after administration of the insulin corrected for the placebo measurement) for all subjects.
Discussion
In the current study we could show that dynamical network parameters for brain activity are reliable and appropriate for further investigation of changes in global network dynamics. We did not find differences in the global brain network during resting state between obese and lean subject for the baseline measurements. Olde Dubbelink et al. (2008) reported differences in resting state network, however the investigated population included only severely obese with a mean BMI of 38.6 kg/m2, which is substantially different to the mean BMI of 28.66 kg/m2 in our study population. This condition may have already affected the vascular system or gray–white matter ratio and led to the observed results which are similar to the findings in neurological disorders, like Alzheimer disease or schizophrenia (Uhlhaas et al., 2008; Stam et al., 2009).
However we found that insulin modifies the global brain network during resting state by changing the characteristic path length. Furthermore, our results show that this change is positively correlated with BMI. The characteristic path length is a measure for the global communication efficiency, characterizing the connection scheme of the network. Therefore, the decrease of path length in lean subjects could be interpreted as an increase in global communication efficiency. What is a possible explanation for this effect? Peripheral insulin level raises after food intake and crosses the blood–brain barrier acting as an anorexic signal reducing food intake (Porte et al., 1998; Schwartz et al., 2000). Hence the change in global efficiency observed in lean subjects is probably connected to the increased signaling between different regions involved in satiation and homeostatic control. Since intranasal insulin did not alter peripheral glucose levels, the effect is unlikely to be generated by peripheral metabolic changes. In contrast the increase in obese subjects could be interpreted as a decrease in global communication efficiency. In a previous study we showed that obesity is associated with cerebral insulin resistance (Tschritter et al., 2006). During a hyperinsulinemic euglycemic clamp, the spontaneous activity in the theta band and stimulated (mismatch negativity) cortical activity was increased in lean subjects compared to obese subjects. In addition, an increase in insulin concentration in the brain by an insulin analog triggers a relative decrease in food consumption (Hallschmid et al., 2010) which is another argument that insulin action in the brain is important for body weight regulation. Our current and previous findings therefore support our hypothesis that a central insulin resistance is present in obese humans. Since we used intranasal insulin, the present results provide further evidence for a direct effect of insulin on neuronal activity, and that cerebral insulin resistance in obese subjects is not due to disturbances in the blood–brain barrier. Based on this we can hypothesize that changes in cerebral activity can be a driving mechanism in sustaining positive energy balance in eating behavior and further increase in body weight.
However insulin itself is not only involved in food regulation but also affects cognitive processes like memory. In this respect we can not claim that the reported insulin effect only affects food regulation. In addition we can not disentangle contributions of cortical and subcortical areas, e.g., hypothalamus to the observed effect. Further studies are needed to evaluate the specific behavioral effect of this insulin resistance.
In contrast to Deuker et al. (2009) we showed reliability of the network measures at least for frequencies above 4 Hz. This difference may be related to the fact that Deuker et al. (2009) used an open eye condition, which is not optimal for resting state networks. In conclusion, we demonstrated in this MEG study that obese subjects have an altered cerebral insulin response compared to lean subjects. The decrease in path length, generated by insulin, is a possible sign for global efficiency increase of the resting state network and may be related to increased signaling between different regions involved in satiation and homeostatic control.
Conflict of Interest Statement
The authors declare that the research was conducted in the absence of any commercial or financial relationships that could be construed as a potential conflict of interest.
Acknowledgment
We gratefully acknowledge the help of Anna Bury, Andreas Vosseler, Heike Luz, Ellen Kollmar, and Barbara Horrer, who helped with the measurements. This study was supported by the Deutsche Forschungsgemeinschaft (KFO 114 Fr1561/3-3), by the “Kompetenznetz Adipositas” (Competence Network for Adiposity) (FKZ: 01GI0837 and 01GI0849) funded by the German Federal Ministry of Education and Research (BMBF and the German Center for Diabetes Research (DZD e.V.).
References
Aertsen, A., and Preissl, H. (1991). “Dynamics of activity and connectivity in physiological neuronal networks,” in Nonlinear Dynamics and Neuronal Networks, ed. H. Schuster (Weinheim: VCH), 281–302.
Benedict, C., Hallschmid, M., Hatke, A., Schultes, B., Fehm, H. L., Born, J., and Kern, W. (2004). Intranasal insulin improves memory in humans. Psychoneuroendocrinology 29, 1326–1334.
Berthoud, H. R. (2006). Homeostatic and non-homeostatic pathways involved in the control of food intake and energy balance. Obesity (Silver Spring) 14(Suppl. 5), 197S–200S.
Born, J., Lange, T., Kern, W., McGregor, G. P., Bickel, U., and Fehm, H. L. (2002). Sniffing neuropeptides: a transnasal approach to the human brain. Nat. Neurosci. 5, 514–516.
Del Parigi, A., Chen, K., Salbe, A. D., Reiman, E. M., and Tataranni, P. A. (2005). Sensory experience of food and obesity: a positron emission tomography study of the brain regions affected by tasting a liquid meal after a prolonged fast. Neuroimage 24, 436–443.
Del Parigi, A., Gautier, J. F., Chen, K., Salbe, A. D., Ravussin, E., Reiman, E., and Tataranni, P. A. (2002). Neuroimaging and obesity: mapping the brain responses to hunger and satiation in humans using positron emission tomography. Ann. N. Y. Acad. Sci. 967, 389–397.
Deuker, L., Bullmore, E. T., Smith, M., Christensen, S., Nathan, P. J., Rockstroh, B., and Bassett, D. S. (2009). Reproducibility of graph metrics of human brain functional networks. Neuroimage 47, 1460–1468.
Erlanson-Albertsson, C. (2005). How palatable food disrupts appetite regulation. Basic Clin. Pharmacol. Toxicol. 97, 61–73.
Finlayson, G., King, N., and Blundell, J. E. (2007). Is it possible to dissociate “liking” and “wanting” for foods in humans? A novel experimental procedure. Physiol. Behav. 90, 36–42.
Gautier, J. F., Chen, K., Salbe, A. D., Bandy, D., Pratley, R. E., Heiman, M., Ravussin, E., Reiman, E. M., and Tataranni, P. A. (2000). Differential brain responses to satiation in obese and lean men. Diabetes 49, 838–846.
Gautier, J. F., Del Parigi, A., Chen, K., Salbe, A. D., Bandy, D., Pratley, R. E., Ravussin, E., Reiman, E. M., and Tataranni, P. A. (2001). Effect of satiation on brain activity in obese and lean women. Obes. Res. 9, 676–684.
Guevara, R., Velazquez, J. L., Nenadovic, V., Wennberg, R., Senjanovic, G., and Dominguez, L. G. (2005). Phase synchronization measurements using electroencephalographic recordings: what can we really say about neuronal synchrony? Neuroinformatics 3, 301–314.
Guthoff, M., Grichisch, Y., Canova, C., Tschritter, O., Veit, R., Hallschmid, M., Haring, H. U., Preissl, H., Hennige, A. M., and Fritsche, A. (2010). Insulin modulates food-related activity in the central nervous system. J. Clin. Endocrinol. Metab. 95, 748–755.
Hallschmid, M., Benedict, C., Schultes, B., Fehm, H. L., Born, J., and Kern, W. (2004). Intranasal insulin reduces body fat in men but not in women. Diabetes 53, 3024–3029.
Hallschmid, M., Jauch-Chara, K., Korn, O., Molle, M., Rasch, B., Born, J., Schultes, B., and Kern, W. (2010). Euglycemic infusion of insulin detemir compared with human insulin appears to increase direct current brain potential response and reduces food intake while inducing similar systemic effects. Diabetes 59, 1101–1107.
Haltia, L. T., Viljanen, A., Parkkola, R., Kemppainen, N., Rinne, J. O., Nuutila, P., and Kaasinen, V. (2007). Brain white matter expansion in human obesity and the recovering effect of dieting. J. Clin. Endocrinol. Metab. 92, 3278–3284.
Illum, L. (2000). Transport of drugs from the nasal cavity to the central nervous system. Eur. J. Pharm. Sci. 11, 1–18.
Ochner, C. N., Green, D., van Steenburgh, J. J., Kounios, J., and Lowe, M. R. (2009). Asymmetric prefrontal cortex activation in relation to markers of overeating in obese humans. Appetite 53, 44–49.
Olde Dubbelink, K. T., Felius, A., Verbunt, J. P., van Dijk, B. W., Berendse, H. W., Stam, C. J., and Delemarre-van de Waal, H. A. (2008). Increased resting-state functional connectivity in obese adolescents; a magnetoencephalographic pilot study. PLoS ONE 3, e2827. doi: 10.1371/journal.pone.0002827
Porte, D. Jr., Seeley, R. J., Woods, S. C., Baskin, D. G., Figlewicz, D. P., and Schwartz, M. W. (1998). Obesity, diabetes and the central nervous system. Diabetologia 41, 863–881.
Schnitzler, A., and Gross, J. (2005). Normal and pathological oscillatory communication in the brain. Nat. Rev. Neurosci. 6, 285–296.
Schwartz, M. W., Woods, S. C., Porte, D. Jr., Seeley, R. J., and Baskin, D. G. (2000). Central nervous system control of food intake. Nature 404, 661–671.
Stam, C. J. (2004). Functional connectivity patterns of human magnetoencephalographic recordings: a “small-world” network? Neurosci. Lett. 355, 25–28.
Stam, C. J., de Haan, W. Daffertshofer, A., Jones, B. F., Manshanden, I., van Cappellen van Walsum, A. M., Montez, T., Verbunt, J. P., de Munck, J. C., van Dijk, B. W., Berendse, H. W., and Scheltens, P. (2009). Graph theoretical analysis of magnetoencephalographic functional connectivity in Alzheimer’s disease. Brain 132(Pt 1), 213–224.
Stam, C. J., and Reijneveld, J. C. (2007). Graph theoretical analysis of complex networks in the brain. Nonlinear Biomed. Phys. 1, 3.
Stam, C. J., van Cappellen van Walsum, A. M., Pijnenburg, Y. A., Berendse, H. W., de Munck, J. C., Scheltens, P., and van Dijk, B. W. (2002). Generalized synchronization of MEG recordings in Alzheimer’s disease: evidence for involvement of the gamma band. J. Clin. Neurophysiol. 19, 562–574.
Stoeckel, L. E., Weller, R. E., Cook, E. W. 3rd, Twieg, D. B., Knowlton, R. C., and Cox, J. E. (2008). Widespread reward-system activation in obese women in response to pictures of high-calorie foods. Neuroimage 41, 636–647.
Tschritter, O., Hennige, A. M., Preissl, H., Grichisch, Y., Kirchhoff, K., Kantartzis, K., Machicao, F., Fritsche, A., and Haring, H. U. (2009a). Insulin effects on beta and theta activity in the human brain are differentially affected by ageing. Diabetologia 52, 169–171.
Tschritter, O., Preissl, H., Hennige, A. M., Sartorius, T., Grichisch, Y., Stefan, N., Guthoff, M., Dusing, S., Machann, J., Schleicher, E., Cegan, A., Birbaumer, N., Fritsche, A., and Haring, H. U. (2009b). The insulin effect on cerebrocortical theta activity is associated with serum concentrations of saturated nonesterified fatty acids. J. Clin. Endocrinol. Metab. 94, 4600–4607.
Tschritter, O., Preissl, H., Hennige, A. M., Stumvoll, M., Porubska, K., Frost, R., Marx, H., Klosel, B., Lutzenberger, W., Birbaumer, N., Haring, H. U., and Fritsche, A. (2006). The cerebrocortical response to hyperinsulinemia is reduced in overweight humans: a magnetoencephalographic study. Proc. Natl. Acad. Sci. U.S.A. 103, 12103–12108.
Uhlhaas, P. J., Haenschel, C., Nikolic, D., and Singer, W. (2008). The role of oscillations and synchrony in cortical networks and their putative relevance for the pathophysiology of schizophrenia. Schizophr. Bull. 34, 927–943.
Unger, J. W., Livingston, J. N., and Moss, A. M. (1991). Insulin receptors in the central nervous system: localization, signaling mechanisms and functional aspects. Prog. Neurobiol. 36, 343–362.
van Duinkerken, E., Klein, M., Schoonenboom, N. S., Hoogma, R. P., Moll, A. C., Snoek, F. J., Stam, C. J., and Diamant, M. (2009). Functional brain connectivity and neurocognitive functioning in patients with long-standing type 1 diabetes with and without microvascular complications: a magnetoencephalography study. Diabetes 58, 2335–2343.
Keywords: resting state, magnetoencephalography, insulin, obesity, brain dynamics
Citation: Stingl KT, Kullmann S, Guthoff M, Heni M, Fritsche A and Preissl H (2010) Insulin modulation of magnetoencephalographic resting state dynamics in lean and obese subjects. Front. Syst. Neurosci. 4:157. doi: 10.3389/fnsys.2010.00157
Received: 28 September 2010;
Accepted: 05 December 2010;
Published online: 20 December 2010.
Edited by:
Raphael Pinaud, University of Oklahoma Health Sciences Center, USAReviewed by:
Fernando Maestú, Complutense University, SpainChun-Chuan Chen, National Central University, Taiwan
Copyright: © 2010 Stingl, Kullmann, Guthoff, Heni, Fritsche and Preissl. This is an open-access article subject to an exclusive license agreement between the authors and the Frontiers Research Foundation, which permits unrestricted use, distribution, and reproduction in any medium, provided the original authors and source are credited.
*Correspondence: Hubert Preissl, Department of Obstetrics and Gynecology, University of Arkansas for Medical Sciences, 4301 W. Markham Street, Little Rock, AR 72205, USA. e-mail: hubert.preissl@uni-tuebingen de