Dynamic stereotypic responses of basal ganglia neurons to subthalamic nucleus high-frequency stimulation in the parkinsonian primate
- 1 The Leslie and Susan Gonda Brain Research Center, Bar-Ilan University, Ramat-Gan, Israel
- 2 The Goodman Faculty of Life Sciences, Bar-Ilan University, Ramat-Gan, Israel
Deep brain stimulation (DBS) in the subthalamic nucleus (STN) is a well-established therapy for patients with severe Parkinson’s disease (PD); however, its mechanism of action is still unclear. In this study we explored static and dynamic activation patterns in the basal ganglia (BG) during high-frequency macro-stimulation of the STN. Extracellular multi-electrode recordings were performed in primates rendered parkinsonian using 1-methyl-4-phenyl-1,2,3,6-tetrahydropyridine. Recordings were preformed simultaneously in the STN and the globus pallidus externus and internus. Single units were recorded preceding and during the stimulation. During the stimulation, STN mean firing rate dropped significantly, while pallidal mean firing rates did not change significantly. The vast majority of neurons across all three nuclei displayed stimulation driven modulations, which were stereotypic within each nucleus but differed across nuclei. The predominant response pattern of STN neurons was somatic inhibition. However, most pallidal neurons demonstrated synaptic activation patterns. A minority of neurons across all nuclei displayed axonal activation. Temporal dynamics were observed in the response to stimulation over the first 10 seconds in the STN and over the first 30 seconds in the pallidum. In both pallidal segments, the synaptic activation response patterns underwent delay and decay of the magnitude of the peak response due to short term synaptic depression. We suggest that during STN macro-stimulation the STN goes through a functional ablation as its upper bound on information transmission drops significantly. This notion is further supported by the evident dissociation between the stimulation driven pre-synaptic STN somatic inhibition and the post-synaptic axonal activation of its downstream targets. Thus, BG output maintains its firing rate while losing the deleterious effect of the STN. This may be a part of the mechanism leading to the beneficial effect of DBS in PD.
Introduction
The basal ganglia (BG) are a group of interconnected subcortical nuclei that are involved in motor, limbic, and associative tasks (Alexander et al., 1986). Parkinson’s disease (PD) is characterized by a degeneration of midbrain dopaminergic neurons (Bernheimer et al., 1973) that project to multiple targets in the BG, primarily the striatum (Anden et al., 1964). High-frequency deep brain stimulation (DBS) of some of the BG nuclei such as the subthalamic nucleus (STN) or the globus pallidus internus (GPi) has been found to ameliorate motor symptoms in severe cases of PD in humans (Siegfried and Lippitz, 1994; Limousin et al., 1995) as well as in primates rendered parkinsonian using 1-methyl-4-phenyl-1,2,3,6-tetrahydropyridine (MPTP; Benazzouz et al., 1993).
Modulation of the neuronal activity in the cortico-BG loop during high-frequency DBS has been studied for more than a decade (Benazzouz et al., 1993, 2000; Hashimoto et al., 2003; Bar-Gad et al., 2004; Brown et al., 2004; Meissner et al., 2005; Kuhn et al., 2006; Dorval et al., 2008; McCairn and Turner, 2009), but the mechanism underlying the ameliorating effect is still unclear. Studies of the stimulated nucleus have yielded contradictory evidence: most direct studies demonstrate an inhibition during STN (Benazzouz et al., 2000; Tai et al., 2003; Filali et al., 2004; Welter et al., 2004) and GPi (Dostrovsky et al., 2000; Wu et al., 2001; Montgomery Jr., 2006) stimulation. Studies in slices report similar observations (Beurrier et al., 2001; Magarinos-Ascone et al., 2002). Notably, few human (Carlson et al., 2010) and in vitro (Garcia et al., 2003) studies point out that the STN is not silenced during the stimulation. Studies of brain areas downstream to the STN (Hashimoto et al., 2003; Maurice et al., 2003) and GPi (Anderson et al., 2003) reveal activation patterns which are inconsistent with the somatic silencing in the stimulated nucleus.
Analysis of globus pallidus (GP) discharge patterns during STN and GPi stimulations has revealed stereotypic discharge patterns synchronized to the stimulation pulses that are thought to be driven synaptically by the stimulated nucleus (Hashimoto et al., 2003; Bar-Gad et al., 2004; Kita et al., 2005; Stefani et al., 2005; Erez et al., 2009; McCairn and Turner, 2009). These synaptic activation patterns displayed dynamics over the stimulation period which led to the suggestion of a short term reversible synaptic depression (Erez et al., 2009; Prescott et al., 2009). In vitro observations are consistent with this notion and have described a short synaptic facilitation followed by a longer depression (Hanson and Jaeger, 2002; Rav-Acha et al., 2005).
Despite the vast and elaborated experimental work, as well as modeling studies (McIntyre et al., 2004a; Rubin and Terman, 2004; Leblois et al., 2006), a single coherent theory consistent with all the current observations has yet to be formulated. Modeling studies have revealed a clear difference between somatic and axonal activity in the stimulated area resulting in the dissociation of the stimulated nucleus from its targets. This principle was demonstrated first on thalamocortical cells undergoing suprathreshold DBS which caused suppression of intrinsic firing in the soma, but generated efferent output at the stimulus frequency in the axon (McIntyre et al., 2004a). This study was followed by an additional modeling work which predicted axonal activation of STN neurons and GPi fibers during STN DBS (Miocinovic et al., 2006).
In the current study we examined the single neuron activation patterns throughout the BG and their dynamics, during the application of STN high-frequency macro-stimulation to behaving primates treated with MPTP. In addition, we examined the dissociation hypothesis stating that the stimulated STN goes through a somatic inhibition while its downstream pallidal targets are activated by STN efferents. To that end, multi-electrode extracellular recordings were performed in the STN and GP during high-frequency stimulation of the STN.
Materials and Methods
Animals
Two cynomolgus (Macaca fascicularis) male monkeys were used (N: 3.8 kg; P: 4.5 kg). The monkeys’ water and food consumption and weight were followed daily, and their health was monitored by a veterinarian. All procedures were in accordance with the National Institutes of Health Guide for the Care and Use of Laboratory Animals and Bar-Ilan University Guidelines for the Use and Care of Laboratory Animals in Research and were approved and supervised by the Institutional Animal Care and Use Committee.
Surgery and Induction of Parkinsonism
The monkeys underwent a surgical procedure to attach two 27 mm square Cilux recording chambers (Alpha Omega Engineering, Nazareth, Israel) to the skull allowing bilateral access to the BG. In this study we used recordings only from the chamber over the left hemisphere in monkey N and the chamber over the right hemisphere in monkey P. The chambers were tilted at 35° for N and 40° for P in the sagittal plane, with their center targeted at stereotaxic coordinates A4-L8-H1 (Szabo and Cowan, 1984) of the left hemisphere for monkey N, and A5-L6-H2 of the right hemisphere for monkey P. The surgical procedure was performed under general anesthesia induced by intramuscular ketamine–HCl (10 mg/kg) and Domitor (0.1 mg/kg) and maintained by isoflurane and N2O ventilation. Parkinsonism was induced by five intramuscular injections of 0.4 mg/kg MPTP–HCl (Sigma) neurotoxin. MPTP injections were given under intramuscular ketamine–HCl (10 mg/kg) anesthesia and over a period of 4 days, after which the monkeys developed severe and stable parkinsonism. The monkeys’ parkinsonian state was assessed daily using the Schneider scale (Schneider et al., 2003) and was severe and stable throughout the recording period [monkey N: 43.9 ± 3.8, monkey P: 44.0 ± 2.7 mean ± SD, on a scale of 0 (asymptomatic) to 53 (maximal symptoms)]. The symptoms included all the major parkinsonian symptoms except for rest tremor, which is typically not exhibited by this species. Additionally, both monkeys had dystonia, primarily in the lower limbs. Recordings were resumed 5 days following the last MPTP injection for both monkeys.
Recording and Stimulation
The monkeys were seated in a primate chair and their head was fixed during the recording sessions. Using a cylindrical guide, multiple glass-coated tungsten recording microelectrodes (impedance 0.2– 0.7 MΩ at 1 kHz) and one stimulation concentric macro-electrode (Narylene coated tungsten microelectrode inside a Narylene coated stainless steel cannula, impedance 2–3 KΩ at 1 kHz; We Sense, Nazareth, Israel) were advanced separately (EPS 4.10, Alpha–Omega Engineering) into the STN and GP. The two electrode towers allowed different trajectories to the GP (eight microelectrodes) and STN (three microelectrodes and one concentric electrode) with 10° between the towers. The distinction between the pallidal segments was determined online based on characteristics of neuronal activity, and the existence of border cells and white matter fibers between the two segments. All GPe neurons used in this study were high-frequency pausers. STN trajectories were performed through the internal capsule, until reaching the STN which was identified by large and highly oscillating background activity, and isolated single units with 20–30 spikes/s. Stimulation location within the STN relied both on recording STN activity with the concentric inner recording microelectrode and by leveling the concentric outer macro-contact to other recording electrodes. All stimulation locations were at least 0.5 mm ventral to the STN dorsal border. The electrode signal was continuously sampled at 40 kHz (Alphamap 10.10, Alpha–Omega Engineering), amplified (*1000) and wide bandpass filtered (2–8000 Hz four-pole Butterworth filter; MCP-Plus 4.10, Alpha–Omega Engineering). High-frequency monophasic cathodal constant voltage stimulation pulses (2 V, 60 μs, resulting maximal current ~1 mA) were delivered via the macro-electrode using an optically isolated stimulator (STG-2008, Multichannel Systems, Reutlingen, Germany). These Stimulating parameters were chosen as the ones usually used in human surgeries. The voltage was chosen to be below a voltage which produced motor contractions. The interval between consecutive pulses was 8 ms, leading to a stimulation frequency of 125 Hz. Recording sessions consisted of 60 s of baseline activity followed by ~125 s (15600 stimuli) of stimulation.
Histology
Following completion of the experiment, the animals were anesthetized using ketamine–HCl (10 mg/kg) and stereotactic marking micro-lesions (DC current, 60 μA for 30 s) were made. The animals were then deeply anesthetized using sodium pentobarbital (50 mg/kg) and transcardially perfused with 1 L of physiological saline, followed by 1 L of 4% paraformaldehyde. The whole brain was removed and buffered in graded sucrose solution 10–30% over 7 days. The brain was then frozen at −25°C and cut in the coronal plane using a cryostat (Leica Microsystems). Each section was digitized using a 10-MPixel digital camera and sections of interest were mounted onto glass slides and Nissl stained.
Data Preprocessing
The digitized continuous signal of each electrode was preprocessed to remove the stimulation pulse artifacts using the Stimulus Artifact Removal Graphical Environment – SARGE (Erez et al., 2010; Figure 1). Following artifact removal, the signal was off-line sorted (OFS-2.8.4, Plexon, Dallas, TX, USA) to generate one or more spike trains. The spike train quality and stability were assessed according to the following criteria: (1) P[inter-spike interval (ISI) shorter than 1 ms] <0.1%; (2) normalized signal-to-noise ratio (SNR) >4; (3) spike shape was not significantly altered throughout the session. The normalized SNR was defined as the ratio of the peak to trough amplitude of the mean spike shape to the standard deviation of the recorded signal. The spike shape stability was assessed by comparison of the mean spike shape in the early (pre-stimulation) part of the recording with the late part (during stimulation) of the recording and the verification that they appear in a single cluster during the off-line sorting. All further data analysis was performed using custom written code (MATLAB 2009A, Mathworks, Natick, MA, USA).
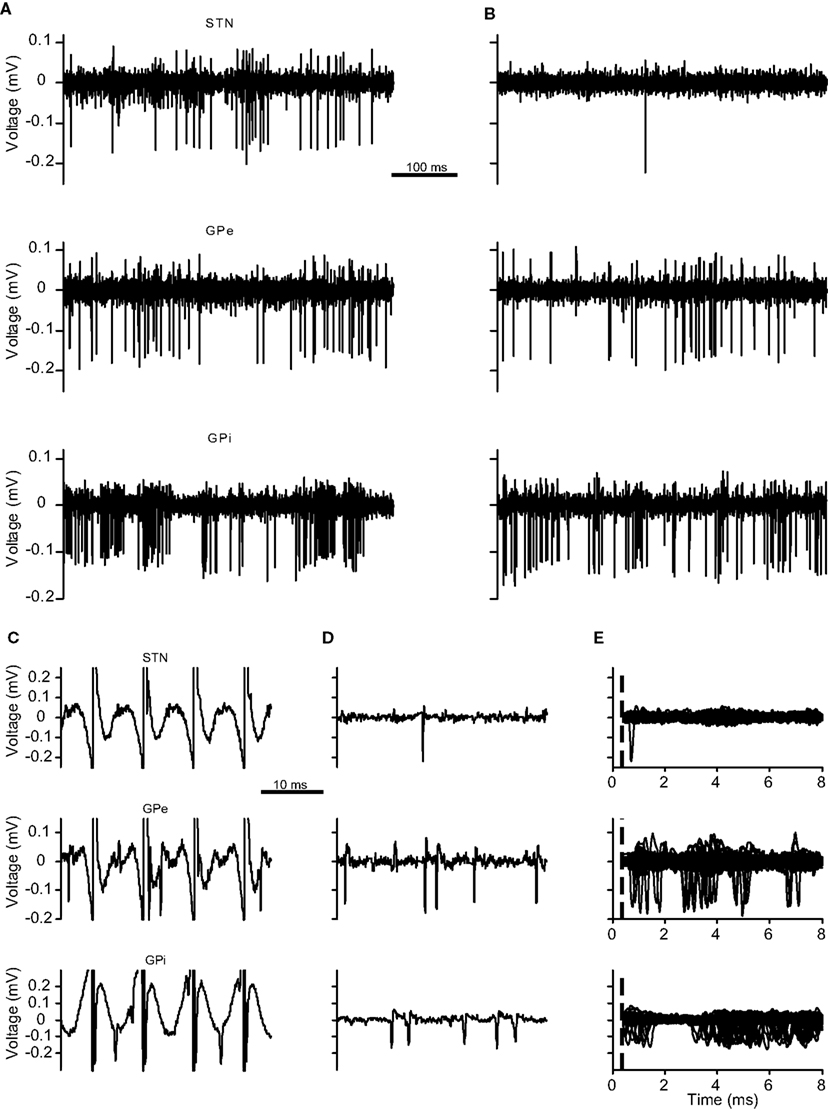
Figure 1. STN, GPe, and GPi recording traces. (A–E) The neuronal activity of recorded electrodes located in the (top) STN, (middle) GPe, and (bottom) GPi across different sessions. (A) Trace prior to the stimulation. (B) Trace during the stimulation period following stimulation artifact removal. (C,D) Short traces demonstrating artifact removal results. (C) Traces with stimulation artifacts. (D) Same traces following stimulation artifact removal. (E) Peri-stimulus trace of 100 consecutive stimulation pulses. The dotted line marks the end of the non-usable period (NP).
Firing Rate
Firing rate was calculated prior to and during the stimulation. The mean firing rate over the last 60 s preceding the stimulation was termed the “baseline rate.” The mean firing rate during the last 60 s of the stimulation was termed “during rate.” The calculation of firing rate during the stimulation included compensation for the stimulation period in which the spikes were not identifiable [termed non-usable period (NP)] due to the artifact of the electric pulse (Erez et al., 2010). If we denote the firing rate compensated for the NP as FRNP, for a neuron stimulated at a stimulation interval τi with a NP of τNP and the recorded firing rate of FRrec 
Response Type Classification
The rate normalized peri-stimulus time histogram (PSTHs) aligned to stimulation pulses (bin size 0.1 ms) were classified into one of the following groups:
1 Axonal activation: neurons undergoing axonal activation are characterized by a high probability to fire following the stimulation with a short and fixed latency (a very low jitter). We introduced an automated classification algorithm which is similar to the one used manually in previous studies (Kita and Kitai, 1991; Hashimoto et al., 2003). We defined the activation delay (τpeak) as the delay of the bin with the maximal firing rate (FRPeak) across the rate normalized PSTH. Let us define FRMean as the mean firing rate across the PSTH and FRThreshold = FRMean + 0.66 (FRPeak − FRMean). The jitter around τpeak was defined as the cumulative width of consecutive bins surrounding τpeak whose firing rate was higher than FRThreshold. A neuron’s probability to fire following a stimulation pulse was defined as the cumulative probability to fire over all jitter bins. A neuron was classified as undergoing axonal activation if: τpeak <2 ms (Kita and Kitai, 1991), jitter <0.5 ms (Iremonger et al., 2006), and its probability to fire following a stimulation pulse >0.1 (Iremonger et al., 2006).
2 Inhibition: Firing rate of neurons in this group dropped by more than 80% during the stimulation period relative to their baseline firing rate.
3 Synaptic activation: The PSTH of neurons undergoing synaptic activation displayed several typical patterns which were all characterized by a large variability in the FR and displayed a single, double, or even triple clear peaks at different but stereotypic times. On the other hand, neurons which did not respond to the stimulation were characterized by a stable FR relative to the stimulation. The coefficient of variation (CV) method detects these variations while taking into account the mean firing rate and is thus a natural candidate for classifying the neurons into synaptic activated and non-responding neurons.
Let us denote FRPSTH as the rate normalized PSTH. The rate coefficient of variation (CVRate) criterion was defined as  where
where  and
and  where FRPSTH(ti) is the firing rate of the i-th bin in the normalized PSTH. Neurons with CVRate >0.15 during the stimulation that did not display an axonal activation or an inhibitory response were classified as neurons undergoing synaptic activation.
4 No response: neurons which did not display any of the above response types.
Response Dynamics
Two partial PSTHs normalized to rate were generated for every neuron displaying a synaptic response. The early response PSTH was calculated over the first 30 s of stimulation whereas the late response PSTH was calculated over the last 30 s of stimulation. The peaks of the early and late PSTHs in the range of 2–7 ms were compared. Comparison included differences in the peak latency and maximal rate. The peak magnitude was defined as the difference between the peak rate and the PSTH mean firing rate. The peak jitter was defined as the width at the top 33% of the peak magnitude. Outliers (PSTHs with an unclear peak or multiple close peaks) were not included in this analysis.
Information Transfer
A neuron’s entropy is upper bounded by the entropy of the ISI distribution (Stevens and Zador, 1996)  where p(ISI) denotes the probability of the appearance of a specific ISI using bins of 0.1 ms. The upper limit on a neuron’s capability to transfer information is the entropy per ISI multiplied by the rate. The nuclei’s upper bound on information transfer was calculated by averaging over the neuronal upper bound of the nuclei population.
Results
Anatomy
Recordings were performed in the STN, GPe, and GPi. 70 neurons from the GPe, 49 neurons from the GPi and 36 neurons from the STN were recorded in 29 sessions. The neurons were distributed almost equally between the two primates (GPe N-44 P-26, GPi N-25 P-24, and STN N-19 P-17). The recording sites from both monkeys were overlaid on the postmortem anatomical reconstruction of the right hemisphere of monkey P (Figure 2).
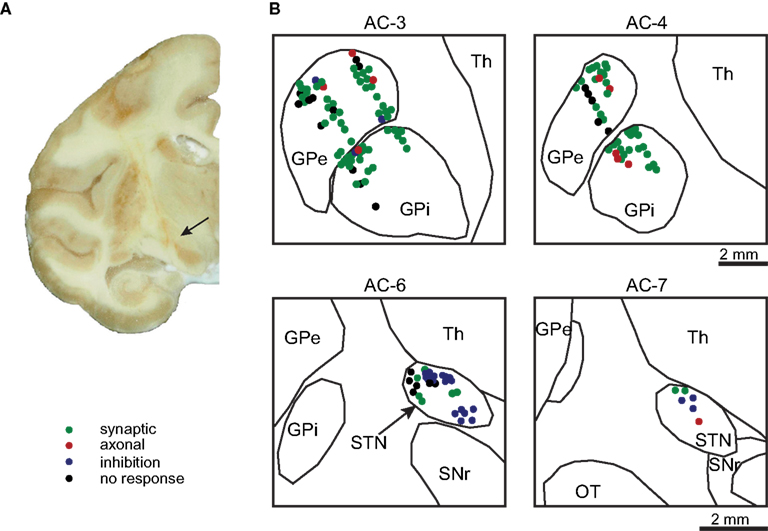
Figure 2. Anatomical reconstruction. (A) A coronal section (AC-7) of the right hemisphere of monkey P showing penetration tracts of the macro-electrode to the STN (arrow). (B) Histological reconstruction of the recorded cells in the GP (top) and STN (bottom) from both monkeys superimposed on the outline derived from the histological reconstruction of the right hemisphere from monkey P. The neurons color denotes the neuronal response type during the stimulation.
Firing Rate
The firing rate during the last 60 s of the stimulation was calculated and compared to the baseline firing rate over an equivalent period prior to the stimulation. During the stimulation the STN firing rate decreased significantly (31.2 ± 2.2 spikes/s before, 12.3 ± 2.9 during, mean ± SEM, Wilcoxon signed rank test, p << 0.01). However, the GPi and GPe firing rates did not change significantly (76.4 ± 5.2 before, 72.1 ± 6.2 during and 59.1 ± 3.4 before, 57.3 ± 4.4 during respectively, Wilcoxon signed rank test, p > 0.05). Firing rate analysis performed animal wise, resulted in similar results: STN rate dropped significantly in both primates while GPe and GPi rate did not change significantly in either animal. Calculations of firing rates during the stimulation were compensated for the NP, which was equal to 0.75 ms in the current dataset (Figure 3A).
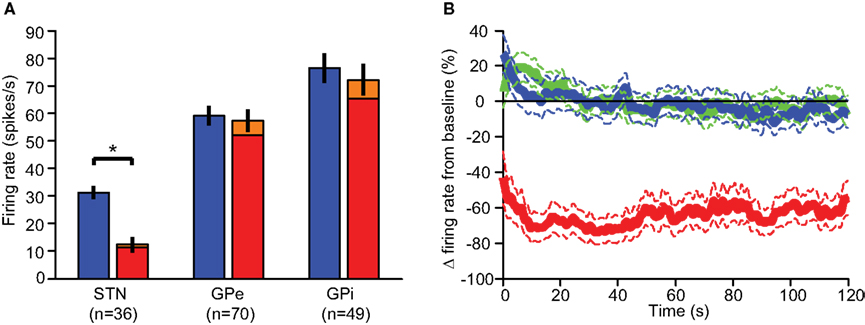
Figure 3. Neuronal firing rate. (A) The mean firing rates for the periods prior to stimulation (blue), during stimulation (red), and NP compensated (orange) in the STN, GPe, and GPi. Error bars represent SEM (* p << 0.01 ). (B) The firing rate dynamics during the stimulation relative to the baseline rate of the STN (red), GPe (green), and GPi (blue); dashed lines represent the SEM.
The normalized (and NP compensated) rate functions were calculated over the whole stimulation period using 100 ms bin size and smoothed by a (600 ms STD) Gaussian filter. The normalized rate displayed temporal dynamics in all three nuclei. The STN displayed the largest changes over the first 10 s of stimulation and stabilized at a rate which was substantially smaller than the baseline rate (−61.6 ± 0.1% during the last 60 s of stimulation, mean ± SEM). Both pallidal segments displayed smaller rate changes over the first 30 s and stabilized at a rate which was very close to the baseline rate (GPe −3.2 ± 0.1%, GPi −5.1 ± 0.0%, Figure 3B).
Response Types
Most neurons displayed stereotypic responses to stimulation pulses. The responses were classified based on their PSTH into several categories (Figure 4A):
1 Axonal activation: Neurons displaying high entrainment to the stimulation; i.e., the neurons fired following each stimulation pulse with a high probability (53.3 ± 12.1%, n = 10; mean ± SEM), at short latencies (<2 ms) following the stimulation (Total 1.1 ± 0.1 ms, n = 10; STN 0.7 ms, n = 1; GPe 1.2 ± 0.2 ms, n = 5; GPi 1.1 ± 0.3 ms, n = 4; mean ± SEM) with a very low jitter (0.3 ± 0.0 ms, n = 10; mean ± SEM). This type of activation cannot be explained by the slower and highly variable synaptic transmission.
2 Inhibition: Neurons whose firing rate during the stimulation decreased by more than 80% relative to their baseline firing rate (−96.3 ± 0.9%, n = 24; mean ± SEM). This response was the predominant response in the STN, where 58% of the neurons displayed inhibition during the stimulation (Figure 4B).
3 Synaptic activation: Neurons displaying stereotypic response patterns with a high CVRate (0.03 ± 0.00 before, 0.45 ± 0.02 during, n = 99; mean ± SEM). This response was the predominant response in both segments of the GP (71% in the GPe and 84% in the GPi; Figure 4B).
4 No response: Neurons displaying a low CVRate during the stimulation (0.03 ± 0.00 before, 0.10 ± 0.01 during, n = 22; mean ± SEM).
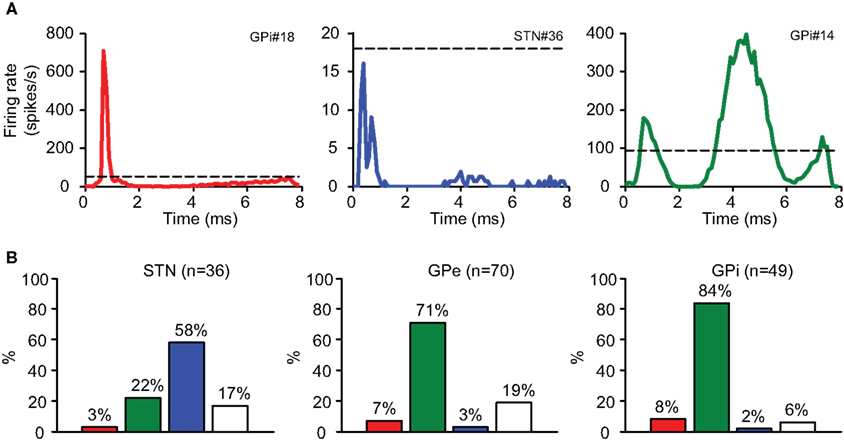
Figure 4. Stimulation response types. (A) The PSTH demonstrates typical response types: axonal activation (red), inhibition (blue), and synaptic response (green). Dashed line represents baseline rate prior to stimulation. (B) The distribution of response types in the recorded nuclei.
Response Dynamics
Neurons with a synaptic response displayed temporal dynamics in their response over the stimulation period (Figure 5A). The changes were characterized by an increased latency (0.4 ± 0.1 ms in both segments of the GP with GPe n = 37 and GPi n = 30; mean ± SEM) and a decreased peak amplitude (33.1 ± 4.8% in the GPe and 27.4 ± 4.6% in the GPi; mean ± SEM) of the locked response (Figure 5B). These response pattern dynamics complemented the firing rate dynamics in both segments of the GP over the first 30 s of the stimulation (Figure 5B). In the STN, firing rate dynamics were observed over the first 10 s of the stimulation but no response pattern dynamics were observed at population level.
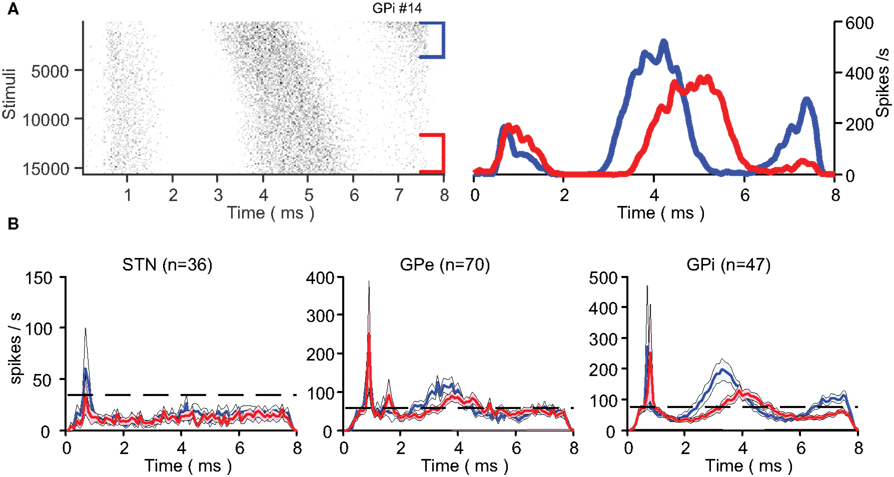
Figure 5. Response dynamics. (A) An example of a single neuron’s change in response to the stimulation presented in a raster plot (left) and PSTH (right). The first (blue) and last (red) 30 s of the stimulation are presented separately. (B) Mean population PSTH (mean ± SEM) over the first (blue) and last (red) 30 s of stimulation across all nuclei. The dashed line represents population baseline rate prior to stimulation.
Transmission Scheme
Axonal (antidromic) and synaptic transmission delays between the stimulated nucleus and target neurons in the STN, GPe, and GPi were calculated. The delay and jitter were based on the mean latency of the peak and its standard deviation respectively. Antidromic delays were similar across nuclei (~1 ms) with a very low jitter (0.3 ms). Synaptic transmission delays were slightly larger in the GPi than in the GPe. The synaptic delay (~3.9 ms) and jitter (~1.3 ms) were substantially larger than the axonal delay and jitter (Table 1).
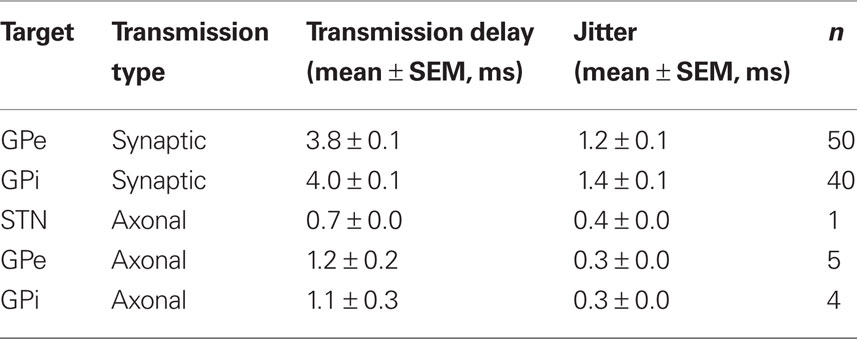
Table 1. Transmission scheme.
Entropy
The neurons’ upper bound on information transfer was calculated prior and during the stimulation. The upper bound is the outcome of multiplying the entropy per ISI by the neuronal firing rate. The STN capability to transmit information dropped significantly from 176.1 ± 10.8 bit/s (mean ± SEM) prior to the stimulation, to 71.8 ± 14.6 bit/s during the stimulation (Wilcoxon signed rank test p << 0.01). The upper bound of transmission capability in the GPe did not display a major reduction (GPe 293.7 ± 12.5 bit/s before, 276.4 ± 14.2 bit/s during Wilcoxon signed rank test p > 0.05) and the upper bound in the GPi was reduced significantly but to a lesser extent than the STN reduction (348.1 ± 16.5 bit/s before, 308.3 ± 20.1 bit/s during, Wilcoxon signed rank test p < 0.01; Figure 6).
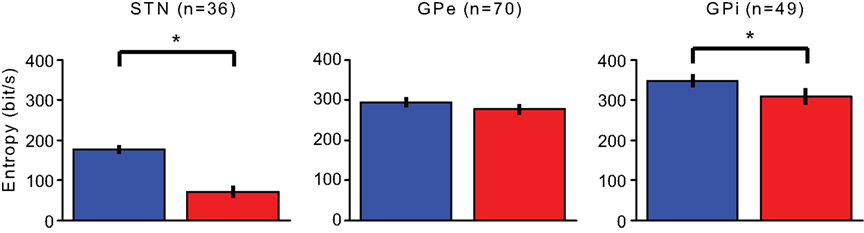
Figure 6. Entropy. Changes in the upper bound on information transmission prior (blue) and during (red) the stimulation period. Error bars represent the SEM (*p < 0.01).
Discussion
The present study examined the neuronal response within the BG to STN macro-stimulation in primates rendered parkinsonian using MPTP. Recordings were performed simultaneously in the STN, GPe, and GPi during the stimulation and were compared to recordings of the same neurons prior to the stimulation. The firing rate in the STN decreased significantly during the stimulation. In contrast, GPe and GPi firing rates did not change significantly. The firing patterns following each stimulation pulse demonstrated stereotypic firing patterns that were classified into a few basic response categories. In the STN the predominant response was an overall reduction in the activity (inhibitory response). In contrast, the predominant responses in both segments of the GP were synaptic activation patterns. A minority of the neurons in all of these targets displayed axonal activation or no response at all. The neurons which displayed a synaptic response demonstrated temporal dynamics in their response pattern. The predominant part of the dynamics took place over the first 10 s of stimulation in the STN and the first 30 s in the GP. Derivation of the upper bound on information transmission in the three nuclei showed a major decrease in the STN’s ability to transfer information while the GPi displayed only a minor reduction in its upper bound on information transmission.
The applied stimulation parameters were similar to those applied successfully in humans (Kuhn et al., 2008) and other animal studies trying to replicate the clinical environment (Hashimoto et al., 2003). The stimulation amplitude (2 V) was chosen to be strong enough to elicit neural responses, but without generating motor constrictions caused by stimulation of descending internal capsule fibers. The chosen parameter values and the choice of constant voltage pulses were done to comply with these clinical studies although most scientific studies of electric stimulation use constant current pulses as this provides a more direct measure of affecting the neurons (Lemon, 1984). In this study we have no direct measures of the clinical change in the parkinsonian symptoms and therefore we make no claims regarding the therapeutic value of the stimulation.
The recordings in the STN were almost exclusively in the dorsal motor domain (Wichmann et al., 1994), while recordings in both pallidal segments were more distributed throughout the functional domains although many were in the classical motor domain (Parent and Hazrati, 1995). Neuronal response in both segments of the GP to STN stimulation did not display spatial differences. This lack of evident organization of the responses is shown in relation to the anatomical reconstruction (Figure 2). The responses of neurons within territories classically defined as belonging to different functional domains did not display different properties. However, as we have limited coverage of the GP we cannot rule out such a spatial organization.
The firing rate of most STN neurons (58%) decreased significantly during the stimulation, with many of them undergoing complete cessation of firing. This is consistent with previous studies demonstrating STN inhibition during DBS (Benazzouz et al., 2000; Filali et al., 2004; Welter et al., 2004; Meissner et al., 2005; but see Carlson et al., 2010 for conflicting results). The reason for the discrepancy between these studies may be due to the different stimulations setups where the predominant parameter is probably the current intensity. We make this assumption based on observations in our data of STN neurons that displayed a minor or no response to low stimulation intensities (stimulation at 500 mV, data not shown) and displayed the typical inhibitory response at high stimulation intensities. This observation is consistent with the hypothesis that current intensity is the predominant factor in activation of neural elements (Ranck Jr., 1975; Butson and McIntyre, 2006; Miocinovic et al., 2009; Carlson et al., 2010).
The rate of the simultaneously recorded GPe and GPi neurons did not change significantly during the stimulation despite the major change in STN activity. This observation is surprising in light of the “box and arrow” models (Albin et al., 1989; DeLong, 1990) that view the STN projections to the GP as the main glutamatergic excitatory afferents (Smith and Parent, 1988; Robledo and Feger, 1990; Shink and Smith, 1995). The findings are nevertheless consistent with previous works which have failed to report a reduction in GP firing rate during STN stimulation (Hashimoto et al., 2003; Stefani et al., 2005). The fact that recordings during the stimulation period were performed simultaneously in the STN and both segments of the GP directly highlights the dissociation between the STN’s pre-synaptic somatic inhibition and the post-synaptic GP activation which does not comply with this inhibition. This dissociation phenomenon is consistent with previous modeling studies (McIntyre et al., 2004a; Miocinovic et al., 2006).
The recorded neurons displayed stereotypic response patterns to each stimulation pulse.
1 Axonal activation: This response type was characterized by a high entrainment to the stimulation; i.e., the neuron fired following stimulation at short constant delays with a high probability. This high fidelity of the neuronal firing was complemented by a minimal jitter in the firing latency relative to the pulse time. This type of activation presumably results from the antidromic activation of the neuron by the stimulation via its axon (Kita and Kitai, 1991; Hashimoto et al., 2003). The delays and jitter were consistent with previous results demonstrating axonal activation (Kita and Kitai, 1991; Nambu et al., 2000; Hashimoto et al., 2003). The rapid response and low jitter cannot be explained by synaptic activation (Nambu et al., 2000). Some previous studies of neuronal activation following DBS did not observe this type of response (Meissner et al., 2005). This difference in the apparent observations may be due to the very short NP masked by the stimulation which was typically 0.75 ms in our study which prevented the masking of this fast response by the stimulation artifact. The antidromic GPi response is inconsistent with anatomical findings which are not aware of GPi efferent projections to the STN. Thus, GPi’s antidromic response may be an outcome of the stimulating electrode affecting the lenticular fasciculus which is a GPi efferent tract connected to the thalamus. This phenomenon is consistent with a previous computational study (Miocinovic et al., 2006). Neurons displaying axonal activation were activated following 53% of the stimulation. These results are also consistent with in vitro studies (Iremonger et al., 2006) which found that when stimulating the rat’s internal capsule at 125 Hz and recording in the primary motor cortex (M1), only about 50% of the stimulation pulses resulted in an antidromic activations.
2 Inhibition: This response type was characterized by a significant reduction in the firing rate throughout the stimulation relative to the baseline firing rate. This type of response was observed mainly in the STN and is consistent with previous work (Benazzouz et al., 2000; Filali et al., 2004; Meissner et al., 2005). In general the stimulated nucleus displayed a predominant inhibitory response either in GPi stimulation (Boraud et al., 1996; Dostrovsky et al., 2000) or STN stimulation. It is plausible that neurons classified as displaying an inhibitory response actually displayed an axonal response that was obscured by the non-usable period. This may also explain the dissociation mentioned above.
3 Synaptic activation: This response type was characterized by excitatory and inhibitory activation patterns. Excitatory activation patterns displayed an excitation (3–5 ms following the stimulation pulse). In some cases, double or even triple excitatory modulations were observed (i.e., when additional excitations were observed at 0.7–2 and/or 6.5–7.3 ms). That was the predominant response in both segments of the GP. This result is consistent with previous studies of STN and GP stimulation (Nambu et al., 2000; Hashimoto et al., 2003; Bar-Gad et al., 2004; Erez et al., 2009). The latencies of the synaptic effects are congruent with previously described synaptic transmission delays (Nambu et al., 2000; Hashimoto et al., 2003; Erez et al., 2009). The second activation pattern was characterized by an inhibitory modulation (2–4 ms following the stimulation pulse). This response was displayed by a minority of the neurons. These inhibitory effects were probably a result of GABAergic synaptic input released from the pallidal collaterals of excited GP axons.
A predominant part of GPe neurons undergoing synaptic activation displayed an excitatory activation about 3 ms following STN stimulation, consistent with STN GPe synaptic transmission delay (Kita and Kitai, 1991; Hashimoto et al., 2003). Examination of GPi stimulation induced activity reveals reduced activity 5–6 ms following the stimulation. The expected 3 ms delay from the STN to the GPe combined with the 3-ms delay from the GPe to GPi (Kita, 2001) is expected to yield such an inhibitory effect roughly 6 ms after the stimulation pulses. However, additional GPe indirect effects such as reduced overall GPi rate due to the longer duration effect of IPSPs were not observed.
During the stimulation, temporal dynamics were observed in both firing rate and pattern. Firing rate dynamics were observed in both segments of the GP over the first 30 s of stimulation, when the firing rate changed and finally stabilized around baseline. STN firing rate dynamics was observed only over the first 10 s of the stimulation when the firing rate stabilized at ~40% of the baseline rate. The stimulation locked response displayed evolution both in decay of the firing rate and delay in the response to stimulation in both segments of the GP. No dynamics was observed in the STN although we assume that STN neurons with a synaptic response did display temporal dynamics over the stimulation. This dynamic process was probably obscured by a combination of a short integration period due to fast STN dynamics over the first 10 s of stimulation on one hand and the STN’s low baseline firing rate on the other. The combination of these factors resulted in a noisy PSTH in which the fine temporal dynamics could not be extracted with confidence.
One of the principal findings of this study is the GP short term plasticity mechanism during STN macro-stimulation. This finding is consistent with a similar mechanism observed during GP stimulation (Erez et al., 2009). We assume that fast recurrent axonal activation results in neurotransmitter depletion in the synapses, leading to a slower buildup of the post-stimulus response (Zucker and Regehr, 2002). We suggest that the two temporal dynamics observed are actually the outcome of a single process. As the GP firing rate increases upon stimulation onset, a gradual process of synapse depletion begins. This process results in a normalization of the firing rate and at the same time a delay and decay of the excitatory peak (See supplementary information Erez et al., 2009). We refer to the observed dynamics as short term plasticity since the neurons rapidly return to baseline.
The changes in information transmission within the BG during STN stimulation are key components in understanding the effect of STN stimulation at the system level. In addition, STN stimulation provided a unique opportunity to toggle the BG between two pathological states over a very short interval and compare the system level flow of information in those states. During the stimulation, STN entropy dropped significantly. This was attributed primarily to the change in the firing rate. At the same time GP entropy displayed changes to a much lesser extent. According to classical information theory, the entropy is the upper bound on the channel capacity. As a result we may infer that major changes in entropy eventually result in a change in the flow of information. Hence we assume that during the stimulation the STN went through a functional ablation. This fits the perception of the “functional ablation” during the stimulation which was suggested earlier (Benabid et al., 2002; McIntyre et al., 2004b).
We suggest that during STN macro-stimulation, the STN goes through a functional ablation and its upper bound on information transmission to downstream nuclei drops significantly. This is further supported by the evident dissociation between the pre-synaptic somatic inhibition and the post-synaptic axonal activation of its downstream targets and the reduction in the STN-pallidal synaptic efficacy. At the same time downstream GP segments display normal firing rates and are not affected by the deleterious effect of the STN. This mechanism may potentially be one of the key components leading to the alleviating effect of DBS in PD.
Conflict of Interest Statement
The authors declare that the research was conducted in the absence of any commercial or financial relationships that could be construed as a potential conflict of interest.
Acknowledgments
We thank A. Korngreen for helpful discussions and K. McCairn, M. Dror, and P. Malmud for their help in animal treatment. This work was supported by grants from the Ministry of Health (MOH), the Israeli Science Foundation (ISF), and the Legacy Heritage Biomedical Program of the ISF.
References
Albin, R. L., Young, A. B., and Penney, J. B. (1989). The functional anatomy of basal ganglia disorders. Trends Neurosci. 12, 366–375.
Alexander, G. E., DeLong, M. R., and Strick, P. L. (1986). Parallel organization of functionally segregated circuits linking basal ganglia and cortex. Annu. Rev. Neurosci. 9, 357–381.
Anden, N. E., Carlsson, A., Dahlstroem, A., Fuxe, K., Hillarp, N. A., and Larsson, K. (1964). Demonstration and mapping out of nigro-neostriatal dopamine neurons. Life Sci. 3, 523–530.
Anderson, M. E., Postupna, N., and Ruffo, M. (2003). Effects of high-frequency stimulation in the internal globus pallidus on the activity of thalamic neurons in the awake monkey. J. Neurophysiol. 89, 1150–1160.
Bar-Gad, I., Elias, S., Vaadia, E., and Bergman, H. (2004). Complex locking rather than complete cessation of neuronal activity in the globus pallidus of a 1-methyl-4-phenyl-1,2,3,6-tetrahydropyridine-treated primate in response to pallidal microstimulation. J. Neurosci. 24, 9410–9419.
Benabid, A. L., Benazzous, A., and Pollak, P. (2002). Mechanisms of deep brain stimulation. Mov. Disord. 17(Suppl. 3), S73–S74.
Benazzouz, A., Gao, D. M., Ni, Z. G., Piallat, B., Bouali, B. R., and Benabid, A. L. (2000). Effect of high-frequency stimulation of the subthalamic nucleus on the neuronal activities of the substantia nigra pars reticulata and ventrolateral nucleus of the thalamus in the rat. Neuroscience 99, 289–295.
Benazzouz, A., Gross, C., Feger, J., Boraud, T., and Bioulac, B. (1993). Reversal of rigidity and improvement in motor performance by subthalamic high-frequency stimulation in MPTP-treated monkeys. Eur. J. Neurosci. 5, 382–389.
Bernheimer, H., Birkmayer, W., Hornykiewicz, O., Jellinger, K., and Seitelberger, F. (1973). Brain dopamine and the syndromes of Parkinson and Huntington. Clinical, morphological and neurochemical correlations. J. Neurol. Sci. 20, 415–455.
Beurrier, C., Bioulac, B., Audin, J., and Hammond, C. (2001). High-frequency stimulation produces a transient blockade of voltage-gated currents in subthalamic neurons. J. Neurophysiol. 85, 1351–1356.
Boraud, T., Bezard, E., Bioulac, B., and Gross, C. (1996). High frequency stimulation of the internal globus pallidus (GPi) simultaneously improves parkinsonian symptoms and reduces the firing frequency of GPi neurons in the MPTP-treated monkey. Neurosci. Lett. 215, 17–20.
Brown, P., Mazzone, P., Oliviero, A., Altibrandi, M. G., Pilato, F., Tonali, P. A., and Di Lazzaro, V. (2004). Effects of stimulation of the subthalamic area on oscillatory pallidal activity in Parkinson’s disease. Exp. Neurol. 188, 480–490.
Butson, C. R., and McIntyre, C. C. (2006). Role of electrode design on the volume of tissue activated during deep brain stimulation. J. Neural Eng. 3, 1–8.
Carlson, J. D., Cleary, D. R., Cetas, J. S., Heinricher, M. M., and Burchiel, K. D. (2010). Deep brain stimulation (DBS) does not silence neurons in subthalamic nucleus in Parkinson’s patients. J. Neurophysiol. 103, 962–967.
DeLong, M. R. (1990). Primate models of movement disorders of basal ganglia origin. Trends Neurosci. 13, 281–285.
Dorval, A. D., Russo, G. S., Hashimoto, T., Xu, W., Grill, W. M., and Vitek, J. L. (2008). Deep brain stimulation reduces neuronal entropy in the MPTP-primate model of Parkinson’s disease. J. Neurophysiol. 100, 2807–2818.
Dostrovsky, J. O., Levy, R., Wu, J. P., Hutchison, W. D., Tasker, R. R., and Lozano, A. M. (2000). Microstimulation-induced inhibition of neuronal firing in human globus pallidus. J. Neurophysiol. 84, 570–574.
Erez, Y., Czitron, H., McCairn, K., Belelovsky, K., and Bar-Gad, I. (2009). Short-term depression of synaptic transmission during stimulation in the globus pallidus of 1-methyl-4-phenyl-1,2,3,6-tetrahydropyridine-treated primates. J. Neurosci. 29, 7797–7802.
Erez, Y., Tischler, H., Moran, A., and Bar-Gad, I. (2010). Generalized framework for stimulus artifact removal. J. Neurosci. Methods 191, 45–59.
Filali, M., Hutchison, W. D., Palter, V. N., Lozano, A. M., and Dostrovsky, J. O. (2004). Stimulation-induced inhibition of neuronal firing in human subthalamic nucleus. Exp. Brain Res. 156, 274–281.
Garcia, L., Audin, J., D’Alessandro, G., Bioulac, B., and Hammond, C. (2003). Dual effect of high-frequency stimulation on subthalamic neuron activity. J. Neurosci. 23, 8743–8751.
Hanson, J. E., and Jaeger, D. (2002). Short-term plasticity shapes the response to simulated normal and parkinsonian input patterns in the globus pallidus. J. Neurosci. 22, 5164–5172.
Hashimoto, T., Elder, C. M., Okun, M. S., Patrick, S. K., and Vitek, J. L. (2003). Stimulation of the subthalamic nucleus changes the firing pattern of pallidal neurons. J. Neurosci. 23, 1916–1923.
Iremonger, K. J., Anderson, T. R., Hu, B., and Kiss, Z. H. (2006). Cellular mechanisms preventing sustained activation of cortex during subcortical high-frequency stimulation. J. Neurophysiol. 96, 613–621.
Kita, H. (2001). Neostriatal and globus pallidus stimulation induced inhibitory postsynaptic potentials in entopeduncular neurons in rat brain slice preparations. Neuroscience 105, 871–879.
Kita, H., and Kitai, S. T. (1991). Intracellular study of rat globus-pallidus neurons – membrane-properties and responses to neostriatal, subthalamic and nigral stimulation. Brain Res. 564, 296–305.
Kita, H., Tachibana, Y., Nambu, A., and Chiken, S. (2005). Balance of monosynaptic excitatory and disynaptic inhibitory responses of the globus pallidus induced after stimulation of the subthalamic nucleus in the monkey. J. Neurosci. 25, 8611–8619.
Kuhn, A. A., Kempf, F., Brucke, C., Gaynor, D. L., Martinez-Torres, I., Pogosyan, A., Trottenberg, T., Kupsch, A., Schneider, G. H., Hariz, M. I., Vandenberghe, W., Nuttin, B., and Brown, P. (2008). High-frequency stimulation of the subthalamic nucleus suppresses oscillatory beta activity in patients with Parkinson’s disease in parallel with improvement in motor performance. J. Neurosci. 28, 6165–6173.
Kuhn, A. A., Kupsch, A., Schneider, G. H., and Brown, P. (2006). Reduction in subthalamic 8–35 Hz oscillatory activity correlates with clinical improvement in Parkinson’s disease. Eur. J. Neurosci. 23, 1956–1960.
Leblois, A., Boraud, T., Meissner, W., Bergman, H., and Hansel, D. (2006). Competition between feedback loops underlies normal and pathological dynamics in the basal ganglia. J. Neurosci. 26, 3567–3583.
Limousin, P., Pollak, P., Benazzouz, A., Hoffmann, D., Broussolle, E., Perret, J. E., and Benabid, A. L. (1995). Bilateral subthalamic nucleus stimulation for severe Parkinson’s disease. Mov. Disord. 10, 672–674.
Magarinos-Ascone, C., Pazo, J. H., Macadar, O., and Buno, W. (2002). High-frequency stimulation of the subthalamic nucleus silences subthalamic neurons: a possible cellular mechanism in Parkinson’s disease. Neuroscience 115, 1109–1117.
Maurice, N., Thierry, A. M., Glowinski, J., and Deniau, J. M. (2003). Spontaneous and evoked activity of substantia nigra pars reticulata neurons during high-frequency stimulation of the subthalamic nucleus. J. Neurosci. 23, 9929–9936.
McCairn, K. W., and Turner, R. S. (2009). Deep brain stimulation of the globus pallidus internus in the parkinsonian primate: local entrainment and suppression of low-frequency oscillations. J. Neurophysiol. 101, 1941–1960.
McIntyre, C. C., Grill, W. M., Sherman, D. L., and Thakor, N. V. (2004a). Cellular effects of deep brain stimulation: model-based analysis of activation and inhibition. J. Neurophysiol. 91, 1457–1469.
McIntyre, C. C., Mori, S., Sherman, D. L., Thakor, N. V., and Vitek, J. L. (2004b). Electric field and stimulating influence generated by deep brain stimulation of the subthalamic nucleus. Clin. Neurophysiol. 115, 589–595.
Meissner, W., Leblois, A., Hansel, D., Bioulac, B., Gross, C. E., Benazzouz, A., and Boraud, T. (2005). Subthalamic high frequency stimulation resets subthalamic firing and reduces abnormal oscillations. Brain 128, 2372–2382.
Miocinovic, S., Lempka, S. F., Russo, G. S., Maks, C. B., Butson, C. R., Sakaie, K. E., Vitek, J. L., and McIntyre, C. C. (2009). Experimental and theoretical characterization of the voltage distribution generated by deep brain stimulation. Exp. Neurol. 216, 166–176.
Miocinovic, S., Parent, M., Butson, C. R., Hahn, P. J., Russo, G. S., Vitek, J. L., and McIntyre, C. C. (2006). Computational analysis of subthalamic nucleus and lenticular fasciculus activation during therapeutic deep brain stimulation. J. Neurophysiol. 96, 1569–1580
Montgomery, E. B. Jr. (2006). Effects of GPi stimulation on human thalamic neuronal activity. Clin. Neurophysiol. 117, 2691–2702.
Nambu, A., Tokuno, H., Hamada, I., Kita, H., Imanishi, M., Akazawa, T., Ikeuchi, Y., and Hasegawa, N. (2000). Excitatory cortical inputs to pallidal neurons via the subthalamic nucleus in the monkey. J. Neurophysiol. 84, 289–300.
Parent, A., and Hazrati, L. N. (1995). Functional anatomy of the basal ganglia. I. The cortico-basal ganglia-thalamo-cortical loop. Brain Res. Brain Res. Rev. 20, 91–127.
Prescott, I. A., Dostrovsky, J. O., Moro, E., Hodaie, M., Lozano, A. M., and Hutchison, W. D. (2009). Levodopa enhances synaptic plasticity in the substantia nigra pars reticulata of Parkinson’s disease patients. Brain 132, 309–318.
Ranck, J. B. Jr. (1975). Which elements are excited in electrical stimulation of mammalian central nervous system: a review. Brain Res. 98, 417–440.
Rav-Acha, M., Sagiv, N., Segev, I., Bergman, H., and Yarom, Y. (2005). Dynamic and spatial features of the inhibitory pallidal GABAergic synapses. Neuroscience 135, 791–802.
Robledo, P., and Feger, J. (1990). Excitatory influence of rat subthalamic nucleus to substantia nigra pars reticulata and the pallidal complex: electrophysiological data. Brain Res. 518, 47–54.
Rubin, J. E., and Terman, D. (2004). High frequency stimulation of the subthalamic nucleus eliminates pathological thalamic rhythmicity in a computational model. J. Comput. Neurosci. 16, 211–235.
Schneider, J. S., Gonczi, H., and Decamp, E. (2003). Development of levodopa-induced dyskinesias in parkinsonian monkeys may depend upon rate of symptom onset and/or duration of symptoms. Brain Res. 990, 38–44.
Shink, E., and Smith, Y. (1995). Differential synaptic innervation of neurons in the internal and external segments of the globus pallidus by the. J. Comp. Neurol. 358, 119–141.
Siegfried, J., and Lippitz, B. (1994). Bilateral chronic electrostimulation of ventroposterolateral pallidum: a new therapeutic approach for alleviating all parkinsonian symptoms. Neurosurgery 35, 1126–1129.
Smith, Y., and Parent, A. (1988). Neurons of the subthalamic nucleus in primates display glutamate but not GABA immunoreactivity. Brain Res. 453, 353–356.
Stefani, A., Fedele, E., Galati, S., Pepicelli, O., Frasca, S., Pierantozzi, M., Peppe, A., Brusa, L., Orlacchio, A., Hainsworth, A. H., Gattoni, G., Stanzione, P., Bernardi, G., Raiteri, M., and Mazzone, P. (2005). Subthalamic stimulation activates internal pallidus: evidence from cGMP microdialysis in PD patients. Ann. Neurol. 57, 448–452.
Stevens, C. F., and Zador, A. (1996). “Information through a spiking neuron,” in Advances in Neural Information Processing Systems, Vol. 8, eds D. S. Touretzky, M. Mozer, and M. E. Hasselmo (Cambridge, MA: MIT Press), 75–81.
Szabo, J., and Cowan, W. M. (1984). A stereotaxic atlas of the brain of the cynomolgus monkey (Macaca fascicularis). J. Comp. Neurol. 222, 265–300.
Tai, C. H., Boraud, T., Bezard, E., Bioulac, B., Gross, C., and Benazzouz, A. (2003). Electrophysiological and metabolic evidence that high-frequency stimulation of the subthalamic nucleus bridles neuronal activity in the subthalamic nucleus and the substantia nigra reticulata. FASEB J. 17, 1820–1830.
Welter, M. L., Houeto, J. L., Bonnet, A. M., Bejjani, P. B., Mesnage, V., Dormont, D., Navarro, S., Cornu, P., Agid, Y., and Pidoux, B. (2004). Effects of high-frequency stimulation on subthalamic neuronal activity in parkinsonian patients. Arch. Neurol. 61, 89–96.
Wichmann, T., Bergman, H., and DeLong, M. R. (1994). The primate subthalamic nucleus. I. Functional properties in intact animals. J. Neurophysiol. 72, 494–506.
Wu, Y. R., Levy, R., Ashby, P., Tasker, R. R., and Dostrovsky, J. O. (2001). Does stimulation of the GPi control dyskinesia by activating inhibitory axons? Mov. Disord. 16, 208–216.
Keywords: deep brain stimulation, Parkinson’s disease, non-human primate, 1-methyl-4-phenyl-1,2,3,6-tetrahydropyridine, globus pallidus, subthalamic nucleus, short term plasticity, basal ganglia
Citation: Moran A, Stein E, Tischler H, Belelovsky K and Bar-Gad I (2011) Dynamic stereotypic responses of basal ganglia neurons to subthalamic nucleus high-frequency stimulation in the parkinsonian primate. Front. Syst. Neurosci. 5:21. doi: 10.3389/fnsys.2011.00021
Received: 31 December 2010;
Accepted: 08 April 2011;
Published online: 26 April 2011.
Edited by:
James M. Tepper, Rutgers, The State University of New Jersey, USACopyright: © 2011 Moran, Stein, Tischler, Belelovsky and Bar-Gad. This is an open-access article subject to a non-exclusive license between the authors and Frontiers Media SA, which permits use, distribution and reproduction in other forums, provided the original authors and source are credited and other Frontiers conditions are complied with.
*Correspondence: Izhar Bar-Gad, Gonda Brain Research Center, Bar-Ilan University, Ramat-Gan 52900, Israel. e-mail: bargadi@mail.biu.ac.il