Statistical analysis of coding for molecular properties in the olfactory bulb
- 1 Department of Computational Biology, Royal Institute of Technology, Stockholm, Sweden
- 2 Stockholm Brain Institute, Stockholm, Sweden
- 3 Intelligent Signal Processing group, Department of Electronics, University of Barcelona, Barcelona, Spain
- 4 Artificial Olfaction group, Institute for Bioengineering of Catalonia, Barcelona, Spain
The relationship between molecular properties of odorants and neural activities is arguably one of the most important issues in olfaction and the rules governing this relationship are still not clear. In the olfactory bulb (OB), glomeruli relay olfactory information to second-order neurons which in turn project to cortical areas. We investigate relevance of odorant properties, spatial localization of glomerular coding sites, and size of coding zones in a dataset of [14C] 2-deoxyglucose images of glomeruli over the entire OB of the rat. We relate molecular properties to activation of glomeruli in the OB using a non-parametric statistical test and a support-vector machine classification study. Our method permits to systematically map the topographic representation of various classes of odorants in the OB. Our results suggest many localized coding sites for particular molecular properties and some molecular properties that could form the basis for a spatial map of olfactory information. We found that alkynes, alkanes, alkenes, and amines affect activation maps very strongly as compared to other properties and that amines, sulfur-containing compounds, and alkynes have small zones and high relevance to activation changes, while aromatics, alkanes, and carboxylics acid recruit very big zones in the dataset. Results suggest a local spatial encoding for molecular properties.
1 Introduction
Each olfactory receptor neuron (ORN) in the nasal epithelium of the rat in expresses only one of approximately 1300 odor receptors (ORs, Zhang et al., 2007). The transduction principles of ORs is presently not well understood, but apparently there are no molecular features of the odorant that directly determine perceptive quality Sell (2006); Haddad et al. (2008). Each odorant molecule has many different physical and chemical properties and the information about the odorant is encoded by the combined responses of many types of ORs, each of which has a specific response profile to molecular properties Hallem and Carlson (2006). Axons from olfactory neurons are bundled in spheroidal neuropil structures in the olfactory bulb (OB), called glomeruli, in a way that each glomerulus receives axons from many ORNs of just one type of OR Bozza et al. (2002). OB output neurons, mitral and tufted cells (short: MT cells), convey information to higher order olfactory structures, such as anterior olfactory nucleus, piriform cortex, entorhinal cortex, and nuclei in the amygdala Zou et al. (2001).
Khan et al. (2010) summarizes general findings from many studies on glomerular coding, such as the following:
1. odorants with different chemical structure and shape generate (in many cases) distinctive patterns of glomerular activation,
2. odors elicit a localized (punctuated) pattern on the bulb,
3. these patterns are bilaterally symmetric and very similar between individuals for a given odorant,
4. that increasing the ligand concentrations recruits more glomeruli.
Most sensory systems spatially segregate afferent input from primary sensory neurons in a topographic map that reflects the location of a sensory stimulus within the environment, as well as the quality of the stimulus itself Udin and Fawcett (1988). There is evidence that different cortical regions process specific parts of the bulb Miyamichi et al. (2010). It is known that there is a relationship between position of ORNs in the nose and projections to the OB (rhinotopy, Miyamichi et al., 2005; Johnson and Leon, 2007) and it has been suggested Pearce and Gardner (2009) that the distribution of ORNs along the turbinates could be optimized in a way analogous to a chromatograph. It has been found in many independent studies that in the rat OB certain glomeruli (and MT cells) in some areas are innervated preferentially in response to specific odorant properties (e.g., Vassar et al., 1994; Rubin and Katz, 1999; Meister and Bonhoeffer, 2001; Mori et al., 2006; Johnson et al., 2007). However, measuring receptive fields is problematic in the OB since the number of physicochemical features that can potentially be encoded is vast and the nature of the mapping of space formed by these properties onto the bulb is not well understood. Most studies focused on few molecular properties and use a small array of odors so that the generality of these findings remains unclear. In this paper, we present a systematic study of mapping of molecular properties to activations of glomeruli on the OB. Specifically, the questions we investigate are: which odorant properties are coded and where, what is the size of the coding zones, and how relevant are individual odorant properties to the encoding. Our techniques consist of a non-parametric statistical test with the bootstrapping resampling technique for localization of receptive fields for molecular properties. Additionally support-vector machine (SVM) classification was utilized as a non-probabilistic binary linear classifier to test relevance of molecular features. A SVM was chosen because its superior performance compared to other classification techniques Kotsiantis et al. (2007) makes it an algorithm of reference. Combining the two approaches our results pertain to relevance of odorant properties, and localization and size of coding zones. We will explain first the data and methods, then present results, and discuss them in the broader context of olfactory coding.
2 Materials and Methods
2.1 Data
In this study we used a set of 2-deoxyglucose images of glomeruli over the entire bulb of the rat Johnson et al. (2002; http://gara.bio.uci.edu/index.jsp), which were collected by Michael Leon’s group over the course of many years. In the experiments, they stimulated unanesthetized and freely respiring animals with odorants over a delivery system. The animals were then sectioned and imaged. Each of these images corresponds to glomerular responses to one particular compound. According to Johnson et al. (2006), the method is capable of resolution down to a single glomerulus. Leon and Johnson (2009) took averages over left and right bulbs and averaged over arrays from all animals exposed to the same concentration of the same compound (around three to five animals for each combination). An orientation for these images, annotated with anatomical terms of location, can be seen in Figure 1.
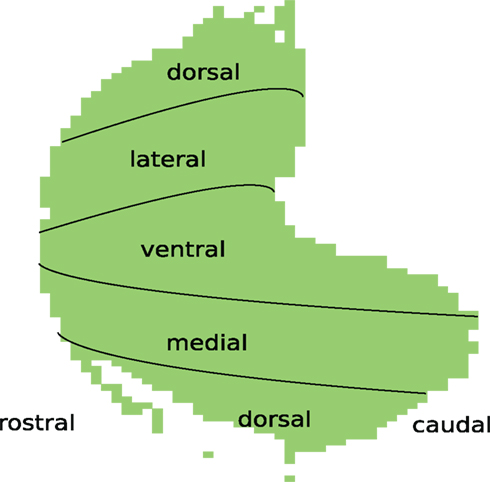
Figure 1. Ventral-centered chart of the glomerular layer.
We used descriptive information, also provided by lab of Michael Leon, which was matched by CAS number or chemical name to images. Ten images had to be discarded because of missing information about the compound. We extracted about 200 descriptors in total, which include physicochemical odorant properties as well as perceptual properties ascribed to the sensed odorant. Properties are of continuous and binary type. Continuous properties include molecular length, height, and weight. To give some examples of binary properties, binary properties concern cyclization (whether an odorant is alicyclic, aromatic, polycyclic, or heterocyclic), bond saturation (whether an odorant is alkene, alkane, or alkyne), and functional groups (whether an odorant is ester or lactone, amine, carboxylic acid, contains sulfur, contains halogen, is a ketone, alcohol, or phenol). Perceptual properties are all binary and include flavors such as sweet, camphoraceous, floral, and minty. For some properties there were many associated activity maps, for some very few. We discarded binary properties from analysis where representation was too skewed (less than four images in the infrequent category).
In our pre-processing of images, we mean-centered all pixels in order to get maps that show activation at each pixel relative to its overall pattern, and we normalized deviations to standard unit to compensate for differences in absolute pixel intensities. We started with 472 maps, of these some represented responses to identical odorants in different concentrations. For some images we did not know the ligand concentration and we had too few responses of the same ligand to do an analysis of dose–responses. We observed generally that glomerular recruitment increases with concentrations and that maps become unspecific at high doses. We eliminated by visual inspection five highly saturated maps, where most or all of the glomeruli were activated, and took means over response maps corresponding to the same odorant in different concentrations (222 maps in on average 3 concentrations). This selection left us with 308 point maps, where each corresponds to activation responses to a distinct odorant. Missing values, caused by loss of tissue on the knife during cryosectioning, others due to loss of tissue during removal of the bulbs from the skull using microdissecting scissors, were ignored in the analysis, which left us with 1834 pixels.
2.2 Methods
2.3 Localization of Coding Zones
For each molecular property, we tested statistically whether a pixel showed significant differences with respect to the property. For binary properties we compared activations on images, where a property was given, with activations on images, where property was not given using a non-parametric statistical test. The Wilcoxon ranked-sum test (also called the Mann–Whitney U test) assesses whether two samples come from the same distribution (null hypothesis). For some properties, we had only very few maps that corresponded to them. To account for statistical variations in these distributions we applied a bootstrap Efron (1982) resampling procedure for all tests to estimate p-values of the statistical test. In bootstrapping, a statistical analysis is repeatedly applied to subpopulations of the same size, generated by sampling from the original population with replacement. Bootstrap methods can be used for hypothesis tests and for regression analysis and allow the estimation of distributions of almost any statistic where only few samples are available. Using the Wilcoxon ranked-sum test is analogous to applying the students’ t-test on the data after ranking over the combined samples and using the bootstrapped variant has the advantage of not assuming normality, more robustness to outliers, and allows the two samples to be of arbitrary (unequal) sizes. We compared the activations given the binary property, AP, against the activations not given the binary property, A¬P.
At each iteration of the bootstrap, we randomly sampled from the two distributions with replacement before applying the Wilcoxon rank-sum test. The resulting distribution of p-values was log-normal and we took the medians of p-values as bootstrap statistic and use these median p-values for subsequent analysis (cf. Limpert et al., 2001). As estimation of the bootstrap error, we took the interquartile range of the sampled p-values. There was a very high and very significant positive Pearson correlation between error and p-values (ρ = 0.77, p = 0.001). About 94% of points below significance level 0.05 had an associated error below 0.1. We only took these points into account. We will say that points are coding for a (binary) property if the null hypothesis could be rejected at the 5% significance level. More formally, the coding of a property can be expressed as:

where  stands for the bootstrapped p-value of the statistical test and bigger is the bootstrap statistic of
  . The obtained value would indicate how strong odor-induced activity is associated with a property (or its absence for negative values). If statistical significance is below a threshold, the value is set to 0. We only took into account values above 0.
For continuous properties the procedure was more involved. We discretized properties by grouping their values into bins, taking bin numbers as first guess from Sturges’ formula (cf. Wand, 1997) then adjusting by such that in each bin there were at least roughly 5% of activation maps. We then applied the procedure with bootstrap and Wilcoxon rank-sum test for differences between activations in response to property values in a one-against-all fashion, i.e. activations in a particular bin versus activations in response to values out of bin.
2.3.1 Size of coding zones
In order to determine the size of coding area for a property, we took the number of points that responded significantly different when a property was given as when the property was absent. Skewed distributions for some properties could have an impact on how many points are found to be significantly related to a property. Therefore it is important to note that for the properties under consideration, data availability (number of images corresponding to presented molecular properties), and size of coding zone showed no significant Pearson correlation (ρ = 0.33, p = 0.27). We took into account 13 binary molecular properties, where at least four images were available.
2.4 Classification
We take the classification performance as measure of structure–activation relationship between activations of glomeruli and odorant features and use it to quantify relevance of molecular properties to glomerular coding. We classified using a linear SVM (Vapnik, 1995) with glomerular activations as input vector and each binary property (present vs. not present) as binary target. In each of 10 iterations we randomly sampled half of the activation maps as training set and took the other half as test. We distinguished between two experimental conditions:
1. best points – classification using most representative points, and
2. random baseline – classification using randomly sampled points.
For the first experimental condition, for each property, we sorted points in descending order by their relevance with respect to the property (p-values from Wilcoxon rank-sum test) and then classified taking the best n points, with n ∈ N = {1, 5, …, 30, 45, 50, 60, …, 150, 200, 300, …, 1700, 1834} (36 steps). As a random baseline, for each property, we took the same intervals N, but randomly sampled points. We averaged over 250 random subsamples of points for each interval. We used an in-house linear SVM classifier implemented in Matlab (which we found more robust than other SVM implementations, possibly because of Mathwork’s quadprog function). We use the area under the ROC curve (AUC, cf. Bradley, 1997) as performance criterion, which measures the fraction of true positives against the fraction of false positives. It has the advantage to be unbiased by skewed class distributions, which are a particular problem in our data set. An example of such an experimental run for the aromatic property is shown in Figure 4.
3 Results
3.1 Localization of Coding Zones
Figure 2 shows loci of coding zones for the 13 molecular properties. Compare Figure 1 for anatomical terms of locations in a ventral-centered chart for the glomerular layer of the rat OB.
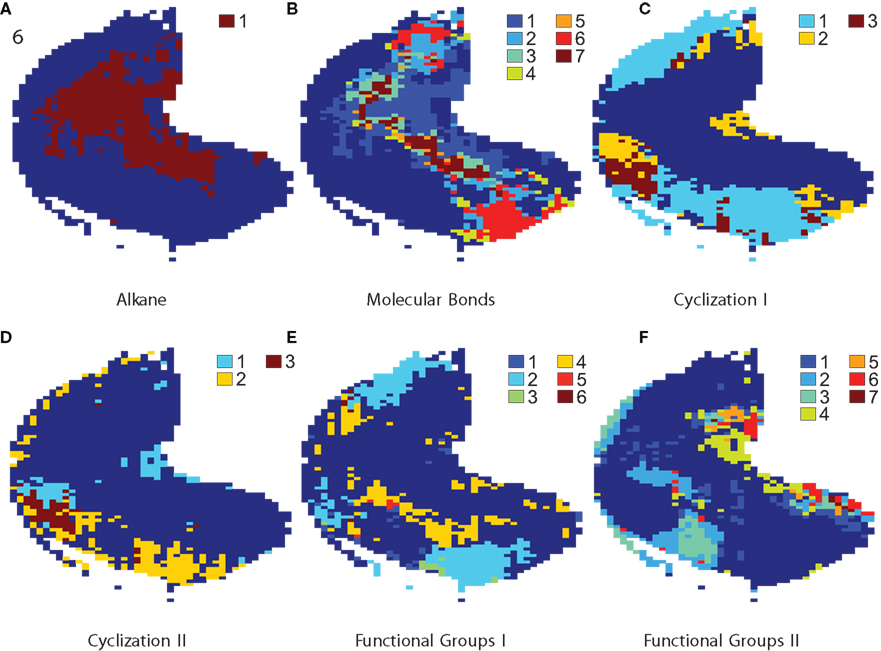
Figure 2. Localization of molecular properties: maps with coding zones for various odorant properties. Loci of the 13 binary properties, grouped into basic dimensions molecular bonds, cyclization, and functional groups. Colors in figures serve to distinguish zones, which coded for a specific combination of several binary properties as determined by mentioned statistical analysis. Numbers in the legends are explained in this caption. (A) Example map showing loci coding for alkane property. 1 marks the coding zone for alkane. (B) Represents molecular bond properties. The numbers stand for: 1 alkane 2 alkene 3 alkane, alkene 4 alkyne 5 alkane, alkyne 6 alkene, alkyne 7 alkane, alkene, alkyne. (C) Shows two cyclization properties. The number code is as follows: 1 aromatic 2 alicyclic 3 aromatic and alicyclic. (D) Marks areas for two cyclization properties. The number code is as follows: 1 polycyclic 2 heterocyclic 3 polycyclic and heterocyclic. (E) Shows coding zones for three functional group properties. The numbers stand for: 1 amine 2 ketone 3 amine and ketone 4 alcohol–phenol 5 amine and alcohol–phenol 6 ketone and alcohol–phenol. (F) Indicates loci for the other 3 functional group properties. The numbers: 1 ester + lactone 2 carboxylic acid 3 ester + lactone and carboxylic acid 4 sulfur-containing compound 5 ester + lactone and sulfur-containing compound 6 carboxylic acid and sulfur-containing compound 7 ester + lactone, carboxylic acid and sulfur-containing compound. Compare to Table 1 where estimations of coding zone size are listed.
For the other chemical properties displayed in Figure 2 we grouped properties into molecular bonds, cyclization, and functional groups, and then show mapping for ranges of molecular length and carbon number. For space constraints we excluded many maps, such as for surface area, water solubility, and others. Colors in figures serve to distinguish zones, which are activated preferentially for a specific combination of several binary properties. For space efficiency, legends refer to numbers which are explained in the figure caption. In Figure 2A you can see the coding zone for the alkane property as a demonstration of results of our statistical method of loci determination for a single property. Red indicates pixels that were significantly higher in the presence of alkane.
We created a factorial code so that the color code accounts for all combinations of coding for properties. For n properties, numbers from 0 to n − 1 were assigned to each property. For each pixel, a binary vector bprop ∈ {0, 1}n expresses whether a property was found to be significant or not. The ith position in this vector stands for property i. Each subset was assigned its distinct color. Factorial maps for all properties of cyclization and functional groups, respectively, were too crowded and therefore each are broken into two in order to be better intelligible.
In Figure 2B we show locations responsive to molecular bond properties alkane, alkene, alkyne, and combinations. Figure 2C shows aromatic and alicyclic. There are seven kinds of zones that mark codes for different combinations of properties alkane, alkene, and alkyne. Zones 1, 2, and 4 code for exclusively one of these properties. Zones 3 encodes alkane and alkene, zone 5 alkane and alkyne, zone 6 alkene and alkyne, and finally zone 7 codes for all of the three properties.
Cyclization properties, especially alicyclic, have a moderate but highly significant Pearson correlation (ρ = 0.33, p = 2.05 ×10⁻⁹ between alicyclic and polycyclic, ρ = 0.36, p = 6.72 ×10⁻¹¹ between alicyclic and heterocyclic, and ρ = 0.21, p = 1.95 ×10⁻⁴ between aromatic and heterocyclic). As can be seen in Figures 2C,D, properties aromatic and heterocyclic and properties alicyclic and polycyclic, respectively, project to very similar bulbar regions.
Functional groups did not have such a high covariance. Figure 2E highlights responsive zones for functional group properties amine, ketone, and alcohol–phenol. Figure 2F gives loci for the functional group properties ester + lactone (we put these two properties together), carboxylic acid, and sulfur-containing compound.
We show additional properties in Figure 3. In Figure 3A you can see areas associated with molecular length across the OB. Figure 3B shows carbon numbers.
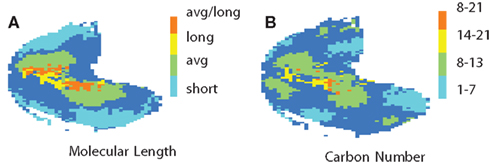
Figure 3. Localization of molecular properties. In (A) you see the molecular length across the OB. See the legend for the color code. (B) Shows carbon numbers. The legend explains the color code.
3.1.1 Size of coding zones
Table 1 shows size of coding zones as estimated by the procedure explained above. From the table it can be seen that aromatic is broadly coded by glomerular activations. Nearly 60% of points showed differences significant at the 5% level. Alkane covers the second biggest area with about 40% of points. Carboxylic acid and ketone are coded by about a third of all points. Coding zones for properties alkene, alicyclic, and heterocyclic extend to between about 20 and 30%. For ester + lactone, alkyne, and alcohol + phenol coding zones we measured between 10 and 16% of total. Properties polycyclic, sulfur-containing compound and amine recruit the smallest zones of compared properties with about 7, 4, and 0.6%, respectively.
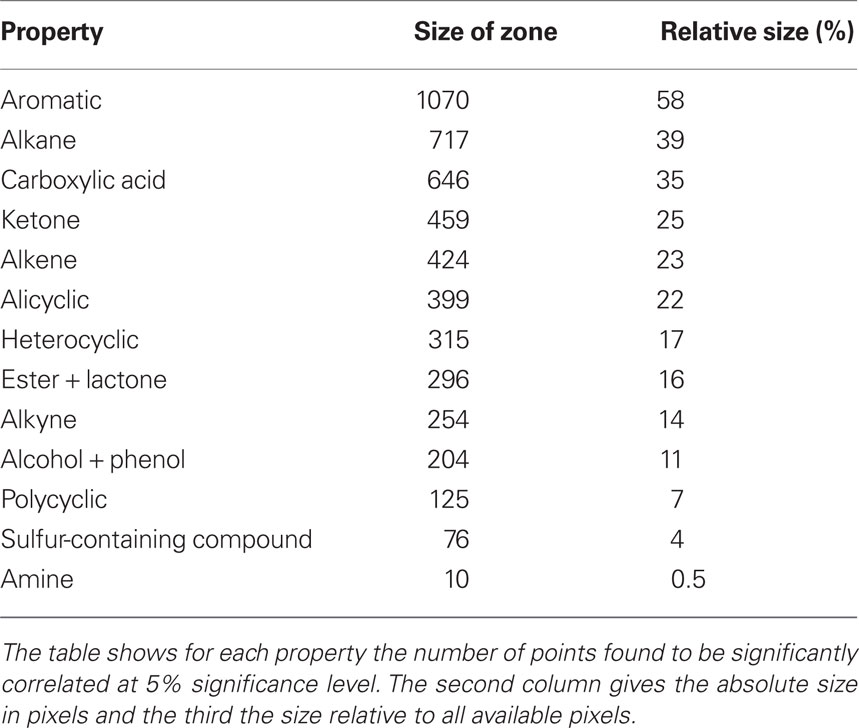
Table 1. Sizes of coding zones.
3.2 Classification
Table 2 ranks properties according to the classification performance (AUC) of the linear SVM. The classification performance is indicated in the second column. It is important to note that Pearson correlation between classification performance and availability of data is low and insignificant (ρ = 0.2, p = 0.5).
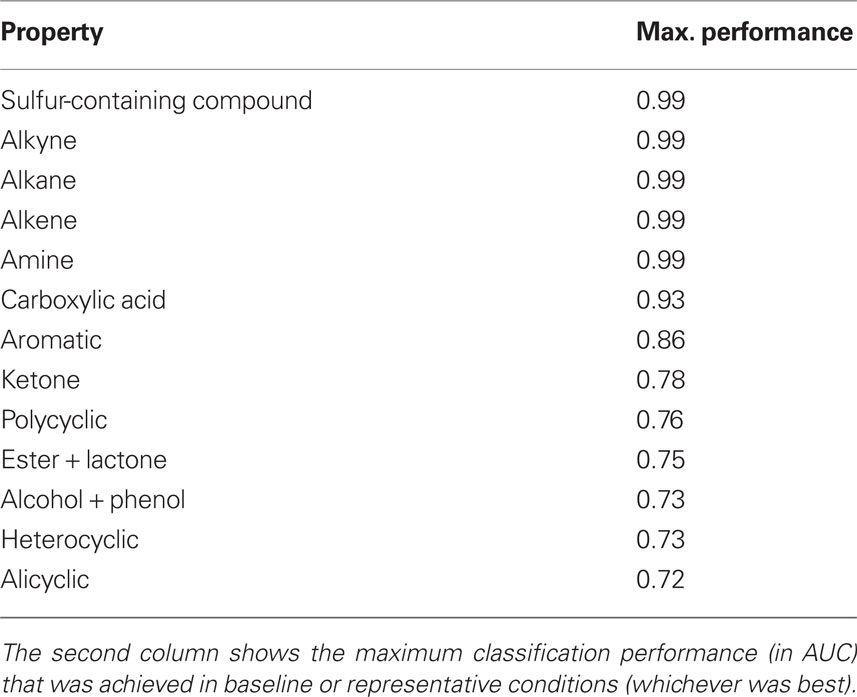
Table 2. Classification performance of odorant properties.
Of the 13 compared properties, sulfur-containing compound, alkyne, alkane, alkene, and amine perform close to ceiling. Classifications of carboxylic acid, aromatic, and ketone also shows good performances. Polycyclic, ester–lactone, the functional group alcohol + phenol, and cyclization properties heterocyclic and alicyclic give mediocre performances.
4 Discussion
We present a statistical procedure for decoding of continuous behavioral properties to investigate coding at the glomerular level of the OB. It consisted of a univariate statistical test, the Wilcoxon rank-sum test within a bootstrap wrapper, and as a multivariate extension, a SVM classification procedure. This brings the advantage systematic and quantitative results in the absence of assumptions of distribution parameter and allows comparison of vectors of unequal lengths. By our method we could map odorant properties to clustered zones and we obtained results for relevance of these properties.
Partly because of space constraints, we only show maps of only several properties in this paper. Figure 2 illustrates the localization of coding zones for properties pertaining to important coding dimensions (as discussed in Johnson and Leon, 2007). Please refer to Figure 1 for anatomical terms of location in the bulb. It has to be mentioned that we did not control for correlation between molecular properties in our study. Long molecules are for example less water soluble. Areas for molecular length correlated highly with respect to co-activation with molecular elongation, surface area, and water solubility (not shown). It is known that carbon number is associated with molecular length, volume, hydrophobicity, among other properties (cf. Johnson and Leon, 2007). In many studies only a small set of odorants is examined at differing concentration levels. A comparison across many studies is therefore not always straightforward, however we think that our results are generally in good agreement with conclusions of several studies, including Johnson and Leon (2007).
It was shown Meister and Bonhoeffer (2001), Rubin and Katz (1999) that many glomeruli are sharply tuned for a small range of chain lengths. Johnson and Leon (2007) conclude there is a progression with increasing carbon number from medial and lateral areas into ventral areas. Our results show (cf. Figure 3B) mostly medial areas for up to seven carbon atoms and ventral areas for 14–21, and ventral–medial areas for molecules of 8–13 carbon atoms.
Leon and Johnson (2009) also describe areas for molecular length consistent with our results (cf. Figure 3A). They indicated that zones in dorsal areas were active for shorter chains while longer molecules activated zones more ventrally. Our results confirm both findings.
Our results for carboxylic acids (cf. Figure 2F) coincide with Johnson and Leon (2007) in locating responsive glomeruli in anterior medial/lateral areas. We also confirm Leon and Johnson’s (2009) result in placing regions for alcohols and phenols in lateral/medial areas, more caudal than regions for carboxylic acids (cf. Figure 2E). We found also areas for esters overlapping with their placement of aliphatic esters (cf. Figure 2F) located in some central medial and lateral areas just next to alcohols. We found another area for esters in caudal areas of lateral and medial bulb. Johnson and Leon (2007) placed a zone for aromatics with O groups and ketones in a dorsal region and one for aromatic hydrocarbons in a dorsal caudal region. We found a large region for aromatics (cf. Figure 2C), mostly dorsal but also medial and lateral, and a region for ketones (cf. Figure 2F) in similar dorsal areas.
4.1 Size of Coding Zone
By extension of our statistical procedure we compared the size of coding zones. We are not aware of other attempts in the literature to quantify sizes of coding areas. It should be cautioned that these results should be interpreted more qualitatively than quantitatively. The thresholding of p-values at certain significance values (here 5%) means that effects of concentration and relevance cannot be completely separated, however presented results could serve to group properties roughly by their coding zones. Results of size go in hand with localization maps shown above to indicate that some encoding of certain properties are specific to some spatial areas.
Size estimates of investigated properties differed largely. The properties for which we found the smallest coding zones are amine and sulfur-containing compound, with roughly 0.5 and 4.1% of recruited area. There are properties which recruit bigger zones and properties that recruit smaller zones.
Larger coding zones could mean that properties are broadly sensed by a range of ORs. In turn, it could be hypothesized that properties with small coding zones could be more directly related to the proposed odotopes, especially so, properties that have high relevance to coding. From the results in Tables 1 and 2, amine, sulfur-containing compound, and alkyne could be such candidates.
4.2 Relevance of Properties
We classified molecular properties by activation of glomerular activations in order to estimate their impact on early olfactory coding. The logic behind is that properties that greatly change activations at the OB level should be easier to classify. Knowing the relevance of molecular properties could provide insight into early coding of chemical information and provide vital clues for discerning which properties are functional in determining the degree of interaction between an OR and odorant molecules. We define relevance as the best classification performance from either most representative points or random baseline whichever was higher.
For some properties, the performance curve from representative points was below baseline at some intervals (compare Figure 4). We think this is due to the imperfect definition of most representative points. The performance of the classification of amine found an early peak at 200 points, stayed at high levels until 600 points before leveling off drastically. The early peak could be explained by a very small area corresponding to amine (compare Table 1) and in fact activation maps for amine looked very different from each other. Taking more points would not provide more information, rather noise, to the classification. We also think that the SVM had difficulties because of only very few data samples corresponding to amine (4 of 308 maps).
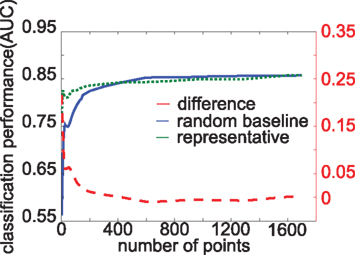
Figure 4. Classification performance for aromatic property. The ordinate stands for the number of sampled points for classification. Curves depict performance in AUC with taking most representative points (solid line), randomly sampled points (dashed line), and the difference between the two (dash-dotted line).
Our classification results indicate that there are some properties that affect odor coding on the OB level very strongly. Most relevant properties are alkyne, alkane, alkene, and amine. From our study, we speculate that these properties could have a very strong impact on olfactory processing in rats. Doleman et al. (1998) suggested that increased olfactory sensitivity for alkylamines or alkylthiols (in humans) as compared with alkanes or alcohols could be accounted for by evolutionary adaptation for detecting decaying food and toxic gases, because amines are associated with harmful putrid food. Activations are very distinct with respect to whether an odorant contained a sulfur functional group or not. Bond saturation, indicative of the reactiveness of compounds, seems also to affect coding very strongly, as we can see in the high performance of alkyne, alkane, and alkene. Carboxylic acid another functional group and aromatic, a cyclization property, still seemed to be quite important. Our results confirm that cyclization, bond saturation, and some functional groups are very important. This is in line with Johnson and Leon (2007), who proposed as important dimensions of molecular properties cyclization, carbon numbers, bond saturation, branching, functional groups, and substitution position.
Our results also partly confirm Yoshida and Mori (2007) who proposed 14 primary odorant categories which could serve to enhance category–profile selectivity. These properties were sulfides, alcohols, methoxypyrazines, 6-carbon and 9-carbon green-odor compounds, aldehydes, ketones, isothiocyanates, terpene hydrocarbons, esters, terpene alcohols, alkylamines, acids, lactones, and phenol and its derivatives. We found that, as for the properties included in this study, sulfides, alcohols–phenol, ketones, ester–lactone, amines, performance was quite good, however our results indicate that other properties such as whether odorants contained a carboxylic acid group or their bond saturation could also be very important.
4.3 Olfactory Coding
There are arguments for spatial, temporal, and spatio-temporal coding in the OB (cf. Leon and Johnson, 2009). Haddad et al. (2010) argued that for reasons of robustness, speed, and in the light of experimental evidence, it is plausible that global and local coding schemes could work together. Our findings confirm previous studies which suggest a labeled-line coding. A hypothesis could be that distances between spatial zone have behavioral correspondences, such as in the case of carbon chain length, which is related to discrimination ability in human subjects Laska and Teubner (1999).
It could be speculated that the observed clustering of properties constitutes an instance of the minimization of wiring length in cortical networks for local processing of feature combinations (cf. Chen et al., 2006). Yaksi and Wilson (2010) provides evidence that local circuity in the antennal lobe, in insects the functional correlate of the OB, could serve for gain control by both contrast enhancement and increase of sensitivity. Along this line, higher recruitment of area could improve signal-to-noise ratio which allows a decrease of detection thresholds, or it could indicate a further specialization of the recruited area. Another hypothesis would be that a smaller area could indicated specialized local feature detectors. From that perspective, for example, our result that both amines and sulfur-containing compounds are represented in a small area of glomeruli could be object of more thorough investigation. In general, further electrophysiological studies could help to corroborate our findings.
5 Conclusion
We find clustered glomerular representations for many molecular properties in a 2-deoxyglucose autoradiography data set of the rat OB. Of the compared molecular properties, presence of alkyne, alkane, alkene, and amine causes big changes in these activation maps as compared to other properties. Properties amine, sulfur-containing compound, and alkyne have small zones and high relevance to activation changes. Properties aromatic, alkane, and carboxylic acid showed biggest zones. Together, results suggest a local spatial encoding for molecular properties.
Conflict of Interest Statement
The authors declare that the research was conducted in the absence of any commercial or financial relationships that could be construed as a potential conflict of interest.
Acknowledgments
The first author was supported by a grant from the federal state government of Catalonia (formació de personal investigador, FI) during most of the study. He gratefully acknowledges the kind help by Bernhard Kaplan in proofreading previous drafts and making many corrections, by Tony Lindeberg, who gave advice during the writing of this paper, and by Timothy Pearce, who made many insightful and critical comments. Both reviewers made many helpful and thoughtful comments and pushed the writing of this paper much further. We further thank Miquel Tarzan for implementing the SVM, which was used in the study. Daniel Calvo assisted in the selection of appropriate chemical properties for this study. The authors thank the group around Michael Leon and Brett Johnson at the University of California at Irvine for collecting and providing the data.
References
Bozza, T., Feinstein, P., Zheng, C., and Mombaerts, P. (2002). Odorant receptor expression defines functional units in the mouse olfactory system. J. Neurosci. 22, 3033.
Bradley, A. (1997). The use of the area under the ROC curve in the evaluation of machine learning algorithms. Pattern Recognit. 30, 1145–1159.
Chen, B. L., Hall, D. H., and Chklovskii, D. B. (2006). Wiring optimization can relate neuronal structure and function. Proc. Natl. Acad. Sci. U.S.A. 103, 4723–4728.
Doleman, B., Severin, E., and Lewis, N. (1998). Trends in odor intensity for human and electronic noses: relative roles of odorant vapor pressure vs. molecularly specific odorant binding. Proc. Natl. Acad. Sci. U.S.A. 95, 5442.
Efron, B. (1982). “The jackknife, the bootstrap and other resampling plans,” in CBMS-NSF Regional Conference Series in Applied Mathematics (Philadelphia: Society for Industrial and Applied Mathematics).
Haddad, R., Khan, R., Takahashi, Y., Mori, K., Harel, D., and Sobel, N. (2008). A metric for odorant comparison. Nat. Methods 5, 425–429.
Haddad, R., Weiss, T., Khan, R., Nadler, B., Mandairon, N., Bensafi, M., Schneidman, E., and Sobel, N. (2010). Global features of neural activity in the olfactory system form a parallel code that predicts olfactory behavior and perception. J. Neurosci. 30, 9017–9026.
Johnson, B., Ho, S., Xu, Z., Yihan, J., Yip, S., Hingco, E., and Leon, M. (2002). Functional mapping of the rat olfactory bulb using diverse odorants reveals modular responses to functional groups and hydrocarbon structural features. J. Comp. Neurol. 449, 180–194.
Johnson, B., Xu, Z., Pancoast, P., Kwok, J., Ong, J., and Leon, M. (2006). Differential specificity in the glomerular response profiles for alicyclic, bicyclic and heterocyclic odorants. J. Comp. Neurol. 499, 1.
Johnson, B. A., Arguello, S., and Leon, M. (2007). Odorants with multiple oxygen-containing functional groups and other odorants with high water solubility preferentially activate posterior olfactory bulb glomeruli. J. Comp. Neurol. 502, 468–482.
Johnson, B. A., and Leon, M. (2007). Chemotopic odorant coding in a mammalian olfactory system. J. Comp. Neurol. 503, 1–34.
Khan, A., Parthasarathy, K., and Bhalla, U. (2010). Odor representations in the mammalian olfactory bulb. Wiley Interdiscip. Rev. Syst. Biol. Med. 2, 603–611.
Kotsiantis, S. B., Zaharakis, I. D., and Pintelas, P. E. (2007). “Supervised machine learning: a review of classification techniques,” in Emerging Artificial Intelligence Applications in Computer Engineering: Real Word AI Systems with Applications in eHealth, HCI, Information Retrieval and Pervasive Technologies, ed. I. Maglogiannis (Amsterdam: Ios Press Inc), 3–24.
Laska, M., and Teubner, P. (1999). Olfactory discrimination ability for homologous series of aliphatic alcohols and aldehydes. Chem. Senses 24, 263.
Leon, M., and Johnson, B. A. (2009). Is there a space-time continuum in olfaction? Cell. Mol. Life Sci. 66, 2135–2150.
Limpert, E., Stahel, W., and Abbt, M. (2001). Log-normal distributions across the sciences: keys and clues. Bioscience 51, 341–352.
Meister, M., and Bonhoeffer, T. (2001). Tuning and topography in an odor map on the rat olfactory bulb. J. Neurosci. 21, 1351.
Miyamichi, K., Amat, F., Moussavi, F., Wang, C., Wickersham, I., Wall, N., Taniguchi, H., Tasic, B., Huang, Z., He, Z., Callaway, E. M., Horowitz, M. A., and Luo, L. (2010). Cortical representations of olfactory input by trans-synaptic tracing. Nature 472, 191–196.
Miyamichi, K., Serizawa, S., Kimura, H. M., and Sakano, H. (2005). Continuous and overlapping expression domains of odorant receptor genes in the olfactory epithelium determine the dorsal/ventral positioning of glomeruli in the olfactory bulb. J. Neurosci. 25, 3586–3592.
Mori, K., Takahashi, Y. K., Igarashi, K. M., and Yamaguchi, M. (2006). Maps of odorant molecular features in the mammalian olfactory bulb. Physiol. Rev. 86, 409–433.
Pearce, T. C., and Gardner, J. W. (2009). “Improved odour detection through imposed biomimetic temporal dynamics,” in Biologically Inspired Signal Processing for Chemical Sensing, eds A. Gutiérrez and S. Marco (Heidelberg: Springer Berlin), 188, 75–91.
Rubin, B., and Katz, L. (1999). Optical imaging of odorant representations in the mammalian olfactory bulb. Neuron 23, 499–511.
Vassar, R., Chao, S. K., Sitcheran, R., Nuñez, J. M., Vosshall, L. B., and Axel, R. (1994). Topographic organization of sensory projections to the olfactory bulb. Cell 79, 981–991.
Yaksi, E., and Wilson, R. I. (2010). Electrical coupling between olfactory glomeruli. Neuron 67, 1034–1047.
Yoshida, I., and Mori, K. (2007). Odorant category profile selectivity of olfactory cortex neurons. J. Neurosci. 27, 9105.
Zhang, X., Zhang, X., and Firestein, S. (2007). Comparative genomics of odorant and pheromone receptor genes in rodents. Genomics 89, 441–450.
Keywords: olfactory coding, olfactory bulb, odorants, glomeruli, property–activity relationship
Citation: Auffarth B, Gutierrez-Galvez A and Marco S (2011) Statistical analysis of coding for molecular properties in the olfactory bulb. Front. Syst. Neurosci. 5:62. doi: 10.3389/fnsys.2011.00062
Received: 22 April 2011;
Accepted: 07 July 2011;
Published online: 18 July 2011.
Edited by:
Federico Bermudez-Rattoni, Universidad Nacional Autónoma de México, MexicoReviewed by:
Stelios M. Smirnakis, Baylor College of Medicine, USARaúl G. Paredes, National University of Mexico, Mexico
Copyright: © 2011 Auffarth, Gutierrez-Galvez and Marco. This is an open-access article subject to a non-exclusive license between the authors and Frontiers Media SA, which permits use, distribution and reproduction in other forums, provided the original authors and source are credited and other Frontiers conditions are complied with.
*Correspondence: Benjamin Auffarth, Department of Computational Biology, School of Computer Science and Communication, Royal Institute of Technology (KTH), Albanova Universitetscentrum, Roslagstullsbacken 35, Stockholm, Sweden. e-mail: auffarth@csc.kth.se