Top-down spatial categorization signal from prefrontal to posterior parietal cortex in the primate
- 1 Instituto de Neurobiología, Universidad Nacional Autónoma de México Campus Juriquilla, Queretaro, México
- 2 Department of Biology, Augsburg College, Minneapolis, MN, USA
- 3 Brain Sciences Center, Department of Veterans Affairs Medical Center, Minneapolis MN, USA
- 4 Biology Department, Augsburg College, Minneapolis, MN,USA
- 5 Department of Neurology, University of Minnesota, Minneapolis, MN, USA
- 6 Department of Psychiatry, University of Minnesota, Minneapolis, MN, USA
- 7 Center for Cognitive Sciences, University of Minnesota, Minneapolis, MN, USA
In the present study we characterized the strength and time course of category-selective responses in prefrontal cortex and area 7a of the posterior parietal cortex during a match-to-sample spatial categorization task. A monkey was trained to categorize whether the height of a horizontal sample bar, presented in rectangular frame at one of three vertical locations, was “high” or “low,” depending on whether its position was above or below the frame’s midline. After the display of this sample bar, and after a delay, choice bars were sequentially flashed in two locations: at the top and at the bottom of the frame (“choice” epoch). If the monkey timed its response to the display of the choice bar that matched the sample bar, he was rewarded. We found that cells in prefrontal cortex discriminated category early after the initial sample bar was shown, and continued to differentiate “up” from “down” trials throughout the delay and choice periods. In contrast, parietal cells did not differentiate category until the choice period. Therefore, our results support the notion of a top-down categorical signal that originates in prefrontal cortex and that is only represented in parietal cortex when it is necessary to express the categorical decision through a movement.
Introduction
Categorization is the process by which sensory stimuli are recognized, differentiated, and placed into groups for some specific purpose. Through this process of abstraction the complex physical attributes of the stimuli in our environment are grouped into meaningful and specific categories that are the building blocks of cognitive processing and knowledge. We are able to categorize stimuli from all sensory modalities, ranging from simple to very abstract categories. Examples include the identity of visual objects, the musical genre of a song, or the taste properties of a wine. Categorization depends on prototypes that define the main attributes of a category and on sharp boundaries between categories, with no gradual transitions (Nosofsky and Stanton, 2005). Consequently, items may be considered as part of the same category even if their physical properties may vary extensively. The mental defining of a category prototype and its boundaries is a dynamic process that is developed through learning and experience, and can be modified by the context (Ashby and Waldron, 1999).
The neurophysiological study of perceptual categorization started in the 1990s with the description of category-specific signals in the supplementary motor cortex (SMA) during the execution of a categorization task of tactile stimuli in the monkey (Romo et al., 1993, 1997). The main properties of category-selective neurons are, first, that their activity differentiates between categories and show a homogenous response within each category; and, second, that their activity mirrors the categorization behavior of the monkeys, namely, that both show sigmoidal functions with clear differences between categories and similar responses within each category. Through the use of receiver-operating characteristic (ROC) analysis from signal detection theory (Green and Sweets, 1966), a direct comparison between neurometric and psychometric categorization curves was possible, and the results showed similar thresholds for both functions in SMA and the basal ganglia (Merchant et al., 1997; Romo et al., 1997).
Since then, many studies have focused on the neural underpinnings of visual object categorization in non-human primates. It has been shown that later stages of the ventral visual stream show different degrees of category-selective responses. The categorization processes seems to start in V4, a structure at an intermediate stage in the ventral stream, where the neurons show selective responses to elemental object features (color or orientation) and can signal the behavioral response category of an attended feature (Mirabella et al., 2007). In addition, it is well known that the inferior temporal (IT) cortex, a higher node in the ventral stream hierarchy, is involved in object recognition and possesses neurons that are tuned to the shape of objects (Gross et al., 1972; Desimone et al., 1984; Logothetis et al., 1995). Interestingly, IT also shows a small group of neurons with responses associated with a shape category, although their activity is also modulated within that category (Vogels, 1999; Freedman et al., 2003; Kiani et al., 2007). In contrast, a large proportion of neurons in prefrontal cortex encodes stimuli according to their category membership, with sharp differences in activity between the two categories that the monkeys were trained to dissociate (cats vs. dogs) and little activity modulation within each category (Freedman et al., 2001, 2002). In fact, category-selective responses in prefrontal cortex have been described not only for visual shape categorization (Freedman et al., 2001), but also for the categorization of numerical quantities (Nieder et al., 2002). Overall, these studies support the notion that the prefrontal cortex is a fundamental node for the categorization process. Indeed, this area is at the top of the hierarchy of the ventral and dorsal visual streams, is connected with the auditory and somesthetic systems, and has strong reciprocal connections with the motor system (Pandya and Yeterian, 1990; Barbas, 2000). Therefore, it has been suggested that the prefrontal cortex is ideally suited to process at the highest levels of cognitive and executive function, including working memory, inhibition of prepotent responses, and the learning and representation of rules and category information (Fuster, 2001; Miller and Cohen, 2001).
On the other hand, category-selective responses have also been recorded in the dorsal stream during visual motion categorization. Many neurons in the lateral intraparietal (LIP) area show a specific increase in discharge rate for visual motion patterns that are considered one category, although they moved in six different contiguous directions (each 45° apart) within that category (Freedman and Assad, 2006). Similarly to prefrontal categorical responses, the neurons in LIP showed similar profiles of activation within the directions of motion in a category and sharp changes in activity between categories. In contrast, the neural activity in the middle temporal (MT) area, an area upstream of LIP in the dorsal visual circuit, showed clear directional tuning to the random dot displays but were not affected by the category used by the monkeys to solve the task. This indicates that MT neurons did not explicitly reflect the category membership of stimuli but showed, instead, a more faithful encoding of visual motion–direction (Freedman and Assad, 2006).
In the present study we characterized the strength and time course of category-selective responses in prefrontal cortex and area 7a of the posterior parietal cortex during a match-to-sample spatial task, where a monkey pressed foot-pedals when a flashing test bar corresponded to an “up” or “down” category of a previously presented sample bar. We found that cells in prefrontal cortex discriminated category early after the spatial stimulus was shown, and continued to differentiate “up” from “down” until the monkey had to make a decision regarding the category of the sample bar. Parietal cells, on the other hand, did not differentiate category until a response had to be made. Therefore, our results support the notion of a top-down categorical signal that originates in prefrontal cortex and that is only represented in parietal cortex when it is necessary to express the categorical decision through an explicit response.
Materials and Methods
Surgery
A male rhesus macaque monkey weighing 7 kg was prepared for neuronal recording using standard aseptic surgical techniques under Isoflurane (1–2%) gas anesthesia. During surgery, three recording chambers (7 mm inner diameter) were implanted: two bilaterally over area 7a in parietal cortices, and one over the principalis sulcus in right prefrontal cortex (see Figure 1C). Additionally, five titanium posts were attached to the skull with titanium screws, and a halo was attached to provide an anchor point to stabilize the head during neural recordings. Analgesia (Buprenex, 0.05 mg/kg BID, i.m.) was provided for the animal for several days after surgery. Care and treatment of the animals conformed to the Principles of Laboratory Animal Care of the NIH. All experimental protocols were approved by the Internal Animal Care and Use Committees of the University of Minnesota and Minneapolis Veterans Affairs Medical Center.
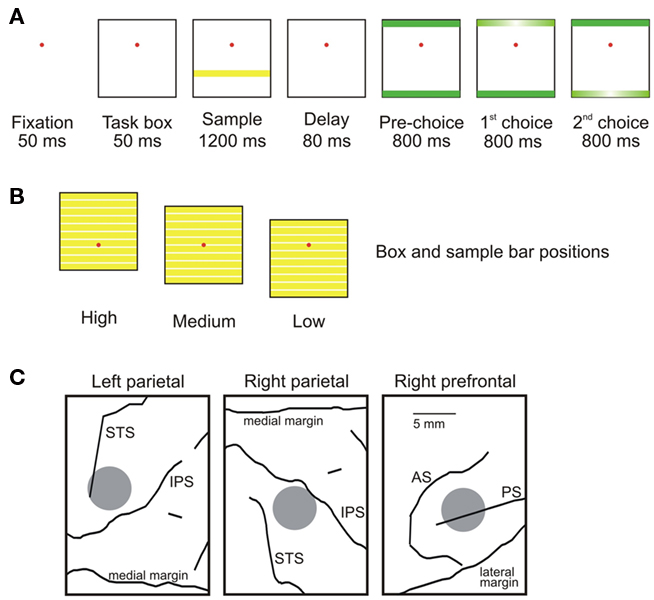
Figure 1. Task and recording. (A) The monkey fixated a spot for 50 ms (“Fixation,” after which a square task box appeared (“Task box”) in one of three vertical locations (above, below, or centered on the fixation spot). Next, a yellow sample bar appeared at 1 of 10 evenly distributed vertical locations within the task box (“Sample”). After a short delay in which only the fixation spot and task box were visible (“Delay”), two green bars appeared at either vertical end of the task box (“Pre-choice”). The monkey’s task was to classify the sample bar as either “up” or “down,” depending on whether it was above or below the (invisible) midline of the task box. It made its choice by responding during one of the choice epochs. After the pre-choice period, one of the two green bars, randomly chosen, began to flash on and off (“first choice,” here the top bar flashes first). If the monkey responded during this epoch, it chose the category indicated by the flashing bar (“up” for the top bar, and “down” for the bottom bar). If the monkey responded during the first choice epoch, the trial ended. If it did not respond during this epoch, the other bar began flashing, giving the monkey the opportunity to choose the other category (“second choice,” here indicating “down,” the correct choice in this trial). If the monkey chose correctly, it was rewarded with a drop of juice. (B) Task box and sample bar positions. Yellow bars within each task box indicate the possible locations of sample bars. Red circles indicate the fixation spot. (C) Recording locations. Gray circles indicate recording locations. STS, superior temporal sulcus; IPS, intraparietal sulcus; AS, arcuate sulcus; PS, principal sulcus.
Neuronal Recordings
The electrical activity of cortical neurons was recorded extracellularly using two independently movable 16-microelectrode matrix systems (Eckhorn system, Thomas Recording, GMbH, Giessen, Germany). Electrical signals were amplified at a gain of 20,000 and filtered (bandpass, 0.5–5 kHz). Action potentials were discriminated offline using standard software (Offline Sorter Plexon Inc). The timing of action potentials was recorded with 40 μs resolution (DAP 5200a data acquisition processor, Microstar Laboratories, Bellevue, WA, USA). Two hundred forty-seven and 215 cells were recorded from right and left area 7a, respectively, and 136 cells were recorded from right prefrontal cortex (see Figure 1C).
Behavioral Task
The monkey’s task was to categorize a sample bar appearing within a square (the “task box”; 20° of visual angle) as either “up” or “down” depending on whether the bar was above or below the vertical center of the box (Figure 1A). A trial began when the monkey fixated a dot at the center of computer monitor. The task box appeared 50 ms later. The vertical position of the box within the screen varied randomly between three locations (above, below, or centered on the fixation point), in different trials (Figure 1B). Then, following a 50-ms delay, a yellow sample bar was displayed for 1200 ms (sample period). The sample bar spanned the width of the task box, and was one tenth its height. The sample bar was randomly placed in 1 of 10 vertical locations within the task box (the five above the midline of the box categorized as “up,” the others as “down”). The sample period was followed by a short delay (80 ms) in which only the task box and fixation point were visible. Next, two green response bars appeared simultaneously at the top and bottom of the task box. After 800 ms (pre-choice period), one of the response bars flashed on and off repeatedly for 800 ms (first choice period). If the monkey did not respond during the first choice period, the other bar then flashed on and off for 800 ms (second choice period; Figure 1A). The order of flashing was randomly determined. To receive a juice reward, the monkey had to press a response key with both feet (with a maximum response delay between the two feet of 50 ms) during the choice period in which the location of the response bar (up or down) matched the category of the sample bar. If the monkey did not maintain fixation within 1° of the fixation spot throughout the trial, the trial was aborted. Ten trials were collected for each sample bar position. The behavioral characterization of monkeys in this task has been published elsewhere (Fortes et al., 2004).
Analysis
We performed analyses of covariance (ANCOVAs) to determine whether neuronal activity varied with task parameters, as follows. The dependent variable was the average firing rate of a cell across trials during one of three epochs (sample, delay, or pre-choice). The covariates were the within-box position of the sample bar, the eye-centered position of the sample bar, the averaged pretrial activity, and the time of recording. The fixed factor was the up/down category of the sample bar. For each cell showing significant effects of category and either within-box or eye-centered position, we calculated a congruity measure, indicating whether the cell’s preference for within-box bar position was the same as the statistically independent effect of bar category. To do so, we compared the mean firing rate of the cell on the top five within-box bar positions to the bottom five within-box positions, indicating a within-box “up” or “down” preference. We then calculated the estimated marginal (i.e., adjusted) means of up/down category from the ANCOVA above, providing an estimate of the independent effects of category. We then compared the preference of each cell in these two cases.
To study the time course of categorical information, we performed ROC analyses. For each cell, we performed ROC analyses using average neural firing rate in 300 ms windows, slid every 100 ms through the trial, to classify the up/down category of the sample bar. In this analysis, ROC curves above the unity (diagonal) line indicated classification of activity to the “up” category, and lines below to the “down” category. We calculated the absolute area between the ROC curve and the unity line (defined as the ROC area) as a representation of a cell’s ability to discriminate the stimulus category. To find the overall representation of category across the population, we averaged the ROC values across groups of cells in a brain area at each time bin. We compared results from analyses using groups that included only cells showing a significant relationship between firing rate and bar category (in either the sample, delay, or pre-choice epochs), and all the recorded cells.
To confirm the ROC analysis results, we also performed a discriminant analysis (Crowe et al., 2008) on the time series data (300 ms bins, sliding every 100 ms). In this analysis, we used the pattern of population activity (firing rates of all cells recorded in each area) to discriminate the category, and each trial was categorized as either being “up” or “down” depending on the population activity. Across trials, the percent correct classification indicates the strength of category representation in the population activity of the cells in a particular brain area. Since there were two alternatives, chance classification was 50%. Results were cross validated using the leave-one-out method. Finally, we performed a similar classification analysis on error trials, using the same time bins as above. In this analysis, the monkey’s choice on each error trial was classified as “up” or “down” based on the activity of ensembles of simultaneously recorded neurons. (We were not able to combine all cells into one analysis because the number and types of error trials varied between recording sessions.)
Results
Behavior
Overall, the monkey performed the task with a success rate of 84.2%. In 8.2% of the trials it incorrectly pressed the pedals during the first choice period, in 7.2% of the trials it incorrectly pressed the pedals during the second choice period, and in 0.4% of the trials, it failed to press the pedals at all during the trial. Figure 2A shows that the monkey’s performance tended to be highest when the sample bar was farther away from the middle of the task box, regardless of the vertical position of the task box. Figure 2B shows that the psychometric curves for each of the three task box positions were very similar, indicating that the monkey was properly performing the relative categorization task at all box positions.
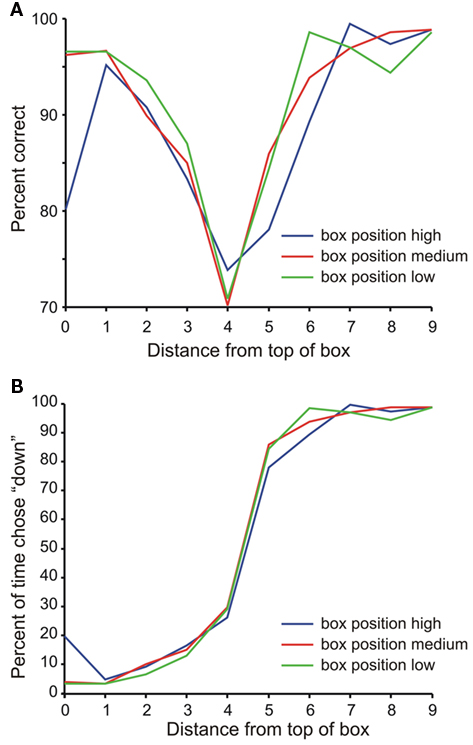
Figure 2. Animal behavior. (A) Performance on the task a function of bar position within the task box. The color of the line indicates the relative position of the task box: blue = high, red = medium, green = low. (B) Psychometric curve of performance. Lines as in (A).
Independent Effects during Task Epochs
We performed an ANCOVA to determine the independent effects of sample bar height, eye-centered position of the bar, and bar category on the firing rates of individual neurons. The results of this analysis are summarized in Table 1. We found that during the sample period 9% of cells in right parietal cortex had firing rates significantly (p < 0.05) related to eye-centered bar position (all noted percentages significantly higher than 5%, z test of proportion). Also during the sample period, the sample bar category had an independent effect on 9% of prefrontal cells. Two prefrontal cell examples significant for category are shown in Figures 3A,B. In addition, Figure 3C shows the average normalized firing rates for the cells with significant effect for category over the overlapping bar positions across the three box positions (up/down category was fully dissociated in box- and eye-centered coordinates for these sample positions). It is clear that these cells show a categorical response for bar position.
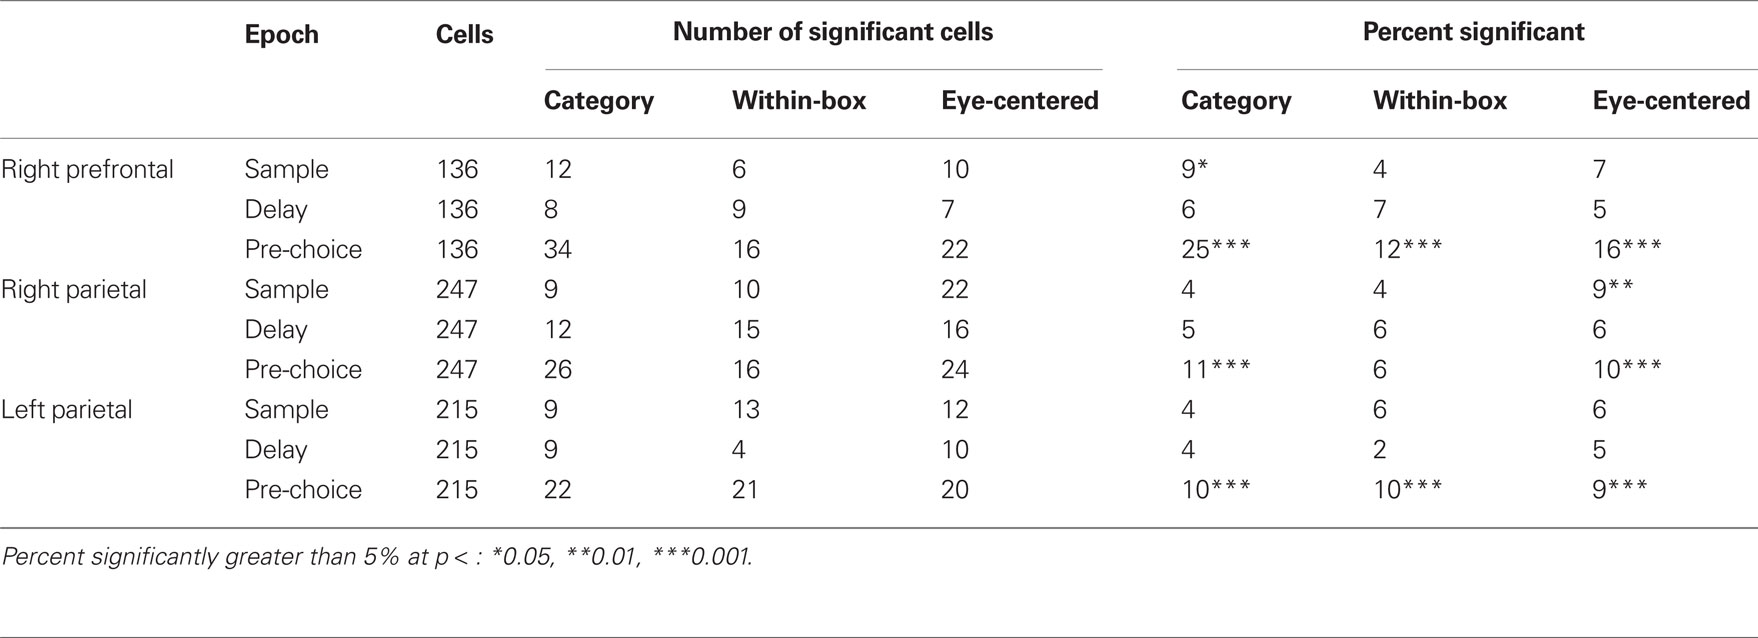
Table 1. Number (left) and percent (right) of significant cells in ANCOVA models where the category, and the within-box and eye-centered position of the sample bar were used as factors, and the discharge rate of cells during the sample, delay and pre-choice epochs was used as dependent variable, across the three studied areas.
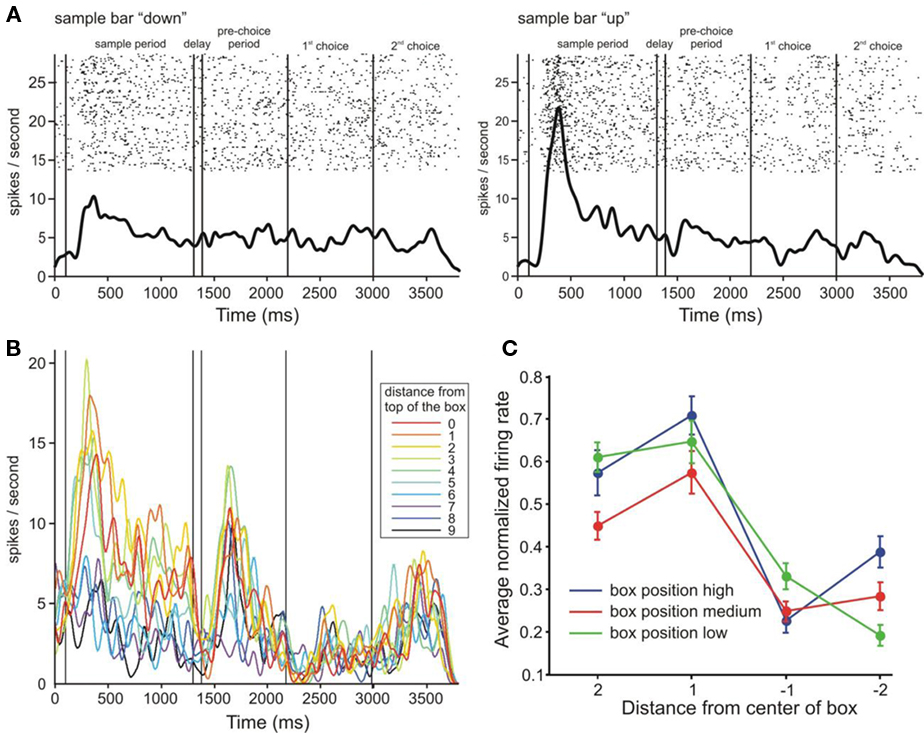
Figure 3. Responses of individual cells and average activity in response to the central sample bars. (A) Raster and spike density functions of a cell grouped by category. Spike density kernel width = 30 ms. (B) Spike density functions of a different cell, averaged across trials of the same bar position as depicted in a color code. Kernel width = 30 ms. (C) Average normalized activity of cells significant for category (across brain areas) in response to presentation of the central four sample bar positions (activity during the sample period). The four central sample bars could all be above or below the fixation point (high and low box positions), or could be split between above and below the fixation point (medium box position). Since categorization was performed with respect to the center of the task box, the up/down categorical and up/down eye-centered positions of these bars were dissociated. Positive numbers on the abscissa indicate sample positions relative to the center of the box, in a cell’s preferred category. Error bars indicate SEM.
During the delay period, the percentage of cells related to any of the factors did not differ from what would be expected by chance, using an alpha level of 0.05 (percentages not significantly different from 5%). During the pre-choice period, more cells showed task-related activity (between 9 and 25% of cells, see Table 1). The number of cells significant for single and multiple predictors are shown in Figure 4. Of those cells significant both for category and within-box position (across epochs and brain areas), 22 of 36 had congruent tuning properties (see Materials and Methods). Of those neurons significant both for category and eye-centered position, 12 of 19 had congruent tuning properties.
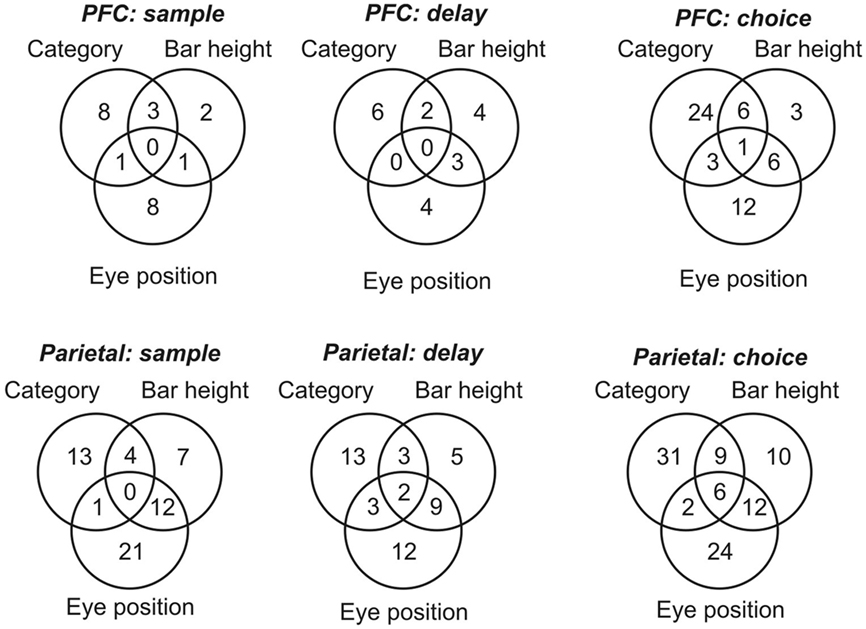
Figure 4. Independent effects of category, eye-centered stimulus position, and within-box stimulus position. Distribution of cells in prefrontal cortex (PFC) and area 7a (Parietal) showing statistically significant variation in firing rate in response to single or multiple stimulus parameters, during three task epochs: sample, delay, and choice periods. Circles are not to scale.
Timing of Category Representation
To determine the time course of category representation, we performed an ROC analysis, discriminating the spatial category in 300 ms windows, sliding every 100 ms. First, we performed this analysis using only those cells that showed a significant effect of category in any epoch up to the pre-choice period (Figure 5A). We found that neurons in prefrontal cortex discriminated category early after the initial sample bar was shown, and continued to differentiate “up” from “down” trials throughout the delay, pre-choice, and choice epochs. Parietal cells, on the other hand, did not differentiate category until the pre-choice period. Prefrontal ROC values were consistently significantly higher than those of parietal cells, starting early in the trial (t-test, p < 0.05, diamonds and circles in Figure 5). For comparison, average ROC time courses for the entire population of cells in each area are shown in Figure 5B. We also performed the ROC analysis separately on trials in which the task box was in the high, middle, or low position on the screen (Figure 6), using the same cells as in Figure 5A. The results of these analyses were similar to each other, and to the combined data (Figure 5A).
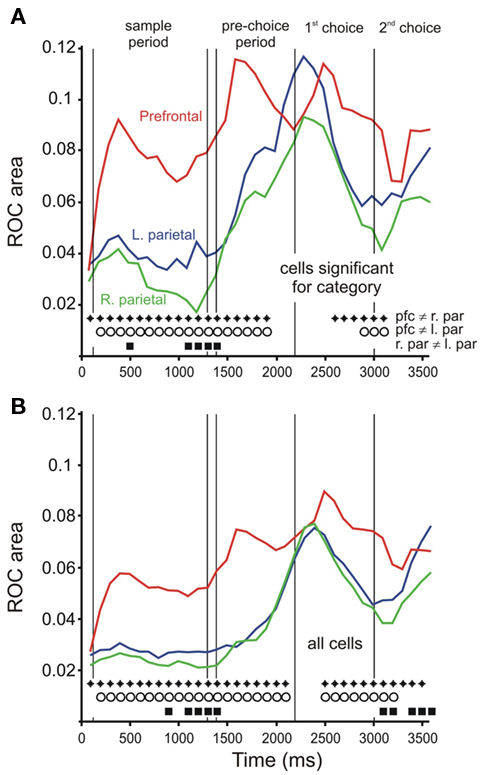
Figure 5. Time course of category signal: ROC analysis. (A) Time course of ROC values over time for cells showing activity in sample, delay, or pre-choice epochs that showed a significant relationship to bar category. The ROC value is defined as the area between the ROC curve and the unity line, and are calculated as the absolute value of (the area under the ROC curve minus 0.5). Line color indicates brain area: red = right prefrontal (N = 42 cells), green = right parietal (N = 46), blue = left parietal (N = 39). Symbols at the bottom of the figure indicate time bins in which ROC values differed significantly between brain areas (two-tailed t-test, p < 0.05; diamonds: prefrontal ≠ right parietal, circles: prefrontal ≠ left parietal, squares: left ≠ right parietal. (B) Time course of ROC values for all cells. Line colors and symbols as in (A). (N = 136, 247, and 215 for right prefrontal, right parietal, and left parietal, respectively.)
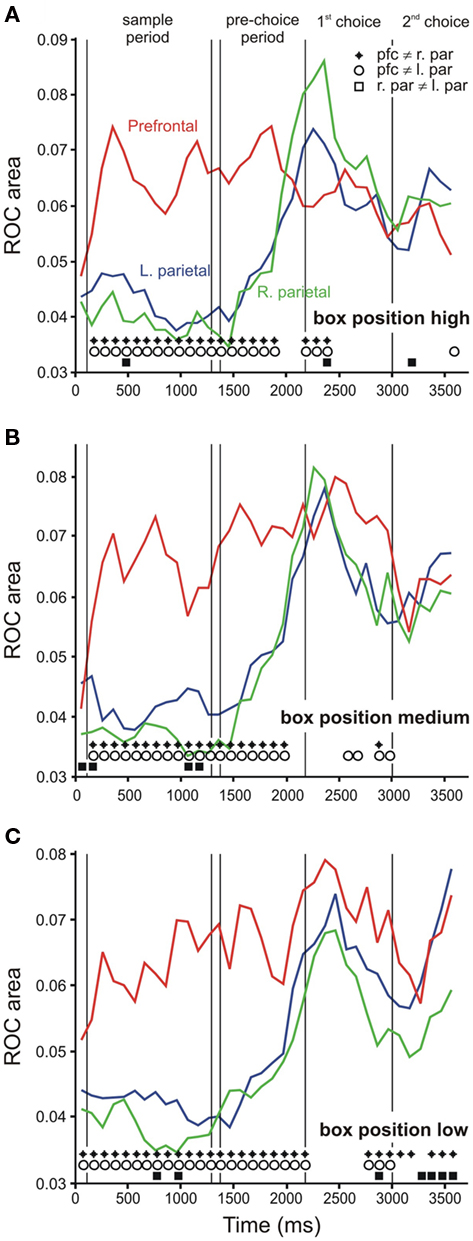
Figure 6. Receiver-operating characteristic analysis for each task box position. (A) Time course of ROC values when the task box was in the high position, the middle position (B) and the low position (C). Line color indicates brain area: red = right prefrontal (N = 42 cells), green = right parietal (N = 46), blue = left parietal (N = 39). Symbols at the bottom of the figure indicate time bins in which ROC values differed significantly between brain areas (two-tailed t-test, p < 0.05; diamonds: prefrontal right parietal, circles: prefrontal left parietal, squares: left right parietal).
As another way of examining the time course of category representation, we also performed a discriminant analysis on population data (Crowe et al., 2008). In this analysis, we classified each trial as either “up” or “down” based on the pattern of firing rates across a neural population. The percentage of trials correctly classified is a measure of the strength of the category signal within the neural population. We performed this analysis on 300 ms bins of data, sliding every 100 ms. The results of this analysis (Figure 7) were very similar to those of the ROC analyses, with prefrontal cortex representing category soon after the sample bar appeared, and both left and right area 7a populations beginning to represent category during the pre-choice period. Activity in prefrontal cortex consistently classified category better than parietal activity, starting early in the trial (z test of two proportions, p < 0.05, diamonds and circles in Figure 7).
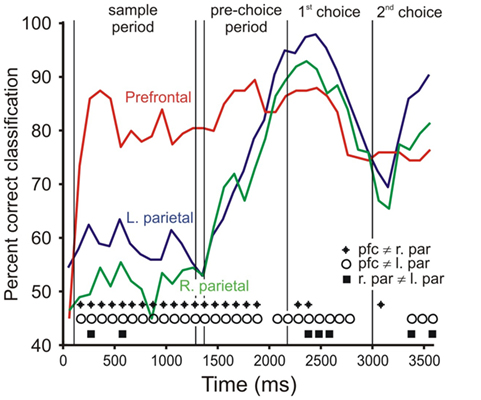
Figure 7. Time course of category signal: discriminant analysis. Values indicate the percent of trials correctly classified as either “up” or “down” using neural population activity in 300 ms bins. Chance classification is 50%. The populations include all cells recorded from each brain area. Line color indicates brain area: red = right prefrontal (N = 136 cells), green = right parietal (N = 247), blue = left parietal (N = 215). Symbols at the bottom of the figure indicate time bins in which classification percentage differed significantly between brain areas (two-tailed z test of two proportions, p < 0.05; diamonds: prefrontal ≠ right parietal, circles: prefrontal ≠ left parietal, squares: left ≠ right parietal).
Finally, it is important to emphasize that during error trials, neural activity in prefrontal cortex was related to the monkey’s choice, starting early in the trial. Figure 8 shows the results of a decoding analysis applied to error trials, in which patterns of neural activity were used to classify the monkey’s choice on these trials. On over half of the bins preceding the pre-choice period, classification percent using prefrontal activity was significantly above chance (Figure 8, diamonds, z test of proportion, against 50%, p < 0.05). Activity in parietal cortex was much less strongly related to the choice during these trials, although parietal classification tended to be significantly higher than chance later in the trial (Figure 8, circles and squares for left and right parietal, respectively).
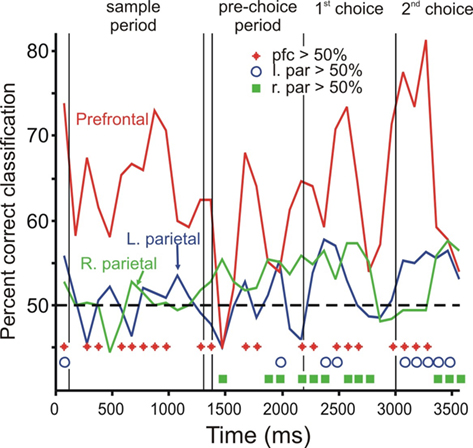
Figure 8. Discriminant analysis time course on error trials. Time course of classification of category on incorrect trials. Values indicate the percent correct classification of the monkey’s choices on error trials, using neural population activity in 300 ms bins. Line color indicates brain area: red = right prefrontal, green = right parietal, blue = left parietal. Symbols at the bottom of the figure indicate time bins in which classification percentage differed significantly between brain areas (one-tailed z test of proportion, against 50%, p < 0.05; diamonds: prefrontal > 50%, circles: left parietal > 50%, squares: right parietal > 50%).
Discussion
The findings of the present study suggest that prefrontal cortex provides an early top-down category signal of spatial information, and that this signal does not emerge in parietal area 7a with great strength until the monkey must express its categorical decision through a movement. To our knowledge, this is among the first evidence that the neural representation of a spatial category may start in prefrontal cortex, although this relationship is under current exploration elsewhere (Chafee et al., 2009). This neural signal, which shows all the properties of the category-selective responses reported previously (Freedman et al., 2001, 2002, 2003; Nieder et al., 2002;), is not associated with the actual position of the sample bar that is being categorized, since the frame of the sample bar changed its vertical position from trial to trial. Similar properties have been described in this area during a relative categorization task of spatial distances (Genovesio et al., 2011). Interestingly, the time course of the category-selective responses indicates that the categorical information, which is present early in prefrontal cortex during the presentation of the sample bar, is also kept in this area throughout the delay, pre-choice, and choice periods, suggesting a working memory representation of the up/down category. Area 7a may have access to this abstract information when the animal needs to press the pedals to indicate whether the sample bar was assigned to the “up” or “down” category.
In a split-brain experiment with an absence of ipsilateral bottom-up visual inputs, single IT neurons are activated by prefrontal top-down signals, which convey information about the shape category of a visual object cue (Tomita et al., 1999). The strong representation of categorical information in prefrontal cortex (Freedman et al., 2001) is processed in IT after the neurons in this area respond to the visual object features coming directly from bottom-up structures (Tomita et al., 1999). Thus, IT is well suited to use both incoming sensory and top-down prefrontal mnemonic categorical information during the categorization of visual shapes. Our results show a different scenario for the dorsal visual stream. The categorical signal is strongly represented in prefrontal cortex whereas it is almost absent in area 7a during the presentation of the spatial stimulus that should be categorized. These findings, combined with the relatively strong early effect of eye-centered bar position on 7a cells (see Table 1), suggest that area 7a, which has shown to be involved in spatial cognition and visual motion processing (Merchant et al., 2001, 2003; Crowe et al., 2005, 2008, 2010; Chafee et al., 2007), is more involved in the representation of the actual horizontal position of the sample bar in the visual field but not its categorical membership early in the trial. The fact that this area has no access to the top-down signal from prefrontal cortex during the sample bar presentation may indicate that a parieto-prefrontal loop of information transfer is not necessary for the spatial representation of the sample bar and its assignment to a particular category in our match-to-sample task. However, area 7a appears to show early category signals, though lagging those in prefrontal, in other spatial categorization tasks (Chafee et al., 2009). Nevertheless, another possibility is that other areas of the posterior parietal cortex, including LIP, may start to show category-selective activity in our task during the stimulus presentation, and may have a tighter functional coupling with prefrontal cortex during this crucial epoch of the task.
The studies on a delayed-match-to-category task of “cats” and “dogs,” where monkeys required to indicate whether two successively presented sample and test stimuli (separated by a 1-s delay) were in the same category, showed that the prefrontal category-selective responses followed a time course of activation that was similar to the one observed in the present study (Meyers et al., 2008). This implies that, at the neuronal population level, the information about the stimulus category is high during the sample and test (choice in our task) periods, and, although smaller, also has an important magnitude during the delay (Meyers et al., 2008). In fact, in our case, the strength of the categorical information in prefrontal cortex is maintained across the sample, delay, pre-choice, and first choice periods (Figures 4–6). These findings suggest that the initial representation of the spatial category of the sample stimulus is maintained in working memory in prefrontal cortex until the monkey has information about the test stimulus position, in order to generate a decision and the corresponding execution or withholding of the response. A similar process has been described for prefrontal and premotor areas during a flutter discrimination task (Hernández et al., 2010).
A recent paper demonstrated that monkeys with a bilateral removal of prefrontal cortex can learn to categorize visual objects and can generalize the perceptual categories of related visual stimuli without explicit instruction (Minamimoto et al., 2010). These findings suggest that visual object categorization occurs at an earlier stage of feed-forward processing, presumably in temporal cortex, without top-down information from prefrontal cortex. In contrast, our results show a strong top-down signal from prefrontal to parietal cortex during spatial categorization. This contradiction could be explained in two ways. First, spatial but no visual object categorization depends on a top-down signal from prefrontal cortex and, second, the prefrontal top-down signal of categorical information is important but not essential for the overall categorization process.
The representation of the categorical membership of the sample bar increased in area 7a just before the end of the pre-choice period, and peaked during the initial part of the first choice epoch (Figures 4–6). This profile of activation suggests that area 7a is involved in the categorical decision and the implementation of a visuomotor command for the timing of the bilateral foot pedal response. Indeed, area 7a is part of the parieto-premotor circuits (Caminiti et al., 2010) and has been involved in the encoding of a complex command signals that trigger reactive or predictive motor actions during reaching or interception tasks (Merchant et al., 2004; Battaglia-Mayer et al., 2005, 2007; Merchant and Georgopoulos, 2006).
It is important to mention that in the present study two different analyses (ROC curves and discriminant analysis), which have different sets of assumptions and procedures to separate the “up” and “down” cell response distributions, provided similar time courses of parietal and prefrontal category representation. These findings strengthen our conclusions and demonstrate that the temporal profile of activation of category-selective responses is robust in the two studied areas.
Conflict of Interest Statement
The authors declare that the research was conducted in the absence of any commercial or financial relationships that could be construed as a potential conflict of interest.
Acknowledgments
This work was supported by USPHS grant NS17413, the US Department of Veterans Affairs, and the American Legion Brain Sciences Chair. Dr. Hugo Merchant was supported by PAPIIT: IN209305, and CONACYT 053944.
References
Ashby, F. G., and Waldron, E. M. (1999). On the nature of implicit categorization. Psychon. Bull. Rev. 6, 363–378.
Barbas, H. (2000). Connections underlying the synthesis of cognition, memory, and emotion in primate prefrontal cortices. Brain Res. Bull. 52, 319–330.
Battaglia-Mayer, A., Mascaro, M., Brunamonti, E., and Caminiti, R. (2005). The over-representation of contralateral space in parietal cortex: a positive image of directional motor components of neglect? Cereb. Cortex 15, 514–525.
Battaglia-Mayer, A., Mascaro, M., and Caminiti, R. (2007). Temporal evolution and strength of neural activity in parietal cortex during eye and hand movements. Cereb. Cortex 17, 1350–1363.
Caminiti, R., Chafee, M. V., Battaglia-Mayer, A., Averbeck, B. B., Crowe, D. A., and Georgopoulos, A. P. (2010). Understanding the parietal lobe syndrome from a neurophysiological and evolutionary perspective. Eur. J. Neurosci. 31, 2320–2340.
Chafee, M. V., Averbeck, B. B., and Crowe, D. A. (2007). Representing spatial relationships in posterior parietal cortex: single neurons code object-referenced position. Cereb. Cortex 17, 2914–2932.
Chafee, M. V., Jain, S., and Blackmam, R. (2009). “Localizing the origin of executive control over distributed processing to prefrontal cortex,” in Frontiers in Systems Neuroscience. Conference Abstract: Computational and Systems Neuroscience, Salt Lake City, UT.
Crowe, D. A., Averbeck, B. B., and Chafee, M. V. (2008). Neural ensemble decoding reveals a correlate of viewer- to object-centered spatial transformation in monkey parietal cortex. J. Neurosci. 28, 5218–5228.
Crowe, D. A., Averbeck, B. B., and Chafee, M. V. (2010). Rapid sequences of population activity patterns dynamically encode task-critical spatial information in parietal cortex. J. Neurosci. 30, 11640–11653.
Crowe, D. A., Averbeck, B. B., Chafee, M. V., and Georgopoulos, A. P. (2005). Dynamics of parietal neural activity during spatial cognitive processing. Neuron 47, 885–891.
Desimone, R., Albright, T. D., Gross, C. G., and Bruce, C. (1984). Stimulus selective properties of inferior temporal neurons in the macaque. J. Neurosci. 4, 2051–2062.
Fortes, A. F., Merchant, H., and Georgopoulos, A. P. (2004). Comparative and categorical spatial judgments in the monkey: “high” and “low.” Anim. Cogn. 7, 101–108.
Freedman, D. J., and Assad, J. A. (2006). Experience-dependent representation of visual categories in parietal cortex. Nature 443, 85–88.
Freedman, D. J., Riesenhuber, M., Poggio, T., and Miller, E. K. (2001). Categorical representation of visual stimuli in the primate prefrontal cortex. Science 291, 312–316.
Freedman, D. J., Riesenhuber, M., Poggio, T., and Miller, E. K. (2002). Visual categorization and the primate prefrontal cortex: neurophysiology and behavior. J. Neurophysiol. 88, 914–928.
Freedman, D. J., Riesenhuber, M., Poggio, T., and Miller, E. K. (2003). A comparison of primate prefrontal and inferior temporal cortices during visual categorization. J. Neurosci. 23, 5235–5246.
Fuster, J. M. (2001). The prefrontal cortex – an update: time is of the essence. Neuron 30, 319–333.
Genovesio, A., Tsujimoto, S., and Wise, S. P. (2011). Prefrontal cortex activity during the discrimination of relative distance. J. Neurosci. 31, 3968–3980
Gross, C. G., Rocha-Miranda, C. E., and Bender, D. B. (1972). Visual properties of neurons in inferotemporal cortex of the macaque. J. Neurophysiol. 35, 96–111.
Hernández, A., Nácher, V., Luna, R., Zainos, A., Lemus, L., Alvarez, M., Vázquez, Y., Camarillo, L., and Romo, R. (2010). Decoding a perceptual decision process across cortex. Neuron 66, 300–314.
Kiani, R., Esteky, H., Mirpour, K., and Tanaka, K. (2007). Object category structure in response patterns of neuronal population in monkey inferior temporal cortex. J. Neurophysiol. 97, 4296–4309.
Logothetis, N. K., Pauls, J., and Poggio, T. (1995). Shape representation in the inferior temporal cortex of monkeys. Curr. Biol. 5, 552–563.
Merchant, H., Battaglia-Mayer, A., and Georgopoulos, A. P. (2001). Effects of optic flow in motor cortex and area 7a. J. Neurophysiol. 86, 1937–1954.
Merchant, H., Battaglia-Mayer, A., and Georgopoulos, A. P. (2003). Functional organization of parietal neuronal responses to optic flow stimuli. J. Neurophysiol. 90, 675–682.
Merchant, H., Battaglia-Mayer, A., and Georgopoulos, A. P. (2004). Neural responses during interception of real and apparent circularly moving targets in motor cortex and area 7a. Cereb. Cortex 14, 314–331.
Merchant, H., and Georgopoulos, A. P. (2006). Neurophysiology of perceptual and motor aspects of interception. J. Neurophysiol. 95, 1–13.
Merchant, H., Zainos, A., Hernández, A., Salinas, E., and Romo, R. (1997). Functional properties of primate putamen neurons during the categorization of tactile stimuli. J. Neurophysiol. 77, 1132–1154.
Meyers, E. M., Freedman, D. J., Kreiman, G., Miller, E. K., and Poggio, T. (2008). Dynamic population coding of category information in inferior temporal and prefrontal cortex. J. Neurophysiol. 100, 1407–1419.
Miller, E. K., and Cohen, J. D. (2001). An integrative theory of prefrontal cortex function. Annu. Rev. Neurosci. 24, 167–202.
Minamimoto, T., Saunders, R. C., and Richmond, B. J. (2010). Monkeys quickly learn and generalize visual categories without lateral prefrontal cortex. Neuron 66, 501–507.
Mirabella, G., Bertini, G., Samengo, I., Kilavik, B. E., Frilli, D., Della Libera, C., and Chelazzi, L. (2007). Neurons in area V4 of the macaque translate attended visual features into behaviorally relevant categories. Neuron 54, 303–318.
Nieder, A., Freedman, D. J., and Miller, E. K. (2002). Representation of the quantity of visual items in the primate prefrontal cortex. Science 297, 1708–1711.
Nosofsky, R. M., and Stanton, R. D. (2005). Speeded classification in a probabilistic category structure: contrasting exemplar-retrieval, decision-boundary, and prototype models. J. Exp. Psychol. Hum. Percept. Perform. 31, 608–629.
Pandya, D. N., and Yeterian, E. H. (1990). Prefrontal cortex in relation to other cortical areas in rhesus monkey: architecture and connections. Prog. Brain Res. 85, 63–94.
Romo, R., Merchant, H., Zainos, A., and Hernández, A. (1997). Categorical perception of somesthetic stimuli: psychophysical measurements correlated with neuronal events in primate medial premotor cortex. Cereb. Cortex 7, 317–326.
Romo, R., Ruiz, S., Crespo, P., Zainos, A., and Merchant, H. (1993). Representation of tactile signals in primate supplementary motor area. J. Neurophysiol. 70, 2690–2694.
Tomita, H., Ohbayashi, M., Nakahara, K., Hasegawa, I., and Miyashita, Y. (1999). Top-down signal from prefrontal cortex in executive control of memory retrieval. Nature 401, 699–703.
Keywords: neurophysiology of categorization, prefrontal cortex, posterior parietal cortex, rhesus monkey, ROC analysis
Citation: Merchant H, Crowe DA, Robertson MS, Fortes AF and Georgopoulos AP (2011) Top-down spatial categorization signal from prefrontal to posterior parietal cortex in the primate. Front. Syst. Neurosci. 5:69. doi: 10.3389/fnsys.2011.00069
Received: 03 May 2011; Accepted: 02 August 2011;
Published online: 24 August 2011.
Edited by:
Raphael Pinaud, University of Oklahoma Health Sciences Center, USAReviewed by:
Aldo Genovesio, La Sapienza, ItalyBruno B. Averbeck, National Insitute of Mental Health, USA
Copyright: © 2011 Merchant, Crowe, Robertson, Fortes and Georgopoulos. This is an open-access article subject to a non-exclusive license between the authors and Frontiers Media SA, which permits use, distribution and reproduction in other forums, provided the original authors and source are credited and other Frontiers conditions are complied with.
*Correspondence: Apostolos P. Georgopoulos, Brain Sciences Center (11B), Department of Veterans Affairs Medical Center, One Veterans Drive, Minneapolis, MN 55417, USA. e-mail: omega@umn.edu; Hugo Merchant, Instituto de Neurobiología, Universidad Nacional Autónoma de México Campus Juriquilla, Querétaro, Querétaro 76230, México. e-mail: hugomerchant@unam.mx