Adaptive locomotor behavior in larval zebrafish
- Department of Molecular and Cellular Biology, Harvard University, Cambridge, MA, USA
In this study we report that larval zebrafish display adaptive locomotor output that can be driven by unexpected visual feedback. We develop a new assay that addresses visuomotor integration in restrained larval zebrafish. The assay involves a closed-loop environment in which the visual feedback a larva receives depends on its own motor output in a way that resembles freely swimming conditions. The experimenter can control the gain of this closed feedback loop, so that following a given motor output the larva experiences more or less visual feedback depending on whether the gain is high or low. We show that increases and decreases in this gain setting result in adaptive changes in behavior that lead to a generalized decrease or increase of motor output, respectively. Our behavioral analysis shows that both the duration and tail beat frequency of individual swim bouts can be modified, as well as the frequency with which bouts are elicited. These changes can be implemented rapidly, following an exposure to a new gain of just 175 ms. In addition, modifications in some behavioral parameters accumulate over tens of seconds and effects last for at least 30 s from trial to trial. These results suggest that larvae establish an internal representation of the visual feedback expected from a given motor output and that the behavioral modifications are driven by an error signal that arises from the discrepancy between this expectation and the actual visual feedback. The assay we develop presents a unique possibility for studying visuomotor integration using imaging techniques available in the larval zebrafish.
Introduction
Sensorimotor integration comprises a central topic in systems neuroscience: how do brains generate behavior in response to sensory stimuli and what mechanisms exist in the brain to both learn new behaviors and to continuously reevaluate and recalibrate existing ones to ensure the success of the organism? One way to gain insight into this problem is to develop assays that provide full control of the stimulus presented, allow for a detailed and quantitative description of the resulting behavior and in addition present the experimenter with the possibility of perturbing and manipulating this input–output relation to probe the brain. Our understanding in the field of motor learning, for example, is largely based on assays such as eyelid conditioning in rabbits and mice (Thompson, 1986; Thompson and Krupa, 1995), the vestibulo-ocular reflex (VOR; Miles and Lisberger, 1981; duLac et al., 1995) and smooth pursuit eye movements in primates (Lisberger et al., 1987; Keller and Heinen, 1991), all of which satisfy these criteria. Recent behavioral studies using these paradigms (Boyden and Raymond, 2003; Yang and Lisberger, 2010) have shown that motor learning involves a conglomerate of mechanisms that act at various time-scales. These assays are particularly interesting when they simultaneously allow us to monitor neuronal activity in vivo: the circuitry underlying motor learning has been studied using mainly electrophysiological recordings and it is clear that the cerebellum plays a prominent role (Lisberger, 1988; Raymond et al., 1996) and that plasticity occurs at many (if not all) of the synapses within the circuitry (Carey and Lisberger, 2002; Boyden et al., 2004).
In this study we aim to test the hypothesis that larval zebrafish modify their locomotor behavior depending on the visual feedback they receive in response to their swimming. In addition we wish to investigate whether these behavioral changes compensate for the difference in feedback, namely, whether larvae will generally increase their motor output when they experience reduced whole-field motion and vice-versa. This would be the case if the behavioral changes were driven by a discrepancy between the expected and actual visual feedback received and would indicate that these modifications arise as a form of motor learning. In order to test these hypotheses we develop an assay that, as described below, allows a comprehensive quantification of behavior.
There is a tremendous incentive to study sensorimotor integration in restrained assays in larval zebrafish as this vertebrate model system has unique qualities. It exhibits robust stimulus triggered behaviors (Portugues and Engert, 2009) and its small size and translucency, which allow us to functionally monitor the entire brain, coupled with available genetic techniques, have recently been exploited in a variety of powerful imaging studies that aim to dissect the brain circuits underlying behavior (Orger et al., 2008; Sumbre et al., 2008; Del Bene et al., 2010; Miri et al., 2011) including classical conditioning (Aizenberg and Shuman, 2011). By describing the behavior in detail, this study constitutes the first step in adding sensorimotor integration and motor learning to this list.
The assay we develop is based on the optomotor response (OMR), which is a robust and innate behavior. When presented with a whole-field moving visual stimulus larval zebrafish will turn and swim in the direction of perceived motion (Neuhauss et al., 1999; Orger et al., 2000, 2008). The behavior can be consistently elicited in head-restrained larvae for several hours with a square wave black and white grating moving in the caudal to rostral direction. These larvae are immobilized but are free to beat their tail as they would do when swimming freely, which makes this setup similar to other tethered preparations (Goetz, 1964; Dombeck et al., 2007). By using high-speed imaging, this swimming behavior can be monitored and the visual stimulus can be updated in real-time to reflect the larva’s behavior: the grating can be made to decelerate while the larva swims, thus mimicking freely swimming conditions and providing a so called closed-loop environment. In this assay the experimenter has control of the gain, which determines how to translate the larva’s swimming into a deceleration of the grating. We use this ability to perturb the system in order to study what behavioral modifications are observed with the hope of making inferences about the underlying circuitry involved.
When larval zebrafish swim they do so by performing discrete bouts, which comprise multiple oscillations of the tail, separated by quiescent periods termed interbouts, during which the tail does not move (Budick and O’Malley, 2000). A particular strength of our assay is that the behavior is described in terms of natural and well-defined variables that are precisely quantifiable. This allows us to clearly observe measureable behavioral modifications that correlate with gain changes and indicate that larval zebrafish integrate both visual (sensory) and motor (efferent) information and modify their locomotor output accordingly.
Materials and Methods
Embedding and Imaging Larvae
Experiments were performed on wild-type zebrafish larvae of the strain AB at 6 or 7 days post fertilization. Larvae were tested individually. Each larva was embedded in low melting point agarose in a 35 mm Petri dish. After allowing the agarose to set, the dish was filled with Harvard zebrafish facility system fish water and the agarose around the tail was removed with a scalpel: the larva was restrained with its tail free to move (Figure 1A). We will refer to this tail-free embedding as a head-restrained preparation (O’Malley et al., 2004). The Petri dish was then placed on a screen such that the larva was situated 5 mm above the screen. The screen and Petri dish were illuminated from below with infrared (IR) light. A square wave grating with a spatial period of 10 mm and 100% contrast (darkest and lightest pixels possible) was projected onto the screen using a DLP (Optoma EP719) projector. Larvae were imaged through a 2× objective and an IR-pass filter at 350 frames per second with an IR-sensitive, high-speed Mikrotron camera, and 0.3 ms shutter speed. These high-speed movies constitute the raw data saved during the experiment. In addition we also recorded the stimulus parameters (grating speed) and gain throughout the experiment. Acquisition and stimulus presentation were both controlled by the same program, custom written in LabVIEW (National Instruments).
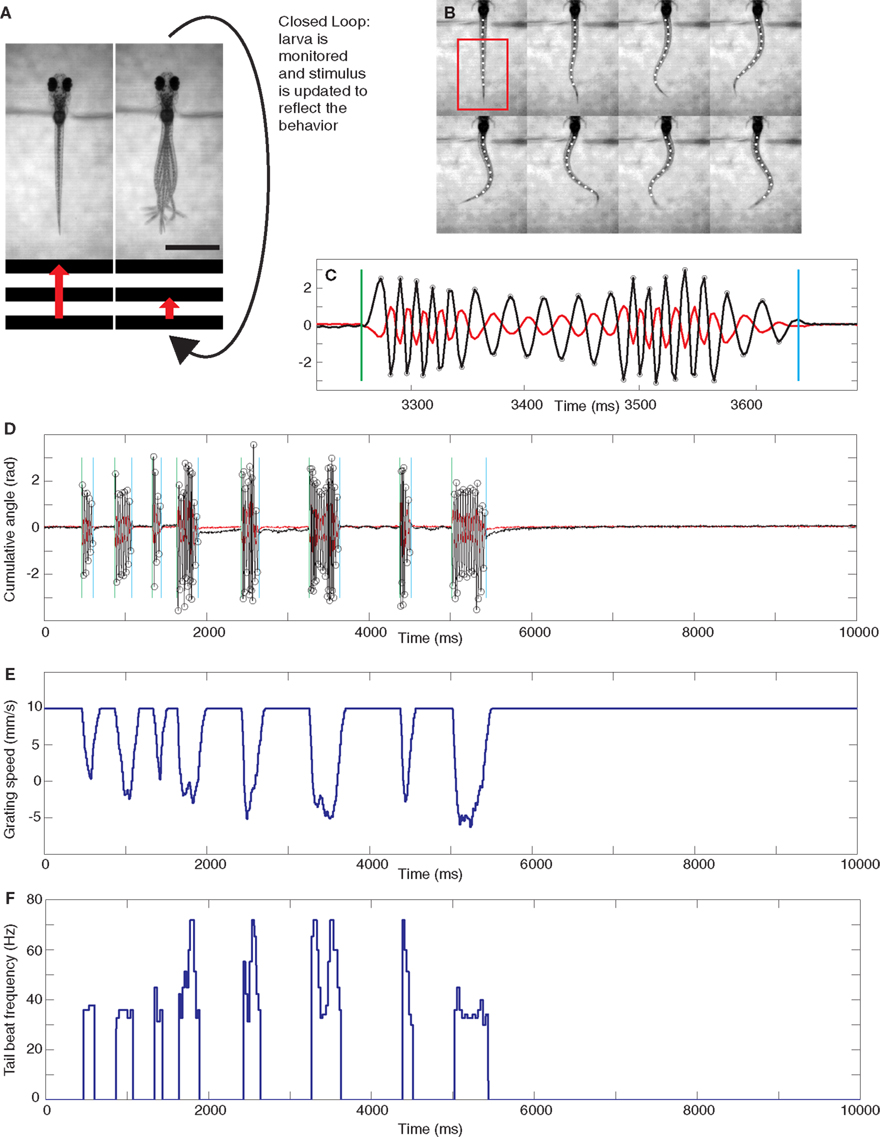
Figure 1. Experimental setup and analysis. (A) Diagram illustrating the closed-loop experimental setup. A moving grating is shown to a head-restrained larva (the grating speed is represented by the red arrow) and its behavior is monitored. A closed-loop environment is created such that, for a gain setting different from 0, swimming results in a deceleration of the grating. The scale bar at the bottom right is 1 mm. (B) Eight frames showing the automated reconstruction of the tail of a larva as it swims. The tail is reconstructed with 10 points. The frames shown are extracted from the full 10 s rep shown in (D). In particular, every second frame is shown from the start of the sixth bout, the full extent of which is shown in (C). The cumulative sums of the angles of the three most rostral and caudal tail segments can be obtained from this reconstruction and are plotted in (C) and (D) in red and black, respectively. The analysis can automatically detect the beginning and end of bouts, shown by green and blue vertical lines respectively, and the extrema of the tail angles, labeled with circles on the more caudal trace. These extrema are used to determine the instantaneous tail beat frequency, which is plotted for the entire 10 s trial in (F). This particular rep was carried out in low gain. The forward speed of the grating throughout the rep is shown in (E).
All experiments were approved by Harvard University’s Standing Committee on the Use of Animals in Research and Training.
Closed-loop Assay
Full experiments consisted of either 100 or 108 repetitions (reps), depending on the particular paradigm as explained below. Each rep was a 10 s presentation of the grating moving in a caudal to rostral (forward) direction at a baseline speed of 10 mm/s. At the beginning of each experiment a rectangular region of interest (ROI) was selected that included most of the larva’s tail (shown as a red rectangle in the first frame in Figure 1B). During the experiment, the amount of swimming instantaneously performed by the larva was quantified by taking a thresholded pixel-wise difference of values within the ROI between two consecutive frames and then summing the absolute values of all these. The threshold was set to isolate contributions from tail motion and eliminate noise contributions that arose from, for example, small fluctuations in illumination. This “instantaneous” motion was integrated over 25 ms and also set to decay exponentially with a 10 ms time constant. The intention of this last step was to mimic as closely as possible the effects that coasting could have on visual feedback at the end of a bout. We call this instantaneous swimming, integrated over 25 ms and further processed with the decay, the “vigor” of swimming of the restrained larva. The instantaneous forward speed s(t) of the grating, measured in millimiters per second, was set by the following formula:

When presented with a grating moving forward at 10 mm/s, larvae usually perform slow swims (Budick and O’Malley, 2000). One such bout has an average speed of 10 mm/s (Budick and O’Malley, 2000; Orger et al., 2008). The constant K in the above formula was set for each fish individually, to ensure that for a gain of 1, a slow swim would result in a bout that had an average speed, relative to the grating, of 10 mm/s.
A full 10 s trial is shown in Figures 1D,E (see also Movie S1 in Supplementary Material). This particular rep was a low gain rep. Figure 1D shows the swimming performed by the fish (analyzed a posteriori from the movie recorded during the experiment as described in the Analysis section below) and Figure 1E shows the effect this swimming had on the speed of the grating (this was naturally computed in real-time as described in the preceding paragraph).
The closed-loop formula, Eq. (1), has the following five properties. Firstly, as mentioned above, the formula was constructed such that in closed-loop, when the gain is 1, the visual feedback a larva receives when performing a slow swim resembled that which it would receive when swimming freely to a grating moving constantly at 10 mm/s. Secondly, the grating could smoothly reverse direction when a larva was swimming and move in a rostro-caudal direction. This simply reflects the fact that relative to the grating, the larva was swimming at a speed greater than 10 mm/s. Freely swimming larvae also experience such a reversal of the stimulus direction because the maximum speed of a slow swim is in the order or 20 mm/s. Thirdly, the deceleration of the grating is proportional to the gain of the rep: for a rep at gain 0 the grating would move constantly at 10 mm/s irrespective of the larva’s behavior. Furthermore, the same bout would result in a change in grating speed that is three times larger in high gain (when the gain is 1.5) than in low gain (when the gain is 0.5). Fourthly, the larva can control the speed of the grating, and hence the visual feedback it receives, via the vigor term in Eq. 1. As this equation shows, the change in speed (from 10 mm/s) is proportional to the vigor. This can be seen in Figure 1E which shows the speed of the grating that resulted from the swimming behavior of the larva during the rep, which is displayed in Figure 1D,F in terms of tail motion and tail beat frequency (tbf) respectively. This panel shows that more vigorous tail motion, which arises due to both increased tail amplitude (Figure 1D) and frequency (Figure 1F), does result in decreased grating speed (Figure 1E). In order to ensure that swim vigor, which is measured during the experiment, can be used as a reliable readout of larval swimming speed, we performed an a posteriori linear regression analysis comparing the vigor, in fact K × vigor of Eq. 1, to the tbf, for all frames recorded during bouts elicited in the gain 1 experiments for each larva, and then averaged the parameters across larvae. This analysis yielded:

where ± denotes the SE of the mean for the 23 larvae. We also tested the hypothesis that both variables were uncorrelated. The p-value averaged across larvae was p = 0.038. This shows that vigor and tail beat frequency are indeed significantly correlated and we are justified when using the former as a measure of the latter. The exact relation between tbf and forward swimming speed of the larva is complex. Given that we set the constant K to provide a relative forward speed that matches that of the freely swimming slow swims, we do not claim that the assay closely mimics freely swimming for the more vigorous bouts: for our purposes it suffices that Eq. 1 incorporates at some level an increased deceleration for more vigorous swimming. Lastly, Eq. 1 can be implemented quickly enough to both allow determination of the grating speed at rates higher than the projector refresh rate. This was important as the 350 Hz image acquisition and the stimulus presentation were all run from the same computer.
Experimental Protocol
Experiments were performed on individual head-restrained larvae. There were two basic types of experiment: two-gain and three-gain experiments. Two-gain experiments consisted of 100 reps whereas three-gain experiments consisted of 108 reps. Both types of experiments had 30 s in between reps during which larvae were shown a static grating. Their spontaneous activity during this period was very low and larvae would seldom perform bouts. Each rep was a 10 s presentation of the grating moving in a caudal to rostral direction at a baseline speed of 10 mm/s. Swimming by the larva would result in deceleration of the grating as described above and shown in Eq. 1.
For the two-gain experiments the gain of the system changed every five reps and alternated between two values. In the first set of two-gain experiments, which we will refer to as closed versus open-loop, the gain values were 1 and 0 (reps 1–5 at gain 1, reps 6–10 at gain 0, reps 11–15 at gain 1 etc.). In the second set of two-gain experiments, which we will call high versus low gain, the gain values were 1.5 and 0.5 respectively. These experiments were so designed to test adaptive changes in larvae’s swimming while trying to minimize changes that could be due to other causes such as tiring throughout the experiment: there were 10 cycles, each cycle consisting of five reps at the first gain followed by five reps at the second gain, such that there were 10 changes from the first to the second gain (9 changes in the opposite direction) and the five reps for any given gain allow us to investigate the dynamics of these changes.
The three-gain experiment featured 6 cycles, each one of 18 reps, hence the 108 total reps per experiment. The experiment was designed to test the swimming of larvae at three gains: low (0.5), normal (1), and high (1.5). Each gain was tested twice following both of the other gains, i.e., gain 1 was presented following both gain 0.5 and gain 1.5. The dynamics of the gain changes was tested by presenting larvae with each gain setting for three reps. We found from the two-gain experiment that this was sufficient to capture the essential dynamics of the behavioral changes and prevented the experiment from becoming too lengthy. This experiment was designed to investigate how, if at all, the swimming behavior of larvae at a given gain depended on the previous gain.
Analysis
Analysis software was custom written in Matlab (Mathworks). This software would batch analyze all movies from one experiment (100 movies in the two-gain experiments and 108 movies in the three-gain experiments). The first step involved accurate reconstruction of the tail using 10 points in each frame, shown as white circles in Figure 1B. The software then computed the cumulative angle of the three most caudal tail segments for the whole trial (shown as the black trace in Figures 1C,D). This allowed the determination of the start and end of individual bouts (shown as vertical green and blue lines respectively), together with the instantaneous tbf during the bout. The tbf at a point is measured as half the reciprocal of the time (in seconds) between the preceding and succeeding extrema. The extrema are shown as small circles in Figures 1C,D. The instantaneous tbf for a whole trial is shown in Figure 1F.
Results
The assay we developed is based on the OMR, where head-embedded larvae are shown a forward moving grating to elicit swimming. By the closed-loop nature of our assay this results in a deceleration of the grating if the gain setting is different from zero. Larvae therefore received real-time visual feedback dependent on their motor output. When swimming to a high gain (above 1) the larvae received more visual motion than usual and could therefore be led to believe they were swimming more vigorously, whereas the opposite would be the case during a low gain rep (gain less than 1).
We use three parameters to characterize individual bouts: bout duration, mean tail beat frequency (mean tbf) and maximum tail beat frequency (max tbf). In addition we measure the time to onset of swimming after the grating first starts moving (latency to initiate swimming) and the interbout duration (time between consecutive bouts). These latter parameters comprise what we define as the off components of the swimming behavior, whereas parameters that describe swimming bouts are referred to as the on components.
When quantifying the behavior we choose to display normalized values: data points are divided by the average value across trials. When comparisons across first and subsequent bouts/interbouts are shown, the values are divided by the average value of the first bout/interbout across trials. The main reason for doing this is that we are interested in relative changes that arise throughout the experiment as the gain varies and are less interested in overall changes that could arise from either different locomotor baseline levels from larva to larva or from experimental procedures such as embedding.
Closed-loop versus Open-loop
In order to investigate whether larvae modify their swimming behavior depending on the visual feedback that results from their motor output, we first compared two conditions: one in which the feedback they receive is as close as possible to that which they would receive when swimming freely to the OMR grating presented (gain 1 or closed-loop) against one in which the larva’s swimming has no effect at all on the visual feedback they receive (gain 0 or open-loop). The results for this experiment are shown in Figure 2.
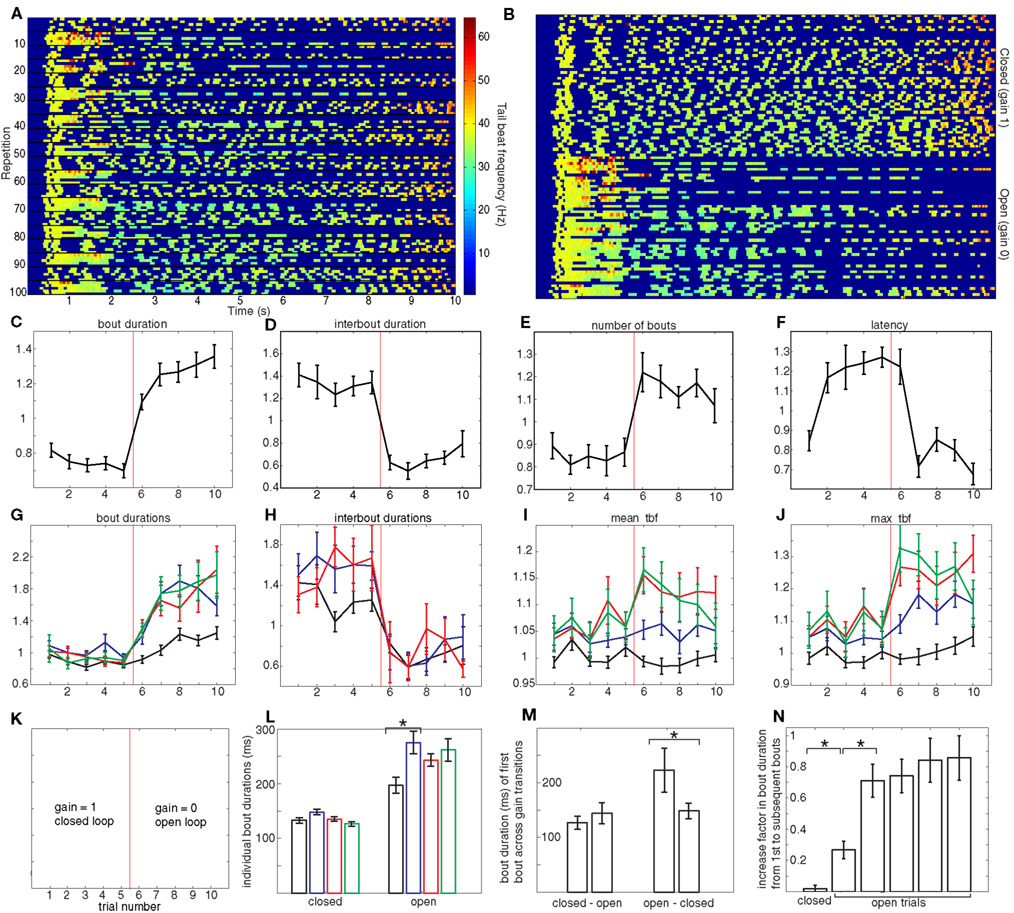
Figure 2. Closed versus open-loop. (A) Spectrogram showing a full experiment for an individual larva: 100 repetitions (from top to bottom) of 10 s each (from left to right). The color code shows the instantaneous tail beat frequency (tbf) as was shown in Figure 1F for one rep. In every 10 repetitions, the first five are in closed-loop and the second five are in open-loop, as shown in (K). (B) The same data as (A), but rearranged so that reps with the identical gains are collected in blocks: the top 50 reps correspond to gain 1 and the bottom 50 reps to gain 0. The axes for (C–J) are the same. The x-axis is trial number, which is the repetition number (modulo 10): trials 1–5 correspond to gain 1 and 6–10 correspond to gain 0 (explicitly: trial 1 is the mean of reps 1, 11, 21, 31… 91, trial 2 is the mean of reps 2, 12, 22… 92, etc.). The x-axis in these panels is therefore cyclic: after trial 10 (which corresponds to the average of reps 10, 20, etc.) comes trial 1 (which corresponds to the average of reps 11, 21, etc.). The gain changes from 1 to 0 between trials 5 and 6 and back from 0 to 1 between trials 10 and 1. The y-axis is relative value of the quantity being plotted. (C) Average relative bout duration as a function of repetition number (modulo 10), that is, as shown in (K), the first five (left of vertical red line) are in closed-loop and the second five (right of vertical red line) are in open-loop. (D–F) are the same as (C) but for the average relative interbout duration, average relative number of bouts and relative latency respectively. (G) Average relative bout duration for the first, second, third, and fourth bouts in a repetition (in black, blue, red, and green respectively). Linear regression was performed on the first bout of trials 6 to 10 on a fish by fish basis and then a t-test was used to show that the mean gradient of 0.081 was significantly different from 0, p = 0.0056. The relative duration of the first three interbouts in each trial is shown in (H). The average relative mean tbf for the first four bouts is shown in (I) and the average relative max tbf is shown in (J) with the same color-coding as (G). For (C–J), all error bars denote SE or the mean and n = 23 larvae. The color code described above applies to (G), (H), (I), and (J), except for (H) which concerns the first three interbouts. (L) Duration of the first four bouts pooled from (G) for both gain settings. The asterisk denotes the only significant difference between subsequent bouts (paired t-test, p < 1 × 10⁻⁵). (M) Difference in bout duration of the first bout when changing gain. The asterisk denotes the only significant difference, which occurs in the transition from open to closed-loop (paired t-test, p = 0.007). (N) The increase in bout duration from the first bout to subsequent bouts in the closed versus open-loop experiments. The increase takes two open-loop trials to reach the maximum. Asterisks denote significant differences (p < 0.0001). The units in (L,M) are absolute (i.e., ms) to allow comparison with the analogous panel in Figure 3.
Figure 2A shows a full experiment for one larva. Each row shows the tail beat frequency during one rep, i.e., each row is a color-coded version of Figure 1F, which allows us to read out all the behavioral variables we measure. The gain changed every five reps and the swimming behavior showed corresponding changes that are clearly apparent if we display all closed-loop trials together followed by all open-loop trials as in Figure 2B. The rest of the figure quantifies these changes explicitly.
Transitions from closed-loop (trials 1–5) to open-loop (trials 6–10) result in larvae displaying an increased locomotor output as seen by the lengthening in the duration of bouts (Figure 2C), the shortening of the interbouts (Figure 2D) and the overall increase in the number of bouts performed during the 10 s rep (Figure 2E). The changes in bout duration were not homogenous across bouts (Figure 2G). Whereas in closed-loop all bouts show similar duration, this was not the case in open-loop. In this condition, bouts following the first bout were significantly longer than the first bout itself (Figure 2G,L). This increase in bout duration from the first bout to subsequent bouts in a trial also increases from the sixth (first open-loop) trial to following trials (Figure 2N). Finally, the first bouts themselves show an increased duration from one open-loop trial to the next (Figure 2G). We note that the transition from open-loop to closed-loop (from trial 10 back to trial 1), immediately results in a return to what can be interpreted as a canonical bout duration which is maintained throughout the closed-loop trials, whereas no immediate change is observed during the opposite transition (Figure 2M).
On the other hand, interbout durations show homogenous changes (Figure 2H) when transitioning to open-loop. The first interbout in this gain condition (black data point of trial 6) is significantly shorter than all closed-loop interbouts and indistinguishable from all the other open-loop interbouts: in contrast to the bout durations described above, interbouts show no modulation either within or between open-loop trials.
Apart from bout duration, another behavioral variable that we used to characterize bouts was tbf, both its mean and maximum values. The variation of these across bouts and trials is shown in Figures 2I,J. The maximum tbfs of the second, third, and fourth bouts show significant increase in open-loop compared to their closed-loop counterparts. The mean tbfs of the third and fourth bouts in each trial also show an increase albeit less significant.
The last behavioral parameter we measured is the latency to initiate swimming, displayed in Figure 2F. We found that following any open-loop trial, the latency was significantly shortened to roughly two thirds of the latency which followed a closed-loop trial. We recall that before performing the first bout during any given trial, larvae have no information regarding the current gain setting and therefore the most direct way that gain can modulate latency is by the gain of the preceding trial changing behavior of the current trial. This explains the offset shift of one trial between change in gain and change in latency. Recall that the resting time between trials was 30 s, so this result demonstrates that the effect of the gain of the previous trial persists for at least this period of time.
These results can be succinctly summarized as follows: when the gain changes from 1 to 0 and vice-versa, we find changes in all the behavioral variables we used to quantify larval zebrafish swimming. Changes in the on components of swimming, namely bout duration and tail beat frequency, also show modulation within and across open-loop trials, whereas changes in interbout duration show no such modulation. We also find a change in latency to initiate swimming, which unequivocally shows a change in behavior that persists from one trial to the next.
High Gain versus Low Gain
To gain further insight into the behavioral differences induced by changing the gain of our closed-loop assay, we performed a similar experiment to the one described above, but now switching the gain between a high and a low value (1.5 and 0.5 respectively). The results for this are shown in Figure 3. This figure has panels analogous to those of Figure 2. As exemplified by the data shown in Figures 3A,B, larvae also displayed clear behavioral changes when the gain switched between these two conditions.
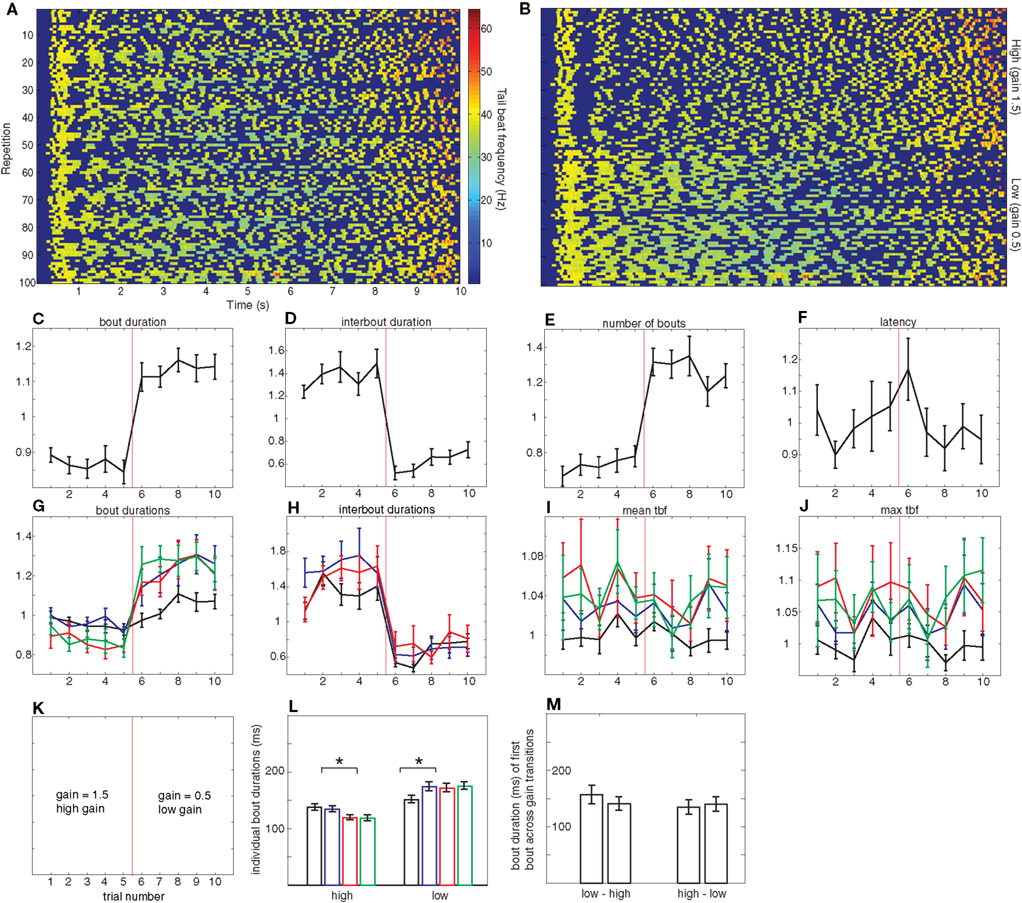
Figure 3. High versus low gain. (A–J) analogous to those in Figure 2, but now, as shown in (K), the first five repetitions are in high gain and the second five are in low gain. For (C–J), all error bars denote SE or the mean and n = 17 larvae. (L,M) analogous to those in Figure 2. In (L), significant differences in bout duration exist between the second and third bout in the high gain condition and between the first and second bout in the low gain condition (paired t-tests, p < 0.0001) whereas in (M) there are no significant differences between the durations of subsequent bouts (paired t-tests).
Just as in the closed- versus open-loop experiments described in the preceding section, transitions from the higher to the lower gain are accompanied by an increase in average bout duration (Figure 3C). The magnitude of this increase is different though, around 30% as opposed to 50%. The breakdown of this increase across individual bouts is shown in Figure 3G. In all low gain trials there is a significant increase from the first to subsequent bouts, whereas, when larvae are exposed to the high gain condition, the first two bouts exhibit the same duration but there is a significant shortening of subsequent bouts (Figures 3G,L). In addition, the magnitude of the increase in the low gain condition appears to be larger than the decrease in the high gain condition.
This modulation in bout duration is accompanied by a corresponding change in interbout duration: as Figure 3D shows, interbouts measured during low gain are shorter (around 45%) than those at high gain. These changes in interbout already display maximum modulation at the first interbout performed when presented with a novel gain setting (Figure 3H). Surprisingly though, this decrease in magnitude is comparable to the one observed in the closed- versus open-loop experiments, in contrast with the change observed in bout duration.
In this experiment, neither latency to initiate swimming nor tail beat frequency show a consistent variation across trials as a function of the gain setting (Figures 3F,I,J). We do note however, that just as in the closed- versus open-loop experiment, the first bout appears to be elicited with a lower tail beat frequency than subsequent bouts. In contrast with the open to closed transitions in the previous experiment, changes in gain setting do not result in significant changes in the bout duration of the first bout elicited at the new gain (Figure 3M). Overall, the results of this experiment can be summarized by saying that they show less dramatic changes than those of the closed versus open-loop experiment described above.
Three-gain Experiment
The final set of gain change experiments we performed involved switching between three gain values (0.5, 1, and 1.5) in such a way that all transitions were tested. The results are shown in Figure 4.
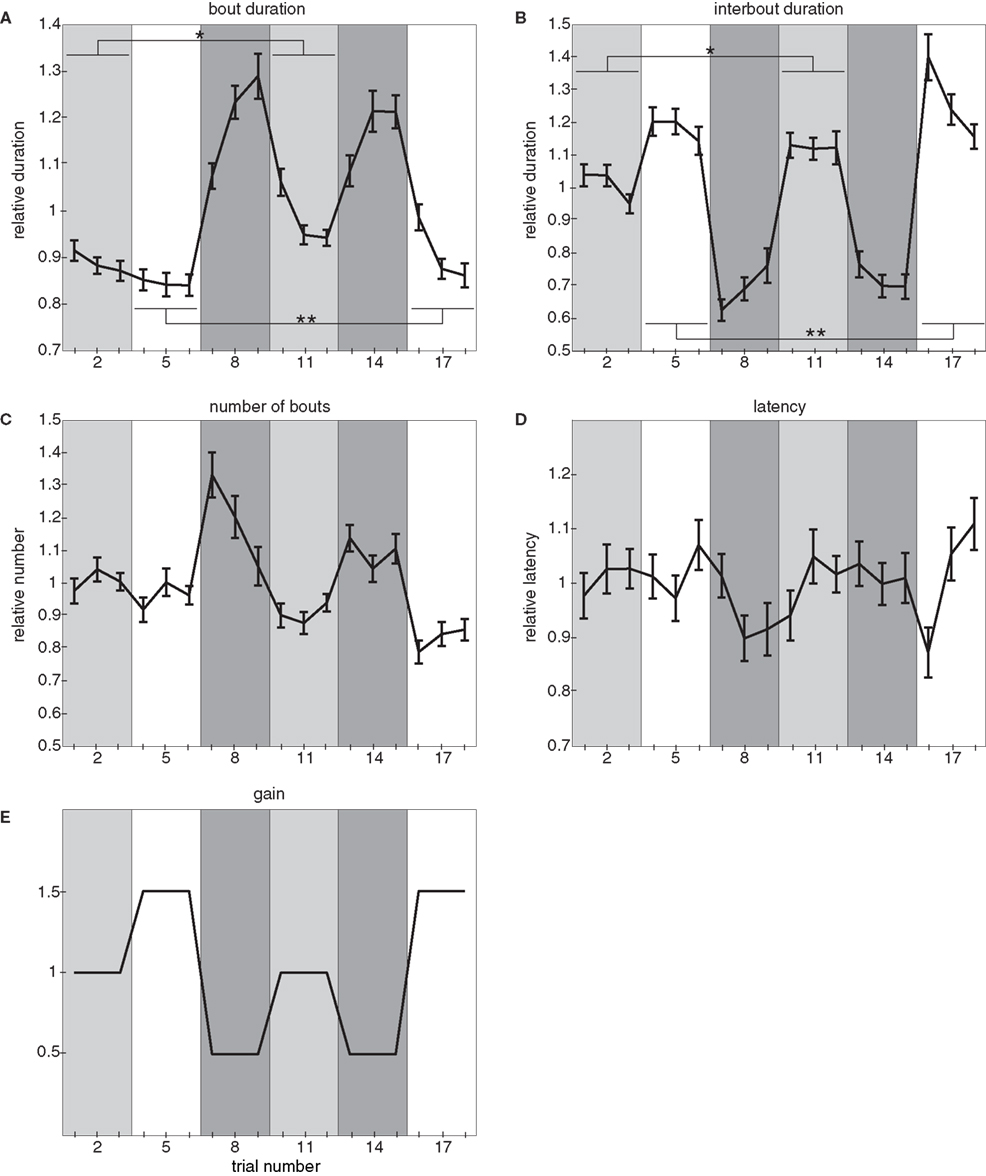
Figure 4. Three-gain experiment. (A) Relative bout duration, (B) relative interbout duration, (C) relative number of bouts, and (D) relative latency to initiate swimming as a function of trial number in the three-gain experiment. The gain varies across trials as shown in (E): periods 1 (trials 1–3) and 4 (trials 10–12) have a gain setting of 1, periods 2 (trials 4–6) and 6 (trials 16–18) have a gain setting of 1.5, and periods 3 (trials 7–9) and 5 (trials 13–15) have a gain setting of 0.5. In (A,B) single and double asterisks denote significant differences between values at the same gain setting. In (A), * denotes a significant difference in the bout durations between trials 1 and 10 (paired t-test, p < 4 × 10⁻⁴) and also in the bout durations averaged across trials with the same gain setting (i.e., trials 1–3 compared to trials 10–12; paired t-test, p < 3 × 10⁻⁵). Also in (A), ** denotes a significant difference between trials 4 and 16 (paired t-test, p < 4 × 10⁻⁴) and also between the values averaged across trials with the same gain setting (i.e., trials 4–6 compared to trials 16–18; paired t-test, p < 2 × 10⁻³). In (B), * denotes the corresponding significant difference in the interbout durations: between trials 1 and 10 (paired t-test: p = 0.034) and trials 1–3 compared to trials 10–12 (paired t-test: p < 0.01) whereas ** denotes a significant difference in the interbout durations between trials 4 and 16 (paired t-test: p = 0.012) and trials 4–6 compared to trials 16–18 (paired t-test: p < 0.01). For these experiments, all error bars denote SE of the mean and n = 28 larvae.
We again find that bout duration (Figure 4A), interbout duration (Figure 4B), and number of bouts performed (Figure 4C) are modulated in a gain dependent fashion: every transition to a higher gain results in a decrease in both average bout duration and number of bouts performed and an increase in average interbout duration. Conversely, every transition to a lower gain setting results in the opposite effects. These results are what we would expect from a compensatory effect. On the other hand, latency to initiate swimming shows no consistent trend across gains (Figure 4D).
The experimental design of the three-gain experiment allows us to compare behavioral parameters during different periods at the same gain. Any differences observed during these periods cannot be a function of the gain because this is the same, so it is reasonable to assume that the observed difference is experience dependent and dominated by the gain of the previous period. This allows us to make the following two observations. Firstly, there is a difference in bout duration between the two periods at both medium and high gain: bout durations are significantly longer following the low gain condition (trials 10–12 in the medium gain case and trials 16–18 in the high gain case). Secondly, there is also a difference in interbout duration between the two periods at both medium and high gain, but in this case interbouts are significantly longer following the low gain condition.
These results indicate that the locomotor output of the larvae in our assay is not only dependent on the gain of the current trial, but also on the preceding gain experienced by the animal.
Discussion
The results we presented above show that larvae respond to changes in gain by adaptively modifying multiple components of their swimming behavior. When we exposed zebrafish larvae to open-loop or low gain conditions in which they experienced reduced visual feedback in response to their swimming, they rapidly responded by increasing the duration of individual swim bouts and shortening the duration of individual interbouts. This change in motor output serves to increase total locomotion and compensates for the reduced whole-field visual motion. In contrast, when larvae were exposed to a high gain they implemented a complementary strategy: they shortened bout durations and interbouts became longer, thus compensating for the excessive whole-field motion larvae observed in response to their motor output. These behavioral modifications are therefore adaptive.
The only parameter that is being varied in these experiments is the feedback gain of the experimental loop and therefore we expect the behavioral modifications we observe to be a result of this variation, which larvae experience only through differences in visual feedback in response to their swimming.
Nevertheless, the results we observe from the three-gain experiment show that the behavior is not only dependent on the current gain setting, but also on the previous gain. As already noted, the bout durations observed at the medium and high gains are significantly longer if the preceding gain was the lower of the two possible options (i.e., low gain as opposed to high or medium gain; Figure 4A). In addition, interbout durations where also longer in these cases (Figure 4B). The former observation could be explained invoking a purely feed–forward mechanism that integrates sensory input over time and modifies the larva’s internal state. This would fall under the definition of generalized arousal, which “results in an organism having increased motor activation, sensory responsiveness, and emotional reactivity” (Pfaff and Banavar, 2007). In the context of our assay, the grating decelerates less when a larva performs a bout in low gain as compared to high gain and this increased sensory drive integrated over time would lead to a state of heightened arousal following recent exposure to a lower gain setting. The latter observations however cannot be explained using a simple mechanism of tonic arousal: this framework would predict shorter interbouts resulting from heightened arousal following periods of low gain, whereas we observe the opposite (Figure 4B).
An alternative hypothesis, which is consistent with all the data we observe, requires the larval brain to actually encode a representation of expected visual feedback resulting from its motor output. Larvae would correlate this expectation with the actual visual feedback received while performing a bout. If this computation results in a discrepancy an error signal would then act as a teaching command to recalibrate both the motor output and the internal representation of visual feedback expected from this motor output. This type of mechanism is associated with motor learning, which for our purposes we can define as “the assimilation of information acquired through experience that leads to improved motor behavior.” The mechanisms of arousal and motor learning are shown as blue and red arrows in Figure 5 respectively.
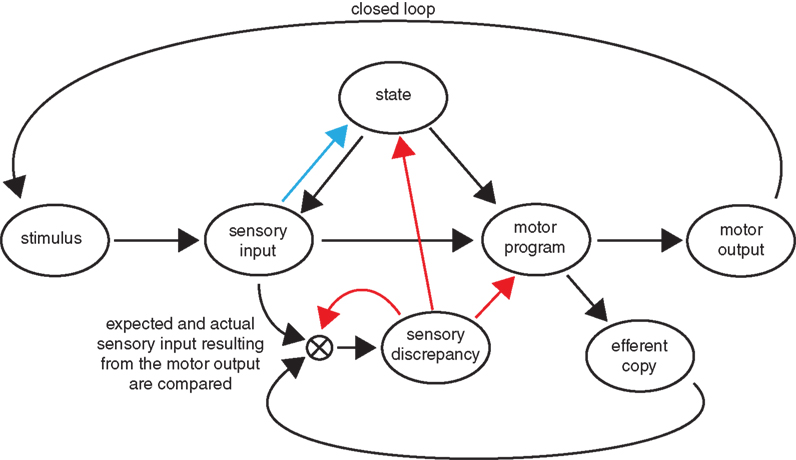
Figure 5. Motor learning versus arousal circuits. We show a possible circuit diagram involved in the behavioral changes we observe in our experiments. Modifications arising from motor learning and arousal are shown with red and blue arrows respectively. Motor learning can be understood as arising from the existence in the larval brain of a representation of visual feedback that corresponds to a given motor output. Discrepancies between the expected and actual amounts of visual feedback observed result in modification of the circuit, including the above-mentioned internal representation. Generalized arousal acts as a feed–forward mechanism in which the sensory input affects the behavioral state of the larva.
It is worth comparing the assay we present with those already established to study motor learning in the VOR and smooth pursuit eye movements. The VOR is a movement of the eyes that ensures gaze stabilization. It is elicited by vestibular input but can be modified by pairing this input with motion of a visual target. In control system terminology it is what is known as an open-loop control system because the output of the reflex does not feed back into the input (Ito, 1970, 1972). In this way the behavior lends itself well to quantification of learning as it can be measured in the dark before and after the training session, without the presence of the teaching signal. On the other hand, the stimulus that induces learning during smooth pursuit eye movements is the same stimulus that triggers the behavior itself. It is a closed-loop control system with feedback: tracking a target across the visual scene alters its retinal slip and hence the input that initiated the behavior. Nevertheless quantification of learning is possible because it is known that the first 100 ms of the pursuit occur in open-loop (Lisberger and Westbrook, 1985). This latency to “close the loop” can be used as a feature to measure behavioral modifications following various training protocols and therefore establish that motor learning has taken place.
The head-restrained OMR assay we have presented resembles the smooth pursuit eye movement experiments. The output of the behavior, namely a forward swim bout, feeds back into the input by decreasing the forward speed of the grating relative to the larva. This allows recalibration of the system mid-bout and our data suggests that such recalibrations do indeed occur at least at a very coarse level. Figures 2M and 3M show how the first bout in a trial varies between the four transitions in the two-gain experiments: i.e., we compare the first bout in the last trial at a given gain, with the first bout in a trial at a new gain. Larva can only be aware of the new gain setting while performing this first bout. Nevertheless, there is a significant decrease in bout duration when transitioning from gain 0 to gain 1. Our interpretation of this is that while performing their first bout at gain 1, larvae appear to note that the grating is indeed reacting to their motor output and shorten their bout duration. All other transitions showed no significant change, so it is unclear if larva are simply noticing movement where there was none before or whether they can also quantify the grating deceleration.
We will now discuss two features of the results which suggest that there are a variety of mechanisms underlying these behavioral modifications: the different time-scales involved, and the fact that many of these behavioral modifications happen independently of each other.
Time-scales
As just mentioned, even within the brief duration of a bout (approximately 175 ms) larval zebrafish can react to visual feedback and immediately modify their swimming behavior by terminating the bout, as can be seen during the first bout in closed-loop in the open closed-loop experiment (Figure 2M).
In open-loop, effects on bout duration accumulate within a trial and across trials. The first bout in open-loop trials for example, becomes progressively longer across trials (Figure 2G). This accumulation of first bout duration across trials demonstrates an effect due to gain setting that persists for at least the inter-trial interval of 30 s. The duration of these first bouts (trials 7–10) is nonetheless significantly shorter than the duration of the last bout of the previous trial (trials 6–9; paired t-tests, p < 0.001 for all comparisons). This suggests that there is a gradual decay back toward a canonical or physiological bout duration, which is exemplified by the bouts performed during closed-loop, in which we observe no modulation. As opposed to the active bout termination mentioned in the paragraph above, this gradual return to a canonical bout duration appears to be a passive process.
Another curious feature is that changes in bout duration following low and high gain show different dynamics: in the former, lengthening of duration occurs after a single bout, whereas shortening of bout duration in the latter occurs only after two bouts (Figures 3G,L). Similar differences have been observed in gain up and gain down experiments in the VOR which have been attributed to different underlying plasticity mechanisms (Boyden and Raymond, 2003). It is not difficult to imagine that responding to insufficient visual feedback and increasing locomotor output may be more important for survival than the opposite.
Independent modifications
Further evidence of the variety of mechanisms that may underlie the behavioral changes we observe lies in the fact that the behavioral parameters are modulated independently.
In the open–closed experiments increase in open-loop bout duration is accompanied by an increase in tbf (Figures 2C,G,I,J). In the high-low experiments, the increase in bout duration was smaller and there was no increase in tbf, indicating that bout duration can be increased, at least partially, without also modifying the tbf.
We can also analyze the magnitude of the increase in bout duration within the open-loop trials. Larvae show a significant increase in bout duration after the first bout (Figures 2G,L), however the magnitude of this increase changes as trials progress (Figure 2N). This increase saturates by the second trial. We hypothesize that this trend in behavioral change across trials is mediated by a long lasting modification in expected visual feedback.
In contrast with the changes in bout duration mentioned above, interbout duration is modified immediately following a single bout at a new gain setting (Figures 2H and 3H). This suggests that either bout and interbout durations are modified using different mechanisms or that the same mechanism underlies both and changes in interbout duration saturate immediately. The latter possibility is called into question by the results of the three-gain experiment, where interbout durations of several gradations are observed.
The latency in the open–closed experiments shows dramatic modulation: following an open-loop trial latency is decreased by 33% on average (Figure 2F). This shows an effect that persists for at least 30 s, which is the duration between trials. This is the only experiment in which we observe a change in latency. This shortening in response time may indicate an elevated attention to visual cues brought about by the “unresponsive” environment, an effect that is not entered during other gain settings.
As we already mentioned we observe a change in the same direction for both bout and interbout duration in the three-gain experiments in periods with the same gain setting (periods 1 versus 4 and periods 2 versus 6). In both cases, transitioning from the low gain setting of 0.5 (as opposed to either gain 1 or 1.5) results in both a longer bout duration and a longer interbout duration: these are both longer in periods 4 and 6 compared to periods 1 and 2 respectively. Whereas the longer bout duration can be ascribed to increased arousal resulting from the recent exposure to a low gain setting, the longer interbout duration cannot. On the other hand this observation could be explained by a process of motor learning as described above. Furthermore, these differences in absolute values of bout and interbout durations indicate that both are, at least to some extent, varied independently.
Conclusion
We find that larval zebrafish respond to all gain changes in our assay with changes in motor output that are adaptive and compensate for the altered visual feedback. Most of the modifications we describe can be implemented on very short time-scales following a single swim bout, yet some of them can accumulate over tens of seconds, within, and across trials. The results suggest that larval zebrafish have a representation of how much visual feedback they expect to receive as a result of a given motor output, and that a difference between this expectation and the actual observed feedback might act as an error signal to drive the behavioral changes. Given that we observe modifications in most behavioral parameters there are other mechanisms that likely contribute; after all, recalibrating the brain to integrate sensory and motor information appropriately in order to ensure an adequate interaction of the animal with the environment is of outmost importance during the fast developing larval stages.
In addition, we hope that the assay we have developed will prove to be yet another valuable tool to study the neural mechanisms underlying sensorimotor integration in larval zebrafish, as this model system grants us the opportunity of monitoring function in large populations of neurons using functional calcium imaging.
Conflict of Interest Statement
The authors declare that the research was conducted in the absence of any commercial or financial relationships that could be construed as a potential conflict of interest.
Acknowledgments
Ruben Portugues thanks the Human Frontier Science Program for funding through fellowship LT01115/2007-C, which made most of this research possible. We thank Robert Baker, Isaac Bianco, Megan Carey, Markus Meister, Iris Odstrcil, Michael Orger, Alexander Schier, Kristen Severi, and the reviewers for comments on the manuscript and Isaac Bianco, Adam Kampff, and Michael Orger for multiple discussions throughout the project.
Supplementary Material
The Movie 1 for this article can be found online at http://www.frontiersin.org/systems_neuroscience/10.3389/fnsys.2011.00072/abstract
MOVIE S1| A full 10 s trial (down-sampled and down-scaled for file size purposes) showing the stimulus (bottom and not to scale) during a repetition with gain setting 1.
References
Aizenberg, M., and Shuman, E. M. (2011). Cerebellar-dependent learning in larval zebrafish. J. Neurosci. 31, 8708–8712.
Boyden, E. S., Katoh, A., and Raymond, J. L. (2004). Cerebellum-dependent learning: the role of multiple plasticity mechanisms. Annu. Rev. Neurosci. 27, 581–609.
Boyden, E. S., and Raymond, J. L. (2003). Active reversal of motor memories reveals rules governing memory encoding. Neuron 39, 1031–1042.
Budick, S. A., and O’Malley, D. M. (2000). Locomotor repertoire of the larval zebrafish: swimming, turning and prey capture. J. Exp. Biol. 203, 2565.
Carey, M. R., and Lisberger, S. G. (2002). Embarassed, but not depressed: eye opening lessons for cerebellar learning. Neuron 35, 223–226.
Del Bene, F., Wyart, C., Robles, E., Tran, A., Looger, L., Scott, E. K., Isacoff, E. Y., and Baier, H. (2010). Filtering of visual information in the tectum by an identified neural circuit. Science 330, 669–673.
Dombeck, D. A., Khabbaz, A. N., Collman, F., Adelman, T. L., and Tank, D. W. (2007). Imaging large-scale neural activity with cellular resolution in awake, mobile mice. Neuron 56, 43–57.
duLac, S., Raymond, J. L., Sejnowski, T. J., and Lisberger, S. G. (1995). Learning and memory in the vestibulo-ocular reflex. Annu. Rev. Neurosci. 18, 409–441.
Goetz, K. G. (1964). Optomotorische untersuchung des visuellen systems einiger augenmutanten der fruchtfliege Drosophila. Kybernetik 2, 7792.
Ito, M. (1970). Neurophysiological aspects of the cerebellar motor control system. Int. J. Neurol. 7, 162–176.
Keller, E. L., and Heinen, S. J. (1991). Generation of smooth-pursuit eye movements: neuronal mechanisms and pathways. Neurosci. Res. 11, 79–107.
Lisberger, S. G. (1988). The neural basis for learning of simple motor skills. Science 242, 728–735.
Lisberger, S. G., Morris, E. J., and Tychsen, L. (1987). Visual motion processing and sensory-motor integration for smooth pursuit eye movements. Annu. Rev. Neurosci. 10, 97–129.
Lisberger, S. G., and Westbrook, L. E. (1985). Properties of visual inputs that initiate horizontal smooth pursuit eye movements in monkeys. J. Neurosci. 5, 1662–1673.
Miles, F. A., and Lisberger, S. G. (1981). Plasticity in the vestibulo-ocular reflex: a new hypothesis. Annu. Rev. Neurosci. 4 273–299.
Miri, A., Daie, K., Burdine, R. D., Aksay, E., and Tank, D. W. (2011). Regression-based identification of behavior-encoding neurons during large scale optical imaging of neural activity at cellular resolution. J. Neurophysiol. 105, 964–980.
Neuhauss, S. C., Biehlmaier, O., Seeliger, M. W., Das, T., Kohler, K., Harris, W. A., and Baier, H. (1999). Genetic disorders of vision revealed by a behavioral screen of 400 essential loci in zebrafish. J. Neurosci. 19, 8603–8615.
O’Malley, D. M., Sankrithi, N. S., Borla, M. A., Parker, S., Banden, S., Gahtan, E., and Detrich, H.W. (2004). Optical physiology and locomotor behaviors of wild-type and nacre zebrafish. Methods Cell Biol. 76, 261–284.
Orger, M. B., Kampff, A. R., Severi, K. E., Bollmann, J. H., and Engert, F. (2008). Control of visually guided behavior by distinct populations of spinal projection neurons. Nat. Neurosci. 11, 327–333.
Orger, M. B., Smear, M. C., Anstis, S. M., and Baier, H. (2000). Perception of fourier and non-fourier motion by larval zebrafish. Nat. Neurosci. 3, 1128–1133.
Pfaff, D., and Banavar, J. R. (2007). A theoretical framework for CNS arousal. Bioessays 29, 803–810.
Portugues, R., and Engert, F. (2009). The neural basis of visual behaviors in the larval zebrafish. Curr. Opin. Neurobiol. 19, 644–647.
Raymond, J. L., Lisberger, S. G., and Mauk, M. D. (1996). The cerebellum: a neuronal learning machine? Science 272, 1126–1131.
Sumbre, G., Muto, A., Baier, H., and Poo, M. M. (2008). Entrained rhythmic activities of neuronal ensembles as perceptual memory of time interval. Nature 456, 102–106.
Thompson, R. F., and Krupa, D. J. (1995). Organization of memory traces in the mammalian brain. Annu. Rev. Neurosci. 17, 519–549.
Keywords: zebrafish, learning, behavior, optomotor, sensorimotor, arousal
Citation: Portugues R and Engert F (2011) Adaptive locomotor behavior in larval zebrafish. Front. Syst. Neurosci. 5:72. doi: 10.3389/fnsys.2011.00072
Received: 07 February 2011; Accepted: 08 August 2011;
Published online: 30 August 2011.
Edited by:
Abdel El Manira, Karolinska Institute, SwedenReviewed by:
David McLean, Northwestern University, USAHarold Burgess, National Institute for Child Health and Human Development, USA
Copyright: © 2011 Portugues and Engert. This is an open-access article subject to a non-exclusive license between the authors and Frontiers Media SA, which permits use, distribution and reproduction in other forums, provided the original authors and source are credited and other Frontiers conditions are complied with.
*Correspondence: Ruben Portugues, Department of Molecular and Cellular Biology, Harvard University, BioLabs 2073, 16 Divinity Avenue, Cambridge, MA 02138, USA. e-mail: rportugues@mcb.harvard.edu