Parallel readout of pathway-specific inputs to laminated brain structures
- 1 Department of Systems Neuroscience, Consejo Superior de Investigaciones Científicas, Cajal Institute, Madrid, Spain
- 2 Department of Neurobiology, Instituto Ramón y Cajal de Investigación Sanitaria, Hospital Ramón y Cajal, Madrid, Spain
- 3 Department of Applied Mathematics, Complutense University, Madrid, Spain
Local field potentials (LFPs) capture the electrical activity produced by principal cells during integration of converging synaptic inputs from multiple neuronal populations. However, since synaptic currents mix in the extracellular volume, LFPs have complex spatiotemporal structure, making them hard to exploit. Here we propose a biophysical framework to identify and separate LFP-generators. First we use a computational multineuronal model that scales up single cell electrogenesis driven by several synaptic inputs to realistic aggregate LFPs. This approach relies on the fixed but distinct locations of synaptic inputs from different presynaptic populations targeting a laminated brain structure. Thus the LFPs are contributed by several pathway-specific LFP-generators, whose electrical activity is defined by the spatial distribution of synaptic terminals and the time course of synaptic currents initiated in target cells by the corresponding presynaptic population. Then we explore the efficacy of independent component analysis to blindly separate converging sources and reconstruct pathway-specific LFP-generators. This approach can optimally locate synaptic inputs with subcellular accuracy while the reconstructed time course of pathway-specific LFP-generators is reliable in the millisecond scale. We also describe few cases where the non-linear intracellular interaction of strongly overlapping LFP-generators may lead to a significant cross-contamination and the appearance of derivative generators. We show that the approach reliably disentangle ongoing LFPs in the hippocampus into contribution of several LFP-generators. We were able to readout in parallel the pathway-specific presynaptic activity of projection cells in the entorhinal cortex and pyramidal cells in the ipsilateral and contralateral CA3. Thus we provide formal mathematical and experimental support for parallel readout of the activity of converging presynaptic populations in working neuronal circuits from common LFPs.
Introduction
Information in the brain flows back and forth among individual neurons and populations in essentially sparse way (Stevens and Zador, 1998). Therefore understanding the basis of neural computations requires monitoring of the activity of different neural nuclei with high spatiotemporal accuracy. Studies of unitary activity provide inter-nuclei and behavioral correlates, but they usually cannot explain the mechanisms underlying the synaptic integration of incoming signals by target neurons. Thus simultaneous recording of unitary and synaptic activity would boost our knowledge of the computational capacities of neuronal circuits. Local field potentials (LFPs) contain precise temporal information of the synaptic activity induced by the converging axons of different neuron populations regardless of their local or remote position. The biophysical grounds required to translate presynaptic spikes to single cell currents and then to scale these to aggregate LFPs have been known for many years (Lorente de Nó, 1947a; Rall and Shepherd, 1968; Jack et al., 1975; Nunez and Srinivasan, 2006). However, technical and theoretical constraints severely limit the resolution of the inverse problem: how to obtain the presynaptic activity from recorded LFPs.
Most known evoked field potentials deal with externally controlled stimulations of single pathways, facilitating their study and description. In this way unitary-to-population relationships have been established for pathway-specific evoked potentials in the hippocampus and cerebellum, or for compound action potentials in nerve bundles (Lorente de Nó, 1947b; Eccles et al., 1967; Andersen et al., 1971; Nicholson and Llinás, 1971). However, ongoing LFPs are produced by the activity of multiple pathways that evolve over time and that converge onto a region populated by several types of neurons that form local circuits. Thus the mutual cancelation of synaptic currents, their mixing in the extracellular volume, irregular activation of afferent nuclei, complex cell geometry, and electrogenesis constitute the main handicaps to understand how the electrical activity of individual neurons shapes LFPs (Rall and Shepherd, 1968; Varona et al., 2000; López-Aguado et al., 2002; Einevoll et al., 2007; Makarova et al., 2010; Ray and Maunsell, 2010). In practice, ongoing LFPs are mostly studied when a single particular subgroup of neurons and/or afferent pathway has a dominant contribution, or when there are highly synchronized events like sharp waves or periodic oscillatory activity (Buzsáki et al., 1983; Brankack et al., 1993; Csicsvari et al., 2003; Reichinnek et al., 2010).
Modern blind source separation techniques, such as independent component analysis (ICA; reviewed in Hyvärinen and Oja, 2000; Choi et al., 2005), are useful to resolve the inverse problem of identifying the activity of presynaptic populations from LFPs (Tanskanen et al., 2005). However, in general this problem is ill-posed, requiring special assumptions, and treatment of the data (Makarov et al., 2010). Recently, we succeeded in disentangling the ongoing LFPs in the rat hippocampus into constituting generators (Korovaichuk et al., 2010; Makarov et al., 2010). Each generator was considered as an entity formed by a single afferent and a single target neuron population. The afferent population sends spikes that produce synaptic currents across the membranes of the target neurons, which give rise to LFPs in the extracellular space. We showed that the generators are stable in different animals and that they match the expected spatial pattern of known axon terminations from different projecting nuclei. The time courses of the activity of the LFP-generators identified were very irregular, which probably reflects the sparse and essentially asynchronous interactions between different nuclei. However, the absence of tools to study these results in more depth makes it difficult to confirm this assumption. Here using realistic modeling of LFPs followed by experimental verification we provide a general biophysical framework to read LFPs in terms of the specific electrogenesis of the contributing neurons and the different synaptic pathways converging onto them.
The computations performed indicate that the model generated is consistent for LFPs in laminated structures, outperforming methods based on frequency decomposition. The model indicates that the application of ICA to simultaneous linear recordings of LFPs reveals the spatial location of synaptic inputs with subcellular accuracy, and that it may define the synaptic time envelope produced by different afferent nuclei in the millisecond scale. Apparent deviations from ideal LFP-generators were caused by intracellular interactions amongst coincident synaptic inputs. The model was tested on real LFPs in the hippocampus and it proved to be reliable to separate different spontaneous or evoked converging inputs with matching of pre- and post-synaptic activities.
Results
LFP-Generators and Single Cell Synaptic Currents in Laminar Neuronal Structures
The problem of unmixing synaptic currents elicited by different afferent neuron populations is highly simplified in regular structures with suitable architectures and connectivity. Conveniently, some favorable cases exist in nature, such as the CA1 region of the hippocampus, which we have chosen here as a test bed. This structure has one dominant neural population, comprised of pyramidal cells arranged in a palisade (Lorente de Nó, 1934), and the synaptic inputs to this structure are stratified, which ensures the spatial stability of field potentials. In addition, each axon is connected to several neurons, which reduces local differences and can be approached reasonably by homogeneous activation (see below). The build-up of laminar LFPs from aggregating multiple cell currents is illustrated by a conveniently simplified simulation (Figure 1A), whereby synaptic inputs produce quadrupole-like extracellular fields (panel 1), with a spatial distribution that differs for synaptic activation in distinct subcellular domains (panel 2). Although elementary transmembrane currents produced extracellular field potentials that fall rapidly at a distance (Lorente de Nó, 1947a,b; Rall and Shepherd, 1968), they are preserved in laminar structures where converging axons from different nuclei make contacts in stable discrete dendritic bands across a large number of cells (panel 3). Such spatial differences can be captured by a linear array of electrodes spanning the main cell axis (rec in panel 3).
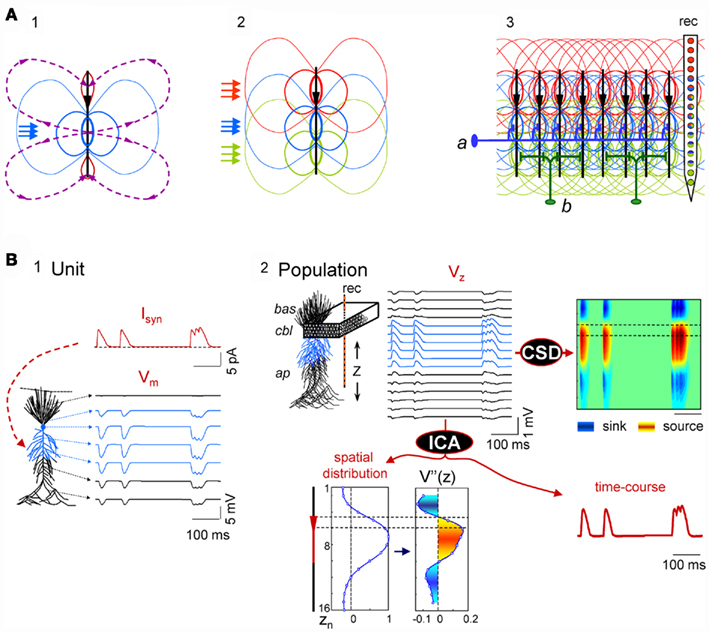
Figure 1. Scaling single neuron currents to macroscopic LFPs and their separation by independent component analysis (ICA). (A) The problem of the mixing of currents in the volume constituting LFPs is simplified in regular structures. A synaptic input to a single neuron (blue arrows in subplot 1) produces quadrupole-like extracellular fields (blue and red isopotential curves) and currents (dashed curves). Due to the spread of currents in the extracellular volume, the field potentials generated by several synapses in different domains overlap strongly (panel 2), but in regular structures with stratified inputs the simultaneous activation of many neurons produce laminar field potentials that are specific for each input (panel 3), and they can be captured by fix groups of electrodes within linear recording arrays (rec). a and b schematically illustrate the multicellular connection of axons from extrinsic neurons and local interneurons, respectively. (B) An irregular series of inhibitory synaptic currents (panel 1, unit, Isyn) is injected to a dendritic band (blue compartments) of one model neuron enabling the calculation of the compartmental membrane potentials (Vms) and currents (Ims) along the neuron anatomy. The Ims of the single neuron are replicated in a CA1 aggregate (subplot 2, population) of model neurons to build the LFPs, which were estimated along a 16-point recording track (rec). LFPs are stratified along the main Z-axis of single units (VZ) and they can be analyzed by current-source density analysis (CSD), or decomposed into their contributing generators by ICA. The ICA reports only one generator, with its spatial distribution and time course. The second spatial derivative of the spatial distribution, V”(z), renders the location of active currents (in yellow/red), which match the locus of activated synapses. The time course of the ICA-derived LFP-generator precisely matches the injected synaptic current on each single neuron. Cbl, cell body layer; bas, basal dendrites; ap, apical dendrites.
Figure 1B illustrates the computation performed to simulate LFPs and the relationship between single cell currents and LFPs using thoroughly tested and detailed biophysical models of a CA1 pyramidal unit and aggregate (see Materials and Methods, and López-Aguado et al., 2001; Makarova et al., 2007, 2010; Varona et al., 2000). A series of presynaptic spikes was transformed in a time varying inhibitory synaptic current, Isyn, injected into a dendritic band of a single cell (GABAA type, 60 nS; Figure 1B, panel 1). The current produced changes in the membrane potential, Vm, and compartmental transmembrane currents (Ims) along the entire length of the cell as expected from its active and passive properties. Then, the entire Ims of a single model neuron were scaled up to an aggregate assuming a homogeneous synaptic input to the population (Figure 1B, panel 2). Finally, the LFPs at 16 points, simulating a 16-tip linear electrode (Z-axis), were calculated from the aggregate transmembrane currents (see Eq. 3 in Materials and Methods; Figure 1B, Vz in panel 2).
The LFPs obtained resembled a simplified but realistic situation of controlled dominant activation of a single pathway (a single LFP-generator). As expected, the current-source density (CSD) analysis of the simulated LFPs (Nicholson and Llinás, 1971; Nicholson and Freeman, 1975; Mitzdorf, 1985) yielded the correct location, polarity, and magnitude of the transmembrane currents in the volume (Figure 1B, panel 2, right). The ICA of the same LFPs returned one significant generator (Figure 1B, bottom), with a spatial distribution matching the spatial extracellular voltage profile for this synaptic input and with a temporal activation (time course) that precisely matched the unitary synaptic current (compare to Isyn). We note that the spatial distribution and time course of the generator are dimensionless, and that the polarity can be retrieved from a CSD applied on reconstructed pathway-specific LFPs (Korovaichuk et al., 2010; Makarov et al., 2010). To obtain the subcellular distribution of population currents we evaluated the second spatial derivative of the spatial distribution of the generator, and its profile accurately matched the compartmental Ims in a single cell. Thus, in the presence of the activity of a single LFP-generator we were able to reconstruct its (spatiotemporal) synaptic activity by analyzing the recorded LFPs.
Thus it was demonstrated that in this type of regular laminated structure the aggregate extracellular potential has a stratified spatial distribution along the main cell axis at each time instant. Consequently, although multiple afferent nuclei may initiate concurrent postsynaptic currents in the same target neurons (multiple LFP-generators), each one produces a distinct spatial distribution when considered separately (i.e., they raised pathway-specific LFP profiles with a specific subcellular definition; Andersen and Lømo, 1966; Buzsáki et al., 1986; Herreras, 1990; Leung et al., 1995; Korovaichuk et al., 2010; Makarov et al., 2010). Together with a quasilinear effect of synaptic inputs onto LFPs, this enables the ICA to be applied to separate LFP components whose spatial distributions can be compared to the cytoarchitecture of known cell generators in order to identify LFP-generators (Stone, 2004; Choi et al., 2005; Makarov et al., 2010).
Spatial and Temporal Accuracy in the Separation of Multiple LFP-Generators
To test the quality of the separation of the ongoing activity of multiple pathways that converge on target neurons, we simulated LFPs evoked by several synaptic inputs to each cell in the aggregate. Subsequently, the LFPs were analyzed by an ICA and the spatial distribution and time courses of the significant generators found were compared with the original values (i.e., those obtained by the ICA of the LFPs raised using one generator at a time, as in Figure 1B).
One example of this analysis was LFPs obtained by mixing four randomly activated synaptic inputs (Figure 2A): two inhibitory (GABAA type, G1 and G3) and two excitatory (G2 and G4) inputs that made synaptic contacts in different subcellular domains (see the locations in the scheme of Figure 2C). The ICA successfully resolved the mixed LFP-generators and returned exactly four significant generators (relative variance >5%), each with an accurate spatiotemporal definition that matched the original individual generators. The time course and spatial distributions of the ICA-separated and the original generators are shown superimposed in Figures 2B,C, respectively. The time courses proved to be accurate to milliseconds time scale (Figure 2D, left panel), which enables detection of single synaptic events in the activity of afferent upstream generators. Nevertheless some degree of cross-contamination was detected (Figure 2D, right panel). The most contaminated ICA-isolated LFP-generators G2 and G3 contained less than 10% of the power originally belonging to G1 (most powerful generator). Then we tested what might be the minimal time interval at which generators could still be identified. By analyzing LFP segments of increasing duration, we found that the optimal minimum varied for different inputs according to a number of parameters, including the spatiotemporal properties of the inputs, the specific mixture tested, and the geometric properties of the postsynaptic neurons. Figure 2E illustrates spatial distributions for the generators G1 and G4 obtained by the ICA of segments of LFPs of three different durations. The spatial distributions of G4 converge faster than those of G1. We found that a 4-s period was long enough for safe spatial convergence of all four generators (Figure 2F). Once spatial convergence was achieved, temporal fidelity was optimal (see below).
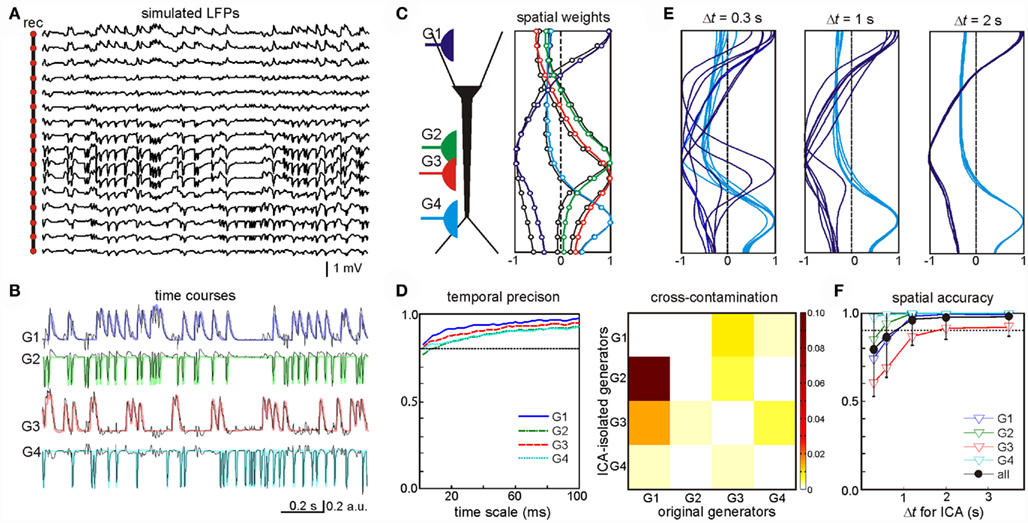
Figure 2. Optimal performance of the ICA to disentangle multiple synaptic inputs in mixed LFPs. (A) An example of LFPs obtained by combining four irregular time series of inhibitory (G1, G3) and excitatory (G2, G4) synaptic inputs in different neuron domains [see location in (C)]. (B,C) The ICA returned four significant generators whose time course (B) and spatial distributions (C) matched those obtained when analyzing single generator LFPs (labeled in a color code). (D) Left: estimation of the wavelet coherence of the ICA-derived generator’s time course and the corresponding dynamics of each original pathway-specific generator. Temporal fidelity of the time courses is kept up to the millisecond time scale. Right: index of cross-contamination of each generator to all others. Note the low cross-contamination level. (E,F) The LFP-generators require a different minimum duration of LFPs for the ICA to separate them optimally. The plots correspond to seven different segments of increasing duration for two of the generators [G1 and G4, (E)]. Note the faster convergence of the spatial curves in G4. The spatial jitter was associated to the degree of coincidence of each generator with other inputs. For durations longer than 3 s all generators showed acceptable spatial accuracy (F).
We assayed a total of 98 different synaptic inputs (GABAA: 39; GABAB: 28; Glu: 31) in 80 different combinations (47 of two different inputs, 8 of 3, 12 of 4, and 13 of 5: see detailed specifications in the Figure A1 and Table A1 in Appendix). We tested different temporal patterns (rhythmic and irregular), input strengths, subcellular locations and widths of the postsynaptic dendritic domain, as well as the degree of spatial overlap among the synaptic inputs. The frequency of the rhythmic inputs (35 in total) ranged from 6 to 15 Hz for GABAA/GABAB, and from 6 to 20 Hz for Glutamate. Non-rhythmic inputs (63 in total) had an average firing rate within 6–20 and 6–30 Hz for GABA and Glutamatergic inputs, respectively. Globally, the width of the synaptic zones along the dendritic band varied from 100 to 450 μm (a neuron is 750 μm long; see Figure 1B), and the spatial overlap between combined inputs in the postsynaptic membrane varied from none to complete overlap (in this case, one was always wider than the other). The results are summarized in Figure 3.
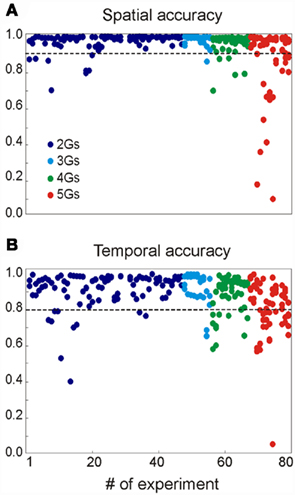
Figure 3. Summary of the results obtained for 80 multisynaptic LFPs. The plots show the spatial (A) and temporal (B) accuracy of each generator derived from mixed LFPs when compared to their values alone (see Methods). The values of the different generators obtained in each simulation are represented by the dots in the same vertical position. The parameters for the synaptic combinations can be found in the Appendix.
On average, we were able to reconstruct the original inputs from the LFPs simulated in 99% of cases. In 17 cases (21%), an extra generator was found along with the original inputs, although it contained more than 5% of the relative variance in seven cases only. For each simulation we quantified the efficiency of separation of LFPs into generators by calculating: (i) the similarity (or distance) between spatial distributions (bound between 0 and 1, where d = 0 corresponds to a perfect match); and (ii) the correlation index of the time courses. The spatial accuracy (α = 1 − d) of the generators isolated by the ICA is shown in Figure 3A. Deficient spatial matching (α < 0.9) was only frequent in the more complex mixture of inputs (see below for unfavorable factors). The differences involved modest unbalancing of negative and positive phases of the spatial curves, or slight shifts affecting parts of the curve. Typically, the alterations in the voltage distributions found did not modify the distribution of the transmembrane currents (equivalent to a CSD analysis) and accordingly, they still accurately reflected the location of the synaptic input. In other cases, the cross-contamination consisted in small bumps or dips. While both rhythmic and random inputs were efficiently revealed by the ICA, the former were more susceptible to cross-contamination.
The correlation indexes between the time courses of ICA-isolated LFP-generators and their value in isolation are shown in Figure 3B, where 192 out of 238 inputs (or 81.7%) had an index above 0.8, and only 9 scored below 0.6 (3,8%). Again the majority of these were found in the more complex inputs and contributed with a reduced relative variance (power).
Factors that May Reduce Performance
Let us now examine in detail the few input combinations that yielded the worst results in Figures 3A,B. The most relevant factors were (from strong to weak): (i) the relative variance (power) of the generators; (ii) the amount of synchronous activation; (iii) the cell geometry; and (iv) the electrotonic cell properties. All these factors turned out to be interdependent such that the analysis of any one of these may be strongly affected by the others.
The most influential factor in promoting cross-contamination was a strong imbalance between the powers contributed by different generators to the mixed LFP profile. As such, the stronger generators can introduce some contamination to the weaker ones. In general, synaptic inputs contributing at least 10% to the total variance of the LFPs had a correlation index above 0.8 (i.e., they were well separated). For weaker generators, we found that their secure identification not only depends on their variance but also, on other factors. Figure 4 shows an example of a two-input combination, an apparently random GABAA (60 nS, G2 in green) input partially overlapped with that mediated by GABAB (30 nS, G1 in blue). Despite the weaker maximum conductance (30 vs. 60 nS), the slower kinetics and stronger driving force of G1 led to a much stronger contribution to the total variance than G2. As a second factor, we used the degree of temporal coincidence or synchronization among the generators (0% and 25%, as illustrated in Figure 4). While the spatial distribution of the stronger generator G1 was stable, irrespective of the degree of synchronization (see below), the weaker generator G2 underwent a spatial shift (dashed vs. solid lines in Figure 4A, respectively). However, the shift was not strong enough to confuse the location of synaptically mediated transmembrane currents (CSD panel). Small bumps (or dips, depending on the relative polarity of synaptic currents) appeared at the sites of the weak generators at the location where the strong ones peaked. Spatial contamination altered the time course of the cross-contaminated generators (in Figure 4B, the arrows mark the timing of the synaptic inputs: note the contaminating residues left in the other generator). Typically, the strong generator (G1) captures more of the activity of the weak one (G2: see the reduced variance for the weak generator during partial temporal overlapping). Nevertheless, the weak generator always preserved the initial phase of the individual synaptic bouts even in the worst cases (asterisks in Figure 4B). Thus we can always identify the timing of synaptic activation. Figure 4C shows the accuracy of the time courses and of the spatial distributions vs. the degree of coincidence of the inputs. As expected the time accuracy of the weak generator (G2) decreases as the coincidence index increases, while the strong generator (G1) keeps its time course at the same accuracy level. The index of spatial accuracy shows similar behavior for low and moderate values of the input coincidence. However, at 100% coincidence the spatial accuracy of G2 rose to 100%. This surprising result is explained by the unidirectional flow of variance among the generators. The strong generator G1 absorbed all slow part of activations (as marked by asterisks in Figure 4B), while G2 kept fast synaptic bouts without additional perturbations from G1. This enables correct identification of the spatial weights of G1 and G2, whereas the time courses may show significant deviations from the original pathway-specific signals. We notice that such behavior emerges due to the intracellular interaction between generators (see below).
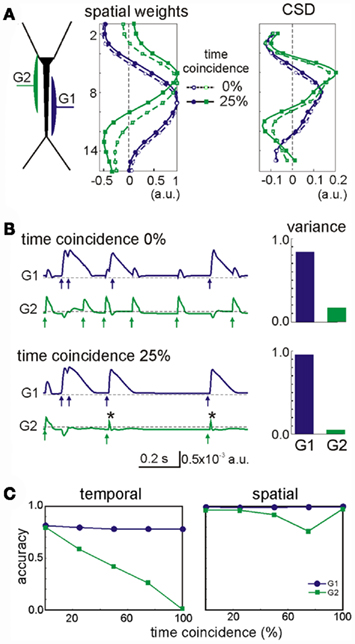
Figure 4. Spatial and temporal cross-contamination between LFP-generators with a strongly unbalanced contribution. (A) The example corresponds to LFPs modeled by combining spatially overlapping of GABAB dendritic inhibition (G1, blue) and perisomatic GABAA inhibition (G2, green). Irregular series of synaptic inputs were injected in the two generators with a variable degree of temporal coincidence between them (case I: 0% and case II: 25%). The spatial distribution of the strong generator (G1) was stable, but that of the weak generator (G2) underwent a slight spatial shift when the two inputs had a partial temporal coincidence (25% of the time), which did not however modify the estimation of the synaptic loci (CSD). Note the small bump in the CSD curve of the weak generator at the site where the stronger generator peaked. (B) Cross-contamination can also be observed in the respective time courses of the generators (arrows mark the timings of synaptic inputs and asterisks show coincident inputs). The cross-contamination grew larger as the inputs coincided for a longer period (case I vs. case II). G1 got extra power (variance) from G2. (C) The strong generator (G1) practically does not suffer from coincident inputs. However, the time course of the weak generator (G2) may be severely distorted by coincident inputs and a significant part of its contribution lost. The spatial distribution of the weak generator also becomes worse for higher coincidence level, but at 100% coincidence G2 recovers its original spatial distribution (see main text).
Effects of Cell Geometry, Electrotonic Parameters, and Intracellular Interactions between Generators
We also explored the intracellular factors that may lead to cross-contamination in ICA-separated LFP-generators. In a few cases the ICA returned more statistically significant LFP-generators than the number of synaptic inputs used in simulations. Figure 5A illustrates an example of the synaptic combination of two generators: G1, GABAA perisomatic inhibition and G2, distant apical excitation (red and blue, respectively). Two ICA-separated LFP-generators accurately described the locations of these two inputs. However, ICA also found an additional generator, G3 (Figure 5, gray, variance >5%), whose spatial distribution appeared to be a mixture of the active (synaptic) zones of the other two (note the opposite polarity for excitatory and inhibitory membrane domains). These generators were revealed in the second spatial derivative (CSD spatial distribution) and a close inspection of the time course of each generator confirmed the hybrid nature of the extra generator. Indeed, the bouts of activity in the G3 generator only arose in the periods when the two original inputs were co-activated (i.e., the periods when the electrogenesis of the subsynaptic membrane of each input “sensed” the conductance change produced by the other). In these periods, the overall spatial distribution of the transmembrane currents along the neuron’s anatomy differed from any of the original inputs, constituting a true spatial configuration of currents that the ICA detected separately. This interpretation is supported by the fact that an increase in the electrical distance between G1 and G2 (by moving G1 away from G2) diminished the variance (power) of G3 (Figure 5B).
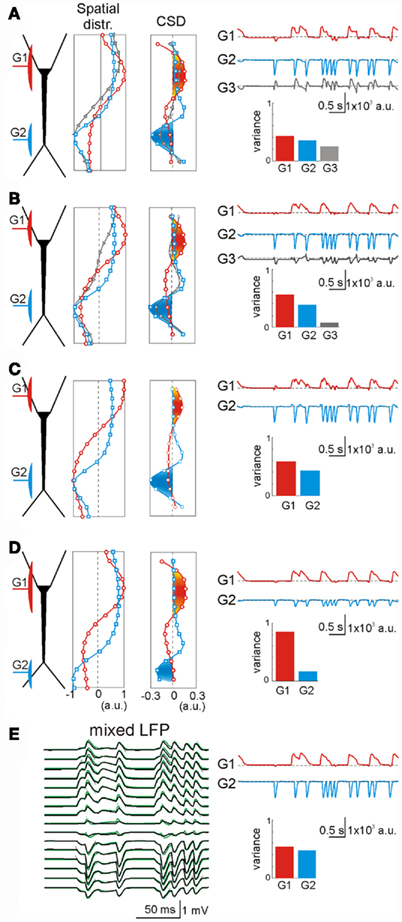
Figure 5. Extra generators may rarely arise due to intracellular interactions of coincident synaptic currents. (A) An inhibitory perisomatic (GABAA) input (G1, red) was combined with a non-overlapping dendritic excitatory input (G2, blue), both under irregular regimes. The ICA returned three generators, two of them matching the spatial distributions of the original individual inputs. The extra generator (G3, gray) presented an intermediate spatial distribution, and its time course revealed activity when the inputs coincided. (B) A slight shift of the inhibitory input away from the excitatory one reduced the variance of the extra generator down to the 5% border of significance (see Materials and Methods). (C) A further spatial shift of the inhibitory input toward the opposite dendritic tree yielded a perfect separation of the mixed LFPs into the two generators. (D) A distal shift of the excitatory input also led to perfect separation of the contributing LFP-generators [to be compared with (A)]. (E) To assess the intracellular origin of the extra generator we applied an ICA to mixed LFPs with the same synaptic inputs but obtained by numerical addition of their respective currents (without neurons). In this case (to be compared with A), the separation of the generators was optimal. The slight deviations of neuron-mediated (black) and numerically obtained LFPs (green) quantitatively estimate the mutual interactions of synaptic currents converging on the same neuron.
The intracellular interaction of synaptic currents on different membrane domains is highly dependent on the fine geometry of the cells (López-Aguado et al., 2002). Thus, when the inhibitory input G1 was moved still further away, thereby sparing the large cell somata, the interaction between inputs decreased further and the ICA did not return a third generator (Figure 5C). Although the soma membrane is electrically close to the apical dendrites, the electrical distance to the basal dendrites increased disproportionally due to the impedance mismatch at the thin somato-basal junctions. Similarly, the third generator also disappeared when the excitatory input G2 moved distally into the fine dendrites of the apical tuft (Figure 5D). In this case, the electrical distance between the inputs also increased notably due to the strong capacitive load imposed by tapering dendrites. Similar effects were observed by modifying the membrane capacitance and the resistance of the model neurons (not shown).
In order to confirm the intracellular origin of cross-contaminations we applied ICA over LFPs obtained by direct summation of LFPs created by two single generators, i.e., without modeling the interaction of the synaptic currents inside the neuron (Figure 5E). This procedure is feasible under the assumption of linearity of the neuron and satisfies completely the ICA’s data model. As expected, application of the ICA yielded an ideal separation of the two components with near zero cross-contamination. Superimposing the neuron generated and numerically mixed LFPs revealed small but decisive differences, which reflected the aggregate estimate of the intracellular interactions between the two synaptic currents (compare black and green LFPs in Figure 5E). This result highlights the importance of electric interactions inside single cells in the configuration of external LFPs and it also demonstrates the high spatial sensitivity of the ICA. Finally, we explored the role of voltage-dependent channels by comparing the performance of the ICA on LFPs modeled with and without V-dependent channels. We found no noticeable effects on the low amplitude synaptic inputs employed here to simulate ongoing LFPs.
Separation of Synaptic Inputs in Real Ongoing LFPs
The theoretical findings corroborate our hypothesis that the use of an ICA is reliable to accurately disentangle real LFPs into the separate contributions of synaptic inputs. Thus, we subjected real hippocampal LFPs recorded with a linear array (32 recording sites, 50 μm apart) spanning the CA1 and dentate gyrus areas to the same analytical procedure used for the simulated LFPs.
To determine the presynaptic specificity of the ICA-separated LFP-generators, three different known excitatory pathways were electrically stimulated to introduce subthreshold evoked activity in the ongoing LFPs at known time instants. Figure 6A shows ongoing LFPs and zoomed epochs during which the commissural (Com), the Schaffer (Sch), and the perforant path (PP) inputs were activated (colored dashed lines). Although evoked field potentials were extensively overlapped throughout the recording electrodes, the application of ICA to the LFP segment defined five well-separated generators. Three of the disentangled LFP-generators were pathway-specific, whereby each contained activity for only one excitatory pathway. The respective spatial distributions were as expected for the activation of excitatory axons at locations of the somato-dendritic membranes of known target cells (Figure 6B): ipsilateral (G1) and contralateral (G2) CA3 pyramidal cells, and projection cells in the entorhinal cortex (G3). The other two additional LFP-generators (not shown) accounted for more than 70% of the total variance and probably corresponded to inhibitory inputs (for details see Korovaichuk et al., 2010).
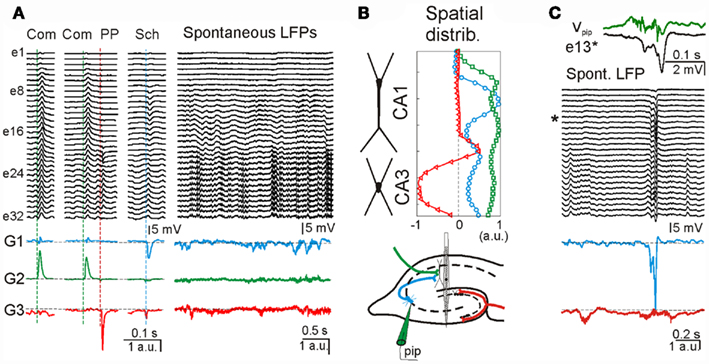
Figure 6. Separation of multiple synaptic inputs in hippocampal LFPs from live animals. (A) LFP segments recorded with a multielectrode linear probe (e1–e32) containing electrically evoked subthreshold activity of three different excitatory pathways in the hippocampus [stimulus time instants marked by dashed vertical line; Com: commissural input, green; PP: perforant pathway, red; Sch: Schaffer input, blue; see also (B), bottom subplot]. Three of the ICA-separated LFP-generators, G1–G3, contained the evoked activity of only one activated pathway (colored traces), i.e., they are pathway-specific. During spontaneous LFPs, according to the model, the time envelope of each of these generators corresponds to the varying intensity of synaptic currents generated by synaptic bombardment from neurons belonging to the same presynaptic population. (B) The spatial distribution of these generators (upper subplot) matched those expected for the respective anatomical distribution of afferent axons colored in the scheme of the hippocampal connections (bottom subplot). (C) Matching pre- and post-synaptic activity for one generator. The activity of the CA3 region was locally manipulated by pharmacological disinhibition applied through a pipette (pip, in B, bottom subplot). This treatment raised the hypersynchronous epileptic field bursts that are synaptically conveyed to the next relay in the CA1 region. One of these is enlarged in the upper traces as recorded locally (Vpip, green) and in the postsynaptic target in the CA1 apical dendrites (e#13, asterisk). Note the multiunit activity and a slight advance of the CA3 local field spike over that in CA1. The ICA-derived Schaffer LFP-generator (G1, blue) specifically captured the hypersynchronous volley of synaptic activity during the epileptic spike, while the upstream PP generator (G3, red) shows an independent activity.
Once the spatial distributions of the excitatory LFP-generators were identified, the synaptic envelope produced by the ongoing spontaneous activity of the respective presynaptic populations can be read out online (Figure 6A, right subplot, colored traces). We note that the activity of presynaptic populations can be evaluated from a distance, i.e., without directly recording the presynaptic nuclei. To confirm the presynaptic origin and specificity of ICA-separated LFP-generators, we artificially increased the activity of one of them (G1) by locally microinjecting a pharmacological GABA blocker, bicuculline (Figure 6B, bottom panel). Epileptogenic CA3 field burst activity initiated in the CA3 field was synaptically conveyed to the CA1 region (Figure 6C). There was a correspondence between the timing of a field burst recorded locally in the CA3, Vpip, and that registered in one of the electrodes in the target CA1 region, e13 (Figure 6C, top). From ICA-derived generators, only those originated in downstream populations displayed an epileptic spike (e.g., the Schaffer generator, blue trace in Figure 6C, bottom), unlike the upstream PP generator (red trace). Thus the ICA is indeed capable of separating the pathway-specific activity from raw LFP recordings.
Discussion
In this study, we describe a model of LFPs based on the spatial stationarity of synaptic inputs. The scaling up of single cell currents to macroscopic LFPs was achieved using a realistic model of a simple laminated brain region from which a bidirectional unit-to-population code can be derived. We then showed that spatially discerning analytical tools like the ICA provide precise separation of multiple contributing synaptic sources in model and real LFPs, representing the overall level of activity of the presynaptic populations involved. This approach may help more extensively and quantitatively exploit LFPs, linking unitary and network activities to behavior.
Contemporary neuroscience is particularly interested in the online reading of the activity of different afferent neuronal populations, and of the responses of target neurons. Besides inferring a unit-population neuronal code and linking neuronal activity to behavior, this possibility offers novel paradigms to implement brain–machine interfaces (Llinás and Makarov, 2002). In this context, our main objective was to establish an experimental and theoretical framework to use intracerebral recordings of LFPs to define the spatiotemporal information sent by afferent nuclei. In previous studies (Korovaichuk et al., 2010; Makarov et al., 2010) we showed that the ICA of LFPs enables pathway-specific synaptic inputs to hippocampal pyramidal cells to be identified and isolated. Here, we have validated the feasibility of this approach by using a realistic computational model of LFPs in laminated brain regions that was experimentally verified.
We show that the ICA provides precise separation of LFPs that contribute multiple synaptic sources into isolated LFP-generators. Each single LFP-generator describes a presynaptic neuronal population and their target neurons. For example, the Schaffer generator in the hippocampus is composed of ipsilateral CA3 pyramids projecting to CA1 pyramidal cells. The electric activity of an LFP-generator can be described by its spatial distribution, which is defined by the distribution of the synaptic terminals on target neurons and the time course of the overall functional spiking activity of the corresponding afferent population. We have shown that the profiles of the CSD for LFP-generators corresponding to the Schaffer, commissural, and perforant paths (entorhinal) match the cellular configuration of sinks and sources, as revealed by classic pathway-specific evoked potentials (Andersen et al., 1971; Herreras, 1990). We established the cause–effect relationship between population synaptic currents stratified in a dendritic domain and the spatial features of the corresponding LFP-generator. Thus, the electrical activity of LFP-generators is interpreted similarly to the well-known evoked potentials elicited by specific stimulation of one presynaptic afferent population. Indeed, the voltage and CSD spatial profiles of evoked potentials match the anatomical distribution of transmembrane currents in single cells, and the spatial distribution of the corresponding pathway-specific LFP-generators. We emphasize that the applicability of LFP-generators goes far beyond the evoked potentials, since the outstanding spatial and temporal fidelity of the ICA-separated LFP-generators found enables the presynaptic activity of different afferent neuron populations to be read online from ongoing LFPs, irrespective of their irregular or rhythmic temporal pattern.
We have demonstrated that the spatial resolution of isolated LFP-generators in the hippocampus is optimized to the subcellular level of the target neurons (down to at least tens of micrometers), which enables converging inputs to the pyramidal cells to be discriminated whether originated in remote nuclei or corresponding to subsets of local interneurons. Extraction of the temporal dynamics of the synaptic currents produced by a single LFP-generator offers a resolution in the millisecond time scale. Such fine temporal definition may be useful to identify the spiking activity of a single presynaptic cell (or a small cluster of coupled cells firing together) since there is no strong overlapping of synaptic currents (if the presynaptic nucleus does not show an excessive rate of firing). For example, this is applicable to study the ongoing unit-to-population activity of the Schaffer generator whose afferent pyramidal cells have the firing rate in the range of about 0–1 Hz.
When applying the ICA over different segments of experimental LFPs with irregular temporal patterns, we may find changes in the relative variance (power) of LFP-generators, small to moderate changes in their spatial distributions, signs of cross-contamination, and occasional hybrid (fused) or split generators. At a first glance this may appear discouraging and cast some doubt on the reliability of the companion time courses of an LFP-generator. However, we have shown that the same variability can be mathematically modeled in simulated LFPs. In most cases, it can be explained by the interaction of synaptic currents of several coactive LFP-generators within a single cell. Indeed, irrespective of the location and spatial scatter of synaptic terminals, the synaptic currents always generate transmembrane loops throughout the neuron. Hence, coincident inputs produce currents that necessarily interact with one another at any subcellular location. We have also shown that the mutual interaction of several inputs reduces with the increase of the electrical distance between them. In practical terms, we found that the jitter observed in the spatial distribution of LFP-generators rarely affects the precise location of active synaptic currents (synaptic terminals), although it may to some extent modify the distribution of passive return currents due to the membrane shunts laid down by other generators. In different LFP segments there is a variable cumulate time of mutual shunting, explaining the spatial jitter and the variable degree of the cross-contamination. Nevertheless, the spatial changes do not affect the initial phases of an isolated LFP-generator’s time course at least. We also found that identification of low power LFP-generators (e.g., the perforant pathway) can be facilitated by the extrinsic addition of variance. An LFP segment under study can be merged with another segment recorded at an identical position but containing few epochs of evoked activity introduced by subthreshold stimulation of the pathway of interest (Korovaichuk et al., 2010).
We have shown that the interplay between a cell’s geometry and the electrotonic parameters also underlies the few synaptic combinations when the ICA returns an extra generator. Such a generator has a spatial structure defined by the location of the active synaptic currents of the temporary coactive LFP-generators and the time course reflecting the coincidences in the activation of the real LFP-generators. We notice that the performance of the ICA is not a direct result of the appearance of extra generators but rather, it shows that the original LFP-generators interact through the target cells. In fact the degree of interaction can to some extent be quantified by analyzing the extra generator. Besides, if the coupling is not too excessive (as a rule, extra generators have low relative variance) small additive noise in post-processing the data can usually destroy the intracellular coupling, thereby helping to unmask the unwanted generators.
To save computation time, we pursued a model of LFPs that deliberately postpones the implementation of some at least partially relevant factors, such as heterogeneous tissue resistivity (López-Aguado et al., 2001; Makarova et al., 2008), and of frequency-dependent filtering phenomena (Bédard et al., 2010). Indeed, the extent of their quantitative relevance in LFP modeling is still unclear. An additional simplification is that we compiled individual synapses into compartments, thereby reducing the true ongoing synaptic bombardment of a single presynaptic spike series. While explicit modeling of individual synapses would be required to disclose possible sources of error, none of these elements would be expected to interfere with the performance of the ICA.
We must emphasize that the extraction, identification, and the use of ICA-derived LFP-generators is facilitated by: (i) the suitable (i.e., regular) anatomy of the region of interest; (ii) electrophysiological knowledge of the contributing neurons; and (iii) by the information for unit-to-population data scaling. The first two issues are dependent on available experimental data, while the third may require specific models to be tested for each brain region. While the simplified architecture of the hippocampus facilitates the comparison of known spatial profiles of pathway-specific evoked potentials to LFP-generators, the blind nature of the ICA ensures that there is no a priori limitation for its application on more complex structures, like the cortex. We suggest that modeling the realistic cytoarchitecture of each structure will help obtaining the clues for relating LFP-generators to the electrical activity of neurons and pathways. Finally, the proposed approach does not rely on the frequency content of the LFP-generators (in contrast to Fourier-based methods) and thus, synaptic generators working in a wide frequency range can be identified, as is likely to be found in any brain region. Hence, the parallel reading of their activity may uncover the processing capacity and functional roles of the brain region under study.
Materials and Methods
Simulation of Ongoing LFPs
Realistic simulation of LFPs requires mathematical modeling of the following four coupled components: (i) the spiking activity of afferent populations; (ii) the detail dynamics of single target cells; (iii) the neuronal aggregate; and (iv) the spreading of electrical currents in the extracellular space.
Simulation of synaptic inputs
We simulated inputs from up to five different afferent populations. For excitatory and inhibitory inputs we used the non-N-Methyl-D-Aspartate glutamate (Glutamatergic) and GABAA/GABAB receptors, respectively. All target neurons in the aggregate received the same inputs, which ensures that LFPs calculated over a vertical tract at the center of the slab contain proportional contributions, facilitating the interpretation of their interactions. For each input we simulated ongoing bombardment through afferent axons with either regular (rhythmic) or random (with Poisson distribution) spike trains. For rhythmic inputs, special care was taken to avoid frequencies producing resonant phenomena in the postsynaptic membranes (Leung and Yu, 1998). The frequency ranged from 6 to 20 and from 6 to 15 Hz for Glutamatergic and GABAA/GABAB inputs, respectively, and 6–30 and 6–20 Hz in simulations of non-rhythmic bombardment. Axon terminals were homogenously distributed over a dendritic band with the spatial extension along the main axis varying from 100 to 450 μm (the length of a neuron is 750 μm). The spatial overlap between different inputs varied from zero to full overlap (in this case, one was always wider than the other). The specific parameters for each simulation are presented in the Figure A1 and Table A1 in Appendix.
Single cell model
We simulated the dynamics of a realistic neuronal model with the average branching, total dendritic length and dendritic tapering of CA1 pyramidal neurons, as well as the variations in spine density observed in detailed morphometric studies (Bannister and Larkman, 1995a,b; Trommald et al., 1995). The model neuron has been thoroughly tested (López-Aguado et al., 2001; Ibarz et al., 2006; Makarova et al., 2007, 2010; Varona et al., 2000).
Neuronal geometry and the membrane’s electrical properties. The neuron consisted of 287 compartments distributed between the soma, apical and basal dendritic trees, and an axon consisting of myelinated portions, nodes of Ranvier, an axon initial segment and the axon hillock. The length of the compartments was always >0.01 and <0.2 λ. A detailed description of the cell morphology can be found at http://www.cajal.csic.es/ departamentos/herreras-espinosa/ca12011/index.html. The total effective area of the neuron was 66,800 μm2 (including the spine area), the membrane capacitance (Cm) was 1 μF/cm2 and the internal resistivity (Ri) was 100 Ω cm. The membrane resistivity (Rm) was 50,000 Ω cm2 for the soma, and it was variable for dendrites (Stuart and Spruston, 1998) according to: Rm(d) = 50,000 (0.15 + 0.85/(1 + exp((300 − d)/50))) where d is the distance to the soma in micrometers. The input resistance measured at the soma was 60 MΩ and the time constant was 18 ms. Dendritic spines were collapsed into the parent dendrites (Rall et al., 1992). As a result, the values of Rm and Cm of the parent compartments were compensated accordingly. For apical dendrites the surface ratio between spines and parent dendrites was set to 1:1 (Bannister and Larkman, 1995b) and thus we used a correction factor of two for spiny compartments (i.e., Rm was halved and Cm was doubled).
Ionic channels. We used 12 different types of ion channels to simulate the active properties of the cell membrane: two transient sodium currents in the axon and soma/dendrites; two calcium currents (high- and low-threshold); one hyperpolarization-activated “h” current; and seven potassium currents. These potassium conductances represented delayed rectifiers (one axonal and one somato/dendritic), a small persistent muscarinic type, a transient A-type (one proximal and one distal), a short-duration [Ca]- and a voltage-dependent, and long duration [Ca]-dependent. The conductance variables were described using a Hodgkin–Huxley type formalism (see details of the kinetics in Ibarz et al., 2006; Makarova et al., 2007; and the URL above). The reversal potentials for ion channels were set to ENa = 50 mV and EK = −90 mV. ECa was considered to be variable and dependent on the calcium concentrations.
Conductance densities. The channel distribution along the cell was tuned to accurately reproduce the unitary and population electrogenesis of the CA1 region (Varona et al., 2000; Makarova et al., 2007). In this study the densities of axonal conductances were diminished by a factor of 100 to avoid somato/axonal spike firing, while dendritic recruitment of V-dependent channels was permitted except where indicated. Such tuning was required to test some unrealistic combinations of synaptic inputs that would produce heavy firing, hampering the interpretation of the intracellular interactions between subthreshold currents.
Synaptic currents. The synaptic currents were modeled by:
with τsyn of 2, 7, and 30 ms, and reversal potential Esyn of 0, −75 and −90 mV for Glutamatergic, GABAA and GABAB inputs, respectively. For the sake of simplicity the synaptic conductances were homogenously distributed throughout the surface of all dendritic branches within the activated band. The conductance ranged between 4–12 and 30–60 nS for glutamatergic and GABAA/GABAB inputs, respectively. The excitatory input was normally subthreshold for local dendritic spikes (Ibarz et al., 2006).
The neuronal dynamics and transmembrane currents were calculated using the GENESIS simulator (Bower and Beeman, 1998). An exponential Euler (explicit) method was used with the integration step, dt = 1 μs.
The aggregate model
The dorsal CA1 region was modeled as a slab of tissue containing an aggregate of 16,966 morphologically identical units forming a palisade-like planar structure (1 mm × 1 mm). We preserved an experimentally observed cell density of 64 neurons in a 50 μm × 50 μm antero-lateral lattice (Boss et al., 1987), with their main axis in parallel and their soma contained in a cell body layer 50 μm thick, arranged as four uneven layers with 66% on the apical side, and 22 and 11% in the two basal layers. The dorso-ventral extension was 0.8 mm. Since we employed homogeneous activation throughout the population of target neurons, the estimation of compartmental currents was made in a single unit and the activation of the entire population was then mimicked by replicating the currents in all the neurons of the aggregate. In selected runs we checked for the possible effects of cell-to-cell anatomical variability by introducing free axial rotation in units, moderate vertical jitter (one layer vs. four-layered somata distributions), and random vertical jitter (within ±50 μm) in the coordinates of cell compartments. As expected (Varona et al., 2000; Makarova et al., 2010), the macroscopic averaging dampened microscopic differences.
Calculation of model LFPs
We assumed a homogeneous conductive medium with a constant extracellular conductivity σ (0.3 S/m, López-Aguado et al., 2002). Thus the current spread in the extracellular space Ω can be modeled by the Poisson equation:

where Ij(t)δ(x − xj) are the point transmembrane current-sources with amplitude Ij(t) obtained in the simulation of the dynamics of pyramidal neurons and the sum goes over all cells in the aggregate and their compartments. Using the fundamental solution of the Laplace operator in R3 we can approximate the potential near the center of the neuronal slab as:

where rj = ||x − xj|| is the Euclidian distance to the corresponding compartment. To simulate electrophysiological recordings we placed 16 virtual recording points h = 50 μm apart spanning from 250 μm above to 500 μm below the cell body at the center of the population in parallel to the somato-dendritic axis. The simulated LFPs are given by

Calculations of LFPs were programmed in a custom C code.
Identification and Comparison of LFP-Generators
As an input for the data analysis we used either experimental recordings or simulated LFPs obtained from Eq. 4.
Independent component and current-source density analyzes
The mathematical procedure and detailed signal treatment were described elsewhere (Makarov et al., 2010). Briefly, the 16 LFP signals  along a track parallel to the main axis of principal cells can be represented as the weighted sum of the activities produced by N LFP-generators:
where V = [V1,V2,…,VN]T is the mixing matrix composed of the so-called voltage loadings or spatial distributions of all the LFP-generators along the main axis z, and  are their time courses or activations. We notice that the model (5) is not compatible with the principal component analysis but it perfectly fits the ICA. For the ICA we made use of the infomax algorithm proposed by Bell and Sejnowski (1995). The algorithm is implemented in the EEGLAB Matlab toolbox (Delorme and Makeig, 2004) and it returns the time courses and spatial distributions of up to 16 LFP-generators, although only some of them appear to be significant (as also applies to real recordings).
An LFP-generator was considered to be significant if its relative variance
exceeded 5%. In general the generators with lower variance were found to be unstable (i.e., their spatial and temporal characteristics randomly varied over different time intervals). We note that dimension reduction or additive noise may help to identify stable generators. Due to the ambiguity of the ICA, the voltage loadings and time courses are given in arbitrary units. Nevertheless, the reconstructed virtual LFPs created by the contribution of a single LFP-generator (if it were active alone) un(t) = Vn(z)sn(t) are dimensional and have the correct polarity. Thus, reconstructed virtual LFPs are also called pathway-specific LFPs.
Using (2) we can introduce the so-called CSD-loadings for each LFP-generator:

which yields the CSD for a single LFP-generator: CSDn = In(z)sn(t). The CSD maps for raw (mixed) LFPs can be evaluated by approximating the Laplace operator by 1D finite difference:

Quantifications of spatial and temporal accuracy of LFP-generators
In order to compare the reliability of ICA-extracted LFP-generators we estimated their spatial fidelity and temporal precision by comparing their values in pathway-specific LFPs.
As the temporal index we used the coefficient of linear correlation

where cvw, cv, and cw are the covariance and variances of the time courses of two LFP-generators v(t) and w(t). An LFP-generator was considered well separated if its temporal index exceeded 80%.
To compare spatial distributions we used the following distance measure (Makarov et al., 2010): d(Vk,Vm) = 1 − |〈Vk,Vm〉|/||Vk||||Vm||, where 〈Vk,Vm〉 is the inner product in H2(Ω)and ||Vk|| is the corresponding norm. The distance measure is bounded 0 ≤ d ≤ 1 and d = 1 for two orthogonal (completely different) whereas d = 0 for two equivalent (identical) spatial distributions. Then the index of spatial accuracy of an ICA-isolated LFP-generator is

where d(VICA,V0) is the distance between ICA-isolated and the original pathway-specific voltage loadings. An LFP-generator was considered well separated if its index of spatial accuracy exceeded 90%.
To estimate the temporal precision of an LFP-generator over different time scales, τ, we evaluated the wavelet coherence of the generator’s time course and the corresponding dynamics of pathway-specific generator C(τ,t) (wcoher() in Matlab, Haar mother wavelet). Then the mean coherence quantifies the temporal precision at different time scales:

To evaluate the temporal cross-contamination of the time course  of a given ICA-isolated LFP-generator by the pathway-specific LFP-generators,
  we introduced the following index:
where ||·|| is the norm corresponding to the following inner product 〈x,y〉 = ∈tx(t)y(t)dt and the matrix {aki} is obtained by solving the linear system: Hak = bk; where H = {hik},  ak = [ak1,…,akN]T, bk = [bk1,…,bkN]T,
  The index (12) is equivalent to the proportion of the extrinsic power contaminated by the i-th generator, and the power of the original k-th generator.
Experimental Recordings
We anesthetized Sprague-Dawley rats (200–250 g) with urethane (1.2 g/kg i.p.) and attached a stereotaxic device. The surgical and stereotaxic procedures employed are described elsewhere (Canals et al., 2005). Three different afferent excitatory populations that target the CA1 field were electrically stimulated: the contralateral (commissural), ipsilateral (Schaffer) CA3 fields, and the entorhinal cortex (perforant pathway). The stimuli (0.1 ms square pulses, 0.1–0.5 Hz) were delivered through bipolar electrodes and the amplitude was adjusted to about one third of the population spike threshold. The number of stimuli was such that the evoked fields introduced a variance never exceeding 5% of the total. A linear multisite recording probe (A1 × 32-6 mm 50–413; Neuronexus Technologies, Ann Arbor, MI, USA) was lowered into the hippocampus (AP: 4.5–5.5, L: 2–3 mm) and connected to a multiple high-impedance head stage. Such 32-site probes spanned both CA1 and DG/CA3 regions. In some experiments an additional pipette was used to record from a presynaptic population and to modify its ongoing activity by reducing local inhibition by administering microdrops of the GABA-A blocker bicuculline (1 mM). After filtering (0.5 Hz–5 kHz band) and amplification, the electrical potentials were acquired (50 kHz acquisition rate) using a MultiChannel System recording hardware and software (Reutlingen, Germany). Spontaneous LFPs were treated similarly to simulated LFPs.
All the experiments were performed in accordance with European Union guidelines (86/609/EU) and Spanish regulations (BOE 67/8509-12, 1988) regarding the use of laboratory animals. The experimental protocols were approved by the Committee for Animal Welfare at the Cajal Institute.
Conflict of Interest Statement
The authors declare that the research was conducted in the absence of any commercial or financial relationships that could be construed as a potential conflict of interest.
Acknowledgments
We thank M. Sefton at BiomedRed for editorial support, O. Herreras Jr. for help with graphing, and A. Fernández Ruiz and G. Martín Vázquez for critical reading and comments. This study has been financed by grants FIS2010-20054 and BFU2010-19192 of the Spanish Ministry of Science and Innovation.
References
Andersen, P., Bliss, T. V. P., and Skrede, K. K. (1971). Lamellar organization of hippocampal excitatory pathways. Exp. Brain Res. 13, 222–238.
Andersen, P., and Lømo, T. (1966). Mode of activation of hippocampal pyramidal cells by excitatory synapses on dendrites. Exp. Brain Res. 2, 247–260.
Bannister, N. J., and Larkman, A. U. (1995a). Dendritic morphology of CA1 pyramidal neurones from the rat hippocampus: I. Branching patterns. J. Comput. Neurol. 360, 150–160.
Bannister, N. J., and Larkman, A. U. (1995b). Dendritic morphology of CA1 pyramidal neurones from the rat hippocampus: II. Spine distributions. J. Comput. Neurol. 360, 161–171.
Bédard, C., Rodrigues, S., Roy, N., Contreras, D., and Destexhe, A. (2010). Evidence for frequency-dependent extracellular impedance from the transfer function between extracellular and intracellular potentials: intracellular-LFP transfer function. J. Comput. Neurosci. 29, 389–403.
Bell, A., and Sejnowski, T. (1995). An information-maximization approach to blind separation and blind deconvolution. Neural. Comput. 7, 1129–1159.
Boss, B. D., Turlejski, K., Stanfield, B. B., and Cowan, W. M. (1987). On the numbers of neurons in fields CA1 and CA3 of the hippocampus of Sprague-Dawley and Wistar rats. Brain Res. 406, 280–287.
Bower, J. M., and Beeman, D. (1998). The book of Genesis. Exploring Realistic Neural Models with the GEneral NEural SImulation System, 2nd Edn. New York: Springer Verlag.
Brankack, J., Stewart, M., and Fox, S. E. (1993). Current source density analysis of the hippocampal theta rhythm: associated sustained potentials and candidate synaptic generators. Brain Res. 615, 310–327.
Buzsáki, G., Czopf, J., Kondákor, I., and Kellényi, L. (1986). Laminar distribution of hippocampal rhythmic slow activity (RSA) in the behaving rat: current-source density analysis, effects of urethane and atropine. Brain Res. 365, 125–137.
Buzsáki, G., Leung, L. W., and Vanderwolf, C. H. (1983). Cellular bases of hippocampal EEG in the behaving rat. Brain Res. 287, 139–171.
Canals, S., López-Aguado, L., and Herreras, O. (2005). Synaptically-recruited apical currents are required to initiate axonal and apical spikes in hippocampal pyramidal cells: modulation by inhibition. J. Neurophysiol. 93, 909–918.
Choi, S., Cichocki, A., Park, H. M., and Lee, S. Y. (2005). Blind source separation and independent component analysis: a review. Neural Inf. Process. Lett. Rev. 6, 1–57.
Csicsvari, J., Jamieson, B., Wise, K. D., and Buzsáki, G. (2003). Mechanisms of gamma oscillations in the hippocampus of the behaving rat. Neuron 37, 311–322.
Delorme, A., and Makeig, S. (2004). EEGLAB: an open source toolbox for analysis of single trial EEG dynamics including independent component analysis. J. Neurosci. Methods 134, 9–21.
Eccles, J. C., Sasaki, K., and Strata, P. (1967). Interpretation of the potential fields generated in the cerebellar cortex by a mossy fibre volley. Exp. Brain Res. 3, 58–80.
Einevoll, G. T., Pettersen, K. H., Devor, A., Ulbert, I., Halgren, E., and Dale, A. M. (2007). Laminar population analysis: estimating firing rates and evoked synaptic activity from multielectrode recordings in rat barrel cortex. J. Neurophysiol. 97, 2174–2190.
Herreras, O. (1990). Propagating dendritic action potential mediates synaptic transmission in CA1 pyramidal cells in situ. J. Neurophysiol. 64, 1429–1441.
Hyvärinen, A., and Oja, E. (2000). Independent component analysis: Algorithms and applications. Neural Netw. 13, 411–430.
Ibarz, J. M., Makarova, I., and Herreras, O. (2006). Relation of apical dendritic spikes to output decision in CA1 pyramidal cells during synchronous activation: a computational study. Eur. J. Neurosci. 23, 1219–1233.
Jack, J. B., Noble, D., and Tsien, R. (1975). Electric Current Flow in Excitable Cells. Oxford: Clarendon Press.
Korovaichuk, A., Makarova, J., Makarov, V. A., Benito, N., and Herreras, O. (2010). Minor contribution of principal excitatory pathways to hippocampal LFPs in the anesthetized rat: a combined independent component and current source density study. J. Neurophysiol. 104, 484–497.
Leung, L. S., Roth, L., and Canning, K. J. (1995). Entorhinal inputs to hippocampal CA1 and dentate gyrus in the rat: a current-source-density study. J. Neurophysiol. 73, 2392–2403.
Leung, L. S., and Yu, H. W. (1998). Theta-frequency resonance in hippocampal CA1 neurons in vitro demonstrated by sinusoidal current injection. J. Neurophysiol. 79, 1592–1596.
Llinás, R. R., and Makarov, V. A. (2002). “Brain-machine interface via a neurovascular approach”, in Converging Technologies for Improving Human Performance. Nanotechnology, Biotechnology, Information Technology and Cognitive Science, eds M. C. Roco and W. S. Bainbridge (Dordrecht: Kluwer Academic Publishers), 244–251.
López-Aguado, L., Ibarz, J. M., and Herreras, O. (2001). Activity-dependent changes of tissue resistivity in the CA1 region in vivo are layer-specific: modulation of evoked potentials. Neuroscience 108, 249–262.
López-Aguado, L., Ibarz, J. M., Varona, P., and Herreras, O. (2002). Structural in homogeneities differentially modulate action currents and population spikes initiated in the axon or dendrites. J. Neurophysiol. 88, 2809–2820.
Lorente de Nó, R. (1934). Studies on the structure of the cerebral cortex. II. Continuation of the study of the ammonic system. J. Psychol. Neurol. 46, 113–177.
Lorente de Nó, R. (1947a). Analysis of the distribution of action currents of nerves in volume conductors. Stud. Rockefeller Inst. Med. Res. Repr. 132, 384–477.
Lorente de Nó, R. (1947b). Action potential of the motoneurones of the hypoglossus nucleus. J. Cell Comp. Physiol. 29, 207–288.
Makarov, V. A., Makarova, J., and Herreras, O. (2010). Disentanglement of local field potential sources by independent component analysis. J. Comput. Neurosci. 29, 445–457.
Makarova, J., Gómez-Galán, M., and Herreras, O. (2008). Layer specific changes in tissue resistivity and spatial cancellation of transmembrane currents shape the voltage signal during spreading depression in the CA1 vivo. Eur. J. Neurosci. 27, 444–456.
Makarova, J., Ibarz, J. M., Canals, S., and Herreras, O. (2007). A steady-state model of spreading depression predicts the importance of an unknown conductance in specific dendritic domains. Biophys. J. 92, 4216–4232.
Makarova, J., Makarov, V. A., and Herreras, O. (2010). A model of sustained field potentials based on gradients of polarization in single neurons. J. Neurophysiol. 103, 2446–2457.
Mitzdorf, U. (1985). Current source-density method and application in cat cerebral cortex: investigation of evoked potentials and EEG phenomena. Physiol. Rev. 65, 37–100.
Nicholson, C., and Freeman, J. A. (1975). Theory of current source-density analysis and determination of conductivity tensor for anuran cerebellum. J. Neurophysiol. 38, 356–368.
Nicholson, C., and Llinás, R. (1971). Field potentials in the alligator cerebellum and theory of their relationship to Purkinje cell dendritic spikes. J. Neurophysiol. 34, 509–531.
Nunez, P. L., and Srinivasan, R. (2006). Electric Fields of the Brain: The Neurophysics of EEG. 2. New York: Oxford University Press.
Rall, W., Burke, R. E., Holmes, W. R., Jack, J. J. B., Redman, S. J., and Segev, I. (1992). Matching dendritic neuron models to experimental data. Physiol. Rev. 72, 159–186.
Rall, W., and Shepherd, G. M. (1968). Theoretical reconstruction of field potentials and dendrodendritic synaptic interactions in olfactory bulb. J. Neurophysiol. 31, 884–915.
Ray, S., and Maunsell, J. H. R. (2010). Differences in gamma frequencies across visual cortex restrict their possible use in computation. Neuron 67, 885–896.
Reichinnek, S., Künsting, T., Draguhn, A., and Both, M. (2010). Field potential signature of distinct multicellular activity patterns in the mouse hippocampus. J. Neurosci. 30, 15441–15449.
Stevens, C. F., and Zador, A. M. (1998). Input synchrony and the irregular firing of cortical neurons. Nat. Neurosci. 1, 210–217.
Stuart, G., and Spruston, N. (1998). Determinants of voltage attenuation in neocortical pyramidal neuron dendrites. J. Neurosci. 18, 3501–3510.
Tanskanen, J. M., Mikkonen, J. E., and Penttonen, M. (2005). Independent component analysis of neural populations from multielectrode field potential measurements. J. Neurosci. Methods 145, 213–232.
Trommald, M., Jensen, V., and Andersen, P. (1995). Analysis of dendritic spines in rat CA1 pyramidal cells intracellularly filled with a fluorescent dye. J. Comput. Neurol. 353, 260–274.
Varona, P., Ibarz, J. M., López-Aguado, L., and Herreras, O. (2000). Macroscopic and subcellular factors shaping CA1 population spikes. J. Neurophysiol. 83, 2192–2208.
Appendix
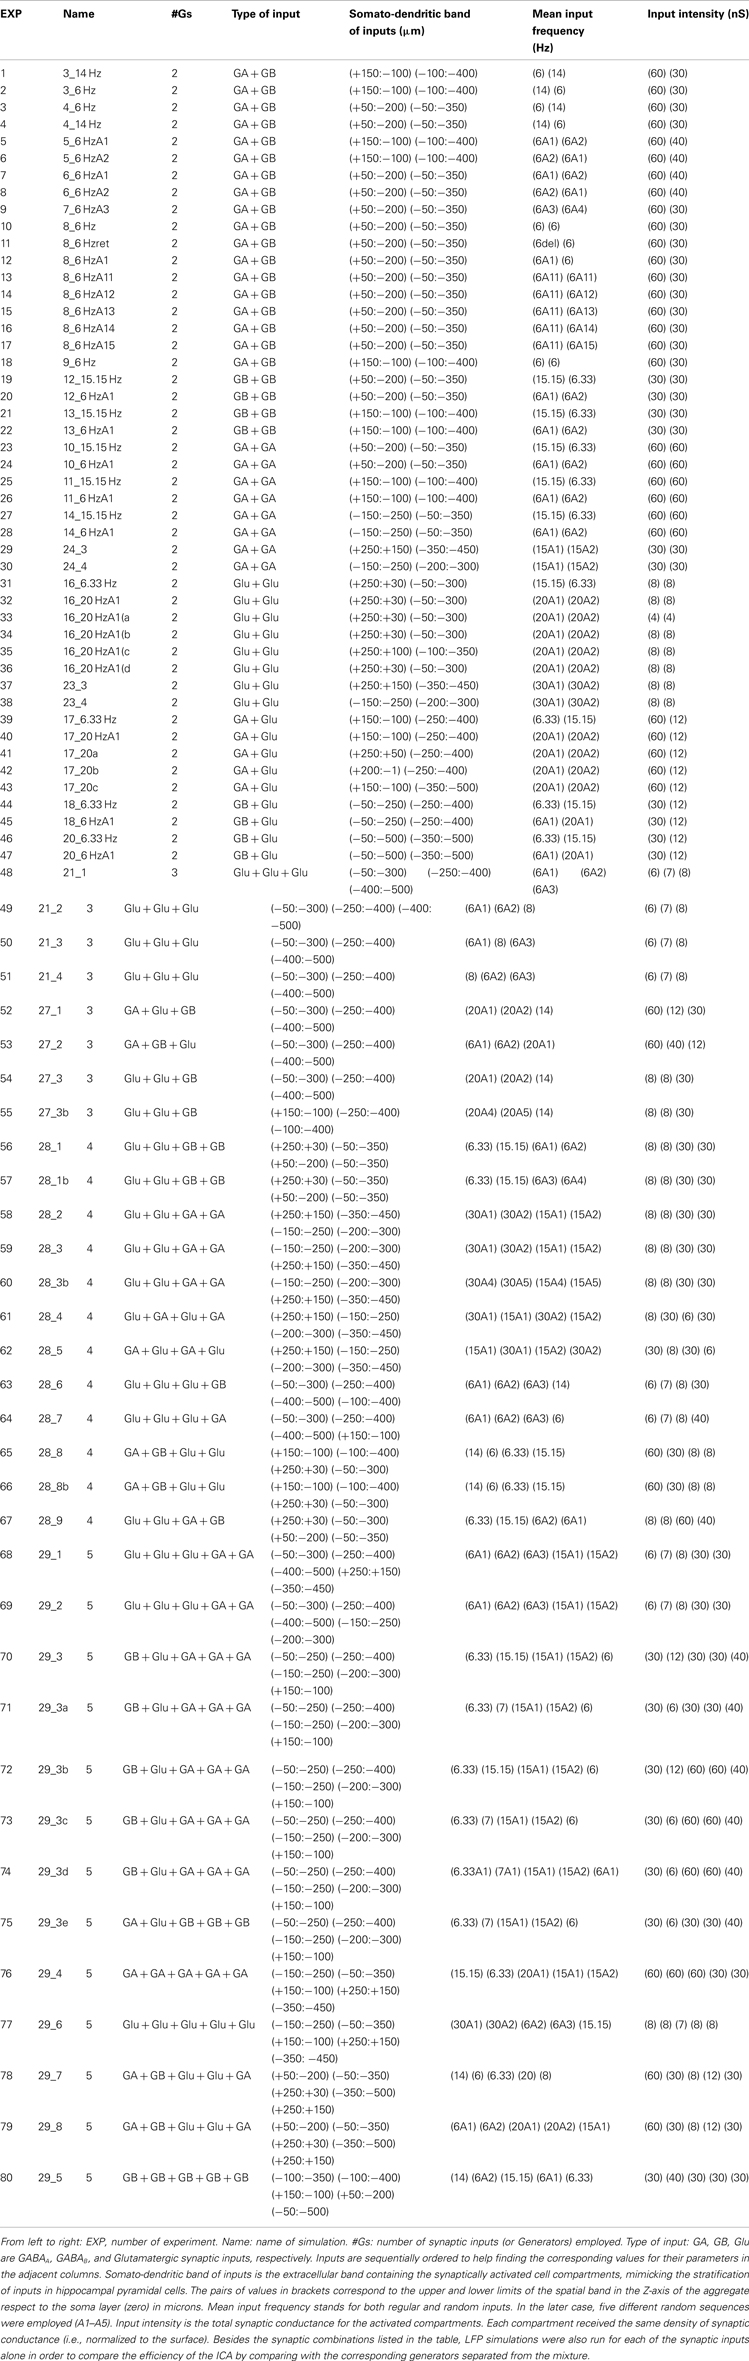
Table A1. Parameters of the synaptic inputs employed in the simulation of LFPs.
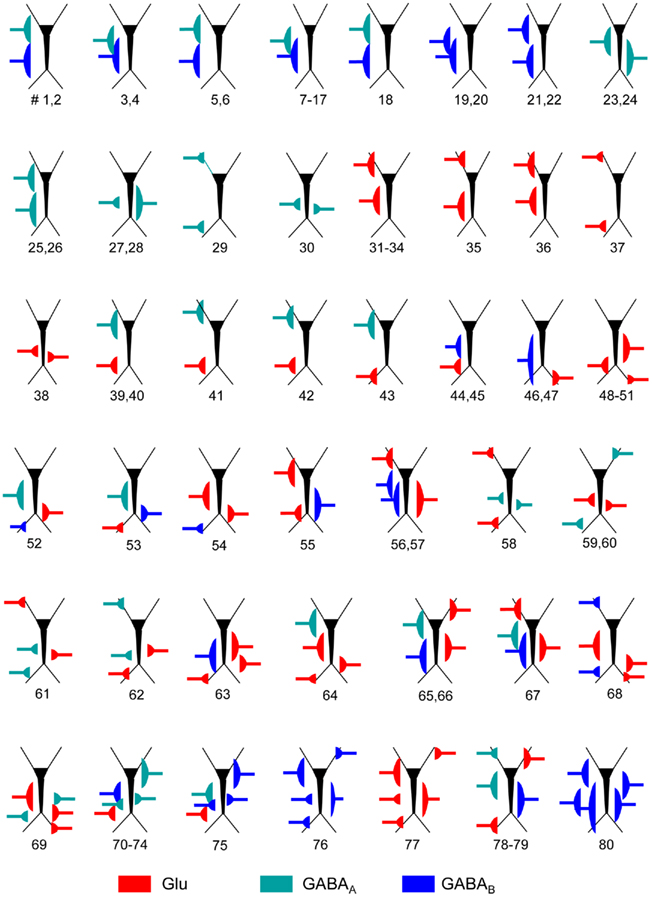
Figure A1. Schemes of the parameters employed for the synaptic input combinations. All cells in the aggregate were synaptically activated over the dendritic compartments contained within a spatial band (see details in Table A1) to mimic the stratification of inputs from different presynaptic populations. The relative position of inputs along the somato-dendritic axis over the dummy neuron is scaled with the prototype CA1 pyramidal model cell. The numbers below indicate the different simulations for the particular synaptic input configuration.
Keywords: computational neuronal model, independent component analysis, local field potentials, neuronal circuits
Citation: Makarova J, Ibarz JM, Makarov VA, Benito N and Herreras O (2011) Parallel readout of pathway-specific inputs to laminated brain structures. Front. Syst. Neurosci. 5:77. doi: 10.3389/fnsys.2011.00077
Received: 14 May 2011;
Accepted: 24 August 2011;
Published online: 13 September 2011.
Edited by:
Raphael Pinaud, University of Oklahoma Health Sciences Center, USAReviewed by:
Stelios M. Smirnakis, Baylor College of Medicine, USAAlain Destexhe, Information and Complexité Centre National de la Recherche Scientifique, France
Martin Both, Heidelberg University, Germany
Copyright: © 2011 Makarova, Ibarz, Makarov, Benito and Herreras. This is an open-access article subject to a non-exclusive license between the authors and Frontiers Media SA, which permits use, distribution and reproduction in other forums, provided the original authors and source are credited and other Frontiers conditions are complied with.
*Correspondence: Oscar Herreras, Instituto Cajal – Consejo Superior de Investigaciones Científicas, Department of Systems Neuroscience, Av. Doctor Arce 37, Madrid 28002, Spain. e-mail: herreras@cajal.csic.es